Embed Size (px)
Citation preview

THIS REPORT WAS PREPARED BY TERENCE KAPPEL, A MASTERS IN FINANCE STUDENT OF THE NOVA SCHOOL OF BUSINESS AND
ECONOMICS, EXCLUSIVELY FOR ACADEMIC PURPOSES. THIS REPORT WAS SUPERVISED BY ROSÁRIO ANDRÉ WHO REVIEWED THE
VALUATION METHODOLOGY AND THE FINANCIAL MODEL. (SEE DISCLOSURES AND DISCLAIMERS AT END OF DOCUMENT)
See more information at WWW.NOVASBE.PT Page 1/32
MASTERS IN FINANCE
EQUITY RESEARCH
Civil aircrafts have 6,600 aircraft orders on backlog
The business cycle for civil aircrafts is turning down
momentarily with few new orders coming in, while 33,000 new
aircrafts are expected to be ordered within the next 20 years
Airbus is cautiously accelerating the enhancement of
production facilities from 659 to 949 aircrafts until 2019
New market entries of Embraer, Bombardier & Co are
receiving fewer orders than expected holding 22% of the market,
with new wide-body competition from a Russian-Chinese JV
maybe coming 2025. The discontinuing of the B747 will give 100%
market share in very large aircrafts to Airbus
Defence & Space is expected to grow with government
budgets while a disinvestment strategy will bring free cash flow to
the company. Helicopter sales are still down as in the previous
year with improvements expected from 2019. However, 50%
revenue from services is holding helicopter revenues stable
Airbus as a Group is showing high growth potentials due to
the overall increasing market in civil aircrafts. The 2017 year-end
Market Cap is forecasted to be 74,400M€ compared to 48,557M€
as of 30/12/2016
Company description
The Airbus Group is the second largest Aerospace Company in the world in regards to aircrafts produced. In addition to obtaining 70% of revenues from Civil Aircrafts, Airbus is also active in Defence & Space (20%) and Helicopter (10%). It is present in all major countries with sales and service points but producing only in France, Germany, Spain, UK, China and the US.
AIRBUS GROUP SE COMPANY REPORT
AEROSPACE & DEFENCE INDUSTRY 6 JANUARY 2017
STUDENT: TERENCE KAPPEL [email protected]
More production – weak competition
With a major backlog into the downturn of the market
Recommendation: BUY
Price Target FY17: 96.28 €
Price (as of 6-Jan-17) 65.14 €
Reuters: AIR.PA, Bloomberg: AIR:FP
52-week range (€) 48.07-64.98
Market Cap (M€) 48,557
Outstanding Shares (m) 772,7
Source: Bloomberg
Source: Bloomberg
(Values in M€) 2015A 2016E 2017F
Net Sales 64,450 65,369 79,832
Net Sales growth 6.16% 1.42% 22.13%
Net Profit 8,851 8,702 12,397
NET CAPEX 3,433 3,772 4,686
P/E 0.76 0.74 0.93
Net Income 2,698 761 2,148
EPS 3.44 0.98 2.78
Debt/Equity ratio 9.9% 7.4% 7.7%
Source: Analyst’s Estimates

AIRBUS GROUP COMPANY REPORT
PAGE 2/32
Table of Contents
Company overview ................................................................................33
CIVIL AIRCRAFTS ..........................................................................33
DEFENCE & SPACE .......................................................................53
HELICOPTERS ...............................................................................53
Management & Governance ..................................................................69
ORGANISATIONAL STRUCTURE .......................................................63
SHAREHOLDERS ...........................................................................83
GROWTH STRATEGY ......................................................................83
RESTRUCTERING PLANS ................................................................93
WTO ......................................................................................... 103
Industry overview ................................................................................ 119
MACROECONOMIC CONTEXT ........................................................ 110
PRODUCT & REGIONAL TRENDS ................................................... 110
COMPARABLE COMPANIES ........................................................... 140
Valuation ............................................................................................... 180
MAIN VALUE DRIVERS FORECAST ................................................. 180
COST OF CAPITAL........................................................................ 200
SUM-OF-PARTS VALUATION .......................................................... 210
Multiple Valuation ................................................................................ 210
Sensitivity Analysis ............................................................................. 210
Annexes ................................................................................................ 230
AIRBUS GROUP COMPANY REPORT
PAGE 3/32
Company overview
The Airbus Group SE consists of three operating business units: Civil Aircrafts,
Defence & Space and Helicopters. Each will be presented individually in the
following paragraphs:
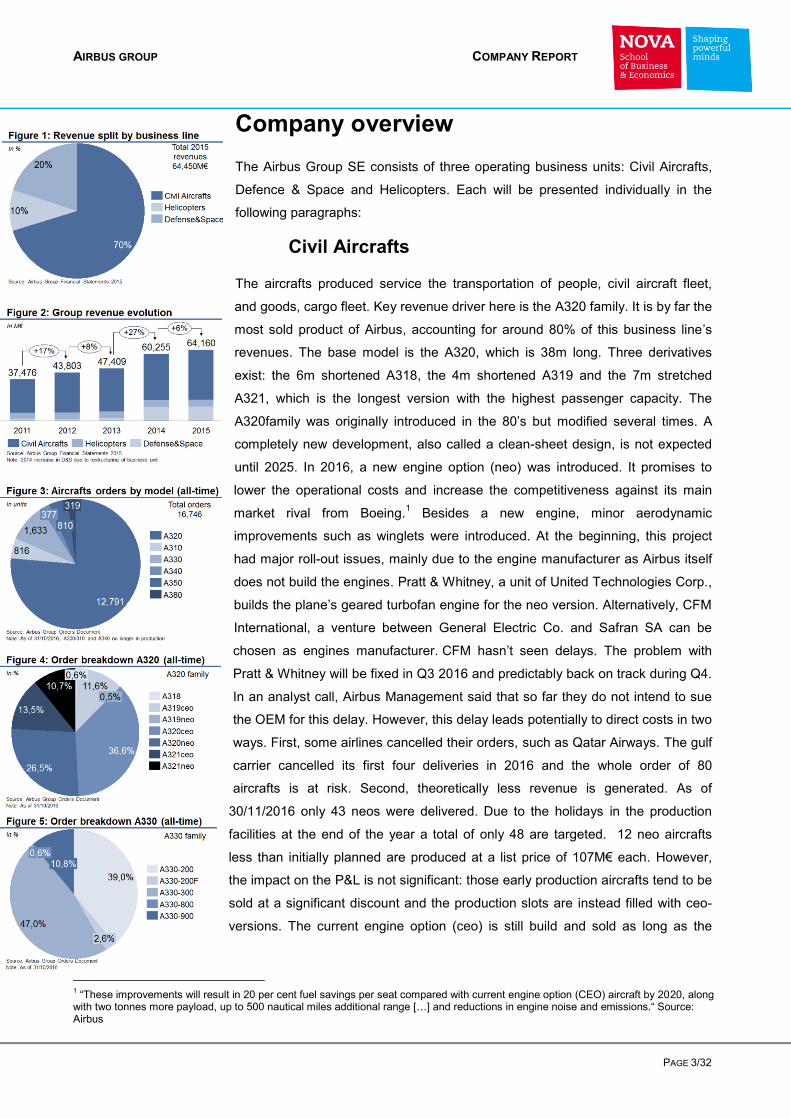
Civil Aircrafts
The aircrafts produced service the transportation of people, civil aircraft fleet,
and goods, cargo fleet. Key revenue driver here is the A320 family. It is by far the
most sold product of Airbus, accounting for around 80% of this business line’s
revenues. The base model is the A320, which is 38m long. Three derivatives
exist: the 6m shortened A318, the 4m shortened A319 and the 7m stretched
A321, which is the longest version with the highest passenger capacity. The
A320family was originally introduced in the 80’s but modified several times. A
completely new development, also called a clean-sheet design, is not expected
until 2025. In 2016, a new engine option (neo) was introduced. It promises to
lower the operational costs and increase the competitiveness against its main
market rival from Boeing.1 Besides a new engine, minor aerodynamic
improvements such as winglets were introduced. At the beginning, this project
had major roll-out issues, mainly due to the engine manufacturer as Airbus itself
does not build the engines. Pratt & Whitney, a unit of United Technologies Corp.,
builds the plane’s geared turbofan engine for the neo version. Alternatively, CFM
International, a venture between General Electric Co. and Safran SA can be
chosen as engines manufacturer. CFM hasn’t seen delays. The problem with
Pratt & Whitney will be fixed in Q3 2016 and predictably back on track during Q4.
In an analyst call, Airbus Management said that so far they do not intend to sue
the OEM for this delay. However, this delay leads potentially to direct costs in two
ways. First, some airlines cancelled their orders, such as Qatar Airways. The gulf
carrier cancelled its first four deliveries in 2016 and the whole order of 80
aircrafts is at risk. Second, theoretically less revenue is generated. As of
30/11/2016 only 43 neos were delivered. Due to the holidays in the production
facilities at the end of the year a total of only 48 are targeted. 12 neo aircrafts
less than initially planned are produced at a list price of 107M€ each. However,
the impact on the P&L is not significant: those early production aircrafts tend to be
sold at a significant discount and the production slots are instead filled with ceo-
versions. The current engine option (ceo) is still build and sold as long as the
1 “These improvements will result in 20 per cent fuel savings per seat compared with current engine option (CEO) aircraft by 2020, along
with two tonnes more payload, up to 500 nautical miles additional range […] and reductions in engine noise and emissions.“ Source: Airbus

AIRBUS GROUP COMPANY REPORT
PAGE 4/32
order books allow. Nevertheless, from 2022 a complete shift of production from
ceo to neo is expected for the purpose of this analysis.
Thousands of orders from clients lead Airbus’ Management to plan a continuous
ramp-up of production until 2019. Besides expanding existing production lines,
new plants recently opened in the US and China in order to be closer to the
customers and the high-growth markets of the future. For more details on the
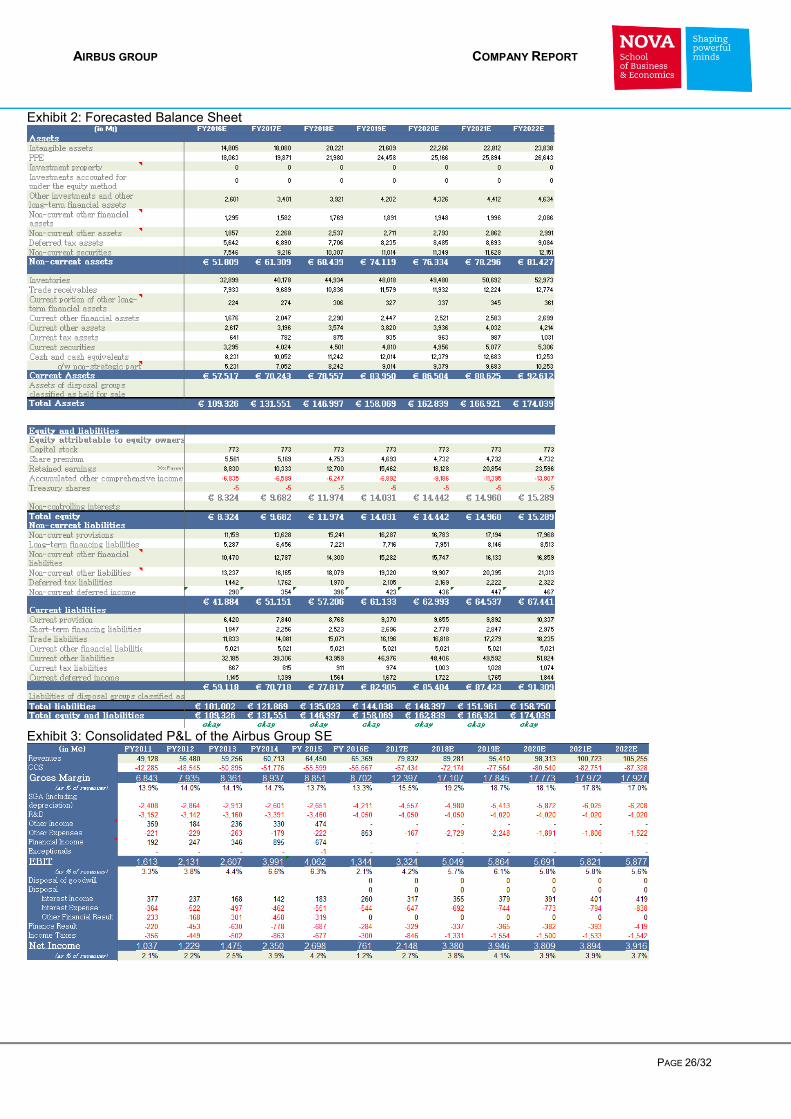
historical and forecasted balance sheet development see Annex 1 and 2. On the
other side of the Atlantic in the USA, main competitor Boeing offers its B737 in
this class. A new version called “MAX” is currently developed. Airbus claims to
have 14% less fuel consumption per seat (A321neo vs. 737MAX9), a 7’’ wider
cabin, a 1’’ wider seat and more total seating capacities.
Second value driver is the A330 which was introduced in 1994. In contrast to the
A320, this version offers more seats on a longer range. Offering two aisles
classifies it as “wide body”. As with the A320, the A330 is currently updated to
A330neo versions called -800 and -900. At the end of 2016, it is expected to be
assembled in the final production line (FAL) with extensive flight tests following.
At the end of 2017, first deliveries are expected to carriers such as TAP. This
aircraft competes with the new B787 Dreamliner from Boeing.
The latest model is the A350. Throughout 2016 & 2017 the ramp-up of
production is underway. However, it progresses slower than expected with only
48 models delivered in 2016. A target of 80 deliveries for 2017 was announced.
The slightly bigger derivative A350-1000 is currently tested and will be delivered
from 2017. It is Airbus’ answer to Boeing’s dominant B777 which is also going to
be renewed in the years to come.
The biggest aircraft sold is the A380, which holds up to 853 passengers. It was
introduced ten years ago and just hit the break-even point in 2015 due to
enormous development costs and a competiveness pricing. Nevertheless, sales
are slowing down and production will be decreased to 12 A380s per year by
2018. Those clients nowadays favour more fuel-efficient twin-engine planes.
However, congested major hub-airports such as Heathrow or Tokyo and
expected air traffic growth of 100% within the next 20 years might support sales
of this aircraft in the long-term on specific high traffic routes. Airbus is also
pitching ideas about new plane layouts with an increased seat density to
costumers. It is in competition with Boeing’s iconic B747 which will go out of
production in the near future.
The civil aircraft business line accounts for 70% of the Airbus Group revenues.
Those are realized when a plane is handed over to costumers including a risk
transfer. Therefore, production rates primarily determine revenues. Besides

AIRBUS GROUP COMPANY REPORT
PAGE 5/32
airlines, also high net worth individuals and governments can order plans. As the
numbers of ordered aircraft are by far lower for those VIPs and the mentioned
cargo planes, demand will be assumed to be stable in the production forecast.
Airbus intends to produce 650 aircrafts in 2016. As a result, a forecast of
production rates and corresponding pricing will be the focus of the value analysis.
The market is highly cyclical with signs of a weakening at the moment due to low
fuel prices and previous years of record sales. However, Airbus still has a
backlog for eight full years of production. Besides main rival Boeing, Airbus faces
currently new competition from Bombardier and Embraer and in the near future
from the Russian company UAC and the Chinese state-owned company
COMAC.
Defence & Space
The second line of business is Defence & Space with a 20% contribution to the
group revenues. “Airbus Defence and Space is well placed to play a leading role
in the markets for future unmanned aerial systems (UAS), as well as combat,
transport and intelligence, surveillance and reconnaissance aircraft (ISR). Some
of the products armed forces can rely on are the swing-role combat aircraft
Eurofighter Typhoon, the multi-role military airlifter A400M and the tanker aircraft
A330 MRTT.”2 The former is a plane build for refuelling fighter planes in flight. As
of year-end 2016, 28 of those are in service with a number of militaries, first and
foremost the Australian Air force and European militaries. It is currently updated
with high R&D expenditures to achieve a higher thrust in flight and with the
military equipment. The A400M also offers a feature to refuel other planes.
However, it is mostly used to transport equipment and military personnel. This
aircraft is still struggling from quality issues. Some cracks in the fuselage were
discovered in 2015 and billions of provision accounted. Meanwhile, additional
capabilities are added to the plane. Light military planes such as the C295 are
also offered. In the Space business, Airbus is providing space rocket services, in
joint venture with other companies. Boeing is already producing a great variety of
products in this sector and is more established than Airbus. Moreover, UAC,
Embraer, BAE, Raytheon, Leonardo-Finmeccanica, Lockheed, Oboronprom and
Northrop play in this market.
Helicopters
Airbus is the biggest producer of helicopters and worldwide market leader here.
Three major market competitors can be identified: Bell Helicopters, Augusta
Westland and Sikorsky Helicopters. The last two are incorporated within other
2 Source: Airbus
AIRBUS GROUP COMPANY REPORT
PAGE 6/32
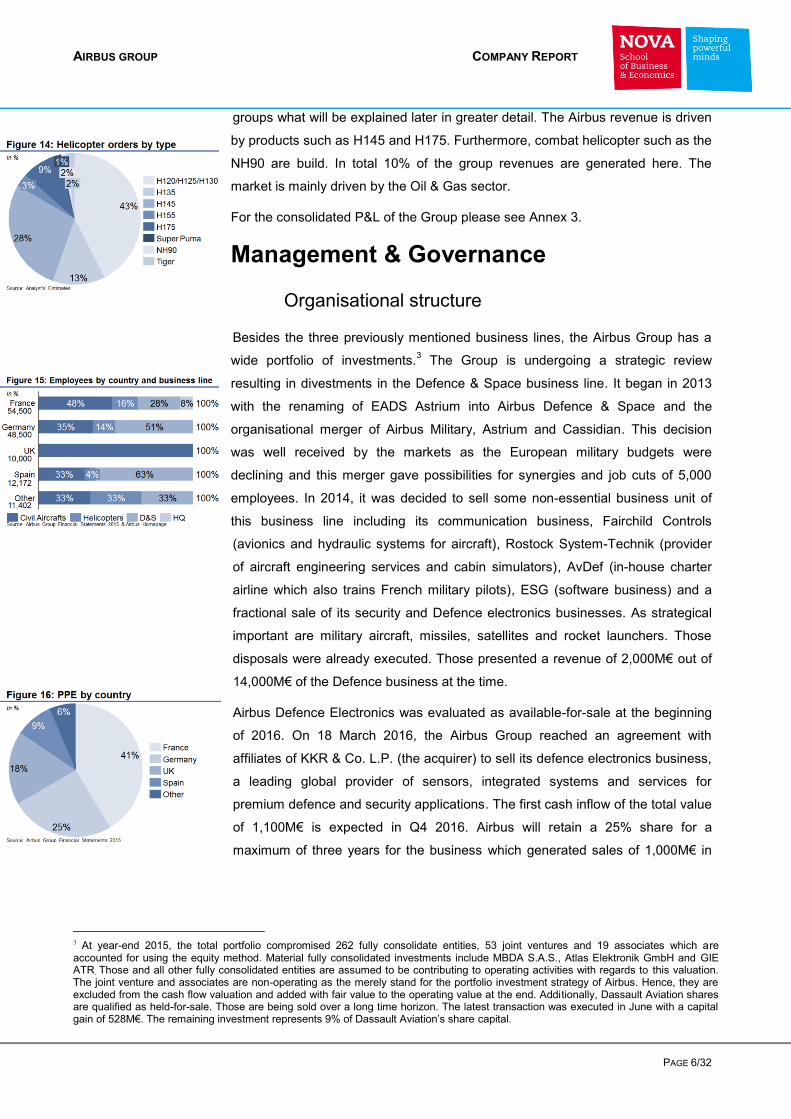
groups what will be explained later in greater detail. The Airbus revenue is driven
by products such as H145 and H175. Furthermore, combat helicopter such as the
NH90 are build. In total 10% of the group revenues are generated here. The
market is mainly driven by the Oil & Gas sector.
For the consolidated P&L of the Group please see Annex 3.
Management & Governance
Organisational structure
Besides the three previously mentioned business lines, the Airbus Group has a
wide portfolio of investments.3 The Group is undergoing a strategic review
resulting in divestments in the Defence & Space business line. It began in 2013
with the renaming of EADS Astrium into Airbus Defence & Space and the
organisational merger of Airbus Military, Astrium and Cassidian. This decision
was well received by the markets as the European military budgets were
declining and this merger gave possibilities for synergies and job cuts of 5,000
employees. In 2014, it was decided to sell some non-essential business unit of
this business line including its communication business, Fairchild Controls
(avionics and hydraulic systems for aircraft), Rostock System-Technik (provider
of aircraft engineering services and cabin simulators), AvDef (in-house charter
airline which also trains French military pilots), ESG (software business) and a
fractional sale of its security and Defence electronics businesses. As strategical
important are military aircraft, missiles, satellites and rocket launchers. Those
disposals were already executed. Those presented a revenue of 2,000M€ out of
14,000M€ of the Defence business at the time.
Airbus Defence Electronics was evaluated as available-for-sale at the beginning
of 2016. On 18 March 2016, the Airbus Group reached an agreement with
affiliates of KKR & Co. L.P. (the acquirer) to sell its defence electronics business,
a leading global provider of sensors, integrated systems and services for
premium defence and security applications. The first cash inflow of the total value
of 1,100M€ is expected in Q4 2016. Airbus will retain a 25% share for a
maximum of three years for the business which generated sales of 1,000M€ in
3 At year-end 2015, the total portfolio compromised 262 fully consolidate entities, 53 joint ventures and 19 associates which are accounted for using the equity method. Material fully consolidated investments include MBDA S.A.S., Atlas Elektronik GmbH and GIE ATR. Those and all other fully consolidated entities are assumed to be contributing to operating activities with regards to this valuation. The joint venture and associates are non-operating as the merely stand for the portfolio investment strategy of Airbus. Hence, they are excluded from the cash flow valuation and added with fair value to the operating value at the end. Additionally, Dassault Aviation shares are qualified as held-for-sale. Those are being sold over a long time horizon. The latest transaction was executed in June with a capital gain of 528M€. The remaining investment represents 9% of Dassault Aviation’s share capital.

AIRBUS GROUP COMPANY REPORT
PAGE 7/32
2015. Reason being, the critics of the German Defence Ministry who is the
single biggest client. This sale will terminate the current refocusing of the
Defence & Space unit.
Airbus is a truly European project due to its history. It began in the 70’s as
reaction to the dominance of US manufacturers. No national supplier in Europe
was able to face them with a competitive aircraft product. Therefore, Germany,
France and the UK decided to form the “Airbus Industrie” partnership and build its
first jointly developed jetliner, the A300. Spain joined the consortium in 1971 with
a 4.2% share. The United Kingdom later dropped its strategic involvement but
remained important as supplier for wings, as it is still today. Currently, the Airbus
Group is headed by Germany and France. Additional factory sides are installed in
the UK and Spain. As for the UK, no significant impact is expected regarding the
Brexit decision. The details are expected to be an open issue until 2018.
Nevertheless, the Management team confirmed that the wing manufacturing in
the UK plant is extremely competitive regarding costs and quality. The normal
level of investments in order to replace depreciated assets will be maintained and
no closure of the plant is considered.
The Group Management team consist of Tom Enders (CEO Airbus Group),
Harald Wilhelm (CFO Airbus Group), Marwan Lahoud (Chief Strategy &
Marketing Officer Airbus Group), Fabrice Brégier (COO Airbus Group and
President Airbus), Guillaume Faury (President Airbus Helicopters) and Dirk Hoke
(President Airbus Defence & Space). The relation between Tom Enders, from
Germany, and Fabrice Brégier, from France, is reportedly frosty as the recent
restructuring programme (see below) sparked tension. For the company it is
important that everything is in balance: beginning at the top with a board of
directs which has to be adequately mixed by nationalities, down to the burdens of
restructuring programmes where job cuts are expected to be shared fairly among
member states. Potentially, a non-unified management team could pose a
danger to the company’s well-being when fast decisions have to be taken for or
against a new airplane design, where to invest in the future or what production
output the final assembly lines in the world should produce. Looking into the past
it becomes clear that Governance became more and more transparent. Airbus is
much more a “normal” company than it was decades ago. If this trend is to be
continued than it will become a company which follows entirely the market and
where no national stakeholders decide or vote on strategic important decisions in
their favours anymore. This will be discussed in detail in the next paragraph.

AIRBUS GROUP COMPANY REPORT
PAGE 8/32
Shareholders
As of 30.09.2016 two main classes of shareholders can be identified: On the one
hand, free floating shares with institutional and retail investors hold 73.6% of the
equity. On the other hand, shareholder agreements with SOGEPA (a French
holding company owned completely by the government of France), GZBV
(German government holding vehicle) and SEPI (Spanish state holding
company) account for 26.4% of the equity.
The involvement of Germany and France used to be quite significant. Besides
the financial interest also domestic jobs are at risk with every decision taken at
the management level so the governments paid close attention. However, that
status had to change in order for Airbus to be a flexible market participant:
“France is cutting its ownership of Airbus as part of an agreement to reduce the
direct influence of the French, German, and Spanish governments over the
company. Reached in the wake of a failed merger with defence contractor BAE
Systems Plc, the December 2012 shareholder accord is a step toward Airbus
becoming a “normal” firm guided by market forces.”4 Let alone in 2014 the
government sold 451M€ of its stake to institutional investors. After all, any
shareholder is prohibited from holding more than 15% of the share capital with
the target for France and Germany of 12% and for Spain of 4%. All countries
together cannot hold more than 30% of shares. Today, the holding companies of
the countries are no longer allowed to influence the daily operations of the
company or to designate Members of the Board of Directors or management
team. They can, however, propose new members of the board of directors at the
Annual General Meeting as long as there is a balance among the nationalities of
France, German and Spain in respect of the location of production facilities. The
board of directors votes the CEO who proposes the members of the Executive
Committee who are thereafter approved by the Board of Directors. A rule
specifies that 2/3 of the Executives have to be EU nationals including the CEO
and CFO.5 Other institutional investors can be seen in the graphic. 772,714,000
shares are issued as of end of 2016.
Growth strategy
Revenue generation in civil aircrafts is mainly determined by production output. In
order to grow revenues the increase of yearly deliveries is targeted from two
different angles. First, production line capacities in existing factories are
increased to take advantage of the full order books which would be enough for
eight years of production. Second, international presence is increased. Civil
4 Source: Bloomberg 5 Source: Airbus Report of the Board of Directors, issued as of 26 February 2015

AIRBUS GROUP COMPANY REPORT
PAGE 9/32
aircrafts already installed two FALs outside of Europe, one in the USA and one in
China. The underlining strategies are very different: being closer to the growing
demand for single aisle planes in Asia on the one hand. On the other hand,
Airbus wants to support local jobs in the US to convince American customers of
the political will to invest in the country and get more sales in return. Politics are
the main reason for or against an aerospace product.
Defence & Space is specifically targeting the US in order to win US Military
Defence contracts. That country accounts for the highest military spending
worldwide. However, this strategy is highly complicated. Several political issues
rose from US procurement officers giving contracts to non-US companies. The
situation could be worsened for Airbus if the newly president-elect puts “America
first”, meaning excluding all other contractors. However, Airbus Defence & Space
is as of now the prime contractor for the Coast Guard’s procurement of 18 HC-
144A Ocean Sentry maritime patrol aircraft and some other prestigious projects
within the American military.
Restructering plans
On 30.09.2016 Airbus publically announced the merger of the Group structure
with its Commercial Aircraft entity to form a new company structure. The purpose
is to cut costs and to prepare the leaner structure for the digital transformation.
Processes that are similar but performed from different teams, such as Technical
Research, Strategy, Legal, HR and IT, will be merged and headcounts reduced,
thereby eliminating redundancies. It is estimated that around 1164 jobs6 will be
lost (of which 429 in Germany, 640 in France, 39 in Spain and 54 in UK). The
new entity will be led by CEO Tom Enders. Fabrice Brégier will become Chief
Operating Officer (COO) and maintain his Presidency of Airbus Commercial
Aircraft. Details of the merger and its impacts are now subject to discussions with
the social partners on Group, national and divisional level. The risk exists that
unions will try to block this decision with defensive measure, such as strikes.
The merger provides the opportunity to introduce a single Airbus brand for the
Group and all its entities, effective January 2017. By this analyst´s estimates,
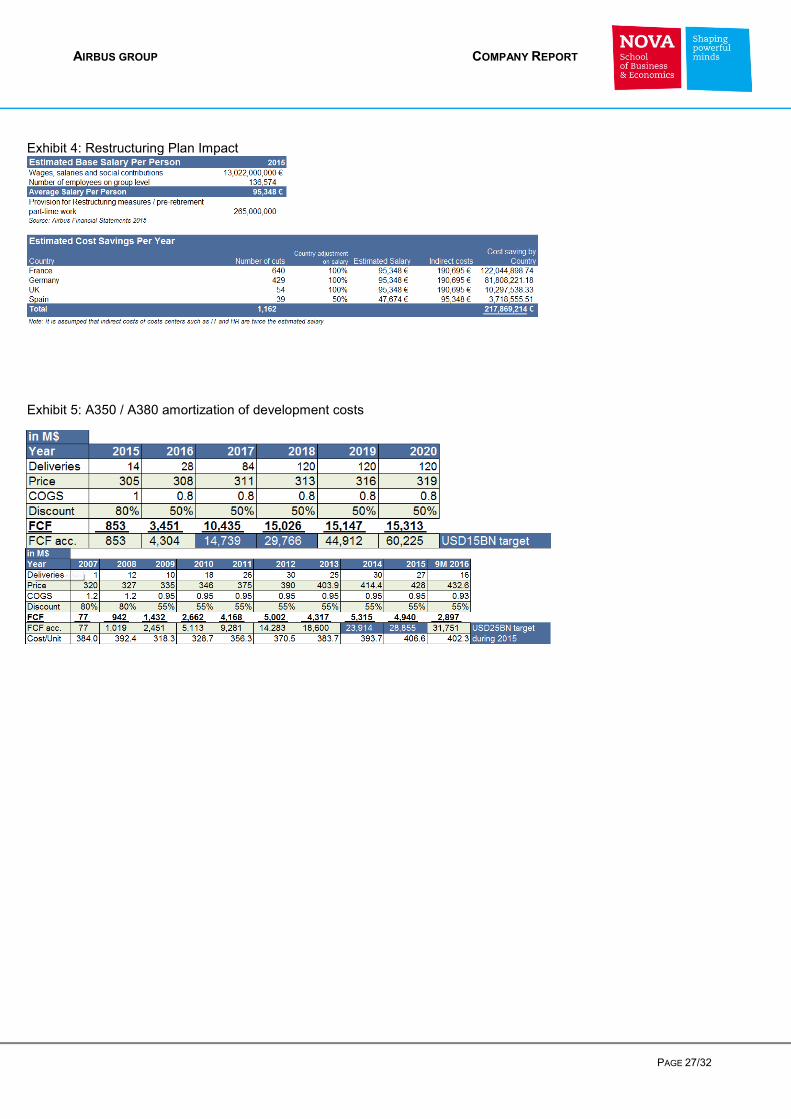
which can be seen in Annex 4, cost saving of roughly 220M€ on a yearly basis
could be achieved if all jobs were to be cut and not shifted. This includes a
country salary adjustment and indirect costs such as IT and HR savings.
The restructuring was already discussed at the Financial Times on the
18/09/2016. The share price reacted with a slight increase. The decision was
unexpected by the markets but not received as a great improvement. Compared
6 Source: Handelsblatt
AIRBUS GROUP COMPANY REPORT
PAGE 10/32
to the last restructuring with a reduction of 8,000 jobs this announcement seems
to be insignificant. Also compared to rival Boeing, which cut 6,115 jobs in 2016
and plans further job reductions in 2017.
WTO
For the last 12 years, Boeing and Airbus are suing each other for unfairly
received government subsidies. Boeing is in those cases supported by the US
government and Airbus by EU representatives. According to the WTO, Boeing
started in 2004 with accusing Airbus of being subsidized by the EU. 2010 was the
WTO panel report circulated for the first time and directly appellate by Airbus in
2011.
The schema works as follows: Airbus is getting billions of Euros in low-interest
loans for new aircraft developments (“launch aid”). If the commercialisation of this
aircraft program is successful, Airbus has to pay back the loan. “In 2010, the
WTO ruled those loans illegal because the European governments gave Airbus
the money on highly favourable, non-commercial terms.”7
On 22th of September 2016, the WTO ruled in favour of Boeing in recognizing
that the EU did not unwind that illegal assistance within the given time frame.8
However, the EU is most likely to appeal this verdict again. Other Boeing
allegations of an unfairly supported A350 and A380 development were rejected
by the WTO. Eventually, the issue could be potentially settled by a compromise
between the two companies but this is rather unlikely. At the same time Boeing is
facing a 9BN$ tax break investigation over the 777X programme by the WTO,
which is to be determined in 2017.
No such results are directly impacting this valuation as the WTO cannot directly
impose fines on companies. A verdict might impose additional taxes on EU
goods imported to the US if the US should file for this measure with the WTO.9
“[…] whatever Boeing will say, nobody will have to go to the bank. There have
never been any repayments and there never will be, it is not in the spirit of
WTO."10
7 Source: Seattletimes
8 Source: WTO
9 Source: Financial Times
10 Source: Telegraph
AIRBUS GROUP COMPANY REPORT
PAGE 11/32
Industry overview
Macroeconomic context
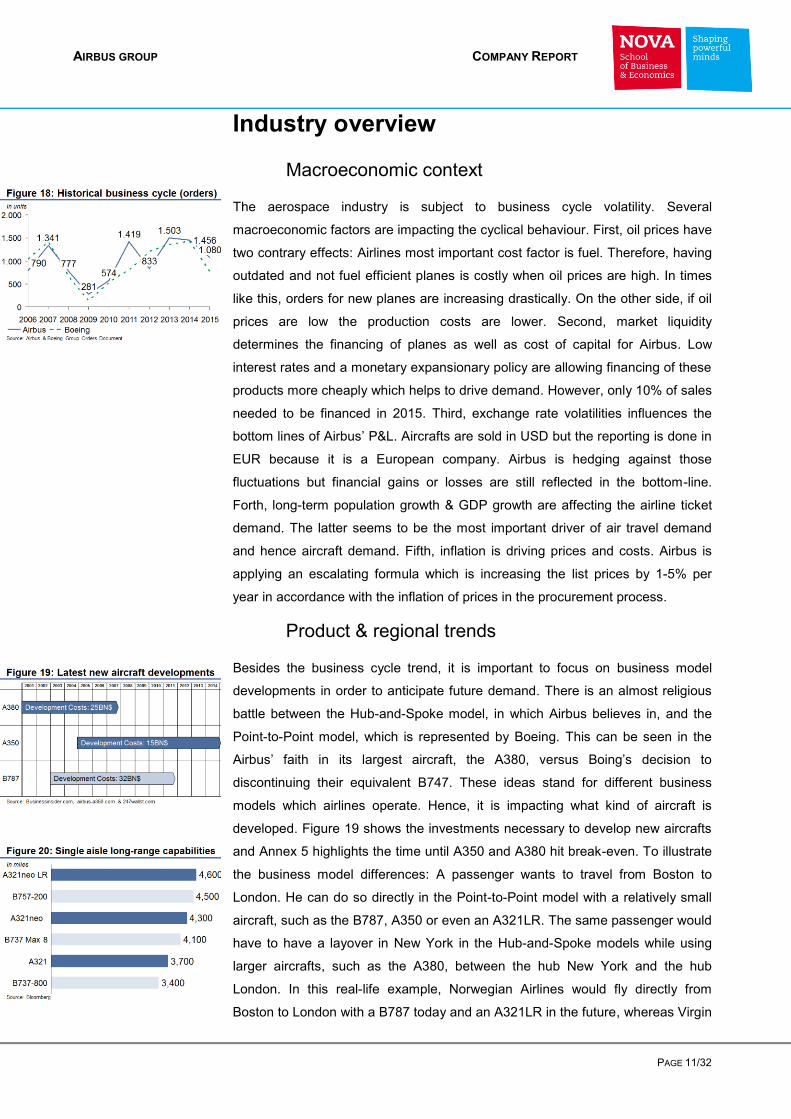
The aerospace industry is subject to business cycle volatility. Several
macroeconomic factors are impacting the cyclical behaviour. First, oil prices have
two contrary effects: Airlines most important cost factor is fuel. Therefore, having
outdated and not fuel efficient planes is costly when oil prices are high. In times
like this, orders for new planes are increasing drastically. On the other side, if oil
prices are low the production costs are lower. Second, market liquidity
determines the financing of planes as well as cost of capital for Airbus. Low
interest rates and a monetary expansionary policy are allowing financing of these
products more cheaply which helps to drive demand. However, only 10% of sales
needed to be financed in 2015. Third, exchange rate volatilities influences the
bottom lines of Airbus’ P&L. Aircrafts are sold in USD but the reporting is done in
EUR because it is a European company. Airbus is hedging against those
fluctuations but financial gains or losses are still reflected in the bottom-line.
Forth, long-term population growth & GDP growth are affecting the airline ticket
demand. The latter seems to be the most important driver of air travel demand
and hence aircraft demand. Fifth, inflation is driving prices and costs. Airbus is
applying an escalating formula which is increasing the list prices by 1-5% per
year in accordance with the inflation of prices in the procurement process.
Product & regional trends
Besides the business cycle trend, it is important to focus on business model
developments in order to anticipate future demand. There is an almost religious
battle between the Hub-and-Spoke model, in which Airbus believes in, and the
Point-to-Point model, which is represented by Boeing. This can be seen in the
Airbus’ faith in its largest aircraft, the A380, versus Boing’s decision to
discontinuing their equivalent B747. These ideas stand for different business
models which airlines operate. Hence, it is impacting what kind of aircraft is
developed. Figure 19 shows the investments necessary to develop new aircrafts
and Annex 5 highlights the time until A350 and A380 hit break-even. To illustrate
the business model differences: A passenger wants to travel from Boston to
London. He can do so directly in the Point-to-Point model with a relatively small
aircraft, such as the B787, A350 or even an A321LR. The same passenger would
have to have a layover in New York in the Hub-and-Spoke models while using
larger aircrafts, such as the A380, between the hub New York and the hub
London. In this real-life example, Norwegian Airlines would fly directly from
Boston to London with a B787 today and an A321LR in the future, whereas Virgin
AIRBUS GROUP COMPANY REPORT
PAGE 12/32
Atlantic flies with a single aisle to New York and then with an A340 to London.
This technique is more commonly used in dependence of distance: Emirates
being an example of the Hub-and-Spoke for long-range flights and Ryanair
standing for the Point-to-point model on short-haul flights. The former has the
advantage that new routes can be added easily, it ensures a full capacity and
customers usually feel more comfortable on larger aircrafts. Drawbacks include
the necessity to take two trips for the customer, the hub is a potential bottleneck
in peak hours and route scheduling is more complicated. The current slowdown
of sales for the A380 seems to give right to Boeing’s Point-to-Point model.
However, due to several aerodynamic improvements of single-aisle twin-engine
aircrafts, Airbus develops the A321neo LR for Trans-Atlantic flights from 2019.
Therefore, opening new business models for the airlines. First orders came from
TAP, Norwegian and JetBlue. Boeing has no equivalent aircraft in production.
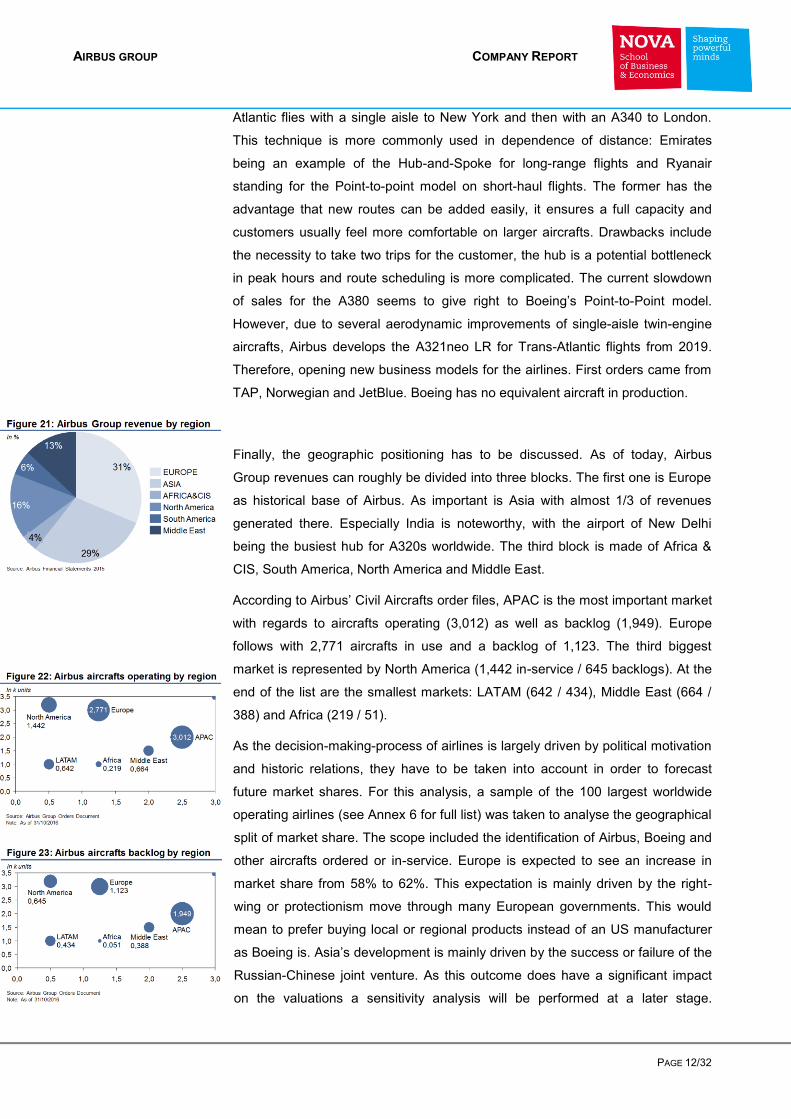
Finally, the geographic positioning has to be discussed. As of today, Airbus
Group revenues can roughly be divided into three blocks. The first one is Europe
as historical base of Airbus. As important is Asia with almost 1/3 of revenues
generated there. Especially India is noteworthy, with the airport of New Delhi
being the busiest hub for A320s worldwide. The third block is made of Africa &
CIS, South America, North America and Middle East.
According to Airbus’ Civil Aircrafts order files, APAC is the most important market
with regards to aircrafts operating (3,012) as well as backlog (1,949). Europe
follows with 2,771 aircrafts in use and a backlog of 1,123. The third biggest
market is represented by North America (1,442 in-service / 645 backlogs). At the
end of the list are the smallest markets: LATAM (642 / 434), Middle East (664 /
388) and Africa (219 / 51).
As the decision-making-process of airlines is largely driven by political motivation
and historic relations, they have to be taken into account in order to forecast
future market shares. For this analysis, a sample of the 100 largest worldwide
operating airlines (see Annex 6 for full list) was taken to analyse the geographical
split of market share. The scope included the identification of Airbus, Boeing and
other aircrafts ordered or in-service. Europe is expected to see an increase in
market share from 58% to 62%. This expectation is mainly driven by the right-
wing or protectionism move through many European governments. This would
mean to prefer buying local or regional products instead of an US manufacturer
as Boeing is. Asia’s development is mainly driven by the success or failure of the
Russian-Chinese joint venture. As this outcome does have a significant impact
on the valuations a sensitivity analysis will be performed at a later stage.

AIRBUS GROUP COMPANY REPORT
PAGE 13/32
Currently Airbus Civil Aircrafts is holding a 49% share of the Asian companies in
the Top100 airlines sample taken for this analysis. However, even within Asia
differences in the market positioning of Airbus versus Boeing can be seen: Japan
traditionally has had a strong relation to Boeing with flagship carriers such as
ANA primarily using Boeing’s 787. India is mainly Airbus orientated as many
other smaller Southeast Asia countries. China is quite balanced. Africa is still an
underdeveloped, small-size market and mostly covered by Boeing. Nevertheless,
Airbus is gaining here with one of the most sophisticated airlines, Ethiopian
Airways, flying the new A350-900. In line with population and GDP growth, the
market is expected to grow and Airbus gaining 7% additional market share to
come to a total of 38%. North America is an important player in the worldwide
market. The US and Canada have a well-developed network of international and
regional carriers. The operation of Airbus’ local final assembly line will support
the development and growth from 25% to 47% market share. South America’s
larger countries Brazil and Venezuela are currently struggling economically.
However, as emerging markets with a growing middle class and population it can
be expected that those markets will eventually recover in the near future. Airbus
shows more new orders than in-service aircrafts at the moment, leading to an
increase in market share from 29% as of mid-2016 (based on in-service aircraft)
to 44% market share (based on the orders market share) from. 53% of the
market in Middle East belongs to Airbus. Two current developments are giving
the reasoning for the projection of the share falling to 41%. First, delays in the
delivery of current new airplanes were received by a lot of anger in the market,
especially by Qatar Airways. They rejected the acceptance of four A320neos in
2016. Moreover, Emirates as flagship customer of the A380 has made some
request to modify this aircraft and equip it with a new engine option. Airbus’
Management is not keen on this idea and so it can be reasonably expected that
the relation might suffer. The CIS region is currently showing a small backlog. On
a negative note for Airbus, more and more operators are ordering Boeing
products. Their primarily use of Airbus was a historic relic, started during the cold
war. As the relationship between the US and Russia is improving, especially with
the new president-elect Trump, the Airbus market share is expected to drop from
76% to 32%. In addition, the new Russian-Chinese joint venture might have an
impact here that is why a sensitivity analysis is performed at a later stage.
The defence market is mostly driven by government defence budgets. During the
last years a decrease in government spending was observed. In 2014, the total
worldwide market was worth 1,602BN$. However, due to the new President in
the USA, which is the largest military market in the world, a slight increase of
military budgets should be expected over the coming years. By 2022, a total

AIRBUS GROUP COMPANY REPORT
PAGE 14/32
worldwide market size of 2,015BN€ is expected. As this change is mainly due to
the US, Airbus is not profiting fully as can be seen in the main value driver
forecast section of this report. New US military contracts will most likely go to US
companies such as Boeing. However, higher investments in the military of one
country usually lead to a counter reaction by other countries which might feel
threaten by the US. Also, Trump already announced that the US will spend less
on NATO operations. These contributions of military equipment and soldiers have
to come from EU member states most likely. Therefore, a revenue increase in
Airbus Defence and Space from 12,728M€ in 2014 to 13,900M€ by 2022 is
expected.
The helicopter market growth is mainly driven by one factor: the health of the oil
& gas sector. Those companies are Helicopter’s main client as they need those
machines for getting staff to and from oil platforms. Due to a recent drop in oil
prices the health of the industry is suffering. Hence, a lot of overcapacity can be
found in the market. Since 50% of the revenues are made in Services, such as
repair and maintenance contracts, Airbus is not suffering to the full extend. Even
if the market is in a downturn, it is important to maintain the in-service aircrafts
properly. Experts forecast an increasing demand in 2 years’ time, well in line with
the expected price increase of oil. Therefore, the current production output from
429 units is expected to increase by 2019 to 488 units and up to 575 units by
2022.
Comparable companies
The Aerospace Industry is a highly competitive market. Entry barriers are
extremely high while political considerations drive sales. One failed development
of an aircraft can take the company to bankruptcy. It takes 5-10 years to design
and develop a new airliner for 5-10BN$. Afterwards, the ramp-up of production is
a heavy and cost-intensive task. That is why only a handful of companies are
trying to enter this market, and far less are successful.
Airbus and Boeing present one of the best-know duopolies in the world. Both
offer a wide-range of airplanes, from 100 up to 853 seats. A comparison of those
is presented in Annex 7-10. In recent years, Airbus overtook Boeing regarding the
numbers of new orders, while Boeing stills holds the majority of aircrafts being
operated and produced at the moment. Generally, Airbus is preferred over
Boeing for single-aisle aircrafts (A320) and ultra-large-aircrafts (A380). However,
Boeing is preferred for wide-body jets (such as 787 and 777). Comparing those
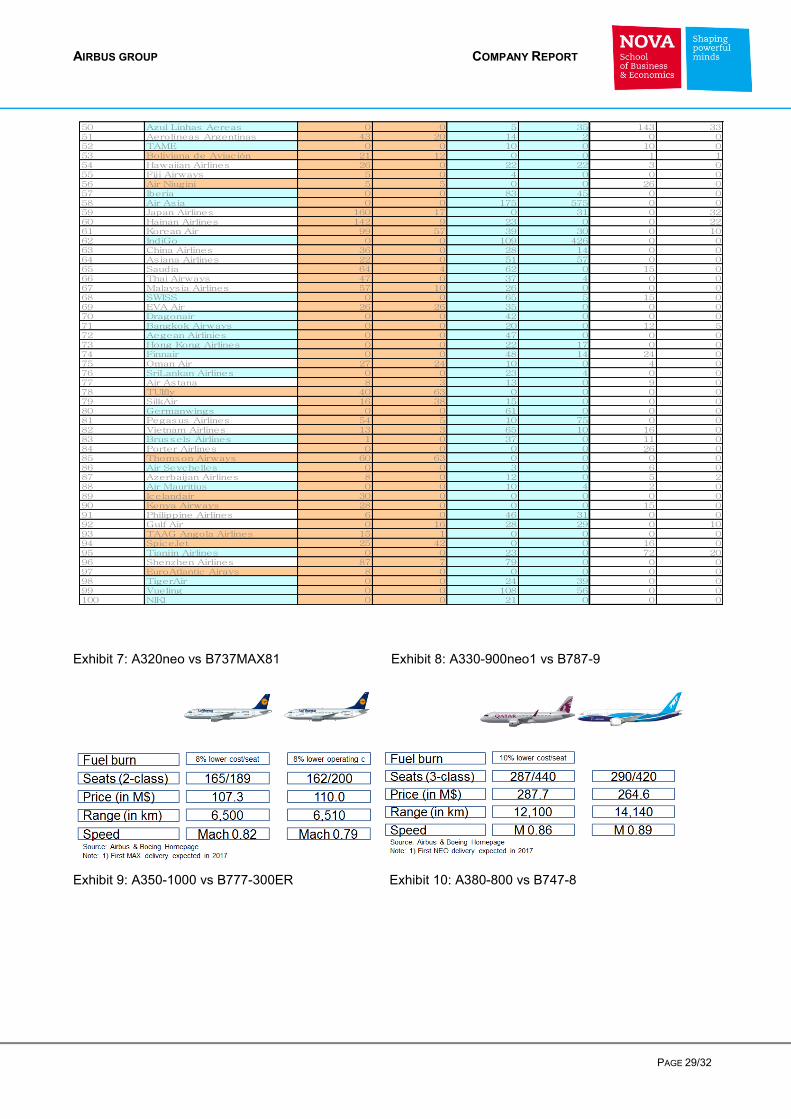
categories in detail shows the following: the A320neo has 8% lower fuel costs per
seat than the 737Max8 which will be delivered from 2017. The range is similar
with the Airbus traveling at Mach .82 compared to Mach .79. Boeings model

AIRBUS GROUP COMPANY REPORT
PAGE 15/32
offers a wider range of seating possibilities (162-200 compared to Airbus’ 165-
189). The A320 is about 3M$ less expensive at a list price of 107.3M$ leading to
a far higher backlog than the B737 achieved. See Annex 11 for the forecasted
product prices. Range is usually an advantage of Boeing which is reflected in the
comparison of A330-900(neo) and B787-9. Both offer similar seating
arrangements (Boeing 290-420, Airbus 287-440). On the one hand, Airbus allows
for a 10% cost saving in fuel costs per seat but the B787 reaches 2,000km
further with a total range of 14,140km. Despite the fact that the B787 occurred
higher development costs, it is 23M$ cheaper with a list price of 264.6M$. The
next price category is opened with the A350-1000 and the B777-300ER with
355.7M$ and 339.6M$ respectively. The latter is by far more popular with airlines
and will be replaced by the 777-8/9 in 2020. The A350-1000 is currently in the
FAL with first deliveries following in 2017. As the 777X’s entry into service (EIS)
is relatively far away, the comparison here will build on its predecessor 777-
300ER. Due to its age the Boeing loses in range (Airbus 14,800km, Boeing
13,700km) and fuel burn (-21% fuel costs per seat on the Airbus). Both offer a
similar number of seats with 366-440 for the A350 and 365-550 for the B777. The
Jumbo category is belonging to the A380 and B747. Boeing stretched and
updated its Jumbo jet in 2008 but is likely to discontinue production in 2017. The
A380 shows a 3% lower fuel cost per seat with a range advantage of 900km and
a total of 15,200km. As it offers significantly more seats with a range of 544-853
(Boeing 410-605) giving higher revenue income streams it also costs more with a
list price of 432.6M$ (Boeing 378.5M$). The two companies have a very different
history and geographical set-up as described above. Boeing engages 157,000
employees, of which 80,000 work in Civil Aircrafts, compared to 137,000 at
Airbus. Boeing does not produce helicopters but makes up for it with higher
Defence revenues. It is the second largest defence contractor in the world and
the largest US exporter in general. It is solely operating in its home market as it
does not have FALs outside the US. Whereas Boeing published a revenue of
96,114M$ (net income: 5,176M$) for 762 deliveries in 2015, Airbus announced
revenues of 64,450M€ (net income 2,698M€) for 635 deliveries in the same
period. Both show a similar capital structure: Airbus as a group holds 99.6% of
capital as equity whereas Boeing holds 97.6% of which 73.12% are held by
institutional investors. The Top5 are Capital World Investors, Evercore Trust
Company, Vanguard, Price T Rowe and Capital Research Global Investors.11
Attention has to be paid to 4-5 new competitors trying to capture market share in
the above 100 seats segment. Brazilian aerospace company Embraer & Canada-
based Bombardier traditionally produced smaller business and commercial
11 Source: NASDAQ

AIRBUS GROUP COMPANY REPORT
PAGE 16/32
aircrafts under 100 seats. With global demand changing both companies are no
targeting new markets. Out of 70,900 employees Bombardier engages 15,000 in
the aerospace part of the business (they also build trains, where 50% of
revenues are generated) producing 73 total deliveries in 2015 resulting in a
revenue of 2,400M$ from commercial airlines and 7,000M$ from their business
fleet. The new CSeries programme, aiming at commercial airlines, increased the
number of seats to 130-160 and is now threatening the smaller versions of the
A320 and B737. However, the programme’s necessary heavy investments also
put the company at risk of default. At the end, the Canadian government had to
make a cash injection into the programme. Debt levels are still high compared to
its peers with a debt to equity ratio of 2.91, leading to a credit rating of B2
(Moody’s) or B- (Standard & Poors). The current dual class share structure is not
received as investor-friendly since the Bombardier-Beaudoin family is holding
54% of voting rights. Most equities are held by well-known investment fund
BlackRock and Vanguard as well as The Caisse de dépôt et placement du
Québec. Despite all efforts, the programme so far is not a success with lower
than expected orders. From 2009 until end of 2016 a total of 358 orders were
received. In 2016, airlines such as Delta, Swiss and Baltic took delivery of the
first CSeries with a discounted price which is expected to be 1/3 of the list price
(60M€). A total of 15 deliveries are targeted in 2016 and 30 in 2017. “Even by
2020, output is projected to be less than one fifth the production rates for
competing workhorse jets at Boeing Co. and Airbus Group SE.”12
Embraer has a
similar profile: 18,000 employees build the E195 aircraft, reaching 101
commercial deliveries in 2015, resulting in revenues of 5,928M$ (Net income:
272M$). Compared to its peers, Embraer is relatively high leveraged with only
53.6% of its capital being equity. Of which 50.72% are held by institutional
investors with the Top5 being: Brandes Investment Partners, Oppenheimer
Funds, Baillie Gifford, Hotchkis & Wiley Capital Management and Barrow Hanley
Mewhinney & Strauss. In addition, military aircrafts and a business fleet are
offered. Some governments are pushing the development of state-owned
national aerospace companies. COMAC (Commercial Aircraft Cooperation of
China), a Chinese state-owned company established in 2008, is facing the
competition of A320 and B737 with their own development: the C919. It is due to
be delivered in late 2018 with 570 orders already placed by mainly Chinese
airlines as of 2016. It will offer around 168 seats in a 2-class configuration and
will be the second plane from that company which is already producing the
smaller ARJ21 for regional airlines (up to 105 seats). As for efficiency, there is
probably still a gap to Airbus and Boeing which means that the worldwide impact
12 Source: Financialpost

AIRBUS GROUP COMPANY REPORT
PAGE 17/32
of the C919 will not be significant.13
From 2025, a wide body version called the
C929 or C939 can be expected which might have the capacity of up to 290 seats.
COMAC is not actively traded. Irkut, a subsidiary of the Russian state-controlled
United Aircraft Corporation (UAC) is meanwhile developing the MC-21, which will
offer 150-212 seats from late 2018. It relies heavily on western suppliers such as
Pratt & Whitney for the engines. This aircraft achieved 192 orders by mainly
Russian carriers as of year-end 2016. It is supposed to cost 72M$ in the base
version.14
The firm has 100,000 employees and offers a wide-range of aircrafts,
including military applications to the market resulting in revenues of 4,900M€ (net
income: 1,510M€). Public Joint Stock Company United Aircraft Corporation
comprises some 30 companies representing Russia’s aviation manufacturing
sector, including PJSC Company Sukhoi, PJSC Irkut Corporation, JSC RAC MiG,
JSC Sukhoi Civil Aircraft and others. It is relatively high leveraged with only
61.7% of capital being equity. Three groups of shareholders can be identified:
91% are held by the Russian Federal Agency for State Property Management,
5% by Vnesheconombank and 4% by private shareholders as free floaters. A big
challenge that both completely new market entries face is trust. So far the C919
and MC-21 are not yet in production and did not prove their capabilities regarding
efficiency and safety yet. That is why only domestic airlines pre-ordered those
planes. In the years to come, both have to gain the trust of international airlines in
order to be considered a successful programme.
Main competitors for the Defence market consist of: Boeing (company profile
previously discussed), UAC (company profile previously discussed), Embraer
(company profile previously discussed), BAE (Military: Tanks, Cyberwarfare etc.,
82,500 employees, revenues of 20,500M€, 91.4% of capital is equity, 76% is held
by institutional investors, Top3 shareholders include Schafer Cullen Capital
Management, SEI Investments Management and Allianz Global Inv Fund Mgmt),
Raytheon (Military: Missiles, Cyberwarfare etc., 61,000 employees, revenues of
23,247M$, 95% of capital is equity, 76.31% is held by institutional investors,
Top3 shareholders include Vanguard, Blackrock and State Street) and Northrop
(Military: B52 planes, Drones etc., 65,000 employees, revenues of 23,526M$,
90.4% of capital is equity, 81.08% is held by institutional investors, Top3
shareholders include State Street, Vanguard and Capital World Investors).
Furthermore: Bell Helicopters (half of revenues from commercial helicopters,
50% from military helicopters, revenue of 3,500M$, part of Textron Holding),
Leonardo-Finmeccanica (Military systems, additionally helicopter companies
13 Source: Chinadaily 14 Source: Flightglobal
AIRBUS GROUP COMPANY REPORT
PAGE 18/32
Augusta Westland and PZL-Świdnik, 47,000 employees, revenues of 13,000M€,
60.3% of capital is equity, 49% is held by institutional investors, Top3
shareholders include Capital Research and Management Company, VA
CollegeAmerica EuroPacific and DNCA Finance), Lockheed (Military systems,
additionally Sikorsky Helicopters, 126,000 employees, revenue of 46,132M$,
83.3% of capital is equity, 79.92% is held by institutional investors, Top3
shareholders include State Street, Capital World Investors and Vanguard) and
Oboronprom (Military system and civil helicopters, 271 helicopter deliveries in
2015, revenue of 2,000M€, not actively traded).
Airbus is the market leader in helicopter. Main competitors include Augusta
Westland and Sikorsky Helicopters. The former is a subsidiary of Leonardo-
Finmeccanica and the latter a part of Lockheed.
Valuation
As all three business lines are well established businesses a Discounted Cash
Flows (DCF) approach is chosen in order to determine the company value. Those
values are added up in a sum-of-the-parts valuation. Major investments, which
are consolidated in the Cash Flows and Balance Sheet of Airbus, are included in
the corresponding business line and assumed to be operating. As for the non-
strategic investments, those are subtracted from all financial accounts and added
at the end to the company value with fair value. To cross-check a Multiple
Analysis among peers is performed. To test the sensibility of the results, an
analysis will be executed at the end in order to allow for a range of company
value on critical variables.
Main value drivers forecasts
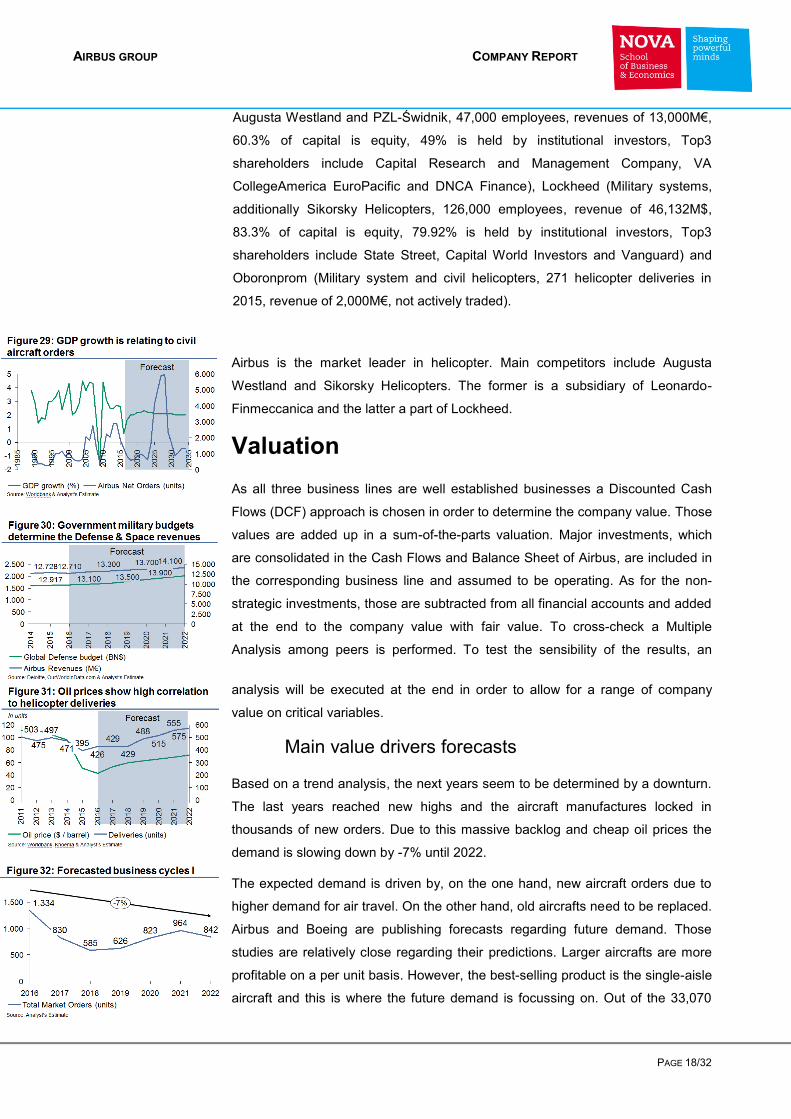
Based on a trend analysis, the next years seem to be determined by a downturn.
The last years reached new highs and the aircraft manufactures locked in
thousands of new orders. Due to this massive backlog and cheap oil prices the
demand is slowing down by -7% until 2022.
The expected demand is driven by, on the one hand, new aircraft orders due to
higher demand for air travel. On the other hand, old aircrafts need to be replaced.
Airbus and Boeing are publishing forecasts regarding future demand. Those
studies are relatively close regarding their predictions. Larger aircrafts are more
profitable on a per unit basis. However, the best-selling product is the single-aisle
aircraft and this is where the future demand is focussing on. Out of the 33,070
AIRBUS GROUP COMPANY REPORT
PAGE 19/32
new aircrafts until 2035, 23,530 are attributed to the single-aisle market. This is
mainly due to the boom of low-cost carriers (LCC) such as Ryanair. Those are
not only a common phenomenon in Europe and North America but also in the
emerging markets such as India. In 2016, the largest single order for A320 ever
came from an Indian LCC. As the A321neo LR is coming to market in 2019 this
type of aircraft shows an incredible amount of variability and possibility of
adaptation. As per trip costs of smaller planes are lower than those of big planes,
new longer routes will become available to the traveller. A new kind of LCC will
arise which will be specialised in intercontinental flights.
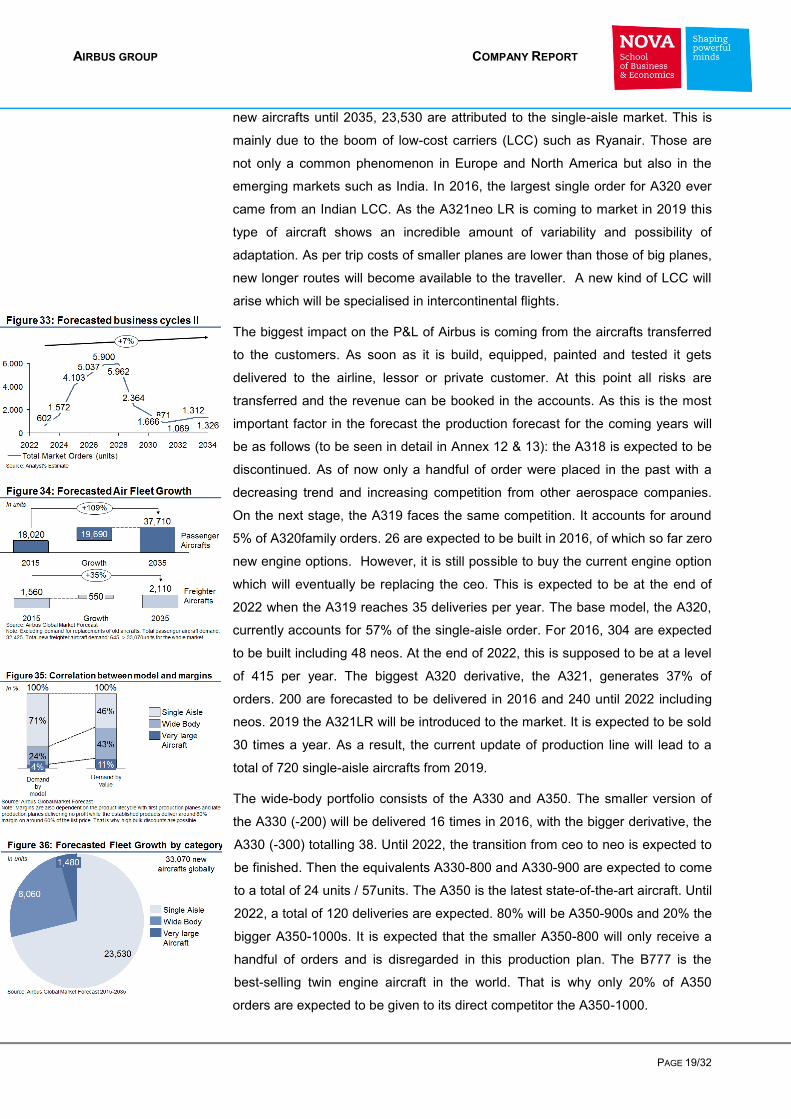
The biggest impact on the P&L of Airbus is coming from the aircrafts transferred
to the customers. As soon as it is build, equipped, painted and tested it gets
delivered to the airline, lessor or private customer. At this point all risks are
transferred and the revenue can be booked in the accounts. As this is the most
important factor in the forecast the production forecast for the coming years will
be as follows (to be seen in detail in Annex 12 & 13): the A318 is expected to be
discontinued. As of now only a handful of order were placed in the past with a
decreasing trend and increasing competition from other aerospace companies.
On the next stage, the A319 faces the same competition. It accounts for around
5% of A320family orders. 26 are expected to be built in 2016, of which so far zero
new engine options. However, it is still possible to buy the current engine option
which will eventually be replacing the ceo. This is expected to be at the end of
2022 when the A319 reaches 35 deliveries per year. The base model, the A320,
currently accounts for 57% of the single-aisle order. For 2016, 304 are expected
to be built including 48 neos. At the end of 2022, this is supposed to be at a level
of 415 per year. The biggest A320 derivative, the A321, generates 37% of
orders. 200 are forecasted to be delivered in 2016 and 240 until 2022 including
neos. 2019 the A321LR will be introduced to the market. It is expected to be sold
30 times a year. As a result, the current update of production line will lead to a
total of 720 single-aisle aircrafts from 2019.
The wide-body portfolio consists of the A330 and A350. The smaller version of
the A330 (-200) will be delivered 16 times in 2016, with the bigger derivative, the
A330 (-300) totalling 38. Until 2022, the transition from ceo to neo is expected to
be finished. Then the equivalents A330-800 and A330-900 are expected to come
to a total of 24 units / 57units. The A350 is the latest state-of-the-art aircraft. Until
2022, a total of 120 deliveries are expected. 80% will be A350-900s and 20% the
bigger A350-1000s. It is expected that the smaller A350-800 will only receive a
handful of orders and is disregarded in this production plan. The B777 is the
best-selling twin engine aircraft in the world. That is why only 20% of A350
orders are expected to be given to its direct competitor the A350-1000.
AIRBUS GROUP COMPANY REPORT
PAGE 20/32
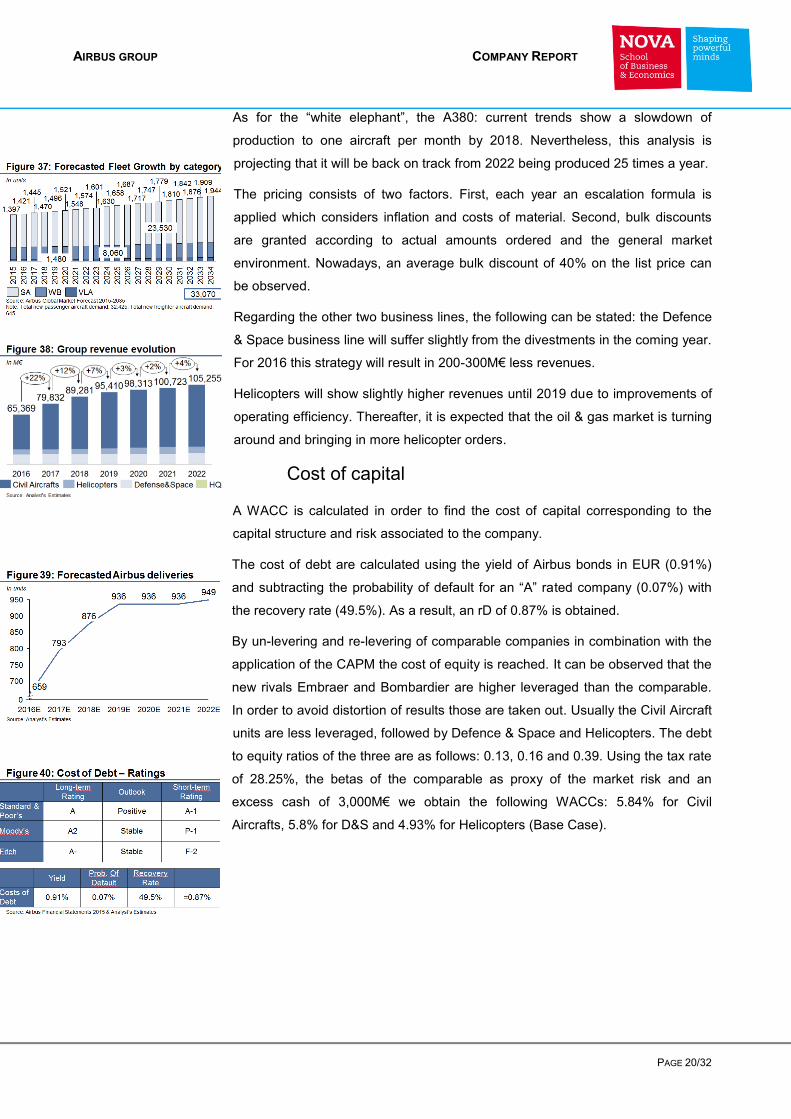
As for the “white elephant”, the A380: current trends show a slowdown of
production to one aircraft per month by 2018. Nevertheless, this analysis is
projecting that it will be back on track from 2022 being produced 25 times a year.
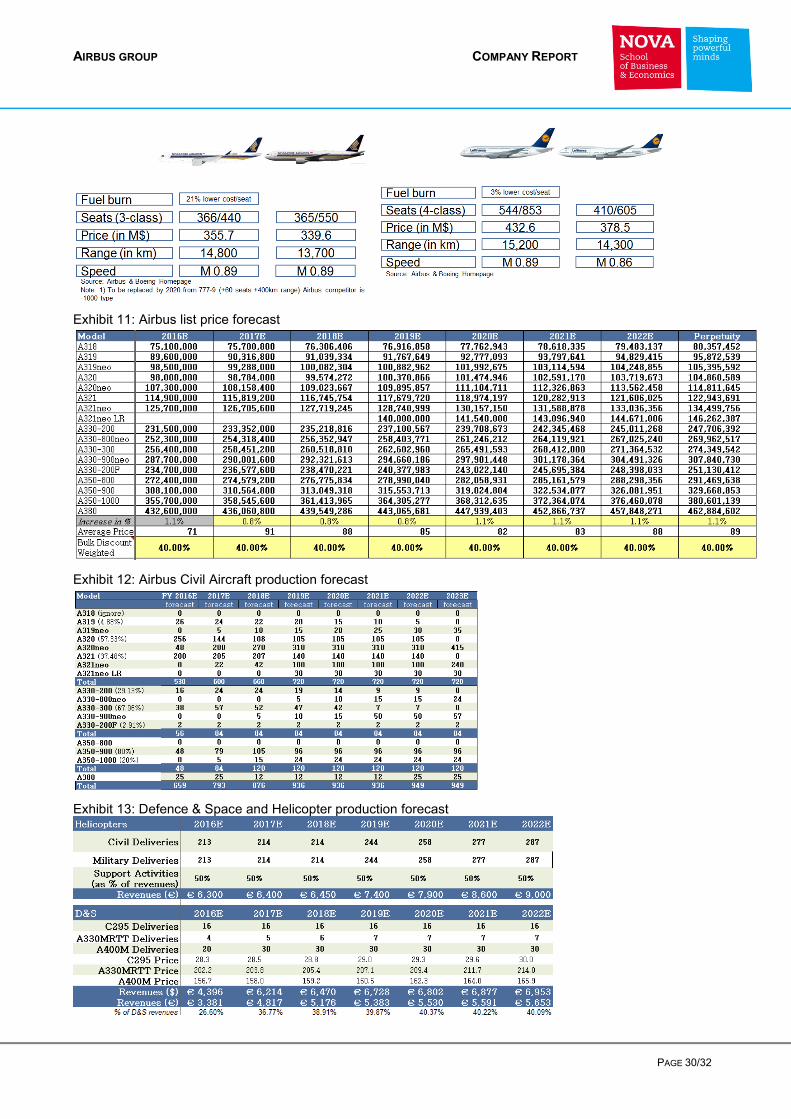
The pricing consists of two factors. First, each year an escalation formula is
applied which considers inflation and costs of material. Second, bulk discounts
are granted according to actual amounts ordered and the general market
environment. Nowadays, an average bulk discount of 40% on the list price can
be observed.
Regarding the other two business lines, the following can be stated: the Defence
& Space business line will suffer slightly from the divestments in the coming year.
For 2016 this strategy will result in 200-300M€ less revenues.
Helicopters will show slightly higher revenues until 2019 due to improvements of
operating efficiency. Thereafter, it is expected that the oil & gas market is turning
around and bringing in more helicopter orders.
Cost of capital
A WACC is calculated in order to find the cost of capital corresponding to the
capital structure and risk associated to the company.
The cost of debt are calculated using the yield of Airbus bonds in EUR (0.91%)
and subtracting the probability of default for an “A” rated company (0.07%) with
the recovery rate (49.5%). As a result, an rD of 0.87% is obtained.
By un-levering and re-levering of comparable companies in combination with the
application of the CAPM the cost of equity is reached. It can be observed that the
new rivals Embraer and Bombardier are higher leveraged than the comparable.
In order to avoid distortion of results those are taken out. Usually the Civil Aircraft
units are less leveraged, followed by Defence & Space and Helicopters. The debt
to equity ratios of the three are as follows: 0.13, 0.16 and 0.39. Using the tax rate
of 28.25%, the betas of the comparable as proxy of the market risk and an
excess cash of 3,000M€ we obtain the following WACCs: 5.84% for Civil
Aircrafts, 5.8% for D&S and 4.93% for Helicopters (Base Case).
AIRBUS GROUP COMPANY REPORT
PAGE 21/32
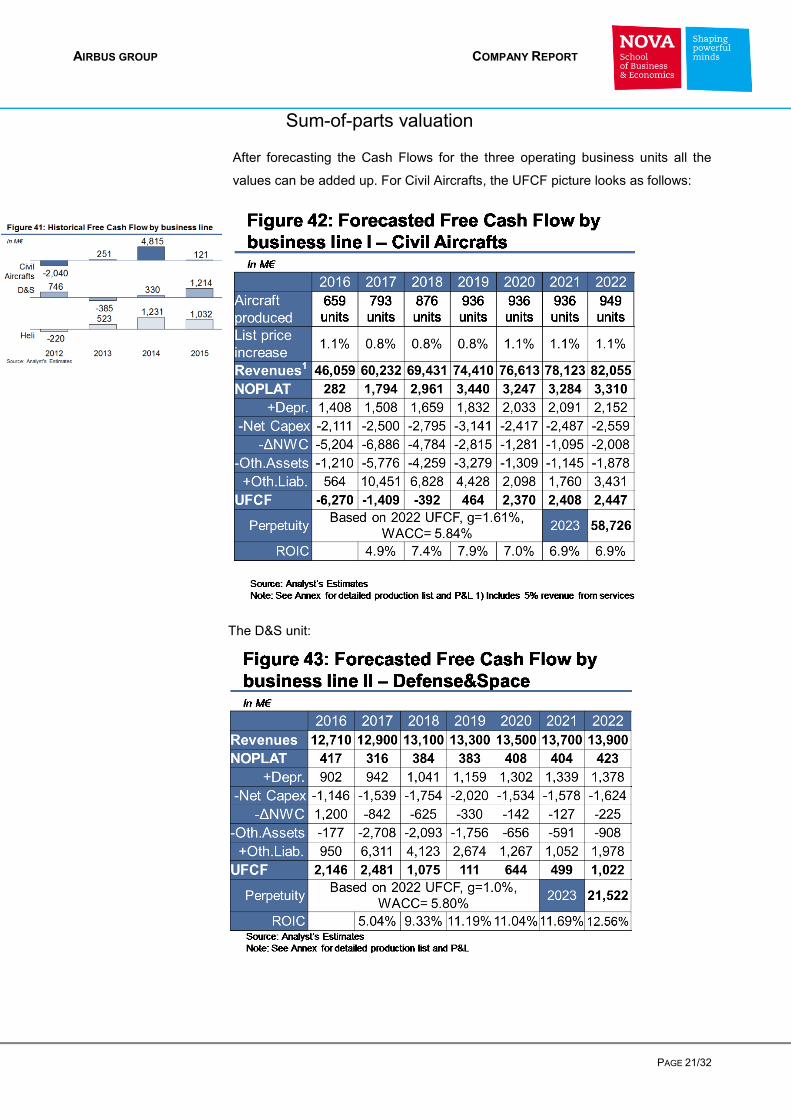
Sum-of-parts valuation
After forecasting the Cash Flows for the three operating business units all the
values can be added up. For Civil Aircrafts, the UFCF picture looks as follows:
The D&S unit:

AIRBUS GROUP COMPANY REPORT
PAGE 22/32
Finally, the Helicopter unit produces the following cash flows:
All three parts added up and discounted to year-end 2017 total 74,395BN€.
Thereafter, investment property of 66M€, financial investments under the equity
method of 1,326M€ and Excess cash of 3,000M€ are added as they were
assumed to be non-operating. On the liability side, 5,713M€ of financial debt as
of 12/2017 are added. Other liabilities such as upcoming legal settlements or
unfunded pension funds are not applicable. After all, an equity value of 80,113M€
is reached (Base Case). Distributed among 772,7M share leads to a share price
of 96.28€.
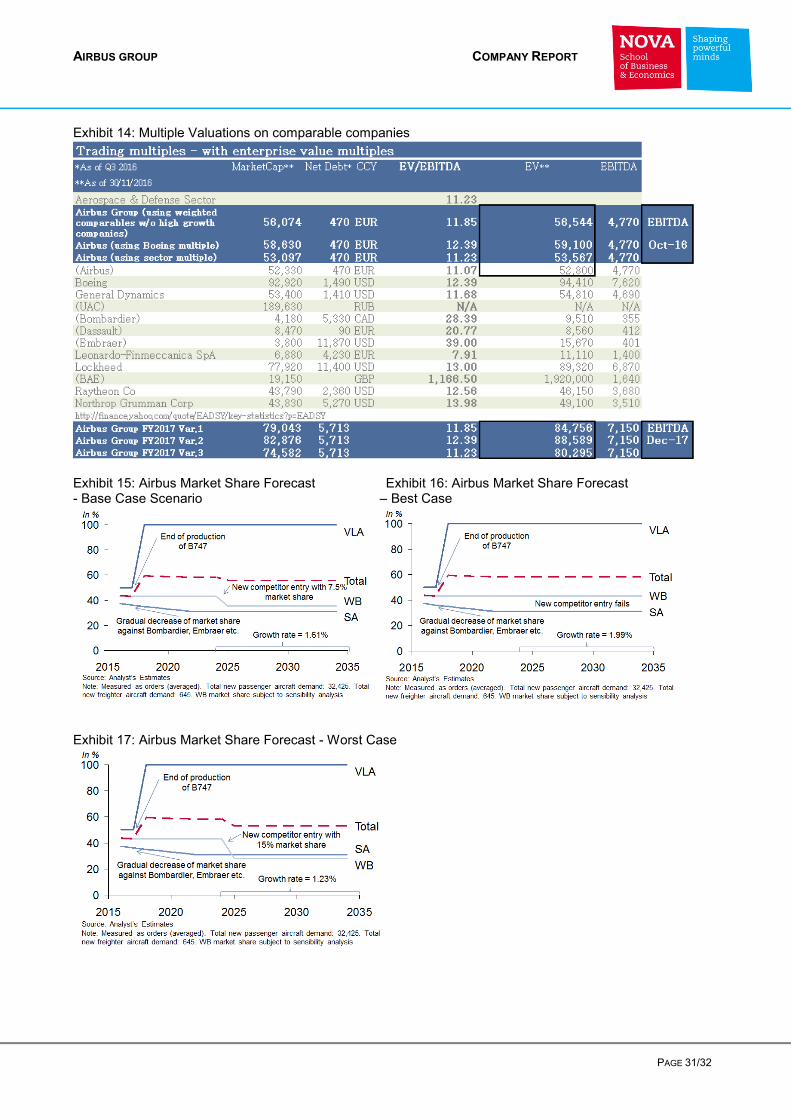
Multiple Valuations
As the EV/EBITDA ratio is the most common trading multiple used by
professionals it will also be applied in this case. However, not all comparable
companies are true equal companies. They might differ in size or growth rates.
Examples of the latter are Bombardier and Embraer. As they just entered the
single aisle market with high market expectations they show higher multiples
than the rest of the market, hence they are excluded from the analysis. As BAE,
Dassault and UAC are distorting the sample they are excluded as well. The rest
of the sample, as presented in the Comparable Company section of this report, is

AIRBUS GROUP COMPANY REPORT
PAGE 23/32
used to construct three different groups of comparables. All values are presented
in Annex 14.
First, a weighted badge of Boeing, General Dynamics, Leonardo-Finmeccanica,
Lockheed, Raytheon and Northrop Grumman is formed with a ratio of 70/20/10
(Civil Aircraft/Defence & Space/Helicopter). As a result an EV/EBITDA of 11.85 is
obtained.
Second, as Boeing is the closest comparable its ratio of 12.39 is applied to
Airbus’ 2017 EBITDA.
Third, an Aerospace and Defence sector ratio of 11.23 gives a rather low base
value of 53,567M€. At the same time the actual Airbus Group share is traded at a
multiple of 11.07 and an enterprise value of 52,800 (as of 20/11/2016). This was
shortly after more details about the restructuring plan were given which helped a
surge of the share.
Applying the current Multiples to the forecasted Airbus EBITDA in 2017 gives a
possible EV range from 80,295M€ (sector multiple) to 88,589M€ (Boeing
multiple). The weighted portfolio of comparables comes to 84,756M€.
Sensitivity Analysis
Clearly the highest risk of variation is coming from new market entries and their
development in the future, especially in the wide body market. A graphic
representation can be seen in Annex 15-17. It is assumed to be sure that the
B747 will be discontinued in 2017. It has been operated for decades and any new
development would cost billions of dollars. In addition, the Jumbo jet is not fitting
to the company strategy of Boeing anymore. The Point-to-Point model favours
two-engine wide-body jets. Present in all scenarios is the decrease of market
share in the single-aisle market. It is forecasted that Airbus will lose market share
from the current 63% to 55% over the next years. But how is the Russian-
Chinese co-development of a new wide body jet going to evolve in times of high
international tensions? The most doubtful variable in this valuation equation are
market shares on wide bodies in the long-run. Obviously nobody is able to predict
those accurately, hence this section is supposed to check the most feasible
range of percentages. According to the market consensus, a range between 15-
30% is a good proxy. This would be an equal player in the market which then
would be divided into three market players. Additionally, Airbus CEO said in an
interview that the wide body market would allow for an additional player. Hence, a
best case is established where no market share is lost and the new market entry
of the competitor fails. In a base case, the JV achieves 15% total market share.
The lost part will be split between Airbus and Boeing and resulting in minus 7.5%

AIRBUS GROUP COMPANY REPORT
PAGE 24/32
for Airbus. Analogue, a worst case with 30% total market share lost is tested. The
market share developments will be measured in the growth rate of the civil
aircraft section after the detailed valuation horizon.
Furthermore, monetary policies are impacting this valuation with the cost of
capital. There might be a change from the current quantitative easing to a more
tight monetary policy in the US as well as the EU. An analysis on the MCSI
World and France’s ten year bonds over the last ten years gave an equity
premium of 4.14% which is in line with the historical premium over the last 80
years. A more recent and reasonable proxy of the future is obtained by making
the same equity premium analysis on the CAC40, which is the French Equity
Index. As a result, 9.52% are obtained. In line with possible change in monetary
policies the previously obtained 4.14% do not seem realistic looking into the
future. To establish a base case the average between those two is taken to
smooth the results.
To achieve a range for the Airbus valuation three different scenarios are being
investigated as presented above. Among these, two different perimeters are
being used for testing the sensitivity of the results. As market shares and cost of
capital are not directly related they were tested individually and presented in
different graphs in order to show the vulnerability of the company to changes in
each specific variable.
Finally, in the most likely DCF case, Airbus as sum-of-parts is worth 80,113M€.
This valuation is confirmed by the multiple analyses performed. The lower end
using the sector multiple allows for a value of 80,295M€, whereas the highest
multiple, applying Boeing, reaches to 88,589M€. This premium is deserved as
Boeing possesses a higher value Defense & Space business. The weighted
portfolio multiple comes closest to the DCF valuation with 84,756M€. This
company value seems credible as the deviation is only 9.57%.

AIRBUS GROUP COMPANY REPORT
PAGE 25/32
Annexes
Financial Statements
Exhibit 1: Historical Balance Sheet
AIRBUS GROUP COMPANY REPORT
PAGE 26/32
Exhibit 2: Forecasted Balance Sheet
Exhibit 3: Consolidated P&L of the Airbus Group SE
AIRBUS GROUP COMPANY REPORT
PAGE 27/32
Exhibit 4: Restructuring Plan Impact
Exhibit 5: A350 / A380 amortization of development costs

AIRBUS GROUP COMPANY REPORT
PAGE 28/32
Exhibit 6: Top100 airlines analysis
N° Airline Boeing Total Airbus Total Other TotalIn-Serv ice Ordered In-Serv ice Ordered In-Serv ice Ordered
1 Aeroflot 31 24 110 22 29 742 Aeromexico 64 66 0 0 63 53 Air Algerie 27 6 8 0 15 04 Air Berlin 21 0 82 2 17 35 Air Canada 60 78 102 0 25 456 Air China 179 40 180 10 0 207 Air France/KLM 227 24 185 35 161 88 Air India 41 9 66 0 0 09 Air New Zealand 26 6 29 14 0 010 Air Transat 11 0 23 0 0 011 Alaska Airlines 155 58 0 0 0 012 Alitalia 11 0 93 0 0 013 All Nippon 185 62 10 3 0 1514 American Airlines 453 157 119 157 107 015 Austrian Airlines 11 0 29 0 42 1116 Cathay Pacific 73 22 47 47 0 017 China Eastern 132 48 297 20 0 2018 China Southern 203 26 278 3 20 2019 Copa Airlines 77 66 0 0 12 020 Delta Airlines 483 79 169 131 181 7521 Easyjet 0 0 251 172 0 022 Egypt Air 34 0 30 1 0 023 Emirates 143 185 108 63 0 024 Ethopian Airlines 51 26 0 12 17 225 Etihad Airways 37 90 80 100 0 026 Garuda Indonesia 88 50 25 23 31 1227 Gol Aereos 145 71 0 0 0 028 International Airlines Group 149 26 219 94 0 029 Jet Airways 86 85 8 5 18 030 JetBlue Airways 0 0 159 87 60 2331 LATAM Airlines Group 69 9 117 102 0 032 Lion Air 108 239 3 216 0 033 Lufthansa 39 20 228 146 0 034 Norwegian 112 155 0 100 0 035 Qatar Airways 71 69 95 77 0 036 Qantas 78 8 40 107 0 037 Royal Air Maroc 43 3 0 0 9 038 Ryanair 409 215 0 0 0 039 SAS 81 0 41 38 11 040 Singapore Airlines 56 30 52 69 0 041 South African 7 0 43 5 0 042 Southwest 718 243 0 0 0 043 Spirit Airlines 0 0 86 80 0 044 TAP Portugal 0 0 63 53 24 945 Turkish Airlines 151 88 171 101 3 046 United Airlines 563 170 152 35 0 047 Virgin (Atlantic, Americas, Australia)101 50 87 59 28 048 WestJet 118 70 0 0 0 049 Wizz Air 0 0 68 143 0 0
AIRBUS GROUP COMPANY REPORT
PAGE 29/32
Exhibit 7: A320neo vs B737MAX81 Exhibit 8: A330-900neo1 vs B787-9
Exhibit 9: A350-1000 vs B777-300ER Exhibit 10: A380-800 vs B747-8
50 Azul Linhas Aereas 0 0 5 35 143 3351 Aerolíneas Argentinas 43 20 14 2 0 052 TAME 0 0 10 0 10 053 Boliviana de Aviación 21 12 0 0 1 154 Hawaiian Airlines 26 0 22 22 3 055 Fiji Airways 5 0 4 0 0 056 Air Niugini 5 5 0 0 26 057 Iberia 0 0 83 45 0 058 Air Asia 0 0 175 575 0 059 Japan Airlines 160 17 0 31 0 3260 Hainan Airlines 142 9 23 0 0 2261 Korean Air 99 57 39 30 0 1062 IndiGo 0 0 109 426 0 063 China Airlines 36 0 28 14 0 064 Asiana Airlines 22 0 51 57 0 065 Saudia 64 4 62 0 15 066 Thai Airways 47 0 37 4 0 067 Malaysia Airlines 57 10 26 0 0 068 SWISS 0 0 65 5 15 069 EVA Air 26 26 35 0 0 070 Dragonair 0 0 42 0 0 071 Bangkok Airways 0 0 20 0 12 572 Aegean Airlinies 0 0 47 0 0 073 Hong Kong Airlines 0 0 22 17 0 074 Finnair 0 0 48 14 24 075 Oman Air 27 24 10 0 4 076 SriLankan Airlines 0 0 23 4 0 077 Air Astana 8 3 13 0 9 078 TUIfly 40 63 0 0 0 079 SilkAir 16 38 15 0 0 080 Germanwings 0 0 61 0 0 081 Pegasus Airlines 54 5 10 75 0 082 Vietnam Airlines 13 3 65 10 16 083 Brussels Airlines 1 0 37 0 11 084 Porter Airlines 0 0 0 0 26 085 Thomson Airways 60 63 0 0 0 086 Air Seychelles 0 0 3 0 6 087 Azerbaijan Airlines 8 0 12 0 5 288 Air Mauritius 0 0 10 4 2 089 Icelandair 30 0 0 0 0 090 Kenya Airways 28 0 0 0 15 091 Philippine Airlines 6 0 46 31 0 092 Gulf Air 0 16 28 29 0 1093 TAAG Angola Airlines 15 1 0 0 0 094 SpiceJet 25 42 0 0 16 095 Tianjin Airlines 0 0 23 0 72 2096 Shenzhen Airlines 87 7 79 0 0 097 EuroAtlantic Airays 8 0 0 0 0 098 TigerAir 0 0 24 39 0 099 Vueling 0 0 108 56 0 0100 NIKI 0 0 21 0 0 0
AIRBUS GROUP COMPANY REPORT
PAGE 30/32
Exhibit 11: Airbus list price forecast
Exhibit 12: Airbus Civil Aircraft production forecast
Exhibit 13: Defence & Space and Helicopter production forecast
AIRBUS GROUP COMPANY REPORT
PAGE 31/32
Exhibit 14: Multiple Valuations on comparable companies
Exhibit 15: Airbus Market Share Forecast Exhibit 16: Airbus Market Share Forecast - Base Case Scenario – Best Case
Exhibit 17: Airbus Market Share Forecast - Worst Case

AIRBUS GROUP COMPANY REPORT
PAGE 32/32
Disclosures and Disclaimer
Research Recommendations
Buy Expected total return (including dividends) of more than 15% over a 12-month period.
Hold Expected total return (including dividends) between 0% and 15% over a 12-month period.
Sell Expected negative total return (including dividends) over a 12-month period.
This report was prepared by “Student’s Name”, a student of the NOVA School of Business and Economics, following the Masters in Finance Equity Research – Field Lab Work Project, exclusively for academic purposes. Thus, the author, which is a Masters in Finance student, is the sole responsible for the information and estimates contained herein and for the opinions expressed, which reflect exclusively his/her own personal judgement. This report was supervised by professor Rosário André (registered with Comissão do Mercado de Valores Mobiliários as financial analyst) who revised the valuation methodology and the financial model. All opinions and estimates are subject to change without notice. NOVA SBE or its faculty accepts no responsibility whatsoever for the content of this report nor for any consequences of its use. The information contained herein has been compiled by students from public sources believed to be reliable, but NOVA SBE or the students make no representation that it is accurate or complete, and accept no liability whatsoever for any direct or indirect loss resulting from the use of this report or its content. The author hereby certifies that the views expressed in this report accurately reflect his/her personal opinion about the subject company and its securities. He/she has not received or been promised any direct or indirect compensation for expressing the opinions or recommendation included in this report. The author of this report may have a position, or otherwise be interested, in transactions in securities which are directly or indirectly the subject of this report. NOVA SBE may have received compensation from the subject company during the last 12 months related to its fund raising program. Nevertheless, no compensation eventually received by NOVA SBE is in any way related to or dependent on the opinions expressed in this report. The Nova School of Business and Economics, though registered with Comissão do Mercado de Valores Mobiliários, does not deal for or otherwise offers any investment or intermediation services to market counterparties, private or intermediate customers. This report may not be reproduced, distributed or published without the explicit previous consent of its author, unless when used by NOVA SBE for academic purposes only. At any time, NOVA SBE may decide to suspend this report reproduction or distribution without further notice.