Embed Size (px)
Citation preview
1
MASTERS IN MANAGEMENT: FINANCE AND INVESTMENTS
Thesis Title: Issues Affecting the Development of Capital Markets: The Case of
the Swaziland Stock Exchange
Thokozile Bridget Buluma
Student Number: 0610422N
BUSA 7167
Supervisor: Professor Kalu Ojah
Date of submission: March 2014
2
1 CHAPTER 1: ORIENTATION .......................................................................................... 9
1.1 Introduction ................................................................................................................. 9
1.2 A Brief Overview of the Swaziland Stock Exchange ............................................... 10
1.3 Problem Statement .................................................................................................... 14
1.4 Objectives of the Study ............................................................................................. 15
1.5 Significance of the Research ..................................................................................... 15
1.6 Methodology Overview............................................................................................. 16
1.7 Outline of the Study ................................................................................................. 17
2 CHAPTER 2: LITERATURE REVIEW .......................................................................... 18
2.1 Introduction ............................................................................................................... 18
2.2 Overview of Swaziland Financial System ................................................................ 18
2.3 Recent Legislative Developments in Swaziland ....................................................... 20
2.3.1 Insurance Act of 2005 ........................................................................................ 20
2.3.2 The Retirement Funds Act of 2005 .................................................................... 23
2.3.3 The Financial Services Regulatory Authority Act of 2010 ............................... 26
2.3.4 The Securities Act of 2010 ................................................................................ 26
2.3.5 Swaziland Revenue Authority Act of 2009 ....................................................... 26
2.4 Domestic Retention Polices For Contractual Savings Institutions in Africa ............ 26
2.5 Financial System Development and Economic Growth ........................................... 27
2.6 Role of a Stock Exchange in the Economy ............................................................... 29
2.7 Critics of Establishment of Stock Exchanges in Developing Countries ................... 30
2.8 Relationship between the Banking Sector and the Stock Market ............................. 31
2.9 Role of Bond Market ................................................................................................. 33
2.10 Role of Institutional Investors in the Development of Stock Exchanges .................. 34
2.11 Institutional Structures and Stock Exchange Development ...................................... 37
3 CHAPTER 3: METHODOLOGY .................................................................................... 39
3.1 Introduction ............................................................................................................... 39
3.2 Problem Statements ................................................................................................... 39
3.3 Population and Research Sample .............................................................................. 39
3.3.1 Qualitative Sample ............................................................................................. 39
3.3.2 Quantitative Sample ........................................................................................... 40
3.4 Research Design ........................................................................................................ 40
3.4.1 Qualitative Research Design .............................................................................. 41
3.4.2 Quantitative Research Design ............................................................................ 41
3.5 Instrumentation.......................................................................................................... 43
3
3.5.1 Sources of Data .................................................................................................. 43
3.5.2 Dependant Variables .......................................................................................... 44
3.5.3 Independent variables ........................................................................................ 44
3.5.4 Estimation of Quarterly GDP............................................................................. 45
3.5.5 Data Limitations................................................................................................. 45
3.6 Data Analysis ............................................................................................................ 45
3.6.1 Descriptive Research Design ............................................................................. 45
3.6.2 Segmented linear regression .............................................................................. 46
3.6.3 Threats to Internal Validity ................................................................................ 47
3.6.4 Threats to External Validity ............................................................................... 48
4 CHAPTER 4: RESEARCH RESULTS AND ANALYSIS ............................................. 49
4.1 Introduction ............................................................................................................... 49
4.2 Test for Autocorrelation and Partial Correlation....................................................... 49
4.2.1 Analysis of ACF and PACF Correlograms ........................................................ 52
4.3 Descriptive Statistics ................................................................................................. 53
4.3.1 Evolution of Market Capitalization 2006-2012 ................................................. 53
4.3.2 Evolution of Turnover Value 2006-2012 ........................................................... 54
4.3.3 Evolution of Turnover Ratio 2006-2012............................................................ 55
4.4 Modelling Intervention .............................................................................................. 55
4.4.1 Turnover Value/Market Capitalization Ratio Model ......................................... 56
4.4.2 Segmented Market Capitalization Model .......................................................... 57
4.4.3 Segmented Turnover Value Model .................................................................... 58
4.5 Discussion of Findings .............................................................................................. 59
4.6 Impediments to the Development of the Stock Exchange ........................................ 60
4.6.1 Poor Liquidity .................................................................................................... 60
4.6.2 Free Float ........................................................................................................... 60
4.6.3 Lack of New Listings ......................................................................................... 61
4.6.4 Legislative Framework ...................................................................................... 61
4.6.5 Trading Infrastructure ........................................................................................ 61
4.6.6 Central Depository System ................................................................................ 61
4.6.7 Lack of Education and Behavioural Patterns of Investors ................................. 62
5 CHAPTER 5: CONCLUSION AND RECOMMENDATIONS ...................................... 63
5.1 Conclusion ................................................................................................................. 63
5.2 Policy Recommendations .......................................................................................... 63
6 REFERENCES ................................................................................................................. 65
7 APPENDIX 1 - Questionnaire to Key Industry Players ................................................... 70
4
8 APPENDIX 2 - Segmented Regression Results for Market Capitalization (adjusted for
correlation using Prais-Winsten AR (1) Regression) ............................................................... 72
Table 1: Investment Mix of the Long Term Insurance Industry .............................................. 20
Table 2: Investment Mix of Short Term Insurance Industry ................................................... 22
Table 3; Local Investment for Short Term Insurers by Asset Class ........................................ 22
Table 4: Foreign Investment for Short Term Insurers by Asset Class ..................................... 23
Table 5: Investment Mix of Retirement Fund Assets .............................................................. 24
Table 6: Segmented Regression Results for Turnover Value/Market Capitalization Ratio .... 56
Table 7: Segmented Regression for Turnover Value/Market Capitalization (adjusted for
correlation Using Prais-Winten AR (1) Regression) ............................................................... 56
Table 8: Segmented Regression Results for Market Capitalization ........................................ 57
Table 9:Segmented Regression Results For Market Capitalization (adjusted for correlation
using Prais-Winsten AR(1) Regression) .................................................................................. 57
Table 10: Segmented Regression Results for Turnover Value ................................................ 58
Table 11: Segmented Regression Results for Turnover Value (adjusted for correlation using
Prais-Winsten AR(1) Regression)............................................................................................ 58
Figure 1: Local and Foreign Investment for Long Term Insureres by Asset Class 2012 and
2013.......................................................................................................................................... 21
Figure 2: Local and Foreign Investments for Retirement Funds by Asset Class 2012 and 2013
.................................................................................................................................................. 25
Figure 3: ACF and PACF( Respectively) Correlograms for Market Capitalization ............... 50
Figure 4: ACF and PACF(Respectively) Correlograms for Turnover Value .......................... 51
Figure 5: ACFand PACF (Respectively)Correlograms for Turnover Value/Market
Capitalization Ratio ................................................................................................................. 52
Figure 6: Market Capitalization Trend 2006-2012 .................................................................. 53
Figure 7:Turnover Value Trend 2006-2012 ............................................................................. 54
Figure 8: Turnover Value/Market Capitalization Ratio Trend 2006-2012 .............................. 55
5
ABBREVIATIONS
FSRA Financial Services Regulatory Authority
RIRF Registrar of Insurance and Retirement Funds
SRA Swaziland Revenue Authority
SSX Swaziland Stock Exchange
CBS Central Bank of Swaziland
CoSSE Committee of SADC Exchange
GDP Gross Domestic Product
DEFINITION OF TERMS
Free Float The proportion of listed securities held by the public to total number of listed
securities.

6
DECLARATION
I, Thokozile Buluma, declare that the research work reported in this dissertation is my own,
except where otherwise indicated and acknowledged. It is submitted in partial fulfilment for
the Masters of Management in Finance and Investments degree at the University of the
Witwatersrand. This has not been submitted before for any degree or diploma in any other
university or institution for a similar qualification. I further declare that I have obtained the
necessary authorisation and consent to carry out this research.
___________________ __________
Signature of Candidate Date
___________________ __________
Signature of Supervisor Date

7
ACKNOWLEGEMENTS
I never would have been able to complete this research report without the instrumental
contributions and support of a number of individuals. Above all I would like to thank God for
this achievement and for his goodness and his mercy.
I would not have managed to complete this course without my loving family who provided
financial and moral support, from the beginning of this academic journey. Thank you so
much.
I would also like to thank Mr Peace Mabuza who was instrumental in helping me acquire the
relevant data and Mr Sdumo Masango who was instrumental in assisting me with the
econometric aspect of the research especially the econometric software. Your advice and
guidance were invaluable. I am also grateful to the respondents who responded to the
administered questionnaires.
Last but not least, Professor Kalu Ojah, my supervisor. Thank you for your constant
constructive criticism, motivation and guidance which helped me to realize the potential
within me and work even harder. Thank you.
8
ABSTRACT
The research aims to identify issues affecting the development of the Swaziland Stock
Exchange, particularly the public equity market. In particular, the impacts of recent
legislative changes on the development of the Swaziland Stock Exchange are assessed. The
research particularly assesses the impact of the 30% domestic investment requirement for
insurance companies and retirement funds which is stipulated in the Insurance Act of 2005
and the Retirement Funds Act of 2005. The research also aims to identify impediments to the
development of the Swaziland Stock Exchange.
An interrupted time series design is used to assess movements of dependant variables (stock
market development indicators) under consideration over time both before and after the
implementation of the intervention (30% domestic investment requirement) in order to assess
whether there is an obvious change. The findings of the research are that the implementation
of the 30% domestic investment requirement stipulated in the both the Insurance Act and the
Retirement Funds Act of 2005 had a positive impact on market capitalization in the time
period after the implementation of the requirement but had no impact on turnover value and
turnover ratio of the Swaziland Stock Exchange.
9
1 CHAPTER 1: ORIENTATION
1.1 Introduction
The purpose of this study is to identify the impact of legislative changes, particularly the 30%
legislative domestic investment requirement stipulated in the Retirement Funds Act of 2005
and the Insurance Act of 2005, on the Swaziland Stock Exchange (SSX), particularly the
public equity market, and to determine impediments to the development of the SSX.
In 2005, the Development Report published by the SSX revealed that one of the challenges
facing the SSX was the lack of or inadequate institutional participation. Later that year, the
Swaziland government promulgated the Retirement Funds Act of 2005 and the Insurance Act
of 2005 (Acts), which direct that 30% of all assets of retirement funds and insurance
companies, which are the largest institutional investors in Swaziland, be invested locally1.It
was anticipated that the 30% local investment requirement stipulated in the Acts would
improve institutional participation in the Swaziland economy, particularly the SSX.
Historically, the majority of institutional investors, such as retirement funds, insurance
companies and collective investment schemes (unit trusts) have held their investments
outside Swaziland, especially in neighbouring South Africa. Swaziland is a member of the
Common Monetary Area (CMA), which provides for the free movement of capital within
member states, which are Lesotho, Namibia, Swaziland and South Africa. It is believed that
the CMA agreement amplified capital flight in the case of Swaziland as neighbouring South
Africa availed relatively more diverse and attractive investment opportunities compared to
Swaziland.
The spirit of both the Retirement Funds Act and the Insurance Act of 2005 was to initiate a
string of crucial developments to attract institutional investors who would play a positive role
in the development of the financial sector in Swaziland. The Acts aim to ensure that a
portion of funds from the insurance and retirement funds industries are used to develop the
Swaziland economy and make a significant addition to the GDP in the hope that this will play
a role in placing Swaziland as a second generation emerging African market economy in the
future. There have been numerous studies on the relationship between the development of
stock markets and economic growth. Bakaert and Harvey (1996), in particular, suggested
that stock market development and economic growth are positively correlated. Thus, it is
1Schedule 1 of the Retirement Funds Act of 2005 and Schedule 3 of the Insurance Act of 2005.
10
crucial that studies on frontier markets are carried out in order to determine the impact of
such market based legislation on the development of the stock market.
Numerous players in the Swaziland financial industry have indicated that it may be
challenging for the institutional investors to fulfil the 30% local investment requirement as
the linkage between the objectives of these Acts and the efficiency with which the additional
liquid funds can be invested locally has not been clearly outlined. Thus the objectives of these
Acts may not be fully realised.
The Financial Services Regulatory Authority (FSRA) which regulates the non-banking
financial sector in Swaziland has voiced a concern that a large portion of the mandatory 30%
domestic investments from the retirement funds and insurance companies are invested in the
form of cash in the banking sector and a large portion of the cash is repatriated to foreign
parent companies2. Market participants, particularly investment managers, have argued that
this pattern is a result of insufficient opportunities for the effective allocation of resources.
This in turn defeats the intent of the Acts since the funds still end up outside the Swaziland
economy. The continued lack of adequate avenues for asset allocation in Swaziland may
result in the objectives of the Acts for retention of funds for domestic development not being
realised.
There have been a number of legislative advancements in Swaziland in the past eight years in
an attempt to mobilise and stimulate the financial sector. Therefore, a study such as this
current one could provide guidance for policymakers to assess the current and possible future
role of the SSX in financial sector development. This research attempts to assess the impact
of an increase in the money invested locally by institutional investors due to the legislative
30% local investment requirement on the development of the SSX, particularly the public
equity market.
1.2 A Brief Overview of the Swaziland Stock Exchange
Swaziland is a small country in Southern Africa occupying a landscape of seventeen
thousand two hundred (17 200) square kilometres according to World Bank data. According
to 2012 world bank figures, Swaziland had a population of approximately one million and
two hundred and thirty one thousand (1 231 000) people and a GDP of approximately $ 3.744
2According to the Central Bank Annual Report for 2013, South African Banks Dominate the banking sector in Swaziland and accounted for 84.2% of the total banking sector assets in 2012.
11
billion. According to the Central bank report for 2012, the economy grew at a minimal rate of
1.7% in 2012 up from a 0.6 decline in 2011 which is low compared to other Sub Saharan
countries which recorded average growth of 4.8% in 2012. The inflation rate was 8.9% in
2012 from 6.1% recorded in 2011. The main economic drivers are agriculture, forestry,
mining, manufacturing and services of which government services constituted sixty four per
cent (64%) of GDP in 2011.
The International Monetary Fund (IMF) has used the term ‘frontier markets’ to define
countries with markets that are smaller and less liquid than those in more advanced emerging
markets. Based on this definition Swaziland can be classified as a frontier market. Nellor
(2008) suggests that some African countries are capable of becoming part of a second
generation of emerging market countries if they develop financial markets that are likely to
attract institutional investors.
The SSX currently operates within the Financial Services Regulatory Authority of Swaziland.
The SSX started operating in 1990 within the Capital Market Development Unit (CMDU) of
the Central Bank of Swaziland. The stock exchange was initiated as an over the counter
market and trading was done on an informal basis and facilitated by Swaziland Stock
Brokers. The brokers had the responsibility of reporting the market activity in the Times of
Swaziland (local newspaper) and the index used was an unweighted stock price index. The
unweighted price index remained unchanged until 2001; after which it was substituted by a
market capitalisation weighted index recomputed at the close of each trading session.
Following the licensing of another broker in 1998, African Alliance, the SSX proceeded to be
a fully-fledged stock exchange and the Central Bank of Swaziland inaugurated the stock
market in July 1999. The SSX became more formalised and trading took place between 10:00
am and 12:00 noon, Monday to Friday, and the day-to-day reporting in the local newspaper
and physical settlement undertaken with custodial facilities provided by Nedbank becoming
routine. Currently all dealings in the capital markets are carried out by Swaziland Stock
Brokers (LTD) and African Alliance Swaziland (LTD). Currently financial instruments
traded on the SSX include bonds3, equities and unit trusts.
Prior to 2010, there was no legislation governing the regulation of capital markets which
presented challenges in terms of regulation of capital markets and investor protection. In the
3Both government and corporate bonds are traded on the SSX.
12
absence of official legislation, the Central Bank of Swaziland exercised marginal control over
capital markets under the Financial Institutions Order of 1975 and the Financial Institutions
Act of 2005, and issued Collective Investment Schemes Guidelines and Stock Exchange
Listing Requirements and Guidelines. The SSX has existed in its current form since 01st
September 2000. There are currently six companies listed on the stock exchange all with very
minimal secondary trading.
Formal legislation was recently introduced to regulate capital markets in Swaziland: the
Securities Act of 2010 and the Financial Services Regulatory Act of 2010. These Acts
provided for the appointment of the Registrar of Capital Markets.
According to the Securities Act of 2010, “for the purpose of carrying out the objectives of the
office, the Registrar may increase the supply of securities by encouraging companies to
increase investment in capital assets and raise finance through the public issue of securities;
and encourage holders of securities to engage in the secondary market”. This may prove to be
a challenge as there are other overriding factors such as market liquidity which may play a
role in an investor’s decision to participate in the secondary market.
The development reports published by the SSX from 2005 to 2010 reveal that the SSX was
facing the following challenges:
Insufficient legal framework – Prior to 2010, the absence of legislation made the SSX a
relatively risky investment platform as there was no gazetted legal protection for investors
and listed companies. The FSRA anticipates that the new legislation namely, the Securities
Act of 2010 and the Financial Services Regulatory Act of 2010, will increase investor
confidence in the SSX.
Corporate governance practice – The SSX listing requirements stipulate that listed
companies are required to comply with the code of corporate governance prescribed in the
King II report. However, enforcement of best practice lacked the support of enabling
legislation. The FSRA anticipates that the new legislation namely, the Securities Act of 2010
and the Financial Services Regulatory Act of 2010, will increase investor confidence in the
SSX so far as corporate governance considerations are concerned. Consequently, exposure to
malpractice from industry players will be reduced.
13
Inadequate trading infrastructure – The SSX is currently trading by means of the manual
call-over system. The SSX does not have an electronic trading system or a central securities
depository. It has been observed that the global trend is that regional exchanges have been
migrating to electronic trading systems. Thus the current system of the SSX has implications
for the efficiency of the settlement of securities traded because it may be difficult to link up
with other regional exchanges that use electronic trading platforms.
Poor liquidity –The poor liquidity of the SSX secondary market is mainly due to the small
size of the SSX, the low free float4 and the small capital base of listed companies.
Free float – The approved minimum free float for the Committee of SADC Stock Exchanges
(CoSSE) members is 20%. This has given rise to a limited number of shares issued at the
initial public offering stage and a low trade volume in the secondary market.
Lack of institutional participation – Historically, a majority of the institutional funds’ assets
have been invested outside Swaziland especially in member countries of the Common
Monetary Area which provides for free movement of capital within member states. It was
anticipated that the Retirement Funds Act and the Insurance Act of 2005 both of which direct
that 30% of all assets of retirement funds and insurance companies be invested locally would
have a positive effect on institutional investors’ participation on the SSX.
Minimal disposable income – High unemployment and relatively low disposable income are
partly responsible for low savings rates and by extension fewer financial resources are
directed to financial investment on the SSX by local citizens.
Behavioural patterns of investors – Traditionally, citizens of Swaziland prefer to invest in
real assets such as cattle5 and generally invest their disposable income in banks which they
deem to be more accessible than the SSX. The general populace are therefore not exposed
and receptive to more sophisticated financial instruments traded on the SSX such as equities.
Concentration of trading activities on a few companies’ stocks – It has been observed that
trading activity is concentrated on a few companies which attract relatively higher investor
attention. This results in share trades on a limited number of companies.
4 Free float is the proportion of listed securities held by the public to the total number of listed securities 5 Historically, cattle are considered as a sign of wealth in Swazi culture.
14
1.3 Problem Statement
This study aims to address the following problems:
Problem (1) – The evolution of institutional investors, particularly in the contractual savings
sector, has been linked with the promotion of financial development and economic growth.
Whether an increase in contractual savings institutions has a significant impact on the growth
of capital markets, specifically a small and illiquid stock exchange such as the SSX remains
inconclusive. Catalan, Impavido and Musalem (2000) argue that contractual saving
institutions are effective in developing capital markets as their liabilities are long term and do
not require immediate liquidity. Catalan et al (2000) found that countries with more advanced
contractual savings sectors also had more developed stock markets and countries where the
contractual savings sector increased comparatively also experienced the highest growth in
market capitalization and value traded.
On the other hand, Meng and Pfau (2010) found that the effect of pension funds (contractual
saving institution) on capital markets depends on the level of financial development and that
pension funds do not significantly impact capital markets in countries with a low level of
financial development.
The Swaziland Government has attempted to mobilise the financial sector in Swaziland by
implementing a number of legislative advancements in the past eight years. It was anticipated
that the Retirement Funds Act and the Insurance Act of 2005, which both direct that 30% of
all assets of retirement funds and insurance companies be invested in the domestic economy,
would have a positive effect on the participation of institutional investors in the SSX.
However, the effects of these Acts on the SSX have not been quantified. There is currently
no empirical evidence regarding the development impact of such legislation on the SSX as
there has been no study on this issue devoted exclusively to the SSX.
Problem (2) – Economic growth and financial development are associated with an enabling
regulatory and policy environment. In the case of Swaziland the linkage between the
objectives of the Acts and the efficiency with which the funds from the institutional investors
are channelled locally has not been clearly outlined and the objectives of the Acts have only
been partially realised.
The Financial Services Regulatory Authority which regulates the non-bank financial sector in
Swaziland, including the SSX, has voiced a concern that a large portion of the local
15
institutional investors’ funds are invested in the form of cash in the banking sector and a
large portion of the cash is repatriated to foreign parent companies.
Impavido, Musalem, and Tressel (2003) found that the correlation between the growth of
contractual savings and the stock market is weaker, the greater the cross-border security
transactions there are. The SSX has the potential to play a more prominent role in capital
allocation in the Swaziland economy and provide alternative avenues for the investment of
funds of institutional investors if creative ways to foster the development of the SSX are
explored and impediments to the development of the SSX are addressed.
In the case of Swaziland there has been no study where the regulatory and policy
environment are assessed in order to determine whether there is a linkage between the
objectives of the regulations and policies and the efficiency with which the funds from the
institutional investors are channelled locally.
1.4 Objectives of the Study
The study therefore aims to assess the effect of the 30% local investment requirement
stipulated in the pertinent Acts in order to determine their development impact on the SSX.
More specifically, objectives of this study are as follows:
1. To explore the effect of the implementation of the 30% domestic investment
requirement stipulated in both the Retirement Funds Act and the Insurance Act of
2005, on the development of the SSX.
2. To identify impediments to the development of the SSX.
1.5 Significance of the Research
The research is significant as it will provide a quantifiable model developed to assess the
impact of the 30% local investment requirement for retirement funds and insurance
companies on the SSX. The research can be used by policy makers to assess the impact of
such market based investment legislation on the SSX.
Further, the research can be utilised by countries with similar circumstances as Swaziland and
are yet to enact polices which dictate that a certain portion of funds of institutional investors
be invested locally given that the stock exchange is underdeveloped. This report will expand
16
on current literature on the SSX such as the study by Hearn and Piesse (2009), in particular,
who found that the SSX is small and illiquid and that certain barriers exist as inhibitors to its
development.
1.6 Methodology Overview
The research will consider the impact of legislative changes, particularly the 30% local
investment requirement on the development of the SSX, particularly the public equities
market. The evaluation of the study will have a domestic focus.
The research will primarily be quantitative in nature with qualitative considerations. The
qualitative aspect of the research will mainly be for verification of certain assumptions and
generalizations within the real world context. The qualitative primary data will be collected
through questionnaires. Qualitative secondary information will be obtained from the business
section of the local newspaper, the Central Bank of Swaziland Annual Reports, SSX
Development Reports, RIRF Annual Reports and FSRA Annual Reports.
The quantitative analysis will encompass the use of a time-series econometric design which
will involve making a series of observations, introducing an intervention or other new
variables to the system, and then making additional observations. The samples observed will
be drawn from the SSX Development Reports. The observations will be drawn from a period
before and after the implementation of the Acts. Changes in the observations before and after
the implementation of the Acts will be gauged in order to ascertain if there are significant
changes that may have occurred which can be attributed to the implementation of the Acts.

17
1.7 Outline of the Study
This proposal report will be considered as chapter one (1) of the research paper. The
remainder of the research report will consist of the following chapters:
Chapter 2 –This chapter will highlight the recent legislative changes in Swaziland that may
have an effect on the development of the SSX. The chapter will also make inquiries into the
theory and empirical studies which explain the synergies between the development of the
financial system (particularly the stock market) and economic growth.
Chapter 3 – This chapter will focus on the methodology used to carry out the research. The
stochastic model used and the research design will be extensively elaborated on. The
limitations of the research approach and methodology will also be highlighted in this chapter.
Chapter 4– This chapter will include an analysis and discussion of findings.
Chapter 5 – This chapter will mainly focus on conclusions and recommendations (policy
guide) that can be made from the findings.
18
2 CHAPTER 2: LITERATURE REVIEW
2.1 Introduction
This chapter highlights the recent legislative changes in Swaziland that may have an effect on
the development of the SSX and the structure of the financial system in Swaziland. This
chapter further inquiries into the theory and empirical studies which explain the synergies
between the development of the financial system and economic growth. The benefits,
challenges and connections of financial institutions within the financial system are also
discussed. The literature will mainly focus on equity specifically.
2.2 Overview of Swaziland Financial System
The Swaziland financial system consists of a range of non-banking financial institutions,
money markets and capital markets which include the banking sector. The banking sector is
regulated by the Central Bank of Swaziland and the non-banking sector is regulated by the
Financial Services Regulatory Authority (FSRA).
The bank supervision division of the Central Bank of Swaziland ensures that the banking
sector maintains the set standards with regard to risk management strategies, capital
adequacy, assets quality, management and board supervision, earnings performance and
liquidity.
Swaziland has three commercial banks which are all subsidiaries of South African banks,
namely: Standard Bank Swaziland, Nedbank (Swaziland) Limited and First National Bank of
Swaziland. The Swaziland Development and Savings Bank is owned by the Swaziland
government and has both a developmental and commercial mandate. The only bank listed on
the SSX is Nedbank (Swaziland) Limited. The subsidiaries of South African banks dominate
the banking sector as they accounted for 84.2% of the total banking sector assets in 20126.
The Swaziland banking sector is a highly concentrated banking industry due to the limited
number of players in the market.
The Financial Services Regulatory Authority (FSRA) was established through the Financial
Services Regulatory Act of 2010, and is responsible for the establishment and administration
6 Central Bank of Swaziland annual report for 2013
19
of an intergraded regulatory regime for the non-bank financial sector7 including capital
markets, retirement funds, insurance companies, saving co-operatives and building societies.
The FSRA became operational in October 2012 and has taken upon supervisory duties while
still putting in place a regulatory framework.
Prior to 2010, there was no legislation governing the regulation of capital markets which
presented challenges in terms of regulation and investor protection. In the absence of official
legislation, the Central Bank of Swaziland exercised marginal control over capital markets
under the Financial Institutions Order of 1975 and the Financial Institutions Act of 2005 and
issued Collective Investment Schemes Guidelines and Stock Exchange Listing Requirements
and Guidelines. The SSX is currently under the supervision of FSRA under the capital
markets division. In 2013 capital markets institutions comprised of, four fund managers who
have authorised collective investment schemes in Swaziland, two licensed stock brokerage
firms, three companies authorised to be trustees and nine investment advisors8.
The office of the Registrar of Insurance and Retirement Funds (RIRF) was established
through the Insurance Act and the Retirement Funds Act of 2005 in November 2006 and was
responsible for the regulation of entities in the retirement fund and insurance industries prior
to October 2012 and is now part of FSRA.
The non-bank financial sector’s assets have been increasing consistently after 2009 which the
IMF suggests is partly in response to the liquidity surge from the 30% domestic investment
requirement stipulated in both the Insurance Act and the Retirement Funds Act of 20059.
Prior to the implementation of the FSRA Act of 2010, only the retirement fund and insurance
industry were officially regulated through the Insurance Act of 2005 and the Retirement
Funds Act of 2005.
7Entities regulated by the FSRA include long term insurers, short term insurers, insurance brokers, insurance agents, medical aid funds,
retirement funds, fund administrators, SSX, securities dealers, collective investment schemes, investment managers, investment advisors,
building societies , SACCOs, micro financiers, credit bureaus and prawn brokers
8The Financial Services Regulatory Authority Annual report for March 2013. 9IMF (2008) Kingdom of Swaziland Selected Issues and Statistical Appendix, IMF Country Report No. 08/355
20
2.3 Recent Legislative Developments in Swaziland
2.3.1 Insurance Act of 2005
The Insurance Act of 2005 directs that all entities dealing in the insurance industry in
Swaziland be licensed. The role FSRA is to supervise activities of insurers and intermediaries
in the insurance industry in terms of the Insurance Act of 2005 and to advise the minister on
matters relating to the insurance industry in Swaziland10
.
Prior to the implementation of the Insurance Act of 2005, one local insurance company,
Swaziland Royal Insurance Corporation operated in Swaziland. Through the Insurance Act of
2005, the insurance market was liberalised and the monopoly that had existed in the
insurance industry for approximately 30 years came to an end. In 2008 four more insurance
companies were operating in Swaziland11
. The Insurance Act of 2005 stipulates that 30% of
all insurers’ assets at market value be invested in Swaziland cumulatively over a period of
three years from 2007, in increments of 10% per year12
. Below is an assessment of the
investment patterns of long term and short term insurers.
(a) Long Term Insurers
Table 1: Investment Mix of the Long Term Insurance Industry
LONG TERM INVESTMENTS - LOCAL Vs FOREIGN ASSETS
31-Mar-2013 31-Mar-2012 31-Mar-2011 31-Mar-2010 31-Mar-2009
Total local investments 345 543 816 289 914 869 284 863 972 200 787 519 121 355 968
Total foreign investments 1 352 477 042 997 659 861 769 002 304 620 296 873 498 828 748
Total Investments (E) 1 698 020 858 1 287 574 730 1 053 866 276 821 084 392 620 184 716
% Local investments to total
investments
20% 23% 27% 24% 20%
% Foreign investments to total
investments
80% 77% 73% 76% 80%
Total Investments (%) 100% 100% 100% 100% 100%
Source: Financial Services Regulatory Authority Annual Report 2013
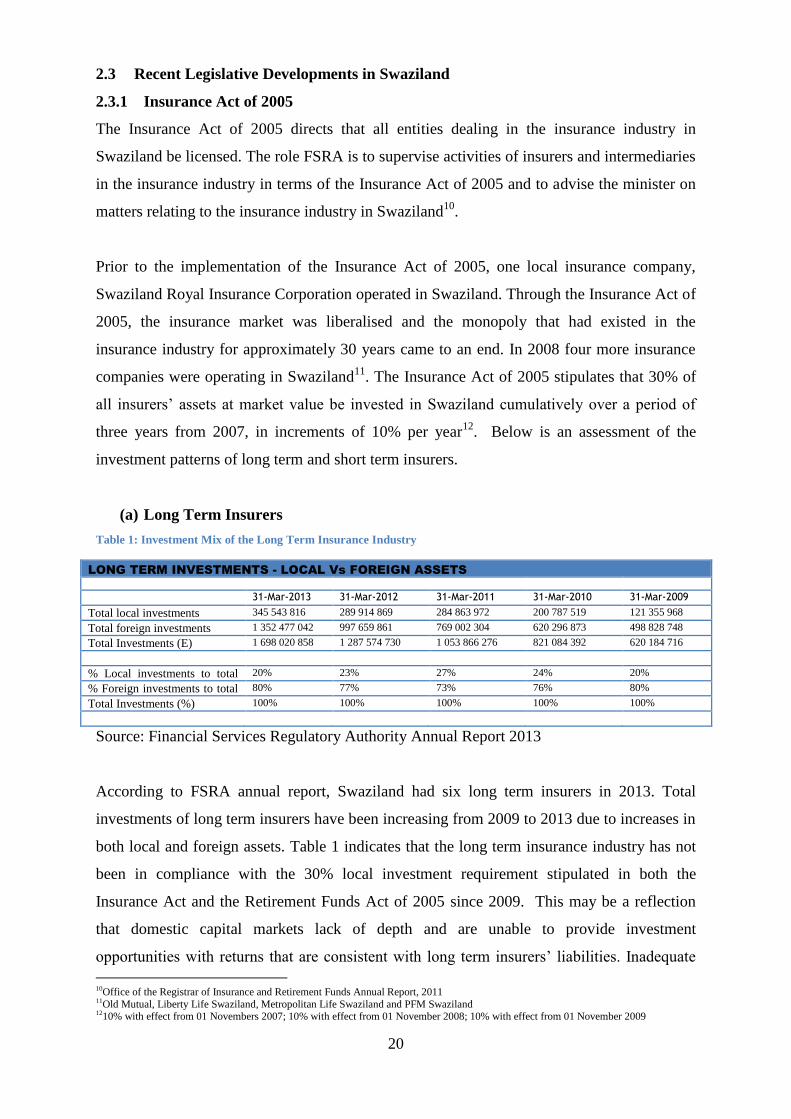
According to FSRA annual report, Swaziland had six long term insurers in 2013. Total
investments of long term insurers have been increasing from 2009 to 2013 due to increases in
both local and foreign assets. Table 1 indicates that the long term insurance industry has not
been in compliance with the 30% local investment requirement stipulated in both the
Insurance Act and the Retirement Funds Act of 2005 since 2009. This may be a reflection
that domestic capital markets lack of depth and are unable to provide investment
opportunities with returns that are consistent with long term insurers’ liabilities. Inadequate
10Office of the Registrar of Insurance and Retirement Funds Annual Report, 2011 11Old Mutual, Liberty Life Swaziland, Metropolitan Life Swaziland and PFM Swaziland 1210% with effect from 01 Novembers 2007; 10% with effect from 01 November 2008; 10% with effect from 01 November 2009
21
domestic investment opportunities can present a challenge for long term insurers in terms of
asset-liability management.
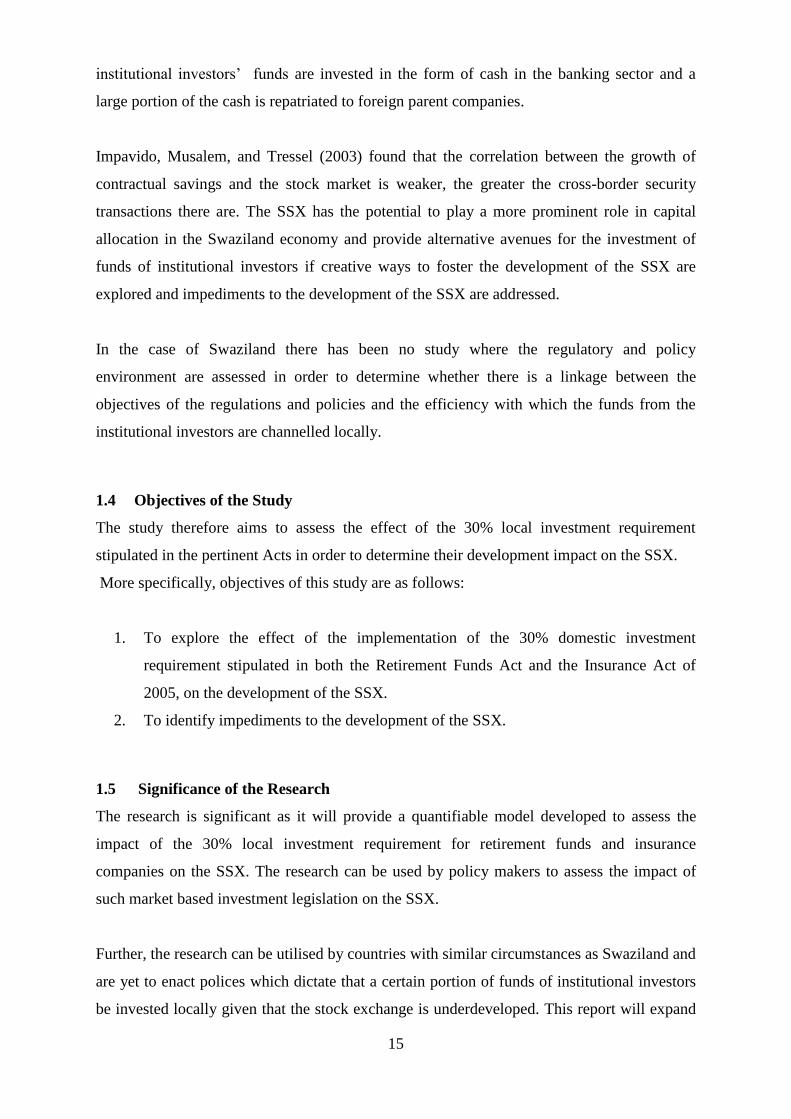
Figure 1: Local and Foreign Investment for Long Term Insurers by Asset Class 2012 and 2013
Source: Financial Services Regulatory Authority Annual Report 2013
A comparison of local and foreign investments in Figure 1 reveals that the majority of foreign
assets were invested on the Johannesburg Stock Exchange (57% in 2012 and 64% in 2013)
whereas only 2% of local investments of long term insurers where invested in the SSX in
2012 and in 2013 respectively.
A majority of local investments of long term insurers are held in the form of cash and money
market instruments (55% in 2012 and 54% in 2013) while a smaller percentage of foreign
assets are invested cash and money market instruments (4% in 2012 and 3% in 2013). 12% of
local assets were invested in bonds in 2012 and this percentage decreased to 10% in 2013. A
large portion of local assets were also invested in property which may better satisfy the asset-
liability mix of long term insurers given the long term nature of property investments. The
Swaziland Stock Exchange
2%
Bonds 12%
Property 31%
Cash and money market
instruments 55%
2012 - Local Invetsments
Johannesburg Stock Exchange
Cash and Money Market instruments
Bond exchange of South Africa
Offshore bonds
22
FSRA has noted the large portion of domestic assets held in cash. In 2012 the Registrar of
Insurance and Retirement Funds pointed out that assets invested as cash eventually found
their way to South Africa and other foreign countries due to the large proportion of foreign
banks which dominate the banking sector in Swaziland and this defeats the purpose of the
30% domestic investment requirement.13
Table 2: Investment Mix of Short Term Insurance Industry
SHORT TERM INVESTMENTS - LOCAL Vs FOREIGN ASSETS
Year Ended 31-Mar-2013 31-Mar-2012 31-Mar-2011 31-Mar-2010 31-Mar-2009
Total local investments 168 636 124 167 631 558 196 190 167 193 319 692 164 403 998
Total foreign investments 266 276 737 368 718 030 365 738 042 305 494 080 266 871 784
Total Investments (E) 434 912 861 536 349 588 561 928 209 498 813 772 431 275 782
% Local investments to
total investments
39% 31% 35% 39% 38%
% Foreign investments to
total investments
61% 69% 65% 61% 62%
Total Investments (%) 100% 100% 100% 100% 100%
Source: Financial Services Regulatory Authority Annual Report 2013
Table 3: Local Investment for Short Term Insurers by Asset Class
LOCAL INVESTMENTS
Type Of Investment 31-Mar-2013 31-Mar-2012 31-Mar-2011 31-Mar-2010 31-Mar-2009
Swaziland Stock Exchange 4 126 120 4 338 620 1 330 000 1 330 000 1 330 000
Bonds - - - - -
Property 34 654 421 32 437 620 29 420 001 28 400 000 25 000 000
Cash and money market
instruments
129 855 583 130 855 318 165 440 166 163 589 692 138 073 998
Total Local Investments 168 636 124 167 631 558 196 190 167 193 319 692 164 403 998
Source: Financial Services Regulatory Authority Annual Report 2013
13
Times of Swaziland, March 5, 2012, “ RIRF to cut cash assets held by insurance players”
23
Table 4: Foreign Investment for Short Term Insurers by Asset Class
FOREIGN INVESTMENTS, CASH AND CASH EQUIVALENTS
31-Mar-2013 31-Mar-2012 31-Mar-2011 31-Mar-2010 31-Mar-2009
Johannesburg Stock Exchange 72 282 931 117 691 546 199 350 714 169 716 842 166 771 585
Offshore equities 64 671 826 72 506 365 21 499 682 18 303 712 13 446
623 Bond exchange of South Africa 23 166 564 25 530 058 68 126 488 57 999 353 42 608
593 Offshore bonds - - 8 464 564 1 330 000 1 330 000
Cash and Money Market
instruments
106 155 416 152 990 061 68 296 594 58 144 173 42 714
983 266 276 737 368 718 030 365 738 042 305 494 080 266 871 784
TOTAL INVESTMENTS 434 912 861 536 349 588 561 928 209 498 813 772 431 275 782
Source: Financial Services Regulatory Authority Annual Report 2013
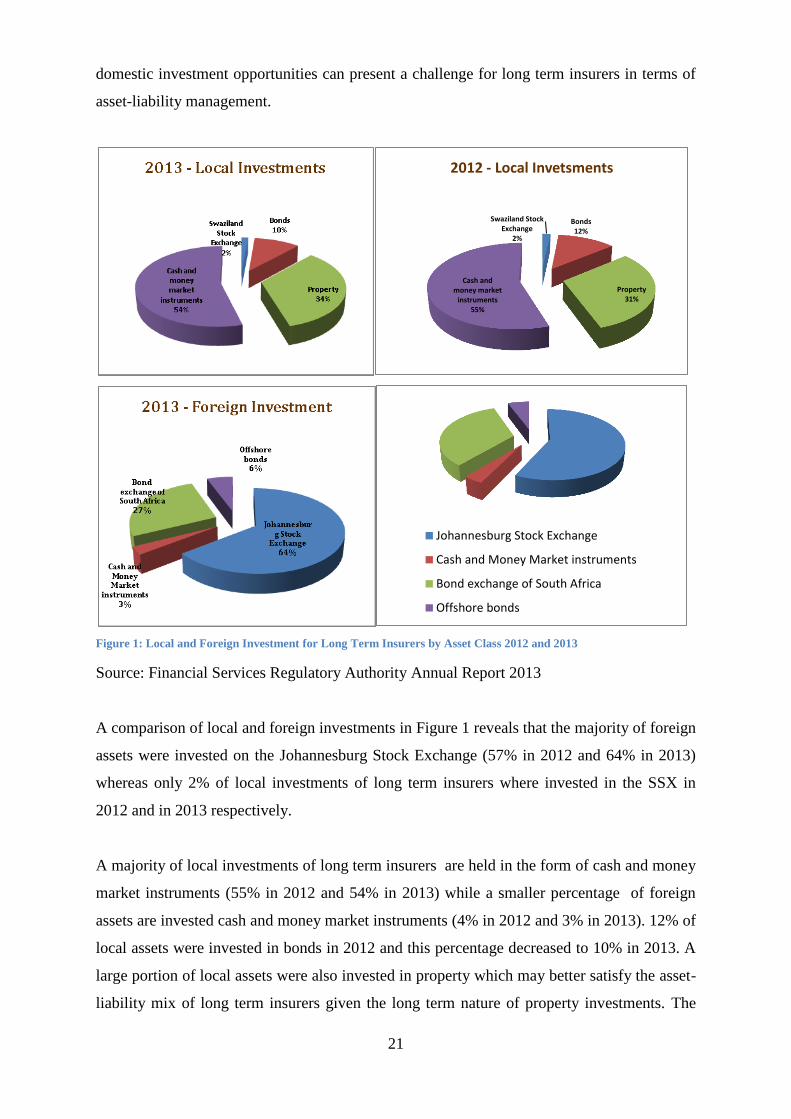
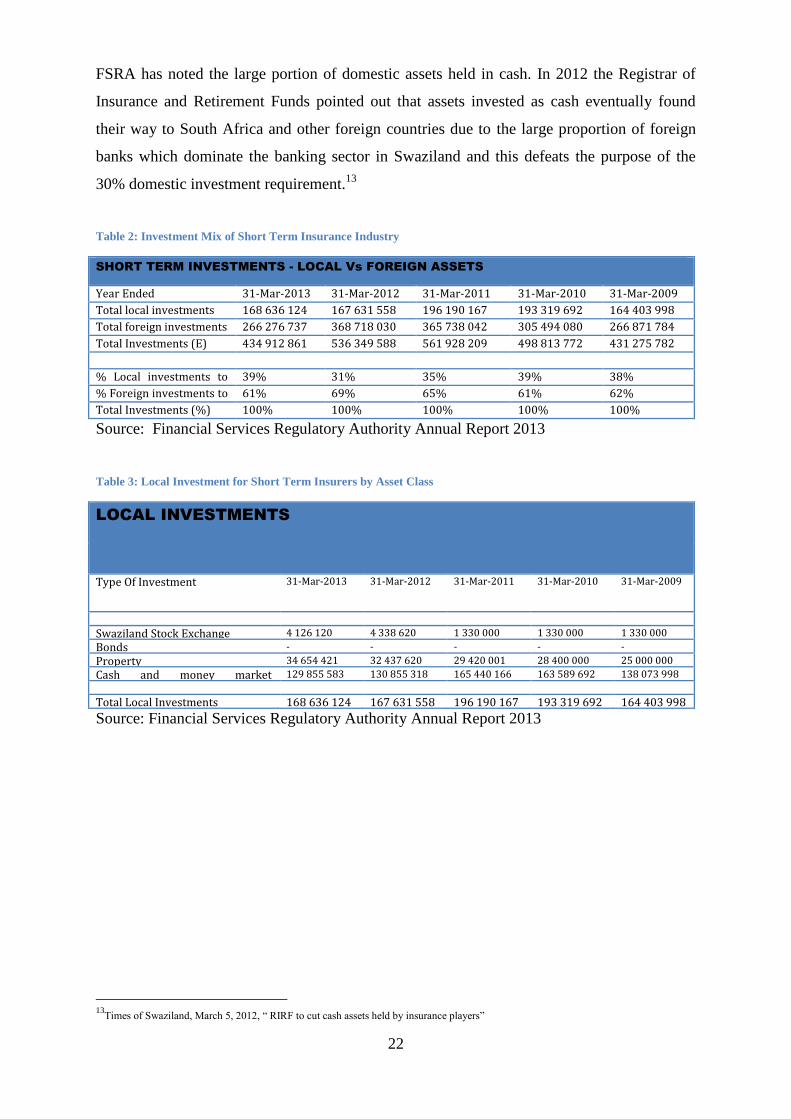
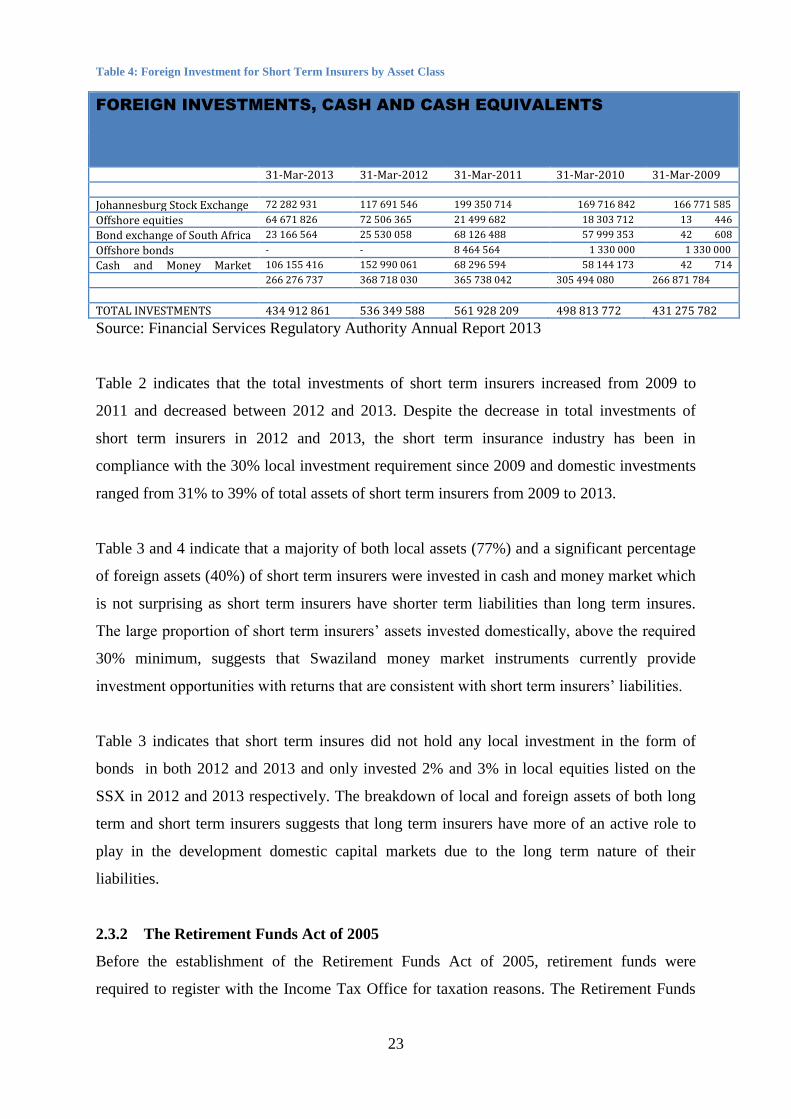
Table 2 indicates that the total investments of short term insurers increased from 2009 to
2011 and decreased between 2012 and 2013. Despite the decrease in total investments of
short term insurers in 2012 and 2013, the short term insurance industry has been in
compliance with the 30% local investment requirement since 2009 and domestic investments
ranged from 31% to 39% of total assets of short term insurers from 2009 to 2013.
Table 3 and 4 indicate that a majority of both local assets (77%) and a significant percentage
of foreign assets (40%) of short term insurers were invested in cash and money market which
is not surprising as short term insurers have shorter term liabilities than long term insures.
The large proportion of short term insurers’ assets invested domestically, above the required
30% minimum, suggests that Swaziland money market instruments currently provide
investment opportunities with returns that are consistent with short term insurers’ liabilities.
Table 3 indicates that short term insures did not hold any local investment in the form of
bonds in both 2012 and 2013 and only invested 2% and 3% in local equities listed on the
SSX in 2012 and 2013 respectively. The breakdown of local and foreign assets of both long
term and short term insurers suggests that long term insurers have more of an active role to
play in the development domestic capital markets due to the long term nature of their
liabilities.
2.3.2 The Retirement Funds Act of 2005
Before the establishment of the Retirement Funds Act of 2005, retirement funds were
required to register with the Income Tax Office for taxation reasons. The Retirement Funds
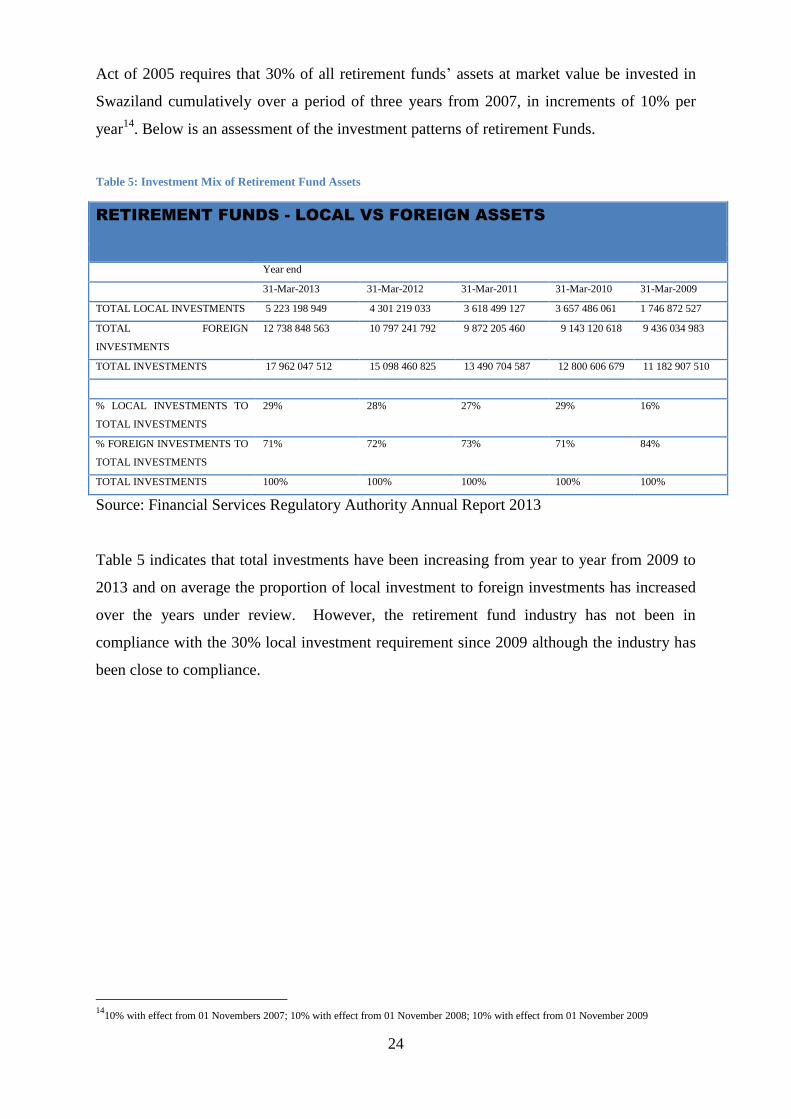
24
Act of 2005 requires that 30% of all retirement funds’ assets at market value be invested in
Swaziland cumulatively over a period of three years from 2007, in increments of 10% per
year14
. Below is an assessment of the investment patterns of retirement Funds.
Table 5: Investment Mix of Retirement Fund Assets
RETIREMENT FUNDS - LOCAL VS FOREIGN ASSETS
Year end
31-Mar-2013 31-Mar-2012 31-Mar-2011 31-Mar-2010 31-Mar-2009
TOTAL LOCAL INVESTMENTS 5 223 198 949 4 301 219 033 3 618 499 127 3 657 486 061 1 746 872 527
TOTAL FOREIGN
INVESTMENTS
12 738 848 563 10 797 241 792 9 872 205 460 9 143 120 618 9 436 034 983
TOTAL INVESTMENTS 17 962 047 512 15 098 460 825 13 490 704 587 12 800 606 679 11 182 907 510
% LOCAL INVESTMENTS TO
TOTAL INVESTMENTS
29% 28% 27% 29% 16%
% FOREIGN INVESTMENTS TO
TOTAL INVESTMENTS
71% 72% 73% 71% 84%
TOTAL INVESTMENTS 100% 100% 100% 100% 100%
Source: Financial Services Regulatory Authority Annual Report 2013
Table 5 indicates that total investments have been increasing from year to year from 2009 to
2013 and on average the proportion of local investment to foreign investments has increased
over the years under review. However, the retirement fund industry has not been in
compliance with the 30% local investment requirement since 2009 although the industry has
been close to compliance.
14
10% with effect from 01 Novembers 2007; 10% with effect from 01 November 2008; 10% with effect from 01 November 2009
25
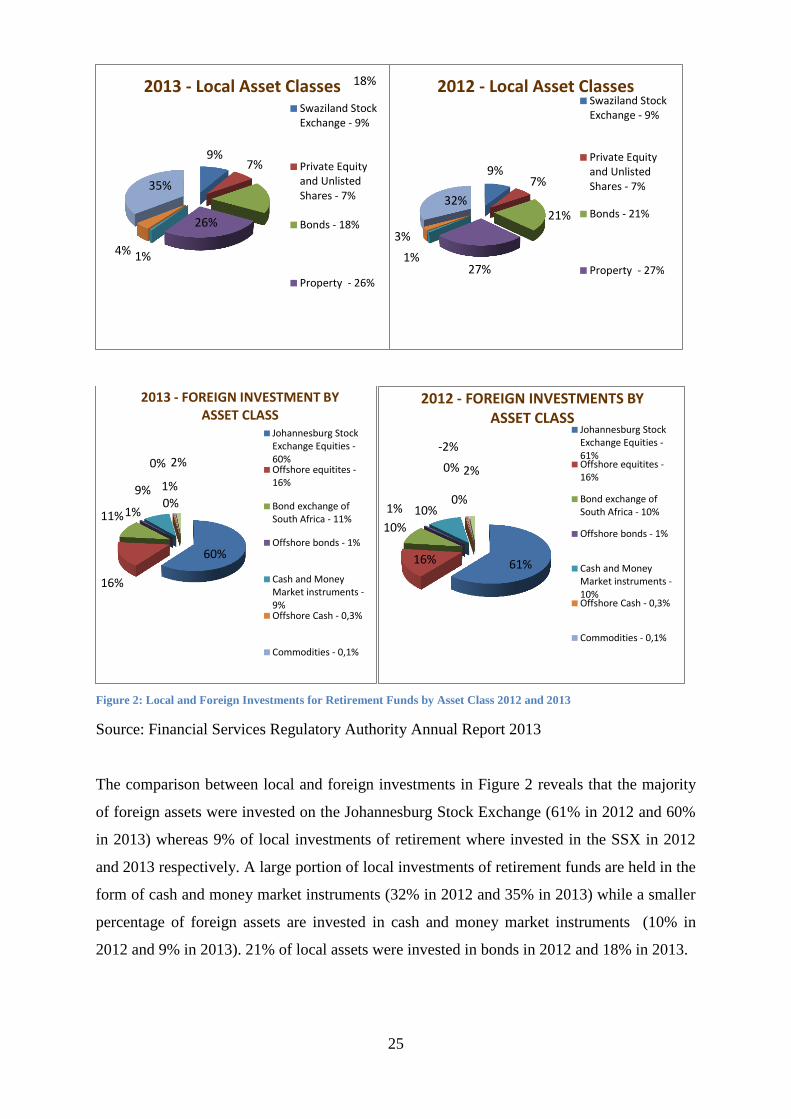
Figure 2: Local and Foreign Investments for Retirement Funds by Asset Class 2012 and 2013
Source: Financial Services Regulatory Authority Annual Report 2013
The comparison between local and foreign investments in Figure 2 reveals that the majority
of foreign assets were invested on the Johannesburg Stock Exchange (61% in 2012 and 60%
in 2013) whereas 9% of local investments of retirement where invested in the SSX in 2012
and 2013 respectively. A large portion of local investments of retirement funds are held in the
form of cash and money market instruments (32% in 2012 and 35% in 2013) while a smaller
percentage of foreign assets are invested in cash and money market instruments (10% in
2012 and 9% in 2013). 21% of local assets were invested in bonds in 2012 and 18% in 2013.
9% 7%
18%
26%
1% 4%
35%
2013 - Local Asset Classes Swaziland StockExchange - 9%
Private Equityand UnlistedShares - 7%
Bonds - 18%
Property - 26%
9% 7%
21%
27% 1%
3%
32%
2012 - Local Asset Classes Swaziland StockExchange - 9%
Private Equityand UnlistedShares - 7%
Bonds - 21%
Property - 27%
60%
16%
11% 1%
9%
0%
0%
1%
2%
2013 - FOREIGN INVESTMENT BY ASSET CLASS
Johannesburg StockExchange Equities -60%Offshore equitites -16%
Bond exchange ofSouth Africa - 11%
Offshore bonds - 1%
Cash and MoneyMarket instruments -9%Offshore Cash - 0,3%
Commodities - 0,1%
61% 16%
10%
1% 10% 0%
0%
-2%
2%
2012 - FOREIGN INVESTMENTS BY ASSET CLASS
Johannesburg StockExchange Equities -61%Offshore equitites -16%
Bond exchange ofSouth Africa - 10%
Offshore bonds - 1%
Cash and MoneyMarket instruments -10%Offshore Cash - 0,3%
Commodities - 0,1%
26
2.3.3 The Financial Services Regulatory Authority Act of 2010
The Financial Services Regulatory Authority (FSRA) was established through the Financial
Services Regulatory Act of 2010. It is responsible for the establishment and administration of
an integrated regulatory regime for the non-bank Financial Sector including capital markets,
retirement funds, insurance companies, saving co-operatives and building societies.
2.3.4 The Securities Act of 2010
The Securities Act of 2010 aims to encourage and facilitate the development of an orderly,
fair and efficient capital market in Swaziland.
2.3.5 Swaziland Revenue Authority Act of 2009
The Swaziland Revenue Authority (SRA) came into effect in 2009 through the Swaziland
Revenue Authority Act of 2008. SRA is a semi-autonomous agency responsible for
collection of all revenue on behalf of the Swaziland Government. The SRA Act of 2009 read
in conjunction with the Income Tax Order of 1975 has a provision for tax incentives which
promote retirement fund savings. However, the SRA Act of 2009 does not have provisions
for tax incentives15
which promote participation of corporations on the SSX specifically.
2.4 Domestic Retention Polices For Contractual Savings Institutions in Africa
The question of whether the domestic retention policies assist in developing capital markets
and whether the benefits outweigh the opportunity cost of such policies is debatable. Kenny
and Moss (1998) noted that African Governments can influence local interest in the stock
exchanges by creating incentives such as, tax incentives that encourage investment and
legally requiring institutional investors such as pension funds to invest in-country to increase
local liquidity. On the other hand Hearn and Piesse (2009) identified domestic retention
policies as one of the barriers to the development of SADC stock markets.
Other countries in Sub Saharan Africa16
have similar domestic retention limits to the 30%
local investment requirement for retirement funds and insurance companies in Swaziland.
Hearn and Piesse (2009) highlighted that domestic investment retention policies which are
implemented to encourage firms to list locally rather than list on much more attractive stock
markets such as the JSE may have a negative effect on domestic markets as they may deter
15Such incentives could be in the form of a reduction in corporate tax for companies that list of the SSX 16The domestic retention requirement for insurance companies and retirement funds is 35%, 30% and 100% for Namibia, Botswana and Kenya respectively
27
corporate listings altogether and reduce risk adjusted return because of the high cost of
capital. Hearn and Piesse (2009) suggest that the 35% domestic retention policy in Namibia
had little effect on reducing capital flight and retaining listings as over 67% of the listed firms
in Namibia migrated their primary listings to the JSE which decreased liquidity domestically
and increased the cost of capital.
In 2011, it was noted that there was an increase in the number of non-bank financial
institutions in Swaziland which was mostly attributed to the liquidity serge triggered by both
the Retirement Funds Act and Insurance Act of 2005, particularly the 30% domestic retention
requirement17
. The IMF is of the view that institutional investors have the potential to
contribute to the development of securities markets18
subject to the development of effective
trading systems, modern accounting and auditing standards and efficient information
disclosure. The 30% domestic investment requirement for retirement funds and insurance
companies in Swaziland has led to an injection of liquidity, specifically in the local banking
sector where institutional investors hold some assets as term deposits with minimal return.
However, in 2012 the Registrar of Insurance and Retirement Funds noted with concern that
assets invested as cash eventually found their way to South Africa and other foreign countries
due to the large proportion of foreign banks which dominate the banking sector in Swaziland
and that this defeats the purpose of the 30% domestic investment requirement19
.
2.5 Financial System Development and Economic Growth
The financial system is defined as a set of arrangements embracing the lending and
borrowing of funds by economic units and the intermediation of this function by financial
institutions. The definition for of financial system subsumes financial intermediaries and
financial markets which perform the crucial economic function of channelling fund from
surplus saving units to deficit saving units. A well-functioning financial system has the
following benefits for the economy: increased liquidity; more efficient diversification of
risks; reduction in transactional costs by decreasing information asymmetry; minimization of
systemic risk; and more efficient allocation of resources20
. Rousseau and Sylla (2001) suggest
that a good financial system is one that is made up of five components21
of which a well-
functioning securities market and banking sector are included. Most countries in Sub
17Swazi Observer, December 1, 2011, “ Weak Supervision in Financial Sector” 18
IMF(2008) Kingdom of Swaziland: Selected Issues and Statistical Appendix, IMF Country Report No. 08/355 19Times of Swaziland, March 5, 2012, “ RIRF to cut cash assets held by insurance players” 20Van Zyl, C. Botha, Z. and Skerritt, P. (Second Edition) Understanding South African Financial Markets, Second Edition., Pretoria. 21Sound public finances and public debt management; stable monetary arrangements; a variety of banks, some with domestics and others with foreign orientation or both; a central bank and a well -functioning securities market.
28
Saharan Africa excluding South Africa are still lagging behind in the area of well-developed
securities markets as pointed out by Hearn and Piesse (2009).
Theorists suggest that financial markets and institutions help firms overcome the problem of
asymmetric information, particularly the problems of moral hazard and adverse selection and
therefore reduce the firms cost of capital. Rajan and Zingales (1998) found that financial
markets and institutions reduce the cost of external finance for firms thus promoting
economic growth and the existence of a well-developed market in a certain country can
represent a competitive advantage for that country in industries that are more dependent on
external finance. Thus a well-functioning financial market which reduces transaction costs;
allows for effective production of information, allows for effective risk sharing and
minimizes systemic risk is desirable for economic growth. It appears that it would be in the
interest of most developing countries to build a foundation and implement policies that would
support the development of well-functioning financial systems.
The most consistent reason countries aim to promote financial development is because of the
perceived link between financial development and economic growth. It is important for
policy makers to appreciate the relationship between economic growth and financial
development as this may assist them in implementing policies for financial sector reforms.
Some literature and empirical studies over the past decades have inferred a nexus between
economic growth and financial system development. Greenwood and Jovanovis (1990)
established that growth and financial structure are interrelated and that growth provides the
assets to promote financial system development which in turn facilities higher growth. Levine
and Zervos (1996) present empirical evidence of a positive relationship between financial
development and economic growth. Greenwood, Sanchez and Wang (2013) applied a state
verification model to U.S. and cross country data in order to determine the importance of
financial development for economic growth and their findings suggested that financial
development, captured through financial sector intermediation, is significantly important for
economic growth.
However, the direction of causality between economic growth and financial development is
an ongoing debate. Patrick (1966) found that the direction of causality between financial
development and economic growth depends on the level of economic development and that at
a certain level of development; financial development will lead to economic growth and at a
29
certain level growth can pull finance. Greenwood et al (2013) suggest that a developing
country can increase its output by adopting the world’s best practice in the financial sector.
2.6 Role of a Stock Exchange in the Economy
Historically, a majority of African economies have been dependant on the banking sector for
external finance. However, African countries have shown an increased need for the
accelerated development of functioning, well organised capital markets which will foster
economic growth as noted in an African NEPAD round table discussion in 2009 where
African financial markets and economic growth were a topic of discussion. In roughly the last
two decades there has been a notable increase in the number of African stock exchanges as
part of the World Bank and IMF structural adjustment programmes which were fostering
stock market development in Sub Saharan Africa as a component of comprehensive
economic reform and financial liberalisation.
Hearn and Piesse (2009) identified three objectives for the establishment of a stock exchange
which include: diversification of ownership and promotion of privatisation programmes;
provision of a point of exit for venture capital firms seeking to liquidate their investment and
reduction of the cost of capital for listed firms. One of the main factors identified as deterring
the efficiency of African financial markets was the relatively narrow and illiquid financial
markets that exist in most African countries.
Marone (2003) highlighted that in small economies liquidity may be affected by the
dominance of a small number of firms in the market which may result in the manipulation of
stock prices. Further, a majority of firms in developing economies may not be in position to
issue shares which results in a small number of listed shares. Hearn and Piesse (2009) concur
that illiquid markets can hinder the price discovery process as illiquid markets lead to
information inefficiencies.
Advocates of stock exchanges in developing economies highlight the advantages for
diversification potential of stock exchanges in developing countries. Kenny and Moss (1998)
evaluated the economic criticisms of stock markets and they suggest that many African stock
markets may not appear to be attractive at face value because of the relatively small size,
illiquidity and often unstable political and economic environment; however these markets
have the potential to expand in response to improved regulatory and economic environment.
30
Kenny and Moss (1998) suggest that small stock exchanges can be beneficial to investors as
they present an opportunity for portfolio diversification and high growth potential. They
conclude that the positive economic effects of stock exchanges on economies in Sub-Saharan
Africa are greater than the negative effects. Hearn and Piesse (2009) also suggest that
counties like Swaziland and Mozambique have the potential for international investor
diversification due to their low correlation with global indexes; however for this opportunity
to be exploited they suggest an improvement in the liquidity of the stock exchanges.
Andrianaivo and Yarty (2010) state that despite the small size and low liquidity African stock
markets are very attractive in terms of risk and return. Prayag, du Toit, Kenmuir, Morrison
and Tembo (2010) investigated the impact of the inclusion of frontier market equities as a
separate asset class in a diversified portfolio which consists of developed market and
emerging market equities. The recommendation of the study was that equities of frontier
markets should be included in the diversified international portfolio of long term investors.
They argue that including frontier markets in a diversified portfolio may improve the risk-
return characteristic of the portfolio especially considering the increased extent of global
integration of emerging markets in the last few decades22
.
Minier (2009) compared the average growth experience of 54 countries that opened a stock
exchange between 1960 and 1998 to a priori similar countries that did not open an exchange
and found that countries that opened a stock exchange grew faster on average, than similar
countries that did not. Minier (2009) provides evidence that opening a small and relatively
illiquid stock exchange is still correlated with on-average higher rates of economic growth.
Minier (2009) suggests that the positive correlation between opening a stock exchange and
subsequent growth rates is due to more efficient allocation of resources.
2.7 Critics of Establishment of Stock Exchanges in Developing Countries
Critics of stock market establishment in developing countries argue that the benefits of
establishing stock exchanges in these countries at their current level of development do not
outweigh the costs. Singh (1999) considered the advantages and disadvantages of opening
stock markets in Sub-Saharan countries at the present stage of their development and
concluded that for most African countries the establishment of a stock exchange would be
costly and unnecessary especially considering their weak private sectors. This intuitively
22For a fuller discussion of the integration of emerging markets to global markets, see Harvey(1995a)
31
makes sense as mostly established firms’ access additional finance through stock exchanges.
Singh (1999) suggests that it is better to use scarce resources to improve the banking system
than establish a stock exchange in Sub Saharan African economies as most banking systems
in most of these economies are inadequate. Singh (1999) also suggests that the establishment
of a stock market in an economy with a weak banking sector could add to the instability of
the financial system and would most likely not meet the savings and investment needs of a
bulk of the workforce, especially those involved in informal activities or agriculture.
Marone (2003) studied the economic rationale for the establishment of the Lusaka Stock
Exchange and suggests that the Lusaka Stock Exchange does not have a significant effect on
the Zambian economy as a whole. He suggests that there is a scarcity of studies on the impact
of stock exchanges on African economies and that the creation of such exchanges may be a
premature project even though theoretically stock markets can boost savings through the
provision of alternative saving instruments that may better fit the risk and liquidity
requirements of investors. Marone (2003) points out that savings rates are mostly low in
small African economies and households still prefer to invest in assets that still keep their
intrinsic value even when there is monetary depreciation such as cattle. Marone (2003) also
suggests that the small number of listed companies in most Sub-Saharan economies limits the
domestic investors’ ability to diversify firm specific risk and makes investing in stock in such
markets very risky. Hearn and Piesse (2009) found that most investors would rather minimise
holdings in Swaziland or Mozambique and invest in South Africa or global markets due to
the volatility in stock prices in illiquid markets and highly illiquid markets fail to compensate
for the potential higher returns. Therefore, risk averse investor tend to demand high returns as
the risk of holding stocks in these economies are too high and by extension this results in an
increase in the cost of capital and discourages firms from selling shares as a way of raising
funds.
2.8 Relationship between the Banking Sector and the Stock Market
The question of whether developing countries should prioritise the development of stock
markets or the improvement of the banking sector is an ongoing debate. Historically the
banking industry in most African countries has been the most popular capital market and is
normally characterised by a high presence of foreign owned banks. Andrianaivo and Yarty
(2010) argue that indicators of banking industry financial depth in Africa are the lowest in
the world thus banks play a less than perfect role in African economies. This implies that
32
there is a place for stock exchanges in Africa to provide an avenue for firms to access
additional capital.
Andrianaivo and Yarty (2010), also indicate that banking systems in Africa are normally
concentrated due to the small market size of most African economies. The high concentration
of the banking sector could lead to a monopoly (price setters); hence the high concentration
of the banking sector could have a negative effect on the affordability of funds (higher
discount rate) and possibly lead to less investment opportunities exploited and less
production. In this case the presence of a stock exchange may be beneficial as the stock
exchange can compete with the banking sector to reduce the cost of capital.
On the other hand, Andrianaivo and Yarty (2010), also point out that the African banking
sector is relatively more profitable even though they are less efficient than other countries and
Hearn and Piesse (2009) point out that in most small African economies bank credit is still
cheaper than sourcing additional funds from the stock exchange.
The efficiency of the banking sector in a financial system is very important as banks play an
important intermediation role. Some literature23
indicates that stock market development and
banking sector development are highly correlated and initially stock market development is
supported by the banking sector through trade intermediation. However, as the stock market
develops it could compete with the banking sector. Demirguc-Kunt and Levine (1996) found
that majority of stock market development indicators are highly correlated with banking
sector development indicators. Therefore, one would expect countries with well-developed
banking sectors to have well developed stock markets.
Cihak, Demirguc-Kunt, Feyen and Levine (2012) found that securities markets are relatively
more important at a higher income level and that as the economy grows, the relationship
between economic activity and bank development tends to weaken and the relationship
between economic activity and securities markets development tends to strengthen. In other
words as income increases the additional economic activity related with bank development
decreases while the additional increase associated with an increase in securities markets
development rises. Intuitively this makes sense as countries with a low GDP per capita are
more likely to have a lower savings rate than countries with higher GDP per capita. Hearn
and Piesse (2009) identified poverty as one of the barriers to the development of SADC stock
23See Dermirguc-Kunt and Levine (1996)
33
markets and due to poverty, saving rates as a proportion of GDP are relatively low in these
countries which results in less public participation in securities markets.
2.9 Role of Bond Market
Domestic bond markets are divided between government bond market and corporate bonds
market. Thumrongvit, Kim and Pyun (2013) point out that a majority of literature on
economic growth have disregarded the role of the bond market because bond financing is
subsumed as an element of debt financing24
and whilst stocks are traded at exchanges where
their price discovery process can be analysed by trading data, bonds are traded over the
counter, where transaction data and microstructure of markets are publicly available.
Major investors of bonds in most economies are retirement funds, long term insurance
companies, banks and mutual funds. Thumrongvit et al (2013) highlight that ,especially for
developing countries, the following issues are specified in support of bond market
development: (a) the elderly population for whom a large portion of retirement investments
are to be invested in low risk and highly liquid bond markets (b) promotion of an information
clearinghouse for bonds in order to improve understanding of the microstructure of the bond
market and (c) promotion of transparency and efficiency in the bond market by ensuring a
stronger regulatory environment for governance and disclosure.
Thumrongvit et al (2013) used a panel of 38 countries to assess the relationship between
economic growth and the stock market, banks and the bond market. They found that both
stock market and banking promote economic growth, however, they also found that
government bonds are negatively related to economic growth and the results of corporate
bonds are statistically insignificant. Thumrongvit et al (2013) suggest that the negative
relationship between government bonds and economic growth is logical as an increase in
government spending actually decreases funds available to the private sector25
and a majority
of government spending is on public goods such as national defence and the costs are not
reflected in the benefits on society receives. Thumrongvit et al (2013) suggest that the finding
that the relationship between corporate bonds and economic growth is statistically
insignificant can be explained by the fact that bond markets worldwide are still dominated by
government bonds and the corporate bonds markets is very small relative to the government
24
Debt financing in most economies was historically dominated by banks 25
The crowding effect of government borrowings that reduces the level of corporate borrowing
34
bond market and the increases of new issues of corporate bonds are not followed by
corresponding trading in the secondary market where trading is not as transparent.
Thumrongvit et al (2013) also stress the importance of bond markets as they set the
benchmark interest rates for all debt instruments with varying maturities and risk
(encouraging the efficient use of resources). Bond markets are also anticipated to grow in
developing countries as they can be a defence measure against financial crisis. They further
point out that in the absence of bond markets, banks could end up having excess deposits
which may lead them to make suboptimal loans and result in inefficient allocation of
resources.
Using quarterly data, Fink, Haise, Kirchner, and Moser (2006) examined the correlation
between net issue value of aggregate bonds, as well as the different bond sectors separately,
and economic growth . They found that on sector level causalities run from economic growth
to public sector bonds and from corporate and financial institution bonds to economic growth.
Despite the direction of causality the findings reveal a positive relationship between bond
markets and economic growth. Fink et al (2006) point out that financing through public
bonds especially, is a transmission channel for monetary policy for the public sector and a
more restrictive monetary policy reduces the supply of bank loans which causes the private
sector to explore other forms of debt capital. They also point out that public sector bonds can
be used for investment diversification as they are mostly secure and liquid assets.
2.10 Role of Institutional Investors in the Development of Stock Exchanges
Institutional investors are considered one of the most important streams of private and public
savings which supply capital to firms. Hearn and Piesse (2009) highlight the importance of
institutional investors for African capital markets, particularly pension and insurance
companies, as they can create a demand for more long term investments in order to diversify
their risks and the lack of institutional investors in most African countries was identified as a
barrier to the development of stock exchanges. Catalan et al (2000) indicated that contractual
savings increase supply of long term funds and develop capital markets in an economy
because contractual savings institutions have long term liabilities on their balance sheet and
they have an advantage over banks in financing long-term ventures26
. Catalan et al (2000)
found that the countries with more developed contractual savings sectors also had more
26Due to the long term nature of their liabilities of contractual savings institutions their investment policies are more likely to be biased towards equities and long term bonds.
35
developed stock markets and the countries where contractual savings grew the most are also
the countries that experienced the highest growth in market capitalisation. However, a
majority of Sub Saharan countries interested in developing contractual savings typically have
underdeveloped capital markets which are small and illiquid. This presents a challenge for
contractual savings institutions when scouting for lucrative investment opportunities
domestically.
Catalan et al (2000) suggest that there are still substantial benefits from developing the
contractual savings sector even if capital markets are underdeveloped. They suggest that in
countries with underdeveloped capital markets, contractual saving institutions could invest in
long term loans, corporate bonds, government securities and foreign securities while
developing domestic capital markets. However it must be noted that investment in foreign
securities may hinder the development of domestic capital markets. Domestic retention
policies could assist in preventing excessive capital flight and ensure that a portion of the
resources of domestic contractual savings institutions are channelled towards the
development of the domestic financial system. However, should a domestic retention policy
be enforced, policy makers need to assess whether such a policy would result in an inefficient
combination of risk and return and, whether the opportunity costs of such a policy are
substantial.
The IMF is of the view that non-banking financial institutions such insurance companies are
likely to encourage competition, improve financial information, stimulate financial
innovation and strengthen corporate governance and regulation, however, the challenge
remains finding the correct channels to put these resources to productive uses27
. Raddatz and
Schmukler (2008) highlight that one of the key motivations for pension reforms is the
expectation that pension funds will play a role in the development of domestic capital
markets in a broader strategy to develop a more developed financial system.
Pension funds in Chile face regulatory requirements28
to invest a fraction of assets in the
domestic economy and they are expected to invest in domestic assets and diversify risk as
much as possible within the country. A majority of Eastern Europe and Latin American
countries developed regulations that prohibit pension funds to invest abroad. The Chile
27IMF(2008) Kingdom of Swaziland: Selected Issues and Statistical Appendix, IMF Country Report No. 08/355 28The legislative requirement for pension fund to invest a portion of assets domestically is also prevalent in some countries in sub Saharan
Africa including Swaziland, Namibia and Botswana.
36
pension fund industry was created in 1981 and investments abroad were only allowed in
1990. The limit is set by the Central Bank and has been increasing steadily since29
. Berstein
and Chumacero (2006) point out that the prohibition of foreign investments has been
changing in some countries30
as the pension system mature. The trend towards an increase in
foreign investment limits could reflects the growing importance of foreign investments for
diversification. Berstein and Chumacero (2006) assessed the effects of the regulation on
investment restrictions31
that prevents pension funds in Chile from choosing their portfolio
allocation and found that that the regulation entails an inefficient combination of risk and
return and that the cost of such regulations may be substantial.
Raddatz and Schmukler (2008) assessed how pension funds affect capital market
development in Chile, particularly, the secondary market by assessing pension fund
investment patterns and constraints. They found that the patterns found in the study do not
support the idea that pension funds are drivers of overall capital market development.
Raddatz and Schmukler (2008) also found that pension funds in Chile exhibited low turnover
of securities which does not support the idea that they significantly increase liquidity in the
secondary market. They suggest that the low turnover may be due to limited investment
opportunities which results in pension funds purchasing securities and holding them up to
maturity rather than sell them in an illiquid secondary market. Raddatz and Schmukler (2008)
also found that most pension funds hold a large fraction of their assets in instruments that are
easily liquidated such as bank deposits and short term instruments among fixed-term
securities which does not support the idea that they help provide long term financing in the
economy.
It is important that retirement funds invest in a prudent manner which takes their long term
liabilities into consideration and this task normally requires an in depth knowledge of
financial markets which most retirement fund trustees lack. Most retirement funds use the
services of professional asset manager to help them invest their assets. However, Raddatz
and Schmukler (2008) suggests that there may be conflict between the goals of retirement
funds to yield high long term returns while on the other hand asset managers must yield
reasonable short term returns to keep attracting investors and retain clients. They also suggest
that while pension funds are perceived to be long term investors, they are more of asset
29The investment limit on foreign securities and investments abroad were increases 30% in 2004 and these limits were reached by end 2005. 30Pension reform in Mexico started in 1997 and a regulation of investments abroad was issued in 2000 with a limit of 20% of pension fund
assets and the investment limit on foreign securities was increased to 30% in 2004 in Chile. 31The Law stipulates a range of maximum percentages of fund assets that can be invested in each instrument.
37
managers than asset liability managers32
. Singh (1999) points out that domestic institutional
investors with long term liabilities have the potential to play an important role in the
development of local capital markets, however, asset managers whose services institutional
investors use, are highly competitive and their performance is judged over a relatively short
term which could lead to short termism.
2.11 Institutional Structures and Stock Exchange Development
Marone (2003) pointed out that the stock market is not an institutional island and it requires a
favourable political, economic and regulatory environment for it to flourish. Thus in order to
identify impediments to the development of the stock exchange, macroeconomic and
institutional factors that affect the development of the stock exchange need to be assessed for
effective policy implementation that promotes development of the financial system as whole.
Ladekarl and Zervos (2004: 267) hypothesize that “the determination of whether a country is
investable or not is influenced by a number of factors especially related to the size,
‘housekeeping’ (macro – policies, political economy, local financial markets, corporate
governance, etc.) and efficiency of ‘plumbing’ (legal and regulatory framework, custody,
clearing and settlement, taxes, etc.)”. It appears appropriate for developing countries to
assess the underlying size, ‘housekeeping’ and ‘plumbing’ factors specific to them before any
policy recommendations can be made.
Demirguc-Kunt and Levine (1993) indicate that stock market development can be assessed
using the following traits: (1) traditional characteristics, which include market capitalisation,
the amount of new capital raised through stock offerings, the number of listed companies and
turnover; (2) institutional characteristics, which include regulations, information disclosure,
transparency rules and trading costs and (3) asset pricing characteristics, which is the
effectiveness with which the market prices risk and the degree of integration into the world
stock markets. The traits highlighted by Demirguc-Kunt and Levine (1993) as characteristics
of stock market development have similarities to the factors highlighted by Ladekarl and
Zervos (2004) for determining whether a country is investable or not.
32
Asset- liability managers seek returns that are consistent with their long term liabilities e.g. annuity providers and defined benefit pension
funds.

38
Ladekarl and Zervos (2004: 267) indicate that from the foundation of their paper “the most
profound effects on investment flow, or the required minimum expected return arise from
advances or declines in macro-policies”. However, they further indicated that “at the margin,
improvement can be made in country policies that will, for a given macro situation, improve
the ability of a country to attract international investment flows”. Thus, it appears that
appropriate capital markets legislation can go a long way in fostering a sound securities
market even though in certain circumstances macro – policies may not be as enabling.
39
3 CHAPTER 3: METHODOLOGY
3.1 Introduction
This chapter focuses on the methodology used to carry out the research. The chapter begins
with a restatement of the problem statements for ease of reference. The stochastic model used
and the research design and analysis are also extensively elaborated on in this chapter. The
limitations of the research approach and methodology are highlighted at the end of this
chapter. The research is primarily quantitative with a smaller qualitative aspect.
3.2 Problem Statements
a) Problem statement 1: There is a poor linkage between the intentions of the 30% domestic
investment requirement stipulated in both the Retirement Funds Act and the Insurance Act of
2005 and the development of the SSX, specifically the public equity market. Currently the
impact of the 30% domestic investment requirement on the SSX has not been assessed thus
there is no empirical evidence regarding the financial impact these Acts on the SSX in
particular.
b) Problem statements 2: The stock exchange is underdeveloped and there are certain
impediments that exist to its development. Hearn and Piesse (2009) found that the SSX is a
small and illiquid stock exchange which is still underdeveloped. In theory a well-organized
stock exchange is instrumental in mobilising capital in an economy by connecting those who
need capital with providers of capital. It is questionable whether the SSX is currently carrying
out its intended purpose efficiently.
3.3 Population and Research Sample
3.3.1 Qualitative Sample
The qualitative primary data was collected through questionnaires administered to key
industry players which include stock brokers and SSX personnel. Swaziland has a total
population of two stock brokers. One broker responded to the questionnaires and this sample
represents 50% of the population. This may result in the problem of bias as the views of only
one broker will be considered for the purposes of this research.
The element of biasness due to the small population of brokers is countered by administering
a similar questionnaire to personnel of the SSX who are expected to have a broader insight on
capital markets.
40
3.3.2 Quantitative Sample
The sample for the quantitative study is drawn from 2006 to 2012 (7 years). Quarterly data is
utilised for the study which consists of a sample of 28 observations. The basis for the
selection of this data sample is highlighted below:
a) Schedule 1 of the Retirement funds Act of 2005 and Schedule 3 of the Insurance Act of
2005 stipulate that 30% of all assets of retirement funds and insurance companies be invested
locally at market value over a period of 3 years in increments of 10% in 2007, 20% in 2008
and 30% in 2009. The first assumption is that as at 01st November 2009 a majority of the
regulated entities were close to compliance or had already complied with the 30% domestic
retention requirement. This assumption is supported by information from the RIRF Annual
Report for 2009 which indicates that l9% of retirement fund assets and 41.5% of local
insurers assets were invested locally.
b) The second assumption is that prior to 2009, regulated entities where nowhere near
compliance with the 30% domestic investment requirement. This assumption is supported by
the RIRF Annual Report for 2008 (the first published report) which reveals that a meagre 7%
of retirement funds’ assets were invested in Swaziland in 2008. The study assumes that
compliance towards the 30% domestic retention requirement before 2009 was negligible and
the observations in this period are considered to be before compliance with of the 30%
domestic retention requirement in 2009.
3.4 Research Design
The research is primarily quantitative in nature with a smaller qualitative aspect. The research
approach considers the impact of the 30% domestic investment requirement on the
development of the SSX, specifically the public equity markets, as a platform for asset
allocation. The research also considers the current impediments to the development of the
stock exchange. The evaluation of the study has a domestic focus. This section provides a
description of the nature of the study and the research design used to answer the research
questions.
41
3.4.1 Qualitative Research Design
The qualitative primary data was collected through questionnaires administered to key
industry players which include stock brokers and key personnel of the SSX.
The questionnaire completed by the stock brokers and SSX personnel includes questions on
their professional opinion of the main impediments to the development of the SSX and their
opinion on the impact, if any, of the 30% domestic retention requirement stipulated in both
the Retirement Funds Act and the Insurance Act of 2005 on the development of the SSX. The
questionnaire administered to the personnel of the SSX is similar to the questionnaire
administered to stock brokers.
The primary qualitative data is supplemented by secondary qualitative data obtained from the
SSX Development Reports, RIRF Annual Reports, Central Bank of Swaziland Annual
Reports, FSRA Annual Reports and World Bank and IMF Reports on Swaziland. The
qualitative aspect of the study complements the findings of the quantitative study.
3.4.2 Quantitative Research Design
The quantitative research encompasses the use of a quasi-experimental time series design
which involves making a series of observations and introducing an intervention, which is the
30% domestic retention requirement, and then making additional observations.
a) The Intervention
The intervention for the purposes of this study is the legislative requirement stipulated in both
the Retirement Funds Act and Insurance Act of 2005 which stipulate that from 1 November
2009 onwards, 30% of all retirement funds’ and insurance companies’ assets should be
invested in the Swaziland domestic economy at market value. Thus, for the purposes of this
study the intervention date is 1 November 2009.
Historically, the majority of institutional investors, such as retirement funds, insurance
companies and collective investment schemes (unit trusts) have held their investments
outside Swaziland, especially in neighbouring South Africa due to the lack of investment
opportunities locally and the lack of depth of domestic capital markets. Swaziland is a
member of the Common Monetary Area (CMA), which provides for the free movement of
capital within member states, which are Lesotho, Namibia, Swaziland and South Africa.
42
The regulator of the non-bank financial institutions in Swaziland (FSRA) has the task of
enforcing and monitoring compliance of regulated entities with the 30% domestic investment
requirement stipulated in both the Retirement Funds Act and the Insurance Act of 2005. The
purpose of the 30% domestic investment requirement has a developmental focus as it aims to
increase liquidity of the domestic financial markets in order to improve the performance of
the Swaziland economy as a whole, particularly financial markets. One of the aims of the
30% domestic investment requirement is the development of domestic capital markets as
retirement funds’ and insurance companies’ assets are generally of a long term nature.
b) Design
The research design for the quantitative research is both descriptive and quasi-experimental
and considers the potential causal relationship between stock market developmental
indicators and time, prior and after the implementation of the 30% domestic retention
requirement in 2009.
A quasi-experimental design is an empirical study used to estimate the impact of an
intervention on a dependant variable. A quasi experiment design is chosen over traditional
experimental design as randomization or identification of a control group is impractical for
the purposes of this study. Grim Shaw et al (2003) highlighted that a type of quasi-
experimental design called interrupted time series studies can provide a robust method of
measuring the effect of an intervention such as a change in policy when randomization and
control groups are impractical.
The type of quasi-experimental design used for the study is an interrupted time series design.
Interrupted time series studies use data collected at regular equally spaced intervals of time
before and after an intervention to measure the effect of an intervention. The interrupted time
series design is used to assess movements of variables under consideration over time both
before and after the implementation of the intervention (30% domestic investment
requirement) in order to assess whether there is an obvious change. This approach has been
used to estimate the effect of a variety of policy issues in various fields such as financial
economics, Ho and Wan (2002).
43
3.5 Instrumentation
3.5.1 Sources of Data
a) Financial Services Regulatory Authority (FSRA)
Data on investment patterns of insurers and retirement funds with regard to the 30% domestic
investment requirement was sourced from the RIRF and FSRA Annual Reports. Quarterly
Data on stock exchange development indicators such as market capitalisation and value
traded was sourced from the Capital Markets Division under FSRA. The data obtained from
the FSRA is considered credible as the FSRA are the Regulators of the non-banking financial
sector in Swaziland and they are bound by prudential governance requirements to maintain
and collect accurate data for the industry.
b) The Swaziland Stock Exchange (SSX)
Data on the past performance and development challenges of the SSX is sourced from the
SSX Annual Development Reports. Additional data is sourced from questionnaires
administered to SSX personnel by the researcher.
The SSX is currently under the FSRA which is the regulator of non-bank financial
institutions and data from the FSRA is deemed credible as they are bound by prudential
governance requirements which include accurate reporting of the SSX performance and
development indicators. The personnel of the SSX are deemed to have in depth knowledge of
domestic capital markets.
c) Stock Brokers in Swaziland
Qualitative data on the impediments to the development of the SSX and comments on the
perceived effect, if any, of the 30% domestic retention requirement is sourced from
questionnaires administered to stock brokers.
Brokers are mostly the vehicles for trading on the secondary markets and the development of
the SSX would be to their benefit. Brokers are expected to have an advanced understanding
on the current position of the SSX. There are currently two stock brokers who are licensed to
operate on the SSX33
. One broker completed the questionnaire for the purpose of this study.
33African Alliance Swaziland Securities Ltd, Swaziland Stockbrokers Ltd.
44
d) The Central Bank of Swaziland
The data on the domestic economic indicators, namely GDP and inflation rates are obtained
from the Central Bank of Swaziland, which produces annual data on the performance of the
Swaziland economy.
3.5.2 Dependant Variables
The dependant variables consist of stock market development proxies. Stock market
development covers a variety of issues, such as the market’s ability to mobilise saving and
investment risk. It is not possible to capture all the functions of the stock market in a single
measurement. Literature highlights the size of the stock market, as well as the liquidity, as
important components in its ability to stimulate economic growth. Therefore, for the purposes
of this study, three stock market development indicators are used. Below are is a list of the
three proxies for stock market development which are used as dependant variables for the
purposes of this study.
a) Market capitalization to GDP ratio: This variable measures the size of the stock market
relative to the economy (market capitalisation divided by GDP). This variable provides a
measure of the amount of finance the market is capable of providing.
b) Value of stock traded to GDP ratio: This variable is a measure of stock market liquidity
and its measures the value traded, relative to the size of the economy (GDP).
c) Value of stock traded to market capitalisation (turnover ratio): This variable measures the
value traded relative to the size of the market. This ratio is equal to the total value traded
divided by market capitalisation.
3.5.3 Independent variables
The independent variable in the segmented regression analysis is time. The segmented
regression model fits a least of squares regression line for each segment of the independent
variable, time, and therefore assumes a linear relationship between time and the outcome of
each segment. The independent time variable will be broken down into segments listed
below:
Time (X1): This will be numbers starting from 1 onwards for each of the observations and
reflects the number of quarters from the start of the series.
45
Intervention (X2): This will consist of dummy variables. The number 0 is assigned to
quarterly observation before the intervention took place and the number 1 is assigned to
quarterly observations after the intervention.
Time after intervention (X3): This will be numbers starting from 1 onwards, from the time of
intervention for each quarterly observation. The numbers from 1 onwards reflect the number
of quarters from the time of the intervention until the end of the series.
3.5.4 Estimation of Quarterly GDP
Two of the dependant variables are defined as a percentage of GDP figures however in
Swaziland GDP figures are only available on an annual basis. For the purposes of this study
the researcher decided not to use extrapolation methods to get quarterly GDP figures as the
real GDP figures ranged from approximately SZL12000 million to SZL 13000 million in the
period under review. Based on the relatively constant real GDP over the years under review
we assume that dividing the market capitalization and turnover value by real GDP will be
similar to dividing by a constant. Thus, for the purposes of this study we assume that GDP is
a constant and will not affect the trend of market capitalization and turnover value.
3.5.5 Data Limitations
The Central Bank of Swaziland currently only publishes annual GDP figures and the research
required quarterly real GDP figures.
Swaziland currently has a population of only two stock brokers and only one of the brokers
agreed to complete the questionnaire. The small population and sample population decreases
the significance of the primary qualitative data obtained from the questionnaire.
3.6 Data Analysis
3.6.1 Descriptive Research Design
Descriptive research is used to assess trends in variables under investigation. The type of
descriptive study used is a longitudinal study. For the descriptive research, a continuous panel
whereby repeated measurement of the same variables was used. The descriptive research
includes an analysis of the casual relationship of variables visually represented on graphs.

46
3.6.2 Segmented linear regression
A segmented regression analysis is used to analyse the results of this study. Segmented
regression analysis is a statistical method for estimating intervention effects in interrupted
time series design. The segmented regression analysis was deemed more appropriate for this
study as is it simpler compared to the alternative ARIMA model which requires a long time
series with at least 100 points and it is also less flexible and not fit for the purposes of
evaluation of the effect of policies Legarde (2012).
The statistical software used to run the model is STATA. The following segmented
regression equation fits a least of squares regression line to each segment of the independent
variable, time:
Yt = + * time + * intervention + * time after intervention + et
Where:
Time is a continuous variable indicating time in months at time t from the start of the
observation period. Time is therefore the number of quarters from the start of the series.
Intervention is an indicator of the time, t, when the 30% domestic retention requirement is
implemented. Intervention is a dummy variable taking the values 0 in the pre- intervention
segment and 1 in the post-intervention segment.
Time after intervention is a continuous variable counting the number of quarters after the
intervention at time, t. Time after intervention is 0 in the pre-intervention segment and counts
the quarters in the post-intervention segmented at time t.
OLS estimators’ interpretations:
β0 estimates the baseline level of the outcome, t, at time zero
β1 estimates the change in Y that occurs with each quarter before the intervention (baseline
trend)
β2 estimates the level of change in Y during the quarter of the intervention
β3 estimates the level of change in Y after the intervention
A 95% confidence interval is used, which gives an interval where we are 95% confident β
will lie. If the p-value is less than 5% (0.05) then we conclude that B is not equal to zero and
there is strong evidence that that the independent variable has significant power in explaining
the dependant variable. The p-value and the OLS parameter estimates are used to assess
47
whether the independent variable is significant in explaining the dependant variable and to
what extent. The results consist of three regression output tables for each of the dependant
variables, namely: market capitalisation as a percentage of GDP, value traded as a percentage
of GDP and turnover ratios.
3.6.3 Threats to Internal Validity
Time series data sometimes exhibit seasonal fluctuations (secular trends). In time series
segmented regression analysis, error terms of consecutive observations can be often
correlated.
Quasi-experimental estimates of impact can be subject to contamination by confounding
variable. The lack of randomization in quasi-experimental design method makes it more
difficult to rule out confounding variables. To account for possible biases the following issues
are taken into account in the study:
Other legislative changes that may have had an effect on the dependant variables in the
period under review are considered. Based on an analysis of the recent legislation in Chapter
2 of this research paper the researcher assumes that none of the legislative changes that where
effected in the period under consideration could have had a significant effect on the
dependant variables besides the 30% local investment requirement stipulated in both the
Insurance Act and the Retirement Funds Act of 2005.
The Securities Act of 2010 and the FSRA Act of 2010 are expected to have a positive effect
on investor confidence in capital markets in Swaziland and by extension the SSX. However,
the legislative body responsible of for the enforcement of these Acts was established in 2012
and the effects of these policies on investor confidence are expected to have a lag effect.
Thus, the study reasonably assumes that these Acts had no significant impact on the
development of the SSX between 2006 and 2012.
GDP per capita was included as an additional variable that could affect Yt in the specification
on page 46. The addition of GDP per capita as an independent variable did not improve the
model and it was subsequently not included in the model. The regression results are reported
in appendix 2 of the research paper.
48
The number of firms listed on the SSX will not be kept constant for the period under
consideration. However, all new listing and exits of companies on the SSX will be taken into
consideration in the analysis of the data.
3.6.4 Threats to External Validity
The use of quasi-experimental designs minimizes threats to external validity as they do not
have the same problems of artificiality as compared to randomised experiments.
Ethical Issues
The researcher communicated to the research participants that the research that is being
undertaken is solely for academic purposes and the results will not be published or
reproduced for any other purpose other than academia. Data obtained from the SSX and the
stock brokers through questionnaires will be treated with confidentiality, including employee
privacy.
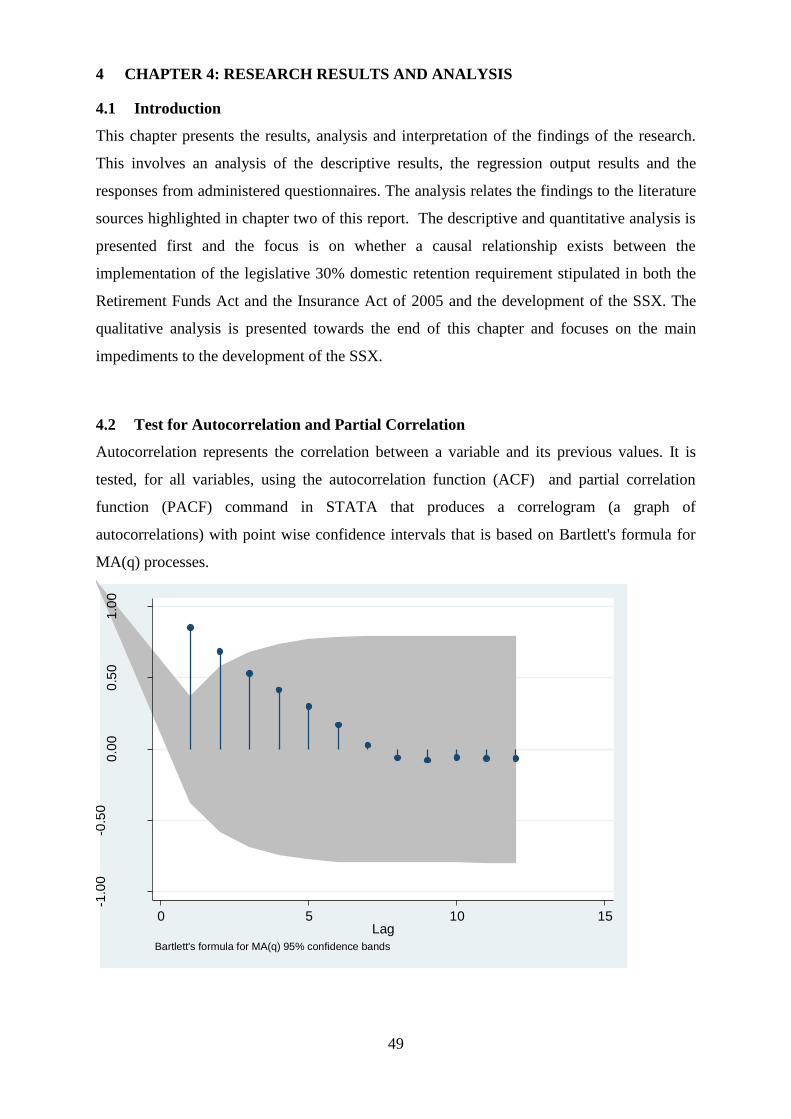
49
4 CHAPTER 4: RESEARCH RESULTS AND ANALYSIS
4.1 Introduction
This chapter presents the results, analysis and interpretation of the findings of the research.
This involves an analysis of the descriptive results, the regression output results and the
responses from administered questionnaires. The analysis relates the findings to the literature
sources highlighted in chapter two of this report. The descriptive and quantitative analysis is
presented first and the focus is on whether a causal relationship exists between the
implementation of the legislative 30% domestic retention requirement stipulated in both the
Retirement Funds Act and the Insurance Act of 2005 and the development of the SSX. The
qualitative analysis is presented towards the end of this chapter and focuses on the main
impediments to the development of the SSX.
4.2 Test for Autocorrelation and Partial Correlation
Autocorrelation represents the correlation between a variable and its previous values. It is
tested, for all variables, using the autocorrelation function (ACF) and partial correlation
function (PACF) command in STATA that produces a correlogram (a graph of
autocorrelations) with point wise confidence intervals that is based on Bartlett's formula for
MA(q) processes.
-1.0
0-0
.50
0.0
00
.50
1.0
0
Au
tocorr
ela
tio
ns o
f m
c1
0 5 10 15Lag
Bartlett's formula for MA(q) 95% confidence bands
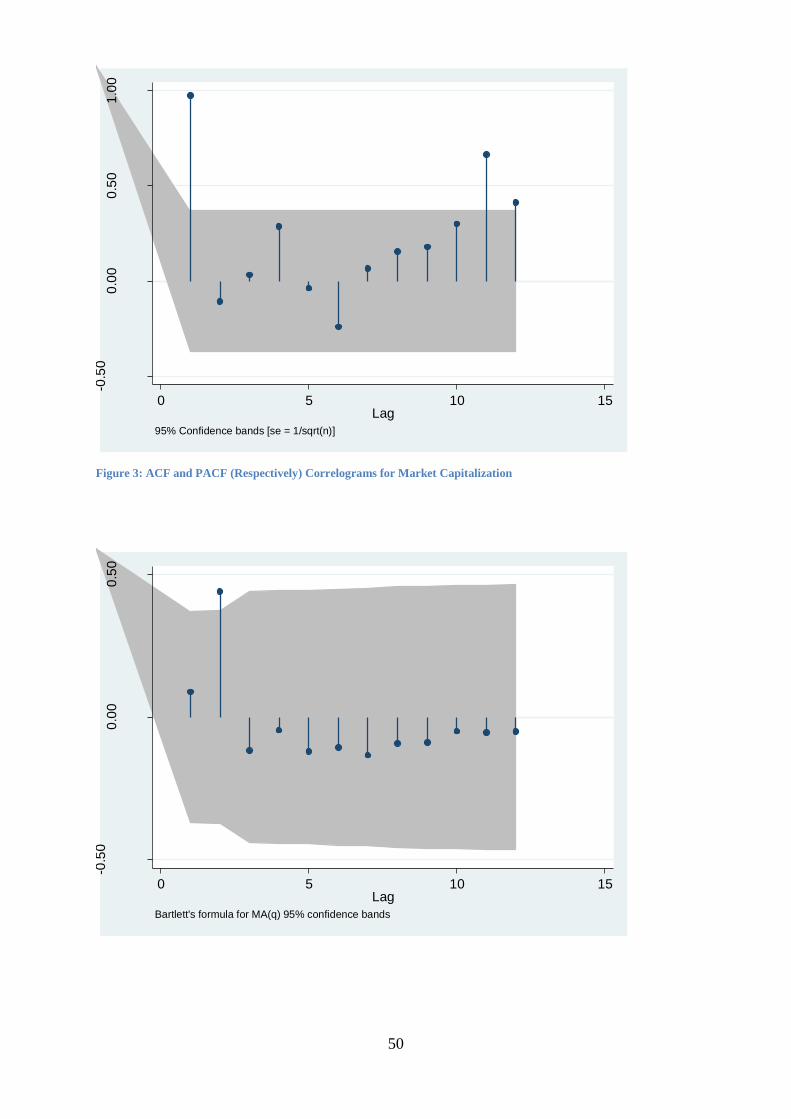
50
Figure 3: ACF and PACF (Respectively) Correlograms for Market Capitalization
-0.5
00
.00
0.5
01
.00
Pa
rtia
l a
uto
co
rre
lation
s o
f m
c1
0 5 10 15Lag
95% Confidence bands [se = 1/sqrt(n)]
-0.5
00
.00
0.5
0
Au
tocorr
ela
tio
ns o
f tv
1
0 5 10 15Lag
Bartlett's formula for MA(q) 95% confidence bands
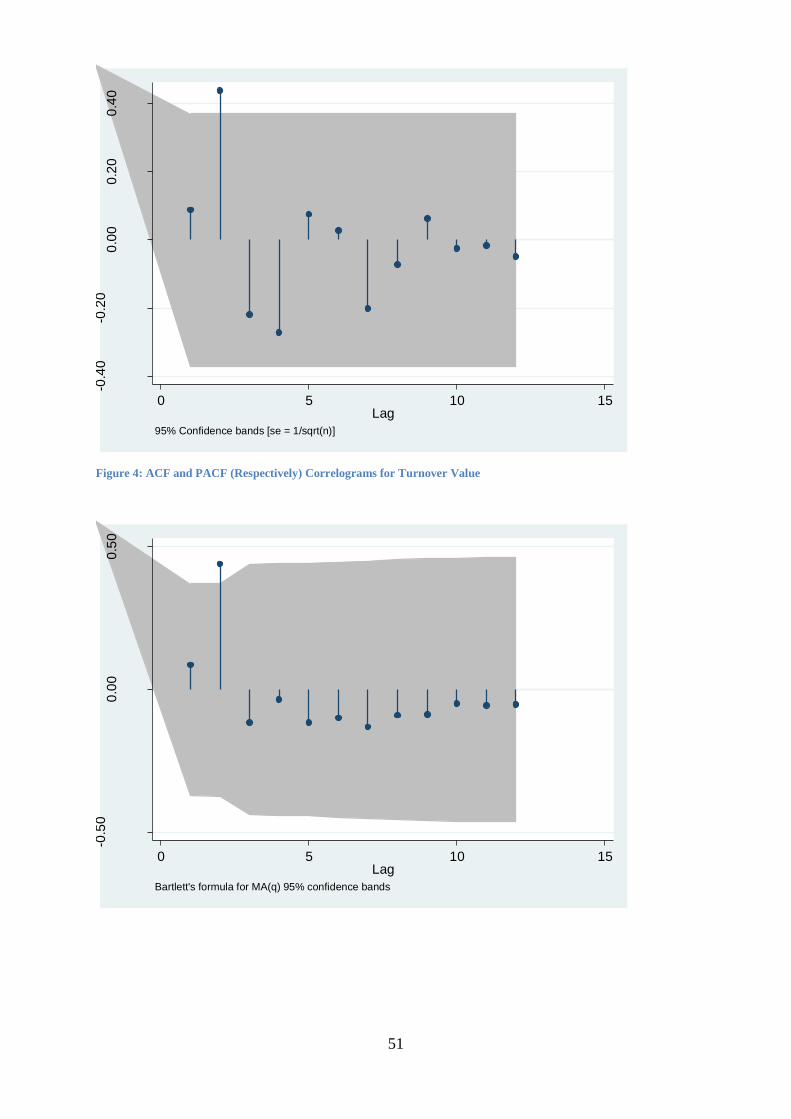
51
Figure 4: ACF and PACF (Respectively) Correlograms for Turnover Value
-0.4
0-0
.20
0.0
00
.20
0.4
0
Pa
rtia
l a
uto
co
rre
lation
s o
f tv
1
0 5 10 15Lag
95% Confidence bands [se = 1/sqrt(n)]
-0.5
00
.00
0.5
0
Au
tocorr
ela
tio
ns o
f tv
mc
0 5 10 15Lag
Bartlett's formula for MA(q) 95% confidence bands
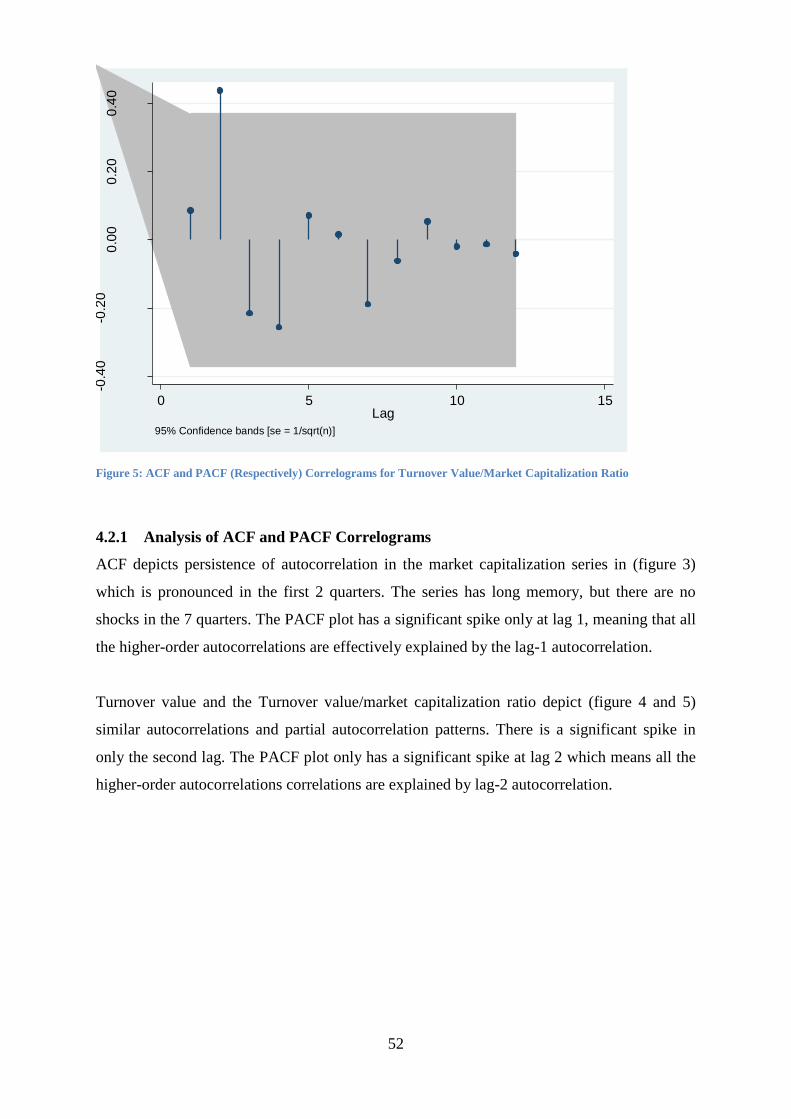
52
Figure 5: ACF and PACF (Respectively) Correlograms for Turnover Value/Market Capitalization Ratio
4.2.1 Analysis of ACF and PACF Correlograms
ACF depicts persistence of autocorrelation in the market capitalization series in (figure 3)
which is pronounced in the first 2 quarters. The series has long memory, but there are no
shocks in the 7 quarters. The PACF plot has a significant spike only at lag 1, meaning that all
the higher-order autocorrelations are effectively explained by the lag-1 autocorrelation.
Turnover value and the Turnover value/market capitalization ratio depict (figure 4 and 5)
similar autocorrelations and partial autocorrelation patterns. There is a significant spike in
only the second lag. The PACF plot only has a significant spike at lag 2 which means all the
higher-order autocorrelations correlations are explained by lag-2 autocorrelation.
-0.4
0-0
.20
0.0
00
.20
0.4
0
Pa
rtia
l a
uto
co
rre
lation
s o
f tv
mc
0 5 10 15Lag
95% Confidence bands [se = 1/sqrt(n)]
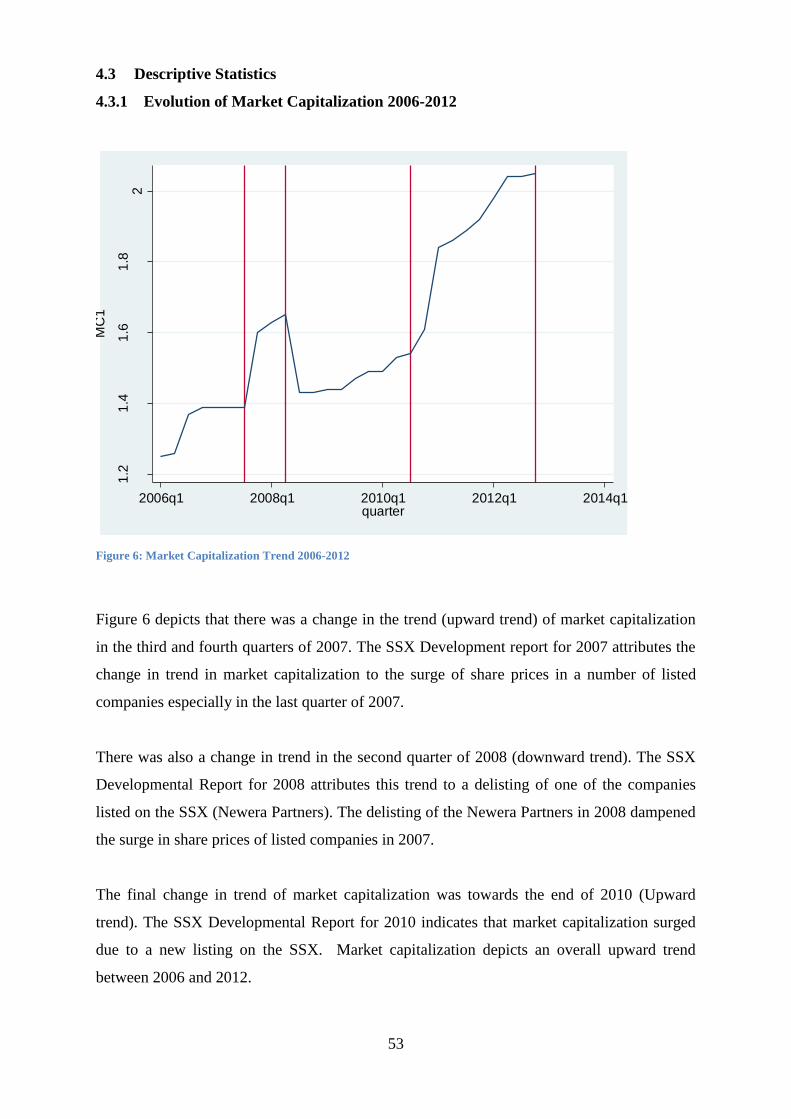
53
4.3 Descriptive Statistics
4.3.1 Evolution of Market Capitalization 2006-2012
Figure 6: Market Capitalization Trend 2006-2012
Figure 6 depicts that there was a change in the trend (upward trend) of market capitalization
in the third and fourth quarters of 2007. The SSX Development report for 2007 attributes the
change in trend in market capitalization to the surge of share prices in a number of listed
companies especially in the last quarter of 2007.
There was also a change in trend in the second quarter of 2008 (downward trend). The SSX
Developmental Report for 2008 attributes this trend to a delisting of one of the companies
listed on the SSX (Newera Partners). The delisting of the Newera Partners in 2008 dampened
the surge in share prices of listed companies in 2007.
The final change in trend of market capitalization was towards the end of 2010 (Upward
trend). The SSX Developmental Report for 2010 indicates that market capitalization surged
due to a new listing on the SSX. Market capitalization depicts an overall upward trend
between 2006 and 2012.
1.2
1.4
1.6
1.8
2
MC
1
2006q1 2008q1 2010q1 2012q1 2014q1quarter
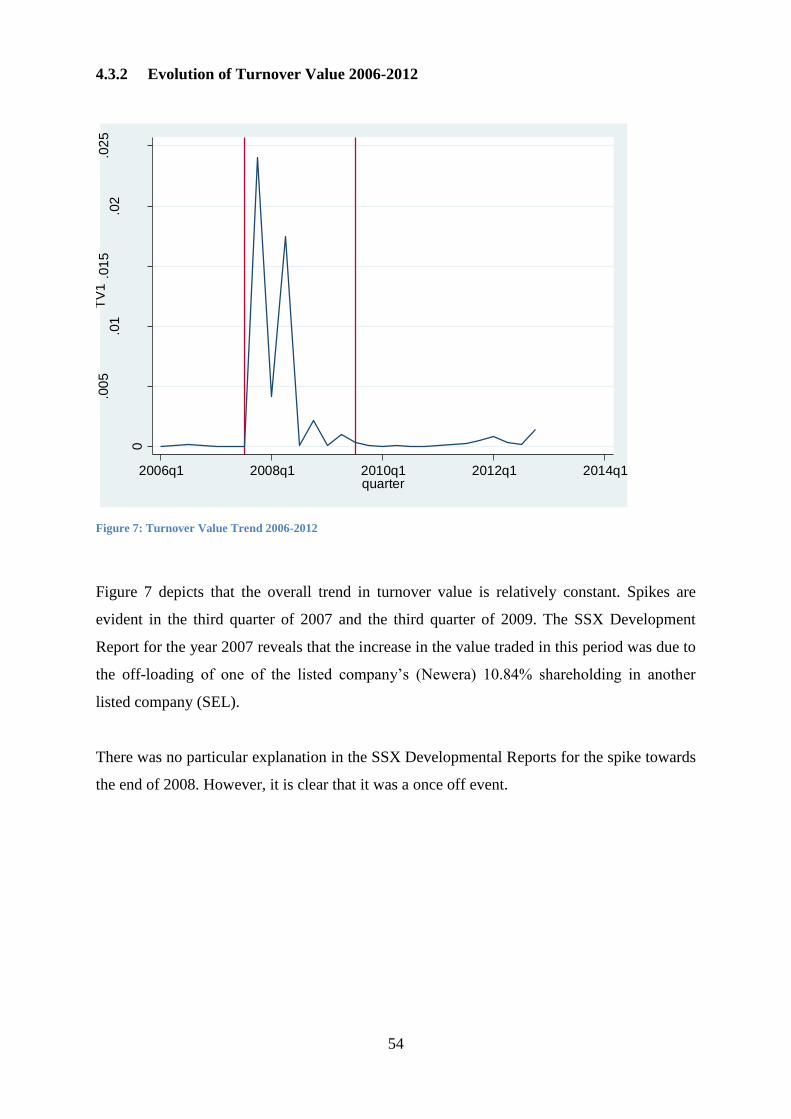
54
4.3.2 Evolution of Turnover Value 2006-2012
Figure 7: Turnover Value Trend 2006-2012
Figure 7 depicts that the overall trend in turnover value is relatively constant. Spikes are
evident in the third quarter of 2007 and the third quarter of 2009. The SSX Development
Report for the year 2007 reveals that the increase in the value traded in this period was due to
the off-loading of one of the listed company’s (Newera) 10.84% shareholding in another
listed company (SEL).
There was no particular explanation in the SSX Developmental Reports for the spike towards
the end of 2008. However, it is clear that it was a once off event.
0
.00
5.0
1.0
15
.02
.02
5T
V1
2006q1 2008q1 2010q1 2012q1 2014q1quarter
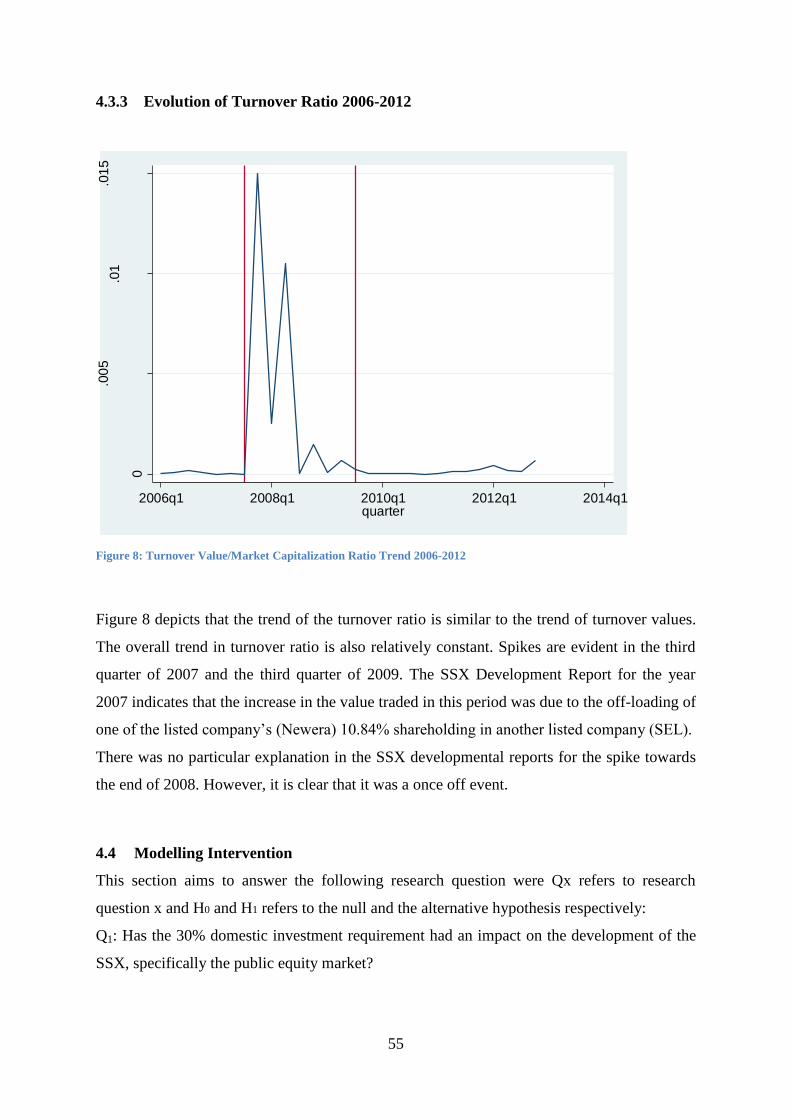
55
4.3.3 Evolution of Turnover Ratio 2006-2012
Figure 8: Turnover Value/Market Capitalization Ratio Trend 2006-2012
Figure 8 depicts that the trend of the turnover ratio is similar to the trend of turnover values.
The overall trend in turnover ratio is also relatively constant. Spikes are evident in the third
quarter of 2007 and the third quarter of 2009. The SSX Development Report for the year
2007 indicates that the increase in the value traded in this period was due to the off-loading of
one of the listed company’s (Newera) 10.84% shareholding in another listed company (SEL).
There was no particular explanation in the SSX developmental reports for the spike towards
the end of 2008. However, it is clear that it was a once off event.
4.4 Modelling Intervention
This section aims to answer the following research question were Qx refers to research
question x and H0 and H1 refers to the null and the alternative hypothesis respectively:
Q1: Has the 30% domestic investment requirement had an impact on the development of the
SSX, specifically the public equity market?
0
.00
5.0
1.0
15
TV
MC
2006q1 2008q1 2010q1 2012q1 2014q1quarter
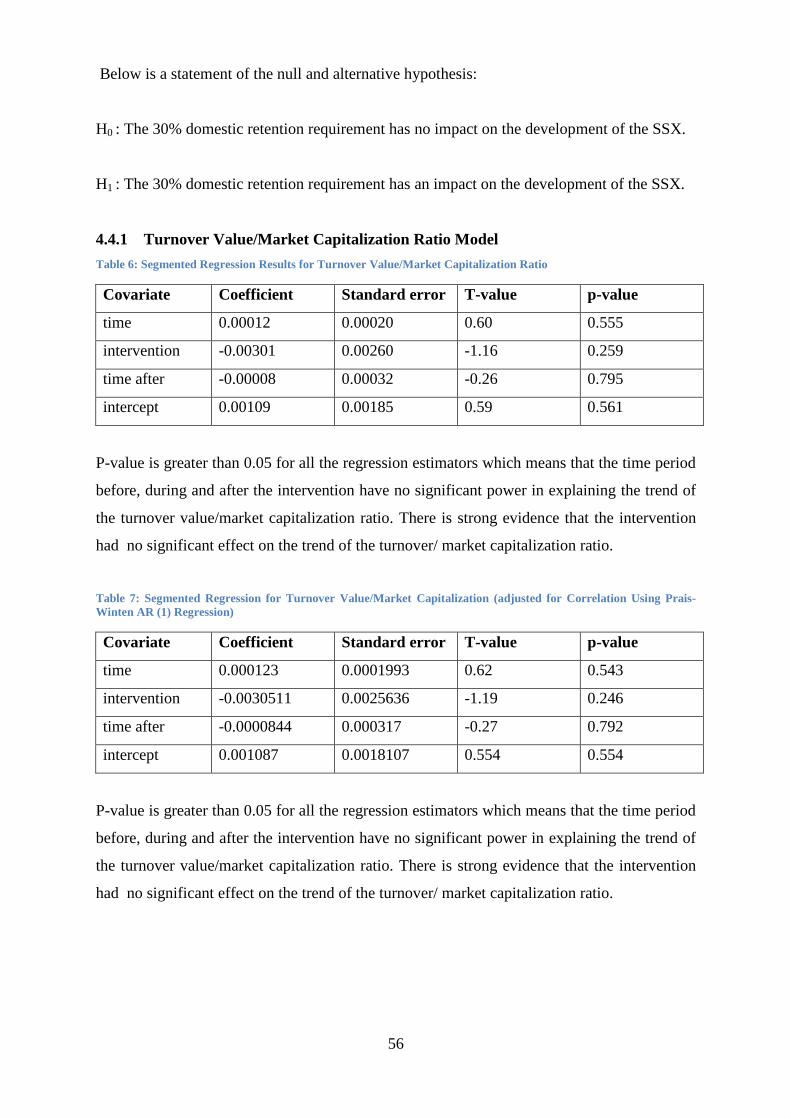
56
Below is a statement of the null and alternative hypothesis:
H0 : The 30% domestic retention requirement has no impact on the development of the SSX.
H1 : The 30% domestic retention requirement has an impact on the development of the SSX.
4.4.1 Turnover Value/Market Capitalization Ratio Model
Table 6: Segmented Regression Results for Turnover Value/Market Capitalization Ratio
Covariate Coefficient Standard error T-value p-value
time 0.00012 0.00020 0.60 0.555
intervention -0.00301 0.00260 -1.16 0.259
time after -0.00008 0.00032 -0.26 0.795
intercept 0.00109 0.00185 0.59 0.561
P-value is greater than 0.05 for all the regression estimators which means that the time period
before, during and after the intervention have no significant power in explaining the trend of
the turnover value/market capitalization ratio. There is strong evidence that the intervention
had no significant effect on the trend of the turnover/ market capitalization ratio.
Table 7: Segmented Regression for Turnover Value/Market Capitalization (adjusted for Correlation Using Prais-
Winten AR (1) Regression)
Covariate Coefficient Standard error T-value p-value
time 0.000123 0.0001993 0.62 0.543
intervention -0.0030511 0.0025636 -1.19 0.246
time after -0.0000844 0.000317 -0.27 0.792
intercept 0.001087 0.0018107 0.554 0.554
P-value is greater than 0.05 for all the regression estimators which means that the time period
before, during and after the intervention have no significant power in explaining the trend of
the turnover value/market capitalization ratio. There is strong evidence that the intervention
had no significant effect on the trend of the turnover/ market capitalization ratio.
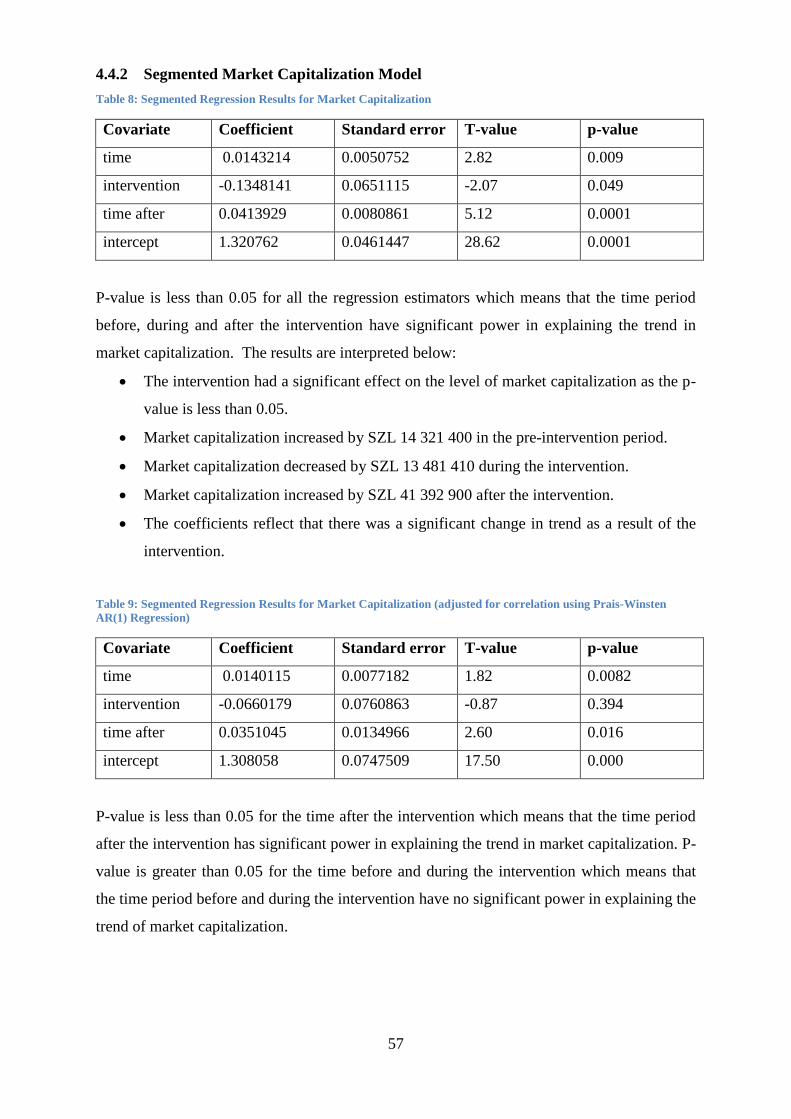
57
4.4.2 Segmented Market Capitalization Model
Table 8: Segmented Regression Results for Market Capitalization
Covariate Coefficient Standard error T-value p-value
time 0.0143214 0.0050752 2.82 0.009
intervention -0.1348141 0.0651115 -2.07 0.049
time after 0.0413929 0.0080861 5.12 0.0001
intercept 1.320762 0.0461447 28.62 0.0001
P-value is less than 0.05 for all the regression estimators which means that the time period
before, during and after the intervention have significant power in explaining the trend in
market capitalization. The results are interpreted below:
The intervention had a significant effect on the level of market capitalization as the p-
value is less than 0.05.
Market capitalization increased by SZL 14 321 400 in the pre-intervention period.
Market capitalization decreased by SZL 13 481 410 during the intervention.
Market capitalization increased by SZL 41 392 900 after the intervention.
The coefficients reflect that there was a significant change in trend as a result of the
intervention.
Table 9: Segmented Regression Results for Market Capitalization (adjusted for correlation using Prais-Winsten
AR(1) Regression)
Covariate Coefficient Standard error T-value p-value
time 0.0140115 0.0077182 1.82 0.0082
intervention -0.0660179 0.0760863 -0.87 0.394
time after 0.0351045 0.0134966 2.60 0.016
intercept 1.308058 0.0747509 17.50 0.000
P-value is less than 0.05 for the time after the intervention which means that the time period
after the intervention has significant power in explaining the trend in market capitalization. P-
value is greater than 0.05 for the time before and during the intervention which means that
the time period before and during the intervention have no significant power in explaining the
trend of market capitalization.
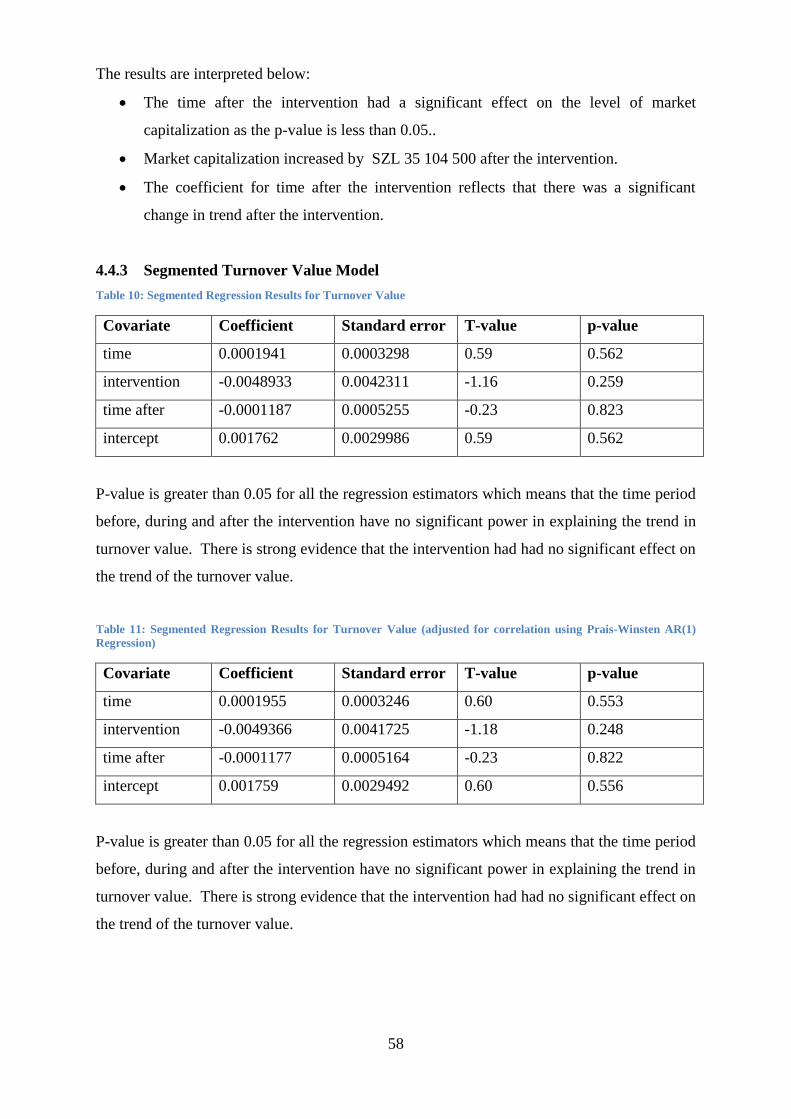
58
The results are interpreted below:
The time after the intervention had a significant effect on the level of market
capitalization as the p-value is less than 0.05..
Market capitalization increased by SZL 35 104 500 after the intervention.
The coefficient for time after the intervention reflects that there was a significant
change in trend after the intervention.
4.4.3 Segmented Turnover Value Model
Table 10: Segmented Regression Results for Turnover Value
Covariate Coefficient Standard error T-value p-value
time 0.0001941 0.0003298 0.59 0.562
intervention -0.0048933 0.0042311 -1.16 0.259
time after -0.0001187 0.0005255 -0.23 0.823
intercept 0.001762 0.0029986 0.59 0.562
P-value is greater than 0.05 for all the regression estimators which means that the time period
before, during and after the intervention have no significant power in explaining the trend in
turnover value. There is strong evidence that the intervention had had no significant effect on
the trend of the turnover value.
Table 11: Segmented Regression Results for Turnover Value (adjusted for correlation using Prais-Winsten AR(1)
Regression)
Covariate Coefficient Standard error T-value p-value
time 0.0001955 0.0003246 0.60 0.553
intervention -0.0049366 0.0041725 -1.18 0.248
time after -0.0001177 0.0005164 -0.23 0.822
intercept 0.001759 0.0029492 0.60 0.556
P-value is greater than 0.05 for all the regression estimators which means that the time period
before, during and after the intervention have no significant power in explaining the trend in
turnover value. There is strong evidence that the intervention had had no significant effect on
the trend of the turnover value.
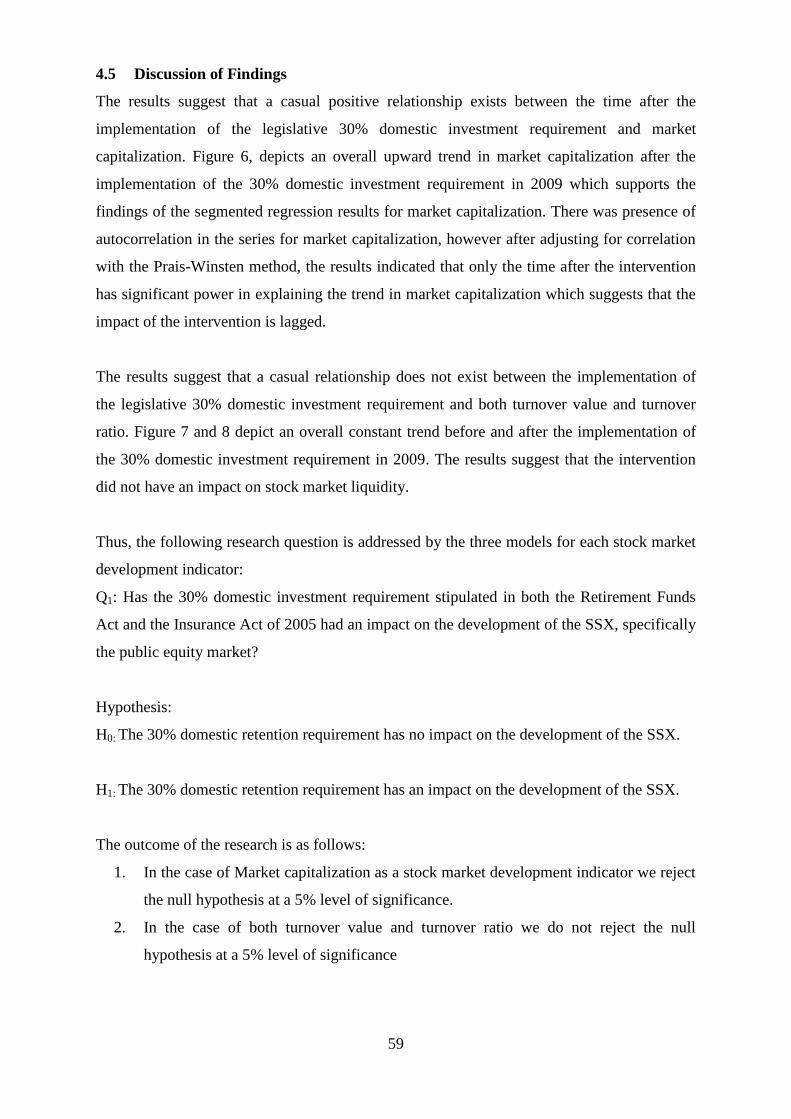
59
4.5 Discussion of Findings
The results suggest that a casual positive relationship exists between the time after the
implementation of the legislative 30% domestic investment requirement and market
capitalization. Figure 6, depicts an overall upward trend in market capitalization after the
implementation of the 30% domestic investment requirement in 2009 which supports the
findings of the segmented regression results for market capitalization. There was presence of
autocorrelation in the series for market capitalization, however after adjusting for correlation
with the Prais-Winsten method, the results indicated that only the time after the intervention
has significant power in explaining the trend in market capitalization which suggests that the
impact of the intervention is lagged.
The results suggest that a casual relationship does not exist between the implementation of
the legislative 30% domestic investment requirement and both turnover value and turnover
ratio. Figure 7 and 8 depict an overall constant trend before and after the implementation of
the 30% domestic investment requirement in 2009. The results suggest that the intervention
did not have an impact on stock market liquidity.
Thus, the following research question is addressed by the three models for each stock market
development indicator:
Q1: Has the 30% domestic investment requirement stipulated in both the Retirement Funds
Act and the Insurance Act of 2005 had an impact on the development of the SSX, specifically
the public equity market?
Hypothesis:
H0: The 30% domestic retention requirement has no impact on the development of the SSX.
H1: The 30% domestic retention requirement has an impact on the development of the SSX.
The outcome of the research is as follows:
1. In the case of Market capitalization as a stock market development indicator we reject
the null hypothesis at a 5% level of significance.
2. In the case of both turnover value and turnover ratio we do not reject the null
hypothesis at a 5% level of significance
60
4.6 Impediments to the Development of the Stock Exchange
This section aims to answer the research question on the current impediments that exist
towards the development of the SSX. It will involve an analysis of SSX yearly reports and
results of the questionnaires administered to personnel of the stock exchange and stock
brokers on challenges faced by the SSX. The impediments to the development of the stock
exchange are discussed below:
4.6.1 Poor Liquidity
The main impediment to stock market development highlighted by both the SSX and the
brokers is poor liquidity. Since the inception of the SSX the turnover ratio has mostly not
exceeded one percent. The lack of liquidity has been attributed to the small capital base of
listed companies, the small size of the SSX and the low free float (small number of public
stock available). The SSX established an alternate board which was intended to attract small
to medium enterprises. However, so far the alternative board has been dormant. Hearn and
Piesse (2010) highlighted that bank credit is more accessible to small and medium enterprises
at a significantly lower cost than a stock market listing.
The questionnaires revealed that most shares bought by retirement funds are held for the long
term and are hardly traded on the secondary market unless the retirement fund is liquidated.
Retirement funds have an incentive not to sell the domestic equities in their portfolios as it
helps them comply with the 30% domestic investment requirement. Thus in a country with
shallow capital markets such as Swaziland, regulated institutional investors have an incentive
to hold on to their domestic capital market instruments. This tendency by institutional
investors has a negative effect on the secondary market activity of the SSX. Thus the
investment behaviour of most institutional investors is buying-and-holding.
4.6.2 Free Float
Free float is the proportion of securities held by the public to the total number of listed firm’s
securities and the agreed minimum for SADC exchanges set by the COSSE is 20%. However,
calculations made by the Capital Markets Division under FSRA indicate that only
approximately 8% of securities of the companies that were already listed at the time this
minimum was set, are available to the public. This contributes to low liquidity in the
domestic stock market.
61
4.6.3 Lack of New Listings
There have been minimal developments in the number of newly listed firms since 2005. The
almost non-existent new listings (IPO) add to the reasons why there is minimal trading
activity. Further, most companies in need of financing are small to medium enterprises,
however due to their relatively unknown status, they do not make appealing candidates for
initial public offerings.
4.6.4 Legislative Framework
The lack of legislation was one of the main impediments to the development of the stock
exchange before the implementation of the Securities Act of 2010 and the Financial Services
Regulatory Authority Act of 2010. The Financial Services Regulatory Authority (FSRA)
which is responsible for the regulation of capital markets started operating in 2012.
The absence of legislation prior to these Acts impacted negatively on attempts by the SSX to
deepen the market and on investor confidence. Both the Securities Act and the Financial
Services Regulatory Act of 2010 are expected to improve investor confidence. However, this
is expected to have a lag effect as investors will probably require time to assess the
effectiveness of the regulator in diligently enforcing the legislation.
4.6.5 Trading Infrastructure
The trading on the exchange is carried out using the call over system. Trading is manually
conducted which has a major limitation on efficiency and settlement procedures. The lack of
efficient trading infrastructure also makes it difficult for the SSX to link up with other
exchanges, which operate on an electronic platform.
4.6.6 Central Depository System
The SSX currently does not have a central securities depository system, therefore owners of
securities still have to keep share certificates as proof of ownership. This has resulted in the
process of dual listing being impossible since the demutualization of the JSE Securities
Exchange.

62
4.6.7 Lack of Education and Behavioural Patterns of Investors
Most Swazi investors are not educated on how a stock exchange works and they do not
appreciate the value of buying and selling rather than holding. This is also linked to the
historical investment vehicles used by Swazi investors who prefer to invest in assets that have
intrinsic value such as cattle.
63
5 CHAPTER 5: CONCLUSION AND RECOMMENDATIONS
5.1 Conclusion
This chapter focuses on the conclusions and recommendations (policy guide) that are drawn
from the findings.
The empirical results of the study exhibit evidence to the effect that the Legislative 30%
domestic investment requirement has a positive impact on market capitalization (size). The
empirical results also exhibit evidence to the effect that the Legislative 30% domestic
investment requirement has no impact on the liquidity of the SSX, which was measured in
terms of turnover ratio and turnover value. Thus, the research found that the 30% domestic
investment requirement has a positive impact the development of the SSX in terms of growth
in market capitalization (size) only, not liquidity.
Policy makers would benefit from future studies on the impact of the legislative 30%
domestic investment requirement which will utilize more observations. More observations
would be beneficial in studying the lag effects of the intervention. Studies on the potential
opportunity cost in terms of risk and return of such domestic retention legislation would also
be beneficial to policy makers.
5.2 Policy Recommendations
The following recommendations (policy guides) and potential strategic actions spring from
the discussion of the above impediments:
Promote privatisation of state owned enterprises – The Local Government could consider
using the SSX to facilitate the privatisation process. This would likely have a positive impact
on the liquidity of the SSX.
Increase free float – The liquidity of domestic stock markets could be improved if the
minimum free float of 20% which was approved by the Committee of SADC Stock
exchanges is actively enforced by the Regulator of capital markets (FSRA). It is
recommended that the SSX actively engage companies whose stock is in demand to consider
availing more shares to the public to improve stock market liquidity.
Provide more tax incentives for listed companies – To encourage more companies to list
on the SSX, policy makers could consider the use of tax incentive that promote participation
64
in the domestic stock market. An example of such a tax incentive would be a reduction in
corporate tax for companies listed on the SSX. This option however should be considered
with caution as it also results in a reduction in tax revenue for the government. It is
recommended this incentive be provided for companies below a certain level of profitability
such as small and medium companies.
Strengthen education on the Stock Exchange – The stock exchange currently has an
education campaign which encompasses schools investment challenges, career fairs
presentations and print and social media. The SSX could strengthen the campaigns by
increasing the frequency of publications and provide attractive incentives for participation in
investment challenges.
Establish a centralised settlement system – The establishment of a centralized system for
clearing and settlement is likely to have positive effects on the efficiency of the stock
exchange. However, the liquidity of the stock exchange should be taken into consideration to
determine the net effect of acquiring a centralised system at the current development level of
the SSX, especially in terms of costs.
Encourage venture capitalist – Venture capitalist could provide funding and specialised
skills and guidance to start ups in order to enable them to grow profitably. Once the
companies have reached maturity, the venture capitalist could use the SSX as a channel for
their exit.
65
6 REFERENCES
Andrianaivo, M. and Yarty, C.A. (2010), Understanding the growth of African financial
Markets, African Development Review, 22, 394-418.
Bekaert, G. and Harvey, C.A. (1998) Capital markets: An engine for economic growth,
Brown Journal of World Affairs, 33-35
Berstein, S.M. Chumacero, R.A. (2006), Quantifying the cost of investments limits for
Chilean pension funds, Fiscal Studies 27 (1), 99-123.
Catalan, M. and Impavido, G. and Musalem, A.R. (2000) Contractual savings or stock market
development: which leads? World Bank Policy Research Working Paper 2421.
Central Bank of Swaziland Annual Report 2011/12.
Central Bank of Swaziland Annual Report 2012/13.
Cihak, M. Demirguc-Kunt, A. Feyen, E. & Levine R. (2012) Benchmarking financial systems
around the world, World Bank Working Papers - WPS 6175.
Demirguc-Kunt, A. Feyen, E. & Levine, R. (2012) The evolving importance of banks and
securities markets. World Bank Economic Review, World Bank, Washington DC.
Demirguc-Kunt, A. and Levine R. (1993) Stock Market Development and Financial
Intermediaries: Stylized Facts, World Bank Working Papers - WPS 1159.
Financial Services Regulatory Authority Annual Report, 2013.
Fink, G. Haise, P. Kirchner, H and Moser, U (2006) Financing through bond issues and the
nexus with Economic Growth. Paper presented at the meeting of European Financial
Management Association, Madrid Spain.
Greenwood, J. Jovanovic, B. (1990) Financial development, growth, and distribution of
income, The Journal of Political Economy, 98(5), 1076 -1107.
66
Greenwood, J. Sanchez, J.M. and Wang, C. (2013) Quantifying the impact of financial
development on economic growth, Review of Economic Dynamics, 16, 194 -215.
Grimshaw, J. Anderson, P. Baro, L. et al (2003), Study designs accepted for inclusion in
EPOC reviews. EPOC Newsletter 2003. Cochrane Effective Practice and Organisation of
Care Review Group Online at: http://epoc.cochrane.org/newsletters
Hearn, B. and Piesse, J. (2009) Barriers to the development of small stock markets: A case of
Swaziland and Mozambique, Journal of International Development, 22, 1018 – 1037.
Ho, A.K.F and Wan, T.K. (2002), Testing for covariance stationary returns in the presence of
structural breaks: An intervention analysis, Applied Economics Letters, 9, 441 – 447.
IMF (2008) Kingdom of Swaziland: Selected Issues and Statistical Appendix, IMF Country
Report No. 08/355.
International Monetary Fund Washington, D.C. (2013) Cape Verde, Namibia, and the
kingdom of Swaziland
International Monetary Fund Washington, D.C. (2008) Kingdom of Swaziland: Selected
Issues and statistical appendix
Impavido, G. Musalem, A.R. and Tressel, T. (2003) the Impact of Contractual Savings
Institutions on Securities Markets, World Bank Policy Research Working Paper 2948.
Kenny, C.J. and Moss, T.J. (1998) Stock markets in Africa: Emerging lions or white
elephants?, World Development,26(5), 829-843.
Lagarde, M. (2012) How to do (or not to do)…Assessing the impact of a policy change with
routine longitudinal data, Health Policy and Planning (1) 76-83.
Ladekarl, J. and Zervos, S. (2004) Housekeeping and Plumbing; the Investability of
Emerging Markets, Emerging Markets Review, 5, 267-294
67
Levine, R and Zervos, S (2008) Stock Markets, Banks and Economic Growth, The American
Economic review,88(3), 537 – 558.
Marone, H. (2003) Small African Stock Markets-The Case of Lusaka Stock exchange, IMF
Working Paper - WP/03/06.
Meng, C. and Pfau, W.D. (2010) the Role of Pension Funds in Capital Market Development,
Grips Discussion Paper 10 – 17
Minier, J. (2009) Opening a stock exchange, Journal of Development Economics 90, 135-
143.
Mishkin, F.S. (2006) The Economics of Banking, and Financial Markets,7th
Edition., Daryl
Fox, New York.
Nellor, D.C.L. (2008) the Rise of Africa’s ‘Frontier’ markets, Finance &Development,
September, 30-33.
Office of the Registrar of Insurance and Retirement Fund Annual Report 2011.
Prayag, C. and du Toit, D., Kenmuir, K., Morrison, A. and Tembo, C. (2010), Do frontier
market equities have a role to play in a diversified international equity portfolio?, Africa
Finance Journal, Special Issue, 75-97.
Raddatz, C and Schmukler, S.L. (2008) Pension funds and capital market development: How
much bang for buck?, World Bank Policy Research Working Paper –WPS 4787.
Rajan, R. and Zingales, L. (1998) Financial dependence and growth, The American Economic
Review, 88(3), 559-586.
Rousseau, P.L. and Sylla, R. (2001) Financial systems, economic growth and globalization,
NBER Working Paper 8323.
Singh, A. (1999), Should Africa promote stock market capitalism? Journal of International
Development, 11, 343-365.
68
Swaziland (2010) the Financial Services Regulatory Authority Act, 2010, The Government
Printer, Mbabane.
Swaziland (2005) the Insurance Act, 2005, The Government Printer, Mbabane.
Swaziland (2005) the Retirement Funds Act, 2005, The Government Printer, Mbabane.
Swaziland (2010) the Securities Act, 2010, The Government Printer, Mbabane.
SSX Annual Development Report, 2005.
SSX Annual Development Report, 2009.
SSX Annual Development Report, 2010
SSX Annual Development Report, 2011.
Swazi Observer, various issues, 2011-2013.
The Times of Swaziland, various issues, 2011-2013.
The World Bank (2014) Swaziland, last accessed 20/01/2014, 2013, from
http://data.worldbank.org/country/swaziland
The World Bank (2014) Swaziland, last accessed 20/01/2014, 2013,
fromhttp://data.worldbank.org/indicator/AG.LND.TOTL.K2
Thumrongvit, P. Kim, Y. And Pyun, C.S.(2013) Linking the missing Market: Effect of bond
market on economic growth, International Review of Economics & Finance, 27, 529-541.
Van Zyl, C. Botha, Z. and Skerritt, P. (Second Edition) (2006) Understanding South African
Financial Markets, 2nd
Edition., Pretoria.
69
Wagner, A.K. Soumeria, S.B. Zhang, M.S. Ross-Degnan D. (2002), Segmented regression
analysis of interrupted time series studies in medication use research, Journal of clinical
Pharmacy and therapeutics, 27, 299-309.
Yarty, C.A. and Adjasi, C.K. (2007) Stock market development in Sub-Saharan Africa:
Critical Issues and Challenges, IMF working paper – WP/07/209.
Yarty, C.A. The Determinants of stock market development in Emerging Economies: Is
South Africa Different, IMF Working paper 08/32
70
7 APPENDIX 1 - Questionnaire to Key Industry Players
Consent to Participate in Research
You are invited to participate in a research conducted by Thokozile Buluma. This research
forms part of my studies towards attainment of Master’s Degree in Management Finance and
Investments at Wits Business School.
All participants are required to read the following abstract before they decide to participate in
the research. This exercise is a voluntary.
Purpose of the Research
The purpose of this study is to identify the impact of legislative changes, particularly the 30%
legislative local investment requirement stipulated in the Retirement Funds Act of 2005 and
the Insurance Act of 2005, on the Swaziland Stock Exchange (SSX), particularly the public
equity market, and determine impediments to the development of the SSX.
Confidentiality
The research is being undertaken for academic purposes and result of the research will not be
published, sold or reproduced for any other purpose than for academia. Any comments made
by participants will be treated with privacy and confidentially.
Procedures
Participates in this research are required to complete a questionnaire. Depending on the
availability of the participant the questionnaire can either be emailed by the researcher and/or
the questionnaire can be administered by the researcher. The estimated time required to
complete the questionnaire is approximately 30 minutes. Participants are free to refuse to
answer any questions or to withdraw from the process at any stage.
Potential Risks
Participants may be temporarily inconvenienced by the time it takes to complete the
questionnaires (30 minutes).
Payment for Participation
Participants will not receive payment for your participation.

71
Identification of Researcher
If you have any questions or concerns about the research, please feel free to contact:
Thokozile Buluma, +268 602 5808, [email protected]
Rights of research subjects
You may withdraw your consent at any time and cease participating without any penalty.
You are not giving up any legal rights because of your participation in this research.
Signature of research participants
I understand the procedures described above and I agree to participate in this research. Please
note that participants will not be required to sign this declaration as this may identify you, but
your consent is evidenced by completion of the answer sheet.
Questionnaire A – to personnel of Stock broker
What are the challenges or impediments to the development of the SSX, if any?
In your professional opinion, has the 30% domestic investment requirement had an impact on
the development of the SSX, particularly the public equity market?
Questionnaire B – to personnel of the SSX
What are the challenges or impediments to the development of the SSX, if any?
In your professional opinion, has the 30% domestic investment requirement had an impact on
the development of the SSX, particularly the public equity market?
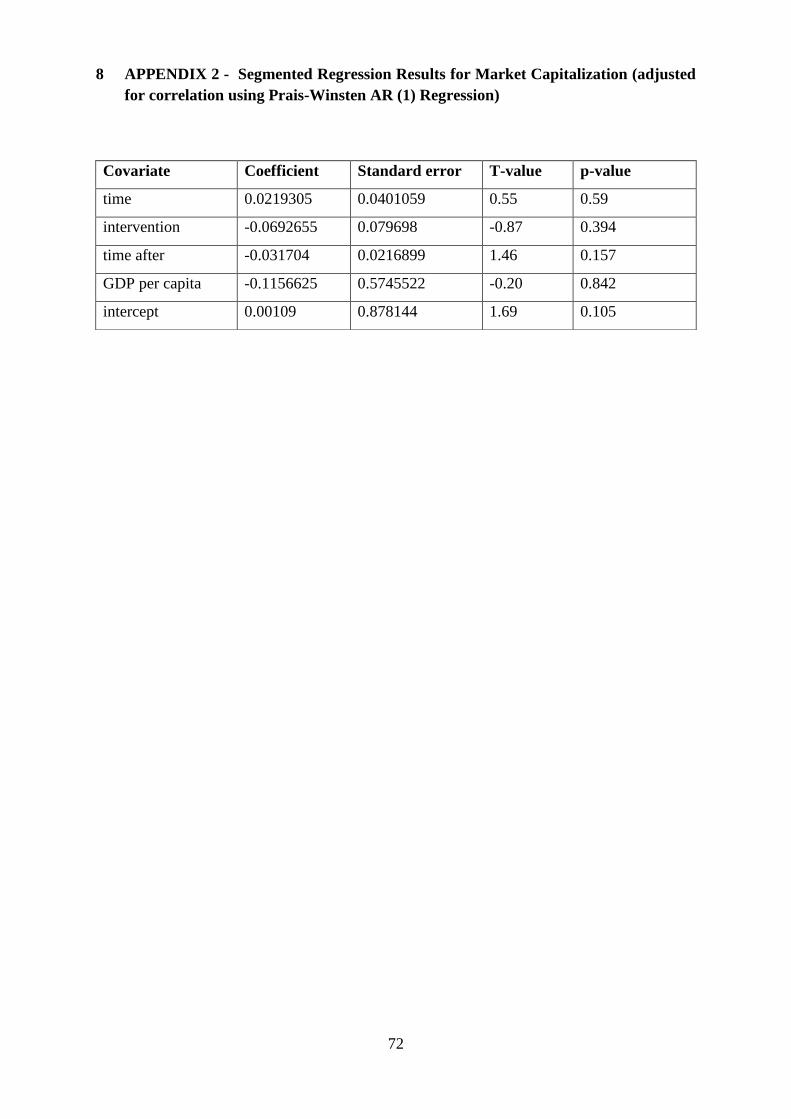
72
8 APPENDIX 2 - Segmented Regression Results for Market Capitalization (adjusted
for correlation using Prais-Winsten AR (1) Regression)
Covariate Coefficient Standard error T-value p-value
time 0.0219305 0.0401059 0.55 0.59
intervention -0.0692655 0.079698 -0.87 0.394
time after -0.031704 0.0216899 1.46 0.157
GDP per capita -0.1156625 0.5745522 -0.20 0.842
intercept 0.00109 0.878144 1.69 0.105