Embed Size (px)
Citation preview
The Value of Co-Creation J.L. van de Mortel
0
Master Thesis
The Value of Co-Creation
Maastricht University
School of Business and Economics
Maastricht, August 31, 2010
Mortel, Jelmer L. van de, i345709
Study: International Business
Concentration: Finance
Master Thesis:
“The Value of Co-Creation”
Supervisor: Dr. T. Post
The Value of Co-Creation
J.L. van de Mortel 1
Abstract
This thesis examines the relation between the use of co-creation as way of doing business and
financial performance measurements of firms listed in the S&P 500. Co-creation is defined as
an active and creative process, based on collaboration between organizations and consumers,
and initiated by the firm to generate value for both, the company and the customer. Based on
balance sheet and income statement driven measures (i.e. Profit Margin, ROE, ROA, Tobin’s
Q) the effect of co-creation on the firm’s financial ratios and financial position is assessed.
The findings indicate that co-creation contributes to the success of a firm as measured by the
financial indicators, Return on Assets, Return on Invested Capital, Cost of Goods Sold, Cash
flow to Sales, Operating and Gross Profit Margin and Tobin’s Q. The results have clear
economic significance and suggest the inclusion of co-creation principles in current business
models to improve firm performance.
Keywords: Co-creation • Financial Performance • Value creation
In memoriam of C.K. Prahalad († April 16, 2010)
The Value of Co-Creation
J.L. van de Mortel 2
Table of Contents
1. Introduction p. 3
2. Literature Review p. 5
2.1. The Changing Business Environment
2.2. The Concept of Co-creation
2.3. Co-creation from the Company Perspective
2.4. Co-creation from a Customer Perspective
3. Research Design p. 22
3.1. Research Agenda
3.2. Sample
3.3. Variables
4. Results p. 29
4.1. Descriptive Statistics
4.2. Regression Analysis
5. Discussion & Conclusion p. 35
5.1. Theoretical Contributions
5.2. Managerial Implications
5.3. Limitations
5.4. Further Research
6. References p. 38
7. Appendices p. 48
The Value of Co-Creation
J.L. van de Mortel 3
1. Introduction
Due to globalization, higher customer demands and an increased level of information-sharing,
many organizations organize their business models in a different way than before.
Information technologies enabled a shift from old established corporations to new, innovative
dot-com firms in the end of the 20th century. Meanwhile, another, new class of firms has
emerged with exclusive business practices. Distinct from other firms, those organizations use
a joint process by the organization and consumer to create value that is unique to the
consumer and sustainable to the firm (Prahalad, 2004a). Everyone and anyone can be part of
this process. This joint process, called co-creation of value, can be of value for the consumer,
stakeholders, the organization and shareholders.
For many years, the debate on the changing dynamics of business has been focused on
alliances, networks, and collaboration (Ramaswamy, 2009b), and it is true that business-to-
business relationships have intensified, but in the interim researchers and managers have
largely ignored the consumer, the agent that is most dramatically transforming the industrial
system as we know it (Prahalad & Ramaswamy, 2000). The customer has recently changed
from a passive recipient of goods and services to an active, valuable partner and resource in
achieving organizational objectives. As such, co-creation is the process that enables firms to
benefit from consumer interaction and is a valuable resource to the firm.
A stream of strategy research posits that organizational resources and capabilities that are
rare, idiosyncratic, valuable and non-substitutable create a competitive advantage for an
organization (Barney, 1991; Conner, 1991; Wernerfelt, 1984). In recent times, studies about
organizational resources, like human resources, copyrights, goodwill, brand equity and
customer life (Hogan et al., 2002; Srivastava et al, 2001; Srinivasan & Hanssens, 2009), have
already illustrated the importance of intangible assets for businesses. Subsequently, it is
expected that co-creation also creates a competitive advantage for an organization.
Remarkable in studies about intangible assets is the great resemblance in chronological
advancement. A number of studies start describing a priori the opportunities of the relevant
concept. Subsequently, some studies, describe a posteriori the impact of an intangible from a
managerial perspective and, ultimately, the concept is evaluated from a financial perspective.
In contrast to the understanding of co-creation from the financial perspective, there has
already been a considerable interest from a managerial perspective in the potential of co-
The Value of Co-Creation
J.L. van de Mortel 4
creation. So far, research investigated the impact of co-creation from a strategic point of view
as a way to, inter alia, enhance innovation (Thomke & von Hippel, 2002), product quality
(Lengnick-Hall, 1996), product development (Gruner & Homberg, 2000) and consumer
satisfaction (Rowley, 2005; Gibbert et al, 2002).
However, hitherto, no research studied co-creation from a financial perspective. Despite the
intuitive, positive impact of co-creation, no study has investigated the relation between firm’s
financial performance and the implementation of co-creation. Subsequently, is hard to
motivate involved stakeholders to implement co-creation initiatives (Pedrosa, 2009) and will
co-creation remain, in the world of corporate finance, a peripheral issue.
Given the rhetoric used by top managers and boards, that the main role of management is to
maximize shareholder value (Black, 2001); it is ipso facto important to incorporate current
financial valuation techniques to properly demonstrate the contribution of co-creation to
shareholder value. If research reveals that co-creation ameliorates shareholder value, the
interest in the concept of co-creation itself (Lukas et al., 2003) will be more intense.
Therefore, given the pivotal importance of creating shareholder value and the probable
positive impact of co-creation, one might expect that co-creation will affect business models
and future strategic policies.
This thesis assesses the main findings of academic contributions about the concept of co-
creation and, most importantly, illustrates the economic impact of co-creation. Subsequently,
an assessment of the specific organizational financial indicators shows the positive
contribution of co-creation to firm performance. As such this thesis contributes to a better
understanding of the concept of co-creation from a financial perspective. As a result, the
central research question throughout this thesis is:
What is the added value of co-creation from a financial perspective?
The remainder of this paper is organized as follows. Chapter 2 will highlight the dynamics in
current business practices, review the concept of co-creation, assess the characteristics of co-
creation and place the concept in perspective. Chapter 3 elaborates on the research design and
outlines the variables and models used. Subsequently, chapter 4 presents the main findings.
The implications of this research are discussed from a managerial and theoretical perspective
in Chapter 5.
The Value of Co-Creation
J.L. van de Mortel 5
2. Literature Review
In light of the worst economic crisis in almost 80 years, many are predicting the end of
capitalism as we know it (Posner, 2010, Vargo and Lusch, 2004). According to their theory,
an era of a new, kinder and gentler way of doing business is dawning (Rifkin, 2010). Yet
could a warm and fuzzy society really be on the horizon? Is this wishful thinking or is a grand
new beginning going to happen?
This literature review will focus on the dynamics in current business practices and the shift
occurring in the respective business models. To create a good understanding of co-creation,
firstly the broader picture will be thrown light on. The concept of “new economy” stresses the
importance of knowledge and in a broader view the shift from tangible asset-driven firms to
intangible assets-driven organizations, highlighting the importance of co-creation. Thereupon,
the characteristics, consequences and possibilities of co-creation will be revealed in detail.
2.1 The Changing Business Environment
To unravel the changing nature of doing business, we must see into, through and beyond the
extant literature on co-creation. Only when the concept of co-creation is elucidated from a
strategic perspective its potential and prospective impact can be fully understood. Many
researchers have considered co-creation from a strategic perspective (Kamp, 2009; Johnson et
al. 2008; Kirah, 2009) or the broader shift occurring in the business environment (Prahalad
and Ramaswamy, 2000; Conner, 1991). However, the two trends discussed below, namely the
shift in resources and the increased importance of customer awareness, are to date not
explicitly mentioned as the crucial elements that gave rise to the concept of co-creation.
Subsequently, the trends are linked to a firm’s strategic mindset.
The early theories in economics, classified as the classical and neoclassical schools, supported
a rather goods-centered view (Smith, 1776; Marshall, 1890). The key objective of a company
was to add value with the help of manufacturing. Classical and neoclassical economists
considered only natural resources as resources. Those resources were static and could
contribute to a competitive advantage. Subsequently, competition was focusing on the
possession of those resources and wealth was created through the acquisition or possession of
natural resources or tangible assets (Vargo and Lusch, 2004). Those traditional schools argued
that the primary reason of economic activity was to produce things that could be sold at the
consumer at a profit. However, the product or output was often standardized in order to
maximize the profit and efficiency (Conner, 1991).
The Value of Co-Creation
J.L. van de Mortel 6
Zimmerman (1951) was one of the first that described the change in resources. A shift
occurred from the main, operand resources, “on which an operation or act is performed to
produce an effect” (Vargo and Lusch 2004, p. 2), i.e. natural resources or tangible assets, to
operant resources (Constantin and Lusch, 1994). The latter concerns resources that produce
an effect, i.e. intangible assets, technology or human capital. The trend described by
Zimmerman persevered in the last century and manifested itself with the rise of energetic dot-
com firms in the nineties and took shape in a new economy.
The shift in resources resulted in business models consistent with the resource advantage
theory (Conner and Prahalad, 1996; Srivastava, Fahey and Christensen, 2001). Instead of
selling standardized products or focusing on delivering superior value to customers in relation
to its competitors, companies should identify, develop and strengthen core competences that
create a competitive advantage. Those core competences are intangible processes and operant
instead of operand (Hamel and Prahalad, 1989).
Simultaneously, in the twentieth century the company focus shifted from a product-centric
model to a consumer-centric model (Vargo and Lusch 2004). The importance of customer-
orientation (Drucker, 1993), the fact that the value was determined in the marketplace (Day,
1999) and consciousness of customer satisfaction, resulted in business models that endorsed
the importance of marketing and the awareness that marketing could contribute to output
maximization (McCarthy, 1960). The customer was no longer just the recipient of goods, but
became the centre of interest.
The reasons for the transformation from product-centric to consumer-centric are diverse.
Intensifying pressures to improve marketing productivity are because of inter alia the increase
in market diversity and intensification of competition. Moreover consumers demand more and
are better informed, mainly due to accelerating advances in technology. Additionally, research
has shown that organizational processes and results improve, if a business model is more
relationship-oriented then transaction-oriented; the organizational focus is externally instead
of internally (Mizik and Jacobson, 2007); management criteria is based on a portfolio of
customers instead on a portfolio of products; and customer knowledge is used as a valuable
asset and not as a control mechanism (Gupta and Zeithaml, 2006).
The transitions in resources and company focus have resulted in different roles for the
consumer. The change in resources shifted the role from consumers from operand to operant
resource and as such made them partners in creating a competitive advantage. The change to
customer-orientation shifted the role of the consumer from simply being seen as buyer to a
The Value of Co-Creation
J.L. van de Mortel 7
more intense role: the customer as an active user. The different roles for consumers, two
input-focused three output-focused consumer roles, are illustrated by Lengnick-Hall (1996)
and can be seen in figure 1.
*** Insert Appendix A, figure 1 here ***
Moreover, the shift in resources and the increase of customer-orientation had a huge impact
on the strategic mindset of a firm (Prahalad and Ramaswamy, 2000). In a deterministic
worldview, those changes in the environment of a company would result in “structuralist
strategies”, i.e. strategies that assume that the environment is given (Kim and Mauborgne,
2009). This “structure-conduct-performance paradigm” has resulted for instance in the
theories of Porter, like his five forces analysis (1979), generic strategies (1980) and the value
chain (1985) either focusing on the environment, the product or the production process.
Strategic frameworks that recognize the importance of the consumer, and that differ
substantially from conventional strategic positioning are, for instance, the Balanced
Scorecard, developed by Kaplan and Norton (1996), that provided metrics to better measure
strategic impact on organizational learning and growth, internal business processes and
customer satisfaction; and the Delta Model of Hax and Wilde (1999). Hax and Wilde argue
that the generic strategies by Porter do not provide the necessary guidance and support for
decision making in a world of change, complexity, and uncertainty. In stead of best-product
solutions, like cost leadership or a differentiation strategy, the Delta model is based on
customer economics and customer bonding. “Customer bonding, obtained trough close
proximity to the client, allows a company to anticipate needs and work jointly to develop new
products” (Hax and Wilde, 1999, p. 13).
In contrast to Porter (1979; 1980 & 1985), who argued the importance to adapt a company’s
strategy to the environmental and industry conditions, Kim and Mauborgne (2009) illustrate
that a company’s performance is not necessarily determined by an industry’s competitive
environment. Kim and Mauborgne (2009) argue that the structuralist strategies are suitable to
gain a competitive advantage if the structural conditions for a company are attractive or the
company has the right resources and capabilities. Otherwise, if a company does not posses the
right set of resources or when structural conditions are unattractive, then they should opt for a
“reconstructionist strategy”, i.e. strategies that shape the environment. However, “when
structural conditions and resources and capabilities do not distinctively indicate one approach
or the other, the right choice will turn on the organization’s strategic mind-set” (Kim and
Mauborgne, 2009, p. 75).
The Value of Co-Creation
J.L. van de Mortel 8
Co-creation fits in the Delta Model and seeks to build on the reconstructionist strategy by
examining company-customer interactions in detail and redesigning experience environments
at the individual level, in effect getting customers and their communities to do more of the
work that the firm used to do, while allowing them to create a better experience. In this sense,
co-creation is not about adapting to or anticipating on the environment, but about “changing
the very nature of engagement and relationship between the institution of management and its
employees, and between them and co-creators of value: customers” (Ramaswamy, 2009b, p.
33). As such it can be seen that several conversations at the strategic level converge in de
direction of co-creation and argue the validity of a new business model (Johnson et al., 2008).
2.2 The Concept of Co-creation
Co-creation is not entirely new and a number of companies have been using the rudiments of
co-creation for many years (Pedrosa, 2009). Currently co-creation is happening in various
settings (Sanders and Simons, 2009; Prahalad and Ramaswamy, 2004b). Except for
companies that use firm production, Meuter and Bitner (1998) argue that co-creation can take
place at companies that use joint production or customer production. The latter is a situation
where self-service is key and customers themselves perform tasks that were once done for
them by others, examples are Automatic Teller Machines (ATMs), Internet transactions, self-
scanning supermarket check-outs and information services available via cell phones (Liu,
2009). Joint production is a more intense form of co-creation, in which both the customer and
the firm's contact employees interact and participate in the process.
The difference in locus of production can be seen in the examples of co-creation as well.
Firstly, co-creation is happening among consumer themselves or social groups that work
together, for instances, within communities, like the Harley Davidson club, or within online
communities, like SecondLife. Secondly, a more visual phenomenon is co-creation between
companies and their business partners (Roser et al., 2009). A good example of collaboration
that strengthens the competitive advantage of both companies is Senseo, a coffee-maker
produced by Philips, but which for a long time span used solely the coffee pads of Douwe
Egberts. Besides the locus of production, the intensity of co-creation practices can vary as
well, as can be seen in figure 2, indicating the different forms of engagement and the different
set of outcomes.
*** Insert Appendix A, figure 2 here ***
The Value of Co-Creation
J.L. van de Mortel 9
Given the different settings in which co-creation takes place and the different interpretations
of the concept of co-creation, this thesis will adhere to the definition of Roser (2009) to deal
with an unambiguous and clear understanding of co-creation. The definition elucidates the
two main features of all co-creation approaches, namely the expansion of product or
organizational boundaries due the interaction with the consumer, and the joint creation of
value, and provides a clear-cut and well-delineated understanding of the matter.
“Co-creation is an active, creative and social process, based on collaboration between
producers and users, that is initiated by the firm to generate value for customers.”
As such co-creation is pro-active process that brings companies and consumers together to
share knowledge, and improves relations, product or service quality. As an adaptive
framework that facilitates innovation and as a development tool that facilitate change by
intertwining organizational knowledge with relationship building, co-creation has the
potential to become a concept that will change traditional ways of doing business and a
crucial element of companies’ competitive advantage.
Co-creation can be seen as a coming together of aspects of marketing and management
theory, psychology and techniques derived from group decision making, innovation and
knowledge processes. First of all, co-creation can bee seen as a tool that serves as a decision-
making support system in which the consumer has a say, is able to make decisions and co-
creation finally results in a process that defines how perceptions are formed. Furthermore, the
eliminated boundary between firm and consumer results in the possibility for consumers to
express desires, identities and wishes and as such this psychological play “acknowledges
consumer’s subjectivity, which is inherently idiosyncratic, contextual and experience-based”
(Roser et al, 2009, p. 10). Accordingly, central to the concept of co-creation is the belief that
each individual is creative and seeks outlets for creativity in their lives (Sanders and Simons,
2009). Thirdly, co-creation is a concept that represents a trend in marketing innovations to
capture knowledge residing in consumers and improves customer relationships (Maklan et al.,
2008). Finally, the consumer contributes to the success of a firm by enabling the company to
adapt earlier to marketing trends, reducing the cost in various elements of the value chain and
as such the consumer becomes a co-creator to generate value.
The Value of Co-Creation
J.L. van de Mortel 10
2.2.1 Three Types of Co-creation
As argued before, there are many different definitions and interpretations of co-creation.
However, within the definition of Roser et al. (2009) a distinction can be made between three
different types of co-creation, namely the monetary, the use/experience and societal value of
co-creation (Sanders and Simons, 2009). Each type has idiosyncratic objectives, particular
mindsets and occurs at specific levels in the value chain (see figure 3).
*** Insert Appendix A, figure 3 here ***
The type of co-creation that usually receives the most attention in business settings is the
co-creation of monetary value (Sanders and Simons, 2009). The monetary type of co-creation
occurs generally at the final stages of the value chain, e.g. the marketing, distribution and
sales stage. From a commercial and economic mindset the objective is to maximize
shareholder wealth, increase revenues and production number. From this perspective
individuals are still seen as customers or consumers. Since the time frame is short term, the
deliverables are limited to “products that sell” and business improvements. Furthermore,
physic contact between the company and customer is not necessarily required since the
conversation can take place by tools like web-based surveys.
The use/experience value of co-creation is driven by companies’ desires to transform
consumers into users so that the products and services they design, produce and sell will
better meet people’s wants and needs as such the value offered extends monetary gain. The
shift in meaning of value is rapidly changing from product-centric to personalized consumer
experiences (Prahalad and Ramaswamy, 2004a). Therefore, an experience-driven and
customer-orientated mindset is required at the company level to indeed create positive
experiences and customization. In this case the individuals are seen as end-users of the value
proposition (Johnson, 2008) and as empowered consumers.
Given its potential impact, the value of co-creation can be seen on a societal basis. Inspired by
the idea of systems thinking (Senge, 2010) the impact of co-creation can be considered by “its
next larger context” (Sanders and Simons, 2009, p. 30). From a human-centered and
ecological way of thinking, the objective is to create sustainable ways of living and improve
quality of life. As such the social value of co-creation is the most intense and extreme type of
co-creation. In this setting the individuals are considered as participants and over many
generations or in a long-term perspective the deliverables are transformation, learning,
behavioral change, happiness and survival (Sanders and Simons, 2009). Prahalad (2004b)
The Value of Co-Creation
J.L. van de Mortel 11
argues that when the consumers get involved in company processes this will have a positive
effect on democracy, since more people do have a say, and equality, since more knowledge is
becoming publicly available. As such co-creation empowers consumers and enriches, in
utopia, society and humankind.
All three types of value in co-creation are important to create customer satisfaction and to
enable consumers to participate in a creative process. To further increase customer
satisfaction the three types of co-creation can be bundled and as such there is a focus on the
whole of an experience and not on just an episode or single touch point. Besides, the different
types are often inextricably linked, i.e. social value can provide use/experience value and
financial reward as well.
2.2.2 Co-creation in Perspective
Hitherto, the concept of co-creation is explained. However, in recent decennia other concepts
became existent that are closely linked to co-creation. All concepts contain elements of
purpose-driven innovation, consumer involvement or organizational cross-boundary
collaboration. For a clear understanding of co-creation, co-creation and its related concepts
can be discussed on two dimensions, the role of the company and the type of value created, as
can be seen in figure 4. The latter makes a distinction between standardized value, customized
value and personalized value; and between consumer-led and producer-led concepts.
*** Insert Appendix A, figure 4 here ***
To improve the understanding of co-creation, seven related models are distinguished. The first
is mass collaboration (Ghazawneh, 2008). Based on joint actions, mass collaboration is a
collaboration model which involves large numbers of participants and or contributors. The
rationale behind mass collaboration is to involve the customers to do some of the work that
firms historically did themselves. A shining example is Wikipedia.
Mass customization (Kotha, 1995) illustrates the economies of scope that result in a broader
product range and reduced cost for the firm, due to the fact that customers can alter the
products themselves (Dell Computers). Pine (1997) makes a distinction between four types of
mass customization, i.e. adaptive, cosmetic, transparent and collaborative customization, each
with a different customer approach and product characteristics.
A third model is User-Generated-Content or User-Created Content, of which YouTube and
SecondLife are probably the most alluring examples. This model is financially attractive due
to the possibility to monetize content, the advertisement possibilities and the lower costs and
The Value of Co-Creation
J.L. van de Mortel 12
entry barriers (Wunsch and Vickery, 2007) and is made possible due to technological
advancements in global broadband density, simpler tools for creating and editing content and
the increased quality of technological devices for audio and video purposes.
User-involvement deals with participative decision-making, in either a consultative,
representative or consensus setting (Mumford, 1979), and should result in improved quality of
the system and increased acceptance of the system (Ives and Olsen, 1985). The quality of the
system is improved due to a more accurate assessment of user requirements, the expertise
provided about the organization, the avoidance of unacceptable or unimportant features and
the improvements in user understanding of the system (Robey and Farrow, 1982). On the
other hand the acceptance of the system may be increased by the development of realistic
expectations, commitment of users to the system, decreasing user resistance to change and the
possibility to bargain and solve conflict situation in the design phase (Lucas, 1974).
Probably the most appealing concept related to co-creation is co-production. Bendapudi and
Leone (2003) call the recognition to encourage customers to be co-producers “the next
frontier in competitive effectiveness” and define co-production as a process where a consumer
is an active participant in the production or delivery of a service, whereby the participant has
the possibility to customize the product or service.
The last two models are based on innovation, namely collaborative innovation and open
innovation. The former is more focused on business-to-business relations (Roger et al., 2009)
and open innovation is based on internal R&D, but complemented with external R&D. Where
in the past, internal R&D was a valuable strategic asset and a formidable barrier to entry by
competitors in many markets, nowadays external R&D can create significant value
(Chesbrough, 2003).
Above mentioned concepts contribute to the competitive advantage of a firm and will increase
customer satisfaction. Where some overlap exists between the concepts and co-creation; it
also enables one to distinct co-creation from those concepts. The uniqueness of co-creation is
based on the consumer interaction, the consumer orientation and the added value created for
both parties. As such co-creation does not solely focus on the role of R&D, the adaption of
customer needs or simply facilitating a method for customer to express their needs, but is a
broadly oriented concept.
The Value of Co-Creation
J.L. van de Mortel 13
2.3 Co-creation from the Company Perspective
Previous section elaborated on the concept of co-creation. As explained the concept of co-
creation is based on the interaction between organizational structures and consumers. While
both are of paramount importance, the review will continue with an assessment of the
importance of co-creation for the company, strategic methods for implementation and the
possible implications. However, first of all the ingredients of a consumer-oriented firm will be
discussed.
2.3.1 A Pathway towards Successful Integration of Co-creation
If an organization will shift from product-centric to consumer-oriented practices the execution
of concepts, like co-production, mass-customization, becomes relevant. To extent and enrich
the consumer-oriented organizations with the concept of co-creation, it should be
implemented in the right format and have the right set of preconditions to create a customer-
centric model firm-wide. Such a customer-centric model entails more then solely improving
customer satisfaction. A customer-centric model means “collaborating with and learning from
customers and being adaptive to their individual and dynamic needs. A customer-centered
dominant logic implies that value is defined by and co-created with the consumer rather than
embedded in output” (Vargo and Lusch, 2004, p. 6).
While the concept of consumer-centricity is discussed for more then fifty years, many firms
are still struggling to align themselves to the customer-centric paradigm (Shah et al., 2006).
Often, the elements as organizational culture, organizational structure or financial-driven
structures deter a firm to align themselves. However, Shah et al. (2006) argue that if a
company focuses on leadership commitment, organizational realignment and financial
structures that better cover the non-monetary benefits, a firm will be able to adopt a
consumer-oriented business model.
2.3.1.1 The Organizational Structure as Basis for Co-creation Implementation
An ideal customer-centric organizational structure should have all functional activities
integrated and aligned in order to deliver superior customer value. In contrast to a structure
were products are dominant and with sales managers for specific products or product
categories, an integrated and aligned structure will be better able to identify customer needs
and able to provide a single point of contact for consumers (Day, 2003). Shah et al. (2006)
argue that such a single point of contact can be strengthened by segment marketers or
customer-based front-end units, with product providing back-end units to assemble solutions.
The Value of Co-Creation
J.L. van de Mortel 14
Another essential element for organizational realignment is based on the marketing function,
“whose role is critical in transforming the firm to customer centricity” (Shah et al., 2006, p.
120). The marketing department is of paramount importance to gather information, to develop
knowledge and skills and to connect the customer to the product. The best organizational
environment for the marketing department is based on a horizontal structure, which is less
hierarchical, based on natural work flows and enables rapid sharing of knowledge among all
team members. However, if a company for decennia is based on product-led growth, a hybrid
structure may be more feasible, combining horizontal and vertical structures (Day, 1999)
To overcome current challenges to transform organizational structures, like deeply rooted
functional differences in incentives, backgrounds, task priorities and time scales (Day, 1999),
Webster (1992) argues that customer-oriented values and beliefs should be the responsibility
of top management. A signal that acknowledges the importance of this consumer focus is the
designation of a Chief Customer Officer, which signals to stakeholders the intent to align the
organizational structure to the customer-centric paradigm on a boardroom level (Shah et al.,
2006).
2.3.1.2 Inclusion of Customer Knowledge and Relationship Management
The concept of co-creation has evolved over the past decennia. Market-driven or consumer-
oriented firms use for a while concepts to manage their knowledge about their consumers and
the knowledge that is residing in their consumers. Two concepts that preceded co-creation,
and are essential elements of co-creation, are Customer Knowledge and Customer
Relationship Management.
The objective of Customer Knowledge Management is to, in collaboration with customers,
create joint value and enhance organizational learning (Gibbert et al., 2002). However, often
Customer Knowledge Management is only based on employee’s knowledge about customers,
and has only the objective to reduce costs and improve efficiency at the company level. Both,
Customer Knowledge Management and co-creation enable a firm to gain information residing
in your customer based on interactive sessions. The main difference, however, is the final
outcome and implications of the process. While for Customer Knowledge Management the
outcome is not a criteria but a logical consequence, co-creation takes a broader view and
integrates the concept of Customer Knowledge Management with the final value that will be
generated.
The Value of Co-Creation
J.L. van de Mortel 15
In addition to Customer Knowledge Management, of equal importance in the process of co-
creation is Customer Relationship Management. Payne and Frow (2005, p. 168) define
Customer Relationship Management as “a strategic approach that is concerned with creating
improved shareholder value through the development of appropriate relationships with key
customers and customer segments” and “provides enhanced opportunities to use data and
information to both understand customers and co-create value with them”. Companies that
implement Customer Knowledge Management systems, will sense emerging market
opportunities before their competitors and more rapidly create economic value for the
corporation and its stakeholders, especially its consumers (Gibbert et al., 2002). Customer
Relationship Management will retain consumers, but the role of the consumer is often
passive, whereas in Customer Knowledge Management the role of the consumer is more
active and the consumer becomes a valuable partner in the value-creation process.
2.3.1.3 The Relevance of Intangible Assets and Financial Metrics
In recent years intangible assets have become more important, from a company and
shareholder point of view, in contrast to tangible assets (Abeysekera and Guthrie, 2004). The
role intangibles often play, is the creation of a sustainable competitive advantage (Villalonga,
2004) and as such contribute to future generation of cash flows (OECD, 2008). Nowadays
companies spend more economic resources on intangibles than on tangible assets and are,
consequently, the main cause of economic growth (Lev, 2001; Lev and Zambon, 2003).
Characterizing intangibles as assets that create future benefits can ran radically change the
way managers and investors see a business and make key decisions about it. However, many
have argued that the traditional accounting methods are inadequate in capturing intangible
assets in financial reporting (Edvisson, 1997; Lev & Zarowin, 1999; Garcia-Ayuso, 2003; Lev
& Zambon, 2003, Burgman & Roos, 2007). “The GAAP-based accounting systems that all
companies use today were designed for stable business environments in which the most
important assets were psychical” (Prahalad and Ramaswamy, 2000, p. 87). So far, GAAP
requires companies to report intangible assets acquired form other entities, but does not
consider in-house developed identifiable intangible assets (IASB, 2008). However, the
accounting for intangible assets is relevant since extensive research shows that intangible-
intensive organizations are systematically underpriced (Lev, 2004) and that “comprehendible
data on a company intangible investments give investors a more complete picture of the
company’s capital than the one GAAP provides” (Lev, 2004, p. 115)
The Value of Co-Creation
J.L. van de Mortel 16
Despite the potential of intangible assets, they are often considered to be risky from a
shareholder perspective, since their value is hard to estimate. Due to the fact that intangibles
are rarely traded, the information asymmetry between organizations and shareholders, and the
related lack of transparency, a misallocation of funds in intangible-intensive organizations is
often the result (OECD, 2008). Consequently companies with an overabundance of intangible
assets may find it hard to attract capital.
Internal financial metrics play a crucial role in motivating individual employees, but, most
important, are also relevant to measure the financial implications of decision-making by the
marketing department and to think of intangible assets as investments (Srivastava et al., 1998;
Srinivasan and Hanssens, 2009). The latter is important because the transformation to a
customer-centric organization is often costly.
The challenge lies in the quantification of marketing assets, like brand equity, customer
satisfaction and customer life time value, to determine the optimal level of investments in
those assets. Johnson and Schultz (2004) argue that a firm should measure the impact of at
least two or three relevant intangible assets, like co-creation, and report those results regularly
to the senior management. Additionally, the results should be used to allocate incentives, e.g.
a sales manager is rewarded for increasing the equity and a relationship manager is rewarded
for extending the customer lifetime value.
2.3.2 A Framework for Co-creation
So far, two models for a proper inclusion of co-creation practices are proposed, a model by
Prahalad (2004b), based on four building blocks and, secondly, a model by Payne et al.
(2008) that is build around the centrality of processes.
To set up a system for co-creation, Prahalad (2004b) introduces four building blocks as the
basis for interaction between the consumer and the organization. Dialog, Access, Risk-Benefit
and Transparency (DART) are needed to create a solid basis for the interaction (see figure 5).
Key ingredient is the dialogue between the organization and consumer. The dialogues, often
based on platforms, online communities and forums, but still often on a face-to-face basis,
create a social community and allow consumers to satisfy their social needs (Etgar, 2009).
The dialogue implies a deep level of engagement, interactivity and the ability and willingness
to act on both sides. Results are best when both participants, consumer and organization, are
equal and joint problem solvers.
To improve the quality of the dialogue consumers should have easy access and transparent
information. Traditionally, organizations benefitted from the information asymmetry between
The Value of Co-Creation
J.L. van de Mortel 17
the organization and the consumer, but nowadays have to reduce these barriers for effective
communication. Therefore an organization has to invest in infrastructure capabilities, enable
experiences and facilitate self-expression.
A final issue in the interaction between organization and consumer is the Risk-Benefit
building block. Both parties will be able to manage risk and evaluate the co-creation practices
on the trade-off between risk and rewards. Organization will no longer be competent to solely
manage those risks in a co-creation setting, and consequently a new level of trust between the
company and the consumer has to be established (Prahalad, 2004b).
*** Insert Appendix A, figure 5 & 6 here ***
Next to the building blocks of Prahalad, Payne et al. (2008) developed a framework (see
figure 6) based on the centrality of processes. Those “processes include the procedures, tasks,
mechanisms, activities and interactions which support the co-creation of value” (Payne et al.,
2008, p. 85). Three key processes are, respectively, the Customer and Supplier (Organization)
Value Creating Processes and the Encounter processes.
The customer value-creating processes, built around the fact that meaning is created by
experiences, recognizes the consumer’s ability to create value based on the consumers amount
of information, knowledge and other operant resources. The link (figure 6) between customer
processes and customer learning indicates the positive learning processes a consumer goes
through based on experiences, improving future co-creation practices. The supplier value-
creating processes, assists co-creation through the design and delivery of relevant consumer
experiences and, additionally, facilitates organizational learning. To conclude, the encounter
process describes the interaction between the organization and the consumer, initiated by
either the organization or the consumer.
Additional to the theories of Payne (2008) and Prahalad (2004b), Almirral and Casadesus-
Masanell (2010) argue that the level of product complexity is of vital importance for the
success of co-creation as can be seen in figure 7. For very simple products, like a calculator or
a basic phone, a company can probably find the best innovation solutions on its own and does
not need to expose itself to potential conflicts over the product’s development and marketing.
However, if products become more complex they should outperform simple products.
Therefore a company stands to benefit greatly from ideas that may emerge from a partner
with a different set of priorities, and the benefits of those ideas outweigh any negatives from
differences over development and marketing. Finally, Almirral and Casadesus-Masanell
The Value of Co-Creation
J.L. van de Mortel 18
(2010) argue that the most complex products, based on “rocket-science”, and technologies
that push the design envelope, should be innovated within the company.
*** Insert Appendix A, figure 7 here ***
2.3.3 Key Performance Indicators of Co-creation
A major drive to engage in co-creation is economic. The best illustration hereof is given by
the illustration of the related concept of co-production. Through co-production, consumers
reduce production cost for manufacturers and retailers due to their participation in activities
along the value creation chain. These costs reductions will result in price reductions for
consumers, but imposes other costs upon the co-producing consumers. These reflect the fact
that such cost reduction is achieved by transferring the work previously done by the firm to
the co-producing consumer. To perform these activities, consumers need to use various
resources, e.g. time, and the impact of these costs must be considered by consumers before
they decide whether their contribution in the co-production is worthwhile (Bendapudi &
Leone, 2003).
Besides lower production costs, several other benefits of co-creation include the impact on
traditional innovation practices and processes, the affect on the quality and speed at which
decisions are made in relation to the development and filtering of ideas, the creativity enabled
at individual and group level and the impact on organizational learning. However, to express
the impact and success of co-creation figure 8 illustrates an overview of several performance
indicators (also used in Appendix B, Framework 1). The figure shows that for the different
stages different measurements can be used. In the phase of ideation, the level of perceived
innovativeness and, better observable, the number of new products ideas and new patents can
be measured to quantify the benefits of co-creation. Once the results of co-creation practices
reach the in-use stage, success can be measured through customer satisfaction and loyalty
(including word of mouth) as well as through financial indicators such as increased market
share. The latter can be assessed more objectively then for instance the perceived
innovativeness and will consequently be preferred by organizations.
*** Insert Appendix A, figure 8 here *** 2.3.4 Problems Associated with Co-creation
Besides the multifaceted benefits, the collaboration with players outside the organization has
also some potential problems. A first problem that may arise is the fact that company
The Value of Co-Creation
J.L. van de Mortel 19
processes will have an increased dependency on the consumer which in extreme case may
result in delayed outcomes or to the disruption of business processes. Secondly, there are
costs associated to the coordination of co-creation activities. The facilitation structures have
to be managed and organizational structures have to be rearranged in a way that will
maximize co-creation benefits. Additionally new management skills, like negotiation,
collaboration and cross-boundary knowledge transfer skills (Roser et al., 2009) are required.
A final issue is the access given to customers to confidential information and proprietary
skills. The latter could be a reason for companies to limit the information provided to
consumers. However, this can have serious consequences for the benefits of co-creation.
The disadvantages may serve as a threshold for companies to implement co-creation
initiatives and brings new challenges that have to be dealt with throughout the organization.
Nonetheless, none of the problems will have a devastating impact on the potential benefits of
co-creation. Consequently, organizations should use their technological, organizational and
marketing competences to better deal with a changing environment and increased complexity.
In the new economy the generation, combination, dissemination and application of knowledge
and ideas are key to achieve sustainable success. To access their collaborative capacities,
firms must critically evaluate their experiences with different modes of collaboration and
identify necessary improvements, for instance, with the help of in-depth case studies
(Prahalad, 2004b).
2.4 Co-creation from a customer perspective
Nowadays, organizations in highly competitive and innovative markets must build market
share quickly and deliver fast, high-quality and innovative solutions. As discussed in the
previous section, a key competence is to create organizational learning and knowledge
management (Drucker, 1993; Prusak 1997). A high quality customer knowledge management
can be seen as a process that generates knowledge about specific customers and seeks
opportunities for partnering with their customers as equal co-creators of organizational value
(Day, 1999).
Essential for successful co-creation is to understand why customers are willing to participate
in co-creation. Consumers are only willing to share their creative ideas, honestly state their
product preferences, and spend significant amounts of time modifying existing product
concepts if their expectations are met. Therefore, consumer expectations and motivations
should be considered to utilize the full potential of co-creation. The best way to understand
The Value of Co-Creation
J.L. van de Mortel 20
those expectations is with the help of segmentation (Gruner, 2000). The more a company can
break down its customers into different groups with different needs and expectations, the
better it can serve them (Day, 2003).
Fuller (2010) identifies ten different categories of motives that motivate consumers in co-
creation. Two motives are categorized as intrinsic motivation. The first, intrinsic playful task
argues that individuals contribute to new product development because they may consider it
as a playful and enjoyable activity (Deci & Ryan, 2002). The other, curiosity, argues that
consumers may engage in co-creation projects just because they are curious and have a desire
of knowledge because of intrinsic reasons.
Besides the intrinsic motives, Fuller identifies six internalized extrinsic motives. Firstly,
consumers may participate in co-creation to get in touch with like-minded people (Making
friends). Beyond the interest in the topic, the social aspect and the possibility to get in contact
with like-minded people can motivate them (Community support) (Hennig-Thurau et al.,
2004). Additionally, consumers may derive a sense of accomplishment due to their
contributions, which is known as self-efficacy. Moreover, motives as Information-Seeking and
Recognition Visibility may be a reason because consumers seeking innovation or product-
related information pertinent to their hobby, upcoming product purchase, or just through
novelty seeking behavior (Manning et al., 1995) and are motivated “to share their know-how
and participate in activities for ego gratification or the desire for peer recognition” (Franke
and Shah, 2003, p. 162). Finally, skill-development can be a possible driver, since consumers
want to improve their skills, gain new knowledge and want to find solutions to hitherto
unanswered questions.
The final two motives are entirely extrinsically motivated. Fuller (2010) argues that
consumers “start to modify or develop their own products because they are dissatisfied with
existing products and because they derive benefit from using their innovation” (Fuller, 2010,
p. 105), labeled as Personal Need-Dissatisfaction. Ultimately, immediate or delayed rewards
or compensation may be a motive for consumers to engage in co-creation.
If a customer knowledge management system can identify to which extent a consumer is
motivated, i.e. intrinsic or extrinsic, a company can better understand the behavior of a
customer. As can be seen in figure 9, intrinsically motivated consumers exhibit more often
experiential-oriented behaviors and, on the contrary, extrinsically motivated consumers tend
to prefer goal-oriented behaviors (Hoffman & Novak, 1996). The latter is characterized by
situational participation, selective engagement and utilitarian benefits (Hoffman & Novak,
The Value of Co-Creation
J.L. van de Mortel 21
2009), while experiential-oriented behavior is “characterized by enduring involvement,
ritualized orientation, interest in the medium and the content, non-directed engagement, fun,
affect, less intentional and selective orientation, time-filling and recreation activity, and
hedonic benefits” (Fuller, 2003, p. 103).
Moreover, extrinsically motivated consumers highly value incentives, like financial
compensation or being named as co-developer (figure 10). Intrinsically motivated consumers,
on the other hand, may be animated by incentives to make more and even better contributions.
However, those incentives may crowd out intrinsically motivated consumers as well.
Consumers may realize that they can gain economic benefits with their ideas and
consequently perceive the compensation by the organizations as unfair. Consequently, in
general incentives will attract consumers that otherwise would not participate, but do
sometimes results in “conceptualized minimax” (Kruglanski et al., 1977), i.e. consumers will
reduce their input and amount of effort to a minimum for the maximum possible amount of
reward. Therefore, the consequences of the incentives have to be evaluated, to analyze the
impact on co-creation success.
*** Insert Appendix A, figure 9 & 10 here ***
Based on cluster analysis on the different kind of motives, Fuller (2010) distinguishes four
kinds of customers that engage in co-creation, i.e. reward-oriented consumers, need-driven
consumers, curiosity-driven consumers and intrinsically-interested consumers. Fuller (2010,
p. 113) states, that “intrinsically-oriented and reward-oriented consumers show high and
enduring interest in virtual co-creation projects”, while curiosity-driven and need-driven
consumers participate because of a singular reason, i.e. curiosity or dissatisfaction with
existing product solutions. Subsequently, intrinsically-interested and reward-oriented
consumers are most appropriate for co-creation engagement.
Besides consumer specific incentive schemes, task design or partners, the allocation of
consumers’ idiosyncratic input should be considered, because consumers’ personal drivers are
related to specific stages in the value chain (Fuller, 2010; Kamp, 2009). If the major motive of
a consumer is monetary, the consumer should be involved in the testing of new products,
whereas consumers with the drivers curiosity and intrinsic interest are suitable for idea
generation (figure 10).
The Value of Co-Creation
J.L. van de Mortel 22
3. Research Design
The remainder of this thesis elaborates on the empirical investigation on performance
indicators of firms that employ co-creation. At first, a framework is developed to illustrate the
impact of co-creation on a business chain. Thereafter, the right set of variables and the
operationalization of the co-creation concept will be described. Chapter four will portray the
reliable and valid models, which with the help of statistical programs prove the economic
significance of co-creation.
3.1 Research Agenda
Based on the models developed by Rust et al. (2004) and Srivastava et al. (2001) a framework
is constructed to illustrate the impact of co-creation. The framework of Srivastava et al.
(2001) represents the relation between investments in market-based assets and value
extraction, which is an improvement on the model written by Srivastava et al. (1998) that
described the link between market-based assets, market performance and shareholder value.
The framework of Rust et al. (2004) links firm actions to marketing outcomes and the
combined impact on firm value.
Framework 1 illustrates the impact of co-creation. The data analysis will focus on the impact
of co-creation on parameters in the categories financial ratios and financial position.
Financial performance is deliberately not analyzed in this thesis. Assessing the relation
between stock performance and the implementation of market-based assets would require a
meticulous time-series analysis to extract meaningful statistics.
*** Insert Appendix B, Framework 1 here ***
Based on the framework three hypotheses are derived. Firstly, given the potential that co-
creation creates sales, results in innovations and improves business processes it is expected
that co-creation positively contributes to indicators that measure business performance as
formulated in the first hypothesis (the variables are discussed extensively in section 3.3.2.)
Secondly, given the literature on co-creation (e.g. Sanders and Simons, 2009; Prahalad and
Ramaswamy, 2004b) co-creation can reduce direct labor and overhead costs resulting in a
lower Cost of Goods Sold to Sales. Finally, the fact that shareholders recognize the positive
impact of co-creation on firm performance results in a higher Tobin’s Q for firms that employ
co-creation and is stated in hypothesis 3.
The Value of Co-Creation
J.L. van de Mortel 23
H1 Co-creation is positively associated with the firms’ Return on Assets, Return on Equity,
Return on Invested Capital, Net Income Growth, Cash Flow to Sales, Operating Profit
Margin and Gross Profit Margin.
H2 Co-creation is negatively associated with firms’ Cost-of-Goods-Sold-to-Sales.
H3 Co-creation is positively associated with the firms’ Tobin’s Q.
3.2 Sample
The companies under investigation in this thesis are all the firms listed on the S&P 500 on
January 12, 2010. This is an appropriate sample because of three main reasons. First of all,
the data on these firms is present in the databases of CompuStat and Thomson ONE banker,
enabling a sound data analysis on financial performance indicators. Secondly, during the
literature study already several companies, listed on the S&P500 were identified that exploit
co-creation, indicating that within the sample, a certain number of companies use co-creation.
Finally, the S&P 500 provides a broadly defined sample, with a diversified set of companies,
each with a different focus on innovation and marketing, specific business practices and
various levels of customer-orientation.
3.3 Variables
Although that some studies analyzed the impact of co-creation on consumer variables, like
number of customers, the retention levels (Gupta et al., 2004), detailed customer satisfaction
rates (Ittner and Larcker, 1998), number of complaints by customers and the brand awareness
(Barth et al., 1998; Fuller, 2010), this research focuses on idiosyncratic financial performance
measures. Detailed descriptions of the variables used are given.
3.3.1. Independent variables
3.3.1.1 Operationalization of co-creation
A structured content analysis is applied to translate the results of a keyword search tool for
each firm, into scores for co-creation (Ferrier, 2001; Allen et al., 2009). A keyword search
tool from Google.com was used to ransack corporate information on the use of co-creation.
The corporate website from the company was the unit of analysis and included at least the
corporate information for investors and the news articles published by the company itself. If
The Value of Co-Creation
J.L. van de Mortel 24
an additional server or domain was used, next to the primary company website, the additional
server was ransacked as well. The use of corporate website for the operationalization of co-
creation was a convenient method, since many companies use their website as their primary
communication channel for corporate information.
An iterative process was used to investigate the right sets of keywords to maximize the
available, relevant content to analyze. Keyword sets that were to narrow, like “Customer-
Involvement” or “Customer Engagement”, gave too few results. Therefore, a specific
keyword set was solely focusing on co-creation and two others were broadly defined,
increasing the number of results given by the keyword search tool. Finally three searches
were performed with different sets of keywords. The first keyword set was constructed as
follows: “co creation” OR “cocreation” OR “co create” OR “cocreate”; the second as:
“consumer” OR “consumers”; and the third set as: “customer” OR “customers”.
The keyword search tool returned in total 9,612 results (4,752 disregarding Yahoo, Google
and Amazon.com) for the first set of keywords. Of the 500 companies in the sample, 63 firms
had a positive integer on the first set of keywords with an average of 152 (µ=79, if the results
of Yahoo, Google and Amazon.com are not taken into consideration). Since the websites of
Amazon.com, Yahoo and Google include many references to other websites or irrelevant
products, the results are not representative if those results are taken into consideration. The
second and third set of keywords gave respectively 1,861,534 and 8,570,988 results
(66,744,534 and 135,042,988 results if the results of Amazon.com, Google and Yahoo are
taken into consideration). So the average amount of results per firm was 3,746 and 17,245
(without Google, Yahoo and Amazon.com), with a respective standard deviation of 6,117 and
28,361 illustrating the large deviations in the amount of results in the sample.
The results were screened for co-creation and quotes were recorded in the case of relevant
signs of co-creation. If more then 2,000 result were given by the keyword search tool for the
second and third set of keywords, an additional keyword was added (like “involvement”,
“engagement” or “input”) to speed up the search for relevant quotes. A snapshot of the quotes
can be seen in Appendix B, Table 1.
To quantify the eminence of co-creation the quotes were analyzed based on a framework
specifically developed for this thesis, since no proper scaling method was available in existing
literature. However, inspiration was drawn from the quantification of brand value (Barth et
al., 1998) and an intensive literature review on co-creation. The framework (see Framework
2) illustrates the elements that together composed the score for co-creation for each specific
The Value of Co-Creation
J.L. van de Mortel 25
firm in the sample. The different elements are Interaction, Intensity, Scale, Initiative, Created
Value, and Paragon of Co-creation.
The element Interaction indicates the necessity of the involvement of both parties, consumers
and companies, and one extra point was given if the Initiative was taken by the company.
Intensity represents the strength of engagement; while Scale corresponds to the extent co-
creation is applied within the firm. Created Value measures whether the outcome of the co-
creation process resulted in joint value creation. Paragon of Co-creation was used to allocate
an additional point to those firms who mentioned, for instance, co-creation in their mission
statement or to those that are a shining example of co-creation, like for instance Nike with
Nike ID.
*** Insert Appendix B, Table 1 and Framework 2 here ***
Each of the six elements is rewarded with a maximum of one point, making it possible to
score in total a maximum of six, albeit the maximum score given was five. Although the fact
that the quotes are evaluated on the six elements (see Framework 2), only a singular overall
score per firm is given. Since only a maximum of two quotes was recorded, while
components of co-creation were present in other quotes, and sometimes the overall
impression of the quotes was taken into consideration, it was not practical to score the
specific components. Finally, the scoring model resulted in a scale standing midway between
a Likert scale and an ordinal scale.
To check the reliability and validity of the scores for co-creation two peer-students were
asked to score each the quotes for a sample of hundred firms. However, the scores were
almost identical and no significant deviations in scoring, between the scores of the author and
the scores of the peer students, were present. Therefore, the scores for co-creation given by
the author were used for further analysis.
The dispersion of the 500 companies among the scores for co-creation can be seen in
Histogram 1. 284 companies had a score for co-creation of zero, after the evaluation of all the
results of the keyword search tool, indicating that those companies did not use the concept of
co-creation or did not explicitly communicate the use of co-creation practices via their
corporate website. The remaining 216 companies were disproportionately allocated among
the categories, with 95 companies in category 1, 54 in category 2, 26 in category 3, 20 in
category 4 and 21 in category 5.
*** Insert Appendix B, Histogram 1 here ***
The Value of Co-Creation
J.L. van de Mortel 26
The first keyword set resulted in a selective amount of results (4,572 results), but of the 63
companies that had at least one result for the first search performance, 53 had a positive score
for co-creation (averaging 3.50). Of the twenty companies in the highest category for co-
creation (ccscore = 5), 19 companies had at least one result for the first keyword set,
indicating a strong relation between the results for the first keyword set and the score for co-
creation (Correlation = 0.3316).
The relation between the score for co-creation and the second and third keyword set was less
obvious, the more so since many companies indicated their awareness of customer
satisfaction, resulting in more hits. However, a customer focus is not necessarily linked to co-
creation. The correlation between the co-creation score and the results for the second keyword
set is only 0.1214 and 0.1957 for the third keyword set.
This was clearly visible at the sectors Customer Discretionary (GICS® Sector code 25) and
Telecommunication Services (GICS® Sector 50). Companies in the Customer Discretionary
and Telecommunication Services sector had on average 6,839 and 13,847 results for the
second keyword set (sample average is 3,746) and 29,095 and 32,135 for the third keyword
set (sample average is 17,245), while their respective average co-creation score was only 0.86
for Customer Discretionary and 0.67 for companies in the sector Telecommunication Services
(sample mean is 0.94).
3.3.1.2 The control variables
The validity of the models used should be proven to make sure that the difference in the
values observed represent equal changes in the true underlying measure and not the impact of
other factors (Pedhazur & Pedhazur-Schmelkin, 1991). Jegadeesh and Titman (1993) argue
that it is necessary to control for the effect of company size, industry and age in a comparable
study. The necessity to control for size is shown, for instance, by Bommer and Jalajas (2004),
who illustrate that small and medium-sized enterprises valued customers and marketing more
highly, whereas large organizations valued the importance of relationships with other
businesses and suppliers in particular. The explanations on the variables Sales and Age are
described in Appendix B, Table 2. A short elaboration is given on the control variable
Industry.
The Value of Co-Creation
J.L. van de Mortel 27
Industry
Because industry is a categorical variable, the ten GICS® sectors of interest in this study are
converted into a set of dichotomous independent variables (Tabachnick & Fidell, 2001).
Consequently, the 10 dichotomous variables are entered into the regressions as dummy
variables, controlling for the relevant sector. In the regressions described in section 4.2 the
GICS® sector Utility (GICS® Sector code 55) is used as baseline and therefore not visible in
the relevant statistic summaries in Appendix B.
3.3.2 Dependent variables
To test the impact of co-creation on financial ratios and financial position specific variables
are identified to test the impact of co-creation (ccscore). Those variables are technically
described in Table 2 and theoretically explained below.
*** Insert Appendix B, Table 2 here ***
Return on Assets / Return on Equity / Return on Invested Capital - It is assumed that Return
on Assets, Return on Equity and Return on Invested Capital is higher for companies that use
co-creation, because of two reasons. First of all, because of the higher return on business
processes due to an increase in sales and side effects of customer satisfaction. Secondly,
because companies that use co-creation have business processes with relatively lower costs.
Specifically, the Return on Assets is assumed to be higher since companies that use co-
creation have relatively more assets than stated in their balance sheet, since the intangible
processes are not recognized in current accounting methods (Lev, 2004).
Net Income Growth - The Net Income Growth illustrates the firms’ ability to improve their
profitability. It is expected that co-creation will contribute to an increase in Net Income
Growth because of improved business processes and an increase in sales volume due to e.g.
high customer retention and satisfaction rates and new product developments.
Cost of Goods Sold to Sales - The literature study suggest that co-creation will decrease the
Cost of Goods Sold to Sales. Cost of Goods Sold does not include advertising expenditures
and expenditures on Research on Development, which are assumed to be lower when co-
creation is present, but do include direct labour and overhead costs. However, Corbett (1998)
argues that GAAP and the International Accountings Standards (IAS) do not correclty reflect
on Cost of Goods Sold. Corbett argues that direct labour and overhead costs should not be
incorporated in the Cost of Goods Sold, thereby diminishing the impact of co-creation on the
Cost of Goods Sold.
The Value of Co-Creation
J.L. van de Mortel 28
Cash Flow to Sales - Srivastava et al. (1998) point out that market based assets, on the one
hand, can result in an acceleration of cash flows due to a faster response to marketing needs,
earlier brand trials, strategic alliances and cross promotions. On the other hand, market based
assets can results in an enhancement of cash flows due to the development of new uses, a
reduction of working capital and lower sales and service costs. With co-creation it can work
both ways and consequently a higher Cash Flow to Sales ratio is expected for firms that have
co-creation aspirations. Moreover, Srivastava et al. (1997) argue that processes similar to that
of co-creation can reduce the vulnerability and volatility of the cash flows, but that is beyond
the scope of this thesis.
Operating Profit Margin – Disregarding the fact that it is often hard to compare idiosyncratic
Profit Margins, due to firms’ specific operating and financing arrangement, it is a good
overall measure because of two reasons. First of all, a low Operating Profit Margin increases
risk and results in a low margin of financial safety, while co-creation is expected to increase
stability and financial performance. Additionally, the Operating Profit Margin illustrates the
firm’s ability to control cost and quality of profitability.
Gross Profit Margin - Given the potential of co-creation to reduce the Cost of Goods Sold,
ipso facto the Gross Profit Margin (Net Sales minus Cost of Goods Sold divided by Net
Sales) will be higher. If a model is applied with Gross Profit Margin as dependent variable, it
is especially important to control for industry related factors since for some industries, like
Customer Discretionary, Gross Profit Margins are expected to be around 40%. However, for
companies in the GICS® Sector Information Technology, the gross profit margin can be more
than 80%.
Tobin’s Q - Tobin’s Q is a good parameter to measure the impact of co-creation since it takes
into consideration the assets employed by the firm, the market sentiment and the intellectual
capital (Tobin, 1969). The value of intangible assets lies in their contribution to generate
future cash flows. The discrepancy between market and book value suggests that investors
recognize this (Fama, 1970).
The Value of Co-Creation
J.L. van de Mortel 29
4. Results
4.1 Descriptive statistics
It is useful to discover the differences between companies that do use the principles of co-
creation and those that do not use the principles of co-creation. Therefore an initial analysis
will detail the characteristics of companies that implement co-creation. A start is made with
an analysis of the differences in co-creation scores among sectors. Thereafter the firm
characteristics Age, Beta and Free Cash Flow to Sales will be examined.
To test for differences among the different GICS® Sectors a KruskalWallis test is applied. The
KruskalWallis test is suitable to test equalities of population medians among the sectors,
comparable to a one-way ANOVA test, with the data being replaced by their ranks and is an
extension of the MannWhitney U test (Kruskal and Wallis, 1952). Given the high Chi Square
value (χ2=89.42) and the significance at 0.000% we can conclude that there is a statistically
significant difference in the score for co-creation across the GICS® Sectors. A closer look on
the Mean Ranks given by the KruskalWallis test suggests that Information Technology,
Consumer Staples and Industrials, have the highest score for co-creation, while the sector
Financials reports the lowest.
*** Insert Appendix B, Table 3 and Table 4 here *** The differences among sectors is in line with the reasoning of Almirall and Casadesus-
Masanell (2010), who argue that co-creation is only beneficial at a certain level of product
complexity (see Appendix A, figure 7). Many companies in the GICS® Sectors Energy and
Utilities have either very complex, like the drilling-technology for oil companies, or very
basal company processes, diminishing the possible positive impact of co-creation.
Additionally, companies in the GICS® Sectors Energy and Utilities have considerably more
Business-to-Business relations, enabling companies in those sectors to establish partnerships
and collaboration possibilities, but limiting the opportunities to jointly create value with the
consumer. Finally, many scholars (e.g. Schneider & Bowen, 1995; Zeithaml et al., 1990) have
highlighted the distinctions between goods and services and have underscored the
implications of these differences for business processes and the related difficulty in
comparing various dimensions of performance indicators.
Appendix B, Table 5 details the level of implementation and the mean score for co-creation
considered on an industry level. The mean score is highest for the industries Technology
Hardware, Software and Automobiles, although the latter has actually only one company with
a score for co-creation above 2. While banks often have a focus on customer satisfaction the
The Value of Co-Creation
J.L. van de Mortel 30
respective industry mean is low, just as for the industries Real Estate, Diversified Financials
and Insurance. Additionally, there are respectively 7 and 5 companies in the industries Food,
Beverage and Tobacco; and Retailing with a co-creation score equal or larger then 3,
illustrating the potential for co-creation in those industries.
*** Insert Appendix B, Table 5 here ***
Besides the differences for co-creation scores among GICS® sectors and industries, several
ANOVA tests illustrate the differences for companies with a specific co-creation score. Table
6 shows the statistical significance of the differences among co-creation categories and
graphically illustrates the respective discrepancy on inter alia Return on Assets, Return on
Equity, Tobin’s Q and Free Cash Flow to Sales. Three firm characteristics will be elaborated,
namely a firm’s Beta and the Free Cash Flow to Sales.
*** Insert Appendix B, Table 6 here ***
As argued by Prahalad (2004b) a new class of firms is emerging. According to his theory this
new class of firms uses co-creation practices. Subsequently, it is expected that firms with a
higher score for co-creation are relatively young. This is not the case. As can be seen in Table
6, the age is slightly decreasing with co-creation, but not significantly. This indicates that
firms that employ co-creation are not relatively younger, but does indicate that old, traditional
firms, like Harley Davidson and Pepsico are able to adopt co-creation practices.
The test statistics in Table 6 show that companies with a co-creation score have a substantial
lower beta. Since, beta is an indicator of firm specific risk (Rego et al., 2009), it can be
assumed that co-creation reduces the vulnerability and volatility of business performance.
This is in line with recent theories on market based assets (Srinivasan and Hanssens, 2009;
Rego et al., 2009). The lower beta for firms is beneficial for two reasons. First of all, a
reduction in firm risk has an immediate impact on firm’s market value (Amit and Wernerfelt,
1990). Secondly, firm risk also determines a firm’s cost of capital (e.g. Merton 1987), thereby
creating or limiting strategic opportunities.
Additionally, Table 6 illustrates the higher ratio on Free Cash Flow to Sales for companies
that employ co-creation. Since the intrinsic value of a firm is dependent on the present value
of all future free cash flows, according to the discounted cash flow model, a higher Free Cash
Flow ratio will increase market value and is in the interest of shareholders, especially since
Free Cash Flows are often used to pay dividend to the shareholders.
The Value of Co-Creation
J.L. van de Mortel 31
4.2 Regression analysis
4.2.1. Ordinary Least Square Analysis
To test the hypotheses of section 3.1 an Ordinary Least Square analysis is used. Given the
nine different dependent variables, the three control variables and the variable of interest
ccscore, the proposed regression for this study is as follows.
Dependent Variable i = α 0 + β1ccscorei + β2agei + β3 lnSalesi + β4Sec10 i + β5Sec15 i + β6Sec20i
+β7Sec25 i + β8Sec30 i + β9Sec35 i + β10Sec40 i + β11Sec45 i + β12Sec50i + β13Sec55 i +ε i
Table 7 illustrates the test statistics of the nine Ordinary Least Square regressions. The
variables ROA, ROE and ROIC are taken in their natural logarithm because they are not
normally distributed.
The economic interpretation of the results for co-creation is striking. For the nine regressions
the coefficients for ccscore are all in line with the hypotheses in section 3.1. However, the
coefficient for ccscore is not significant in the regressions with Return on Invested Capital
and Operating Profit Margin as dependent variable. On average the explanatory power of the
models is sufficient (R2 varies from 0.0832 up to 0.3420).
For Return on Assets an increase in ccscore from 0 to 1, increases ROA by 6.72%
(e0.065=1.0672) and Return on Assets is on average 38.4% higher (e5*0.065=1.384) for a firm
with a co-creation score of 5. Whereas the Gross Profit Margin on average is 40%, firms with
a ccscore of 5 have on average a Gross Profit Margin that is 11.4% higher than firms with a
ccscore of 0. Logically, an opposite changes of 13.62% can be observed for the Cost of
Goods Sold to Sales. The magnitude in the changes of Cash Flow to Sales is less, but still
noteworthy, a difference of 5% between firms without co-creation a firms with a co-creation
score of 5, ceteris paribus. The respective difference between firms with ccscore=0 and
ccscore=5 with respect to Tobin’s Q and Operating Profit Margin is respectively 0.36 and
2.52, ceteris paribus.
*** Insert Appendix B, Table 7 here ***
To test the whether there are eventual problems related to heteroscedasticity, the Cameron and
Trivedi’s decomposition of the IM-test and the Breusch-Pagan/Cook-Weisberg test for
heteroscedasticity, see Table 7, are applied. The latter tests the null hypothesis that the error
variances are all equal versus the alternative that the error variances are a multiplicative
function of one or more variables. The test statistics indicate that problems for
heteroscedasticity are present in several regressions, thereby weakening eventual conclusions
The Value of Co-Creation
J.L. van de Mortel 32
drawn from the test statistics. To analyze the magnitude of multicollinearity the size of
VIF(âi) is analyzed. Although, the fact that a common rule of thumb states that
multicollinearity is high, when VIF(âi) is larger then 5, no VIF(âi) exceeds 10. Thus the
eventual impact of multicollinearity is only marginal (Wooldridge, 2006).
To better predict the impact of co-creation on the respective dependent variable the model is
extended with the exponential derivative of co-creation. Consequently, the model becomes:
i
i
ecececec
ecececececec
Salesagescorecscorec
εββββββββββ
ββββα
+++++
++++++
++++=
i14i13i12i11
i10i9i8i7i6i5
i4i32
2i10i
55S50S45S40S
35S30S25S20S15S10S
ln c c VariableDependent
The increase in explanatory power relative to the regression with only ccscore, is marginal.
There is a reduction in the R2, for ROA, ROE and ROIC, since they are not longer are taken
in their natural logarithm, but makes the interpretation of the results more comfortable.
However, the interesting effect in the regression with the exponential variable ccscore is that
firms with a co-creation score of 1 and 2 score in some regressions models (i.e. ROA, ROE,
ROIC, Net Income Growth, CFtS and OPM) lower for a certain dependent variable on
average then companies with a co-creation score of 0. This indicates that co-creation is not
always beneficial, especially when co-creation is only partially implemented, and co-creation
can only be to your advantage when there is total commitment towards co-creation principles.
Subsequently, companies with a score of 3 and higher have substantial benefits.
The economic benefits in table 8 illustrate significant increases in the financial performance
indicators, the Return on Assets is 476 basis points higher for a company with a co-creation
score of 5, which from a financial perspective is plausible. A similar result is found for the
Return on Invested Capital, with a respective increase of 436 for firms with a co-creation
score of 5 and 197 for firms with a co-creation score of 4. As with the results of the previous
model the change in COGS and GPM is of the same magnitude; a decrease of 16.98% in
COGS and an increase of 16.10% in GPM when the score for co-creation is five (for
ccscore=4, the change is respectively -10.87% for COGS and 11.10% for GPM).
Additionally, whereas, the average Net Income growth is 7.21% an increase of 3%, 7.2% and
13% is expected for firms with a co-creation score of respectively 3, 4 and 5.
Less realistic are the coefficient for Return on Equity which predicts an increase of 64.18%
for firms with a co-creation score of 5 and 34.65% for firms with a co-creation score of 4. The
The Value of Co-Creation
J.L. van de Mortel 33
outlier Amazon.com probably causes this to a certain extent. While the average Return on
Equity per share is 18.25%, Amazon.com has a score of 893.17%, disturbing the reliability of
the coefficients for ccscore and ccscore2 (see the Breusch-Pagan/ Cook-Weisberg test for
heteroscedasticity with respect to ROE in table 7).
To test the impact of co-creation and its exponential derivative a Wald test is used (Wald,
1940). Instead of a Wald test, a Likelihood Test of Lagrange Multiplier Test could be used.
Agresti (1990) states that the Likelihood Test should be preferred over the Wald test,
especially in cases with a small sample size or large parameters. However, Engle (1983)
proved that all test are “asymptotically equivalent”.
*** Insert Appendix B, Table 8 here ***
The results of the Wald Test Statics can be seen in Table 8. All models have coefficients in
line with the three hypotheses stated in section 3.1, and the combinations of ccscore and
ccscore2 is significant with respect to all variables except for Return on Invested Capital.
Therefore, one can conclude that co-creation indeed contributes to firm performance and that
clear economic significance is present in the findings.
4.2.2. Robust Regression
There is chosen not to manually delete outliers, but instead a Robust Regression is applied.
There are several improvements of a Robust Regression over an Ordinary Least Square
regression, mainly relating to heteroscedasticity errors and the presence of outliers
(Rousseeuw and Leroy, 1987). Both are a reason to consider a Robust Regression in this case.
Notwithstanding the only small evidence of heteroscedasticity in the OLS regressions for
COGS, CFtS, OPM and Tobin’s Q in section 4.2.1, the Robust Regression will transform the
dependent variables, to reduce skewness and improve the normality, linearity, and
homoscedasticity of residuals (Tabachnick & Fidell, 2001) to better deal with a probably
larger variance among firms with a higher co-creation score. Thus the Robust Regression
allows the variance to be dependent on the co-creation score, which is often the case in real
scenarios (Ripley, 2004).
Besides the fact that Robust Regressions are becoming more popular since they are included
in Statistical packages (Stromberg, 2004), Robust Regressions are useful to overcome the
problem of manually deleting outliers. This has several benefits, first of all, not all the data
has to be screened on possible outliers, no method has to be used to decide whether to keep or
reject an observation and the multivariate setting makes it even harder to detect outliers
The Value of Co-Creation
J.L. van de Mortel 34
(Rousseeuw and Leroy, 1987). Instead, it is better to down-weight doubtful observations,
albeit it will result in a lower R2.
In Appendix B, Table 9 an overview is given of the Robust Regression’s test statistics with
respect to the nine dependent variables. Overall the coefficients are commensurable with the
previous OLS model. ROA and ROIC increase by 351 and 415 basis points for firms with a
co-creation score of 5 (476 and 436 under the OLS regression). The GPM and increases by
11.35 and 16.47% for ccscore is 4 and 5 (11.10% and 16.10% under the OLS regression) and
the COGS decreases by 11.48% and 17.80% for respectively ccscore is 4 and 5 (10.87 and
16.98% under the OLS regression). Tobin’s Q increases by 0.43 for firms with a co-creation
score of 5 under the Robust Regression, slightly less then the 0.52 increase under the OLS
regression.
Most remarkable is the change in the coefficients for Return on Equity. The Robust
Regression has down-weighted outliers, like Amazon.com, to better predict the impact of co-
creation on Return on Equity. However, whereas the OLS model predicted an increase in the
Return of Equity of respectively 64.18% and 34.65% for firms with a co-creation score of 4
and 5, the Robust Regression predicts only an increase of correspondingly 3.16% and 4.0%.
The latter is more plausible and still in line with the expectation that co-creation does
contribute to an increase in Return on Equity.
*** Insert Appendix B, Table 9 here ***
The negative coefficient for ROA, ROIC, NI%, CFtS, and OPM indicate, just as in the second
OLS regression, that the impact of co-creation is negative for firms with a ccscore of 1 or 2
and that substantial benefits are only created when there is a total commitment towards the
inclusion of co-creation principles. Further, the combined coefficients ccscore and ccscore2
are in line with the three hypotheses stated in section 3.1, but are not significant for Return on
Equity and Net income Growth (The Wald test statistic is 0.2402 and 0.2650, respectively),
whereas under the OLS regression only the result for Return on Invested Capital was
insignificant.
The Value of Co-Creation
J.L. van de Mortel 35
5. Discussion & Conclusion
Research has already proven the positive relation between market-based assets and financial
profitability (e.g. Rego et al., 2009; Rust et al., 2004; Srinivasan and Hanssens, 2009).
Moreover, benefits of co-creation are identified from a qualitative perspective (Prahalad,
2004b; Roser et al. 2009). However, the findings in this study provide the first support to date
for the central thesis that co-creation affects financial ratios and a firm’s financial position.
Based on a Robust Regression the results show that co-creation is significantly linked to
Return on Assets, Return on Invested Capital, Cash Flow to Sales, Cost of Goods Sold to
Sales, Operating and Gross Profit Margin and Tobin’s Q. Overall, the results give new
insights into the understanding of the role of co-creation in enhancing firm performance.
5.1 Theoretical Contributions
From a financial theory perspective, the results illustrate that the intangible process, co-
creation contributes to firm performance. Consequently, the thesis at hand provides an extra
argument that current accounting systems give an inadequate portrayal of intangible assets.
From a managerial perspective the results provide new insights that the inclusion of co-
creation results in improvements in business processes and respectively in business
performance. From an economic standpoint the results strongly indicate that co-creation
matters in contributing to the financial position of the firm. Regardless of whether an era of a
new, kinder and gentler way of doing business is dawning (Rifkin, 2010), firms’ financial
ratios and position do definitely not lose value due to the inclusion of co-creation principles.
Additionally, section 2.1 elaborates on the dynamics in current businesses. While this is not
relevant from a financial perspective, research so far has not described the relation between
the two trends considered, the shift in resources and the increase in customer-orientation, and
co-creation. Together with the rise in technological advancements those elements are the
crucial elements that gave rise to co-creation and argue in favor of a dynamic strategic
mindset.
5.2 Managerial Implications
The results in section 4.2 illustrate the positive contributions of co-creation with respect to
business parameters. Besides the eventual implementation of co-creation, this thesis tries to
illustrate that the dynamics in current business practices should be accompanied with a
strategic mindset and execution with the help of the right business model. Therefore,
The Value of Co-Creation
J.L. van de Mortel 36
management is required these days to be able to answer the six key questions: How do I
create and maintain a competitive advantage? Where can co-creation be of value in my firm?
What kind of co-creation processes can I use? What are the drivers of value for my co-
creation processes? Which KPI’s should I use to manage co-creation? What are eventual
problems in co-creation processes?
Additionally, there are several important implications for managers. Firstly, it is important for
managers, when co-creation practices are implemented, to quantify the benefits of co-creation
in order to motivate stakeholders. Subsequently, a manager should build “a co-creation
culture” within the firm and, if appropriate, create a reconstructionalist strategy that enhances
the firm’s competitive advantage. Moreover, the manager should make sure that firm-wide
co-creation principles are supported by the right organizational structure and support, with the
help of customer knowledge and customer relationship management and financial metrics.
Moreover, managers should select the right set of consumers to maximize the quality of the
joint value creation processes, be aware that an increase in co-creation intensity requires
certain prerequisites and that the right co-creation model is implemented in the right manner.
5.3 Limitations
Although the fact that this thesis is executed with the highest precautions there might be
several limitations that should be noted, when interpreting the results. The most crucial
element in this thesis is the scoring model used for the operationalization of the co-creation
concept. Firstly, the scores given to the firms under investigation could be biased due to the
author. Cognitive biases that could have influenced the grading of the quotes are confirmation
bias, memory bias, subjective validation or result from a framing effect.
Additionally, the operationalization of the concept of co-creation uses the corporate website
as the unit of analysis. However, it could be that examples of co-creation are left out due to
the fact that a company is not willing to elaborate on their business practices or the website
only includes information about the holding company and subsequently co-creation practices
at a daughter company are not taken into consideration. An alternative would have been to use
LexisNexis as the unit of analysis, but that also has its disadvantages (Chaney et al., 1991;
Sorescu et al. 2007).
A second limitation is the fact that the results are based on a score for co-creation. However,
it is unclear whether the improvements in financial ratio’s and position are caused due to costs
reductions, increased customer satisfaction or new product developments. However,
The Value of Co-Creation
J.L. van de Mortel 37
complemented with the literature study and other studies one can assume that the benefits of
co-creation are multi-faceted and each firm will benefits in a different way from the inclusion
of co-creation practices.
Moreover, the results can be biased due to reverse causality, i.e. the positive impact of co-
creation is not due to the co-creation practices, but could be caused due to the fact that firms
that implement co-creation are more innovative in general or are already successful and
subsequently have money left over for experiments with co-creation or other concepts,
thereby biasing the results for co-creation.
A final issue in this study is survivorship bias. The study at hand only positively scores co-
creation firms that indicate on their website that they use co-creation principles. However,
firms that have used co-creation techniques, but that abolished it because it was not successful
or beneficial, and consequently did not mention it on their corporate website, are not taken
into consideration.
5.4 Further research
Beyond the need for research to overcome above mentioned limitations, the findings of this
research highlight emerging practices and points to several research issues that appear worthy
of further studies. Firstly, it is still worthy to investigate the impact of co-creation on other
less tangible variables, e.g. customer retention, customer satisfaction, product generation, as
has been the case for other market-based assets. A study on the relation between co-creation
and those market-based assets will further enhance the understanding of co-creation and
probably makes clear what the specific drivers are of the improvements in financial growth.
Secondly, linking stock performance and co-creation would contribute to the understanding of
co-creation the financial performance of a firm. Similar to the advancement in the
understanding of market based assets that would be a logical next step. Thereby, it is
important to correctly interpret the reasons why co-creation is eventually contributing to, for
instance, stock performance.
However, co-creation is still in its infancy and therefore it is important to continuously
monitor the trends in co-creation practices and in a broader perspective the shift occurring in
current and future business models. An excellent evaluation of co-creation, also considers the
respective consequences for firms’ financial ratios and financial position.
The Value of Co-Creation
J.L. van de Mortel 38
6. References
Abeysekera, I. & Guthrie, J. (2004). Human capital reporting in a developing nation, The
British Accounting Review, 36, 251-268.
Agresti, A. (1990). Categorical data analysis, New York: John Wiley and Sons.
Alam, I. (2005). Removing the fuzziness from the fuzzy front-end of service innovations
through customer interactions, Industrial Marketing Management, 35, 468-480.
Allen, S., Bailetti, T. & Tanev, S. (2009). Components of co-creation, Open Source Business
Resource, (Nov.), 12-18.
Almirall, E. & Casadesus-Masanell, R. (2010). Open versus closed innovation, a model of
discovery and divergence, Academy of Management Review, 35 (1), 27-47.
Amit, R. & Wernerfelt, B. (1990). Why do firms reduce business risk?, Academy of
Management Journal, 33 (3), 520-33.
Anderson, C. (2006). The long tail: why the future of business is selling less of more, New
York: Hyperion.
Barney, J. (1991). Firm resources and sustained competitive advantage, Journal of
Management, 17, 99-120.
Barth, M.E., Clement, M., Foster, G. & Kasznik, R. (1998). Brand values and capital market
valuation, Review of Accounting Studies, 3 (1-2), 41-68.
Bendapudi, N. & Leone, R. (2003). Psychological implications of customer participation in
co-production. Journal of Marketing, 67 (1), 14-28.
Bennett, R. & Gabriel, H.I. (1999). Organisational factors and knowledge management within
large marketing departments: an empirical study, Journal of Knowledge Management,
3 (3), 212-25.
Black, A., Wright, P. & Davis, J. (2001). Search of shareholder value: managing the drivers
of performance (2nd ed.), London: Prentice Hall.
Bommer, M. & Jalajas, D.S. (2004). Innovation sources of large and small technology-based
firms, IEEE Transactions of Engineering Management, 51 (1), 13-18.
Burgman, R. & Roos, G. (2007). The importance of intellectual capital reporting: evidence
and implications, Journal of Intellectual Capital, 8 (1), 7-51.
The Value of Co-Creation
J.L. van de Mortel 39
Campbell, A.J. (2003). Creating customer knowledge competence: managing customer
relationship management programs strategically, Industrial Marketing Management,
32 (5), 375-83.
Chaney, P.K., Devinney, T.M. & Winer R.S. (1991). The impact of new product introductions
on the market value of firms, Journal of Business, 64 (4), 573-610.
Chase, R.L. (1997). The knowledge-based organization: an international survey, Journal of
Knowledge Management, 1 (1), 38-49.
Chesbrough, H. (2003). The era of open innovation, MIT Sloan Management Review, 44 (3),
35-41.
Conner, K.R. (1991). A historical comparison of resource-based theory and five schools of
thought within industrial organization economics: Do we have a new theory of the
firm?, Journal of Management, 17 (1), 121-154.
Conner, K.R. & Prahalad, C.K. (1996). A resource-based theory of the firm: knowledge
versus opportunism, Organizational Science, 7 (5), 477-501.
Constantin, J.A. & Lusch, R.F. (1994). Understanding Resource Management, Oxford: The
Planning Forum.
Corbett, T. (1998). Throughput accounting. Great Barrington, USA: North River Press
Dabholkar, P. (1990). How to improve perceived service quality by improving customer
participation, in Developments in Marketing Science, B.J. Duniap, ed., Cullowhee,
USA: Academy of Marketing Science, 483-487.
Day, G.S. (1999). Creating a market-driven organization, Sloan Management Review, 41 (1),
11-22.
Day, G.S. (2003). Creating a superior customer-relating capability, Sloan Management
Review, 44 (3), 77-82.
Deci E. & Ryan, R. (2002). Handbook of self-determination research, Rochester, USA: The
University of Rochester Press.
Drucker, P.F. (1993). Post-capitalist society, Oxford: Butterworth-Heinemann.
Edvinsson, L. (1997). Developing intellectual capital at Skandia, Long Range Planning, 30
(3), 366-373.
The Value of Co-Creation
J.L. van de Mortel 40
Engle, R.F. (1983). Wald, Likelihood Ratio, and Lagrange Multiplier Tests in econometrics,
in M.D. Intriligator & Z. Griliches, Handbook of Econometrics, Cambridge, USA:
Elsevier, 796-801.
Evans, P. & Wolf, B. (2005). Collaboration rules, Harvard Business Review, 83 (7), 96-104.
Fama, E.F. (1970). Efficient capital markets: a review of theory and empirical work, Journal
of Finance, 25 (2), 383-417.
Ferrier, W. (2001). Navigating the competitive landscape: the drivers and consequences of
competitive aggressiveness, Academy of Management Journal, 44, 858-877.
Flint, D.J. (2006). Innovation, symbolic interaction customer valuing: thoughts stemming
from a service-dominant logic of marketing, Marketing Theory, 6, 349-362.
Franke, N. & Shah, S. (2003). How communities support innovative activities: an exploration
of assistance and sharing among innovative users of sporting equipment, Research
Policy, 32 (1), 157-178
Frigo, M.L., & Ramaswamy, V. (2009). Co-creating strategic risk-return management,
Strategic Finance, May, 25-33.
Füller, J. (2010). Refining virtual co-creation from a consumer perspective, California
Management Review, 52 (2), 98-122.
García-Ayuso, M. (2003). Factors explaining the inefficient valuation of intangibles,
Accounting, Auditing and Accountability Journal, 16 (1), 57-69.
Ghazawneh, A. (2008). Managing mass collaboration: toward a process framework,
Retrieved April 20, 2010; from the World Wide Web:
http://biblioteket.ehl.lu.se/olle/papers/0003116.pdf
Gibbert, M., Leibold, M. & Probst, G. (2002). Five styles of customer knowledge
management, and how smart companies use them to create value, European
Management Journal, 20 (5), 459-69.
Gruner, K.E. & Homburg, C. (2000). Does customer interaction enhance new product
success?, Journal of Business Research, 49 (1), 1-14.
Gupta, S. & Zeithaml, V. (2006). Customer metrics and their impact on Financial
Performance, Marketing Science, 25, 687-717.
The Value of Co-Creation
J.L. van de Mortel 41
Gupta, S., Lehmann, D.R., & Stuart, J.A. (2004). Valuing customers, Journal of Marketing
Research, 41 (2), 7-18.
Hamel, G. & Prahalad, C.K. (1989). Strategic intent, Harvard Business Review, 67 (3), 63-76.
Hamel, G. (2006). Why, what, and how of management innovation, Harvard Business
Review, 84 (2), 72-84.
Hax, A.C. & Wilde II, D.L. (1999). The Delta Model: adaptive management for a changing
world, Sloan Management Review, 40 (2), 11-28.
Hennig-Thurau, T., Gwinner, K.P., Walsh, G. & Gremler, D.D. (2004). Electronic word-of-
mouth via consumer-opinion platforms: what motivates consumers to articulate
Themselves on the Internet?, Journal of Interactive Marketing, 18 (1), 38-52.
Hoffman, D. & Novak T. (1996). Marketing in hypermedia computer-mediated environments:
conceptual foundations, Journal of Marketing, 60 (3), 50-68.
Hoffman, D. & Novak T. (2009). Flow online: lessons learned and future prospects, Journal
of Interactive Marketing, 23 (1), 23-34.
Hogan, J.E., Lehmann, D., Merino, M., Srivastava, R.K., Thomas, J. & Verhoef, P.C. (2002).
Linking customer assets to financial performance, Journal of Service Research, 5 (1),
26-38.
IASB (2008). IAS 38 Intangible Assets, Retrieved April 25, 2010; from the World Wide Web:
www.iasb.org
Ittner, C. & Larcker, D. (1998). Are non-financial measures leading indicators of financial
performance? An analysis of customer satisfaction, Journal of Accounting Research,
36 (3), 1-35.
Ives, B. & Olson, M.H. (1984). User involvement and MIS success: a review of research,
Management Science, 30 (5), 586-603.
Jegadeesh, N. & Titman, S. (1993). Returns to buying winners and selling losers: implications
for stock market efficiency, Journal of Finance, 48 (1), 65-91.
Johnson, C.R. & Schultz, D.E. (2004). A focus on customers, Marketing Management, 13 (5),
20-26.
Johnson, M.W., Christensen, C.M. & Kagermann, H. (2008). Reinventing your business
model, Harvard Business Review, 86 (12), 50-59.
The Value of Co-Creation
J.L. van de Mortel 42
Kambil, A., Friesen, G.B. & Sundaram, A. (1999). Co-creation: a new source of value,
Outlook 1999 (2), 38-43.
Kamp, K. Op den, (2009). Viable business models for corporate co-creation communities,
Open Source Business Resource, (Nov.), 5-11.
Kaplan, R.S. and Norton, D.P. (1996). Using the Balanced Scorecard as a strategic
management system, Harvard Business Review, 74 (1), 75-85.
Kim, C.W. & Mauborgne, R. (2005). Blue ocean strategy, Harvard: HBS Press.
Kim, C.W. & Mauborgne, R. (2009). How strategy shapes structure, Harvard Business
Review, 87 (9), 72-80.
Kirah, A. (2009). Co-creation: a new way of doing business in an age of uncertainty, Open
Source Business Resource, (Nov.), 29-33.
Kotha, S. (1995). Mass customisation: implementing the emerging paradigm for competitive
advantage, Strategic Management Journal, 16 (1), 21-42.
Kruglanski, A.W., Stein, C. & Riter, A. (1977). Contingencies of exogenous rewards and task
performance: on the “minimax” principle in instrumental behavior, Journal of Applied
Social Psychology, 7 (2), 141-148.
Kruskal & Wallis (1952). Use of ranks in one-criterion variance analysis. Journal of the
American Statistical Association, 47 (260), 583-621.
Lang, L.H.P. & Stulz, R.M. (1994). Tobin’s q, corporate diversification, and firm
performance, Journal of Political Economy, 102, 1248-1280.
Lengnick-Hall, C. (1996). Customer contributions to quality: A different view of the
customer-oriented firm, Academy of Management Review, 21 (3), 791-824.
Lev, B. (2001). Intangibles: management, measurement, and reporting, Washington, USA:
The Brookings Institution.
Lev, B. (2004). Sharpening the intangibles edge, Harvard Business Review, 82 (7), 109-116.
Lev, B. & Zambon, S. (2003). Intangibles and intellectual capital: an introduction to a special
issue, European Accounting Review, 12, 597-603.
Lev, B. and Zarowin, P. (1999). The boundaries of financial reporting and how to extend
them, Journal of Accounting Research, 37, 353-385.
The Value of Co-Creation
J.L. van de Mortel 43
Liu T.C. & Wu, C.C. (2009). Self-service consumer looks for human touch, Retrieved January
31, 2010; from the World Wide Web: 140.116.225.91/ISAD/files/R48951012-a.pdf
Lukas, B.A., Whitwell, G.J., & Doyle, P. (2005). How can a shareholder value approach
improve marketing’s strategic influence?, Journal of Business Research, 58, 414-422.
Maklan, S., Knox, S. & Ryals, L. (2008). New trends in innovation and customer relationship
management, International Journal of Market Research, 50, 221-240.
Manning, K., Bearden, W. & Madden, T. (1995). Consumer innovativeness and the adoption
process, Journal of Consumer Psychology, 4, 329-345.
Marshall, A. (1927). Principles of economics, (1890), Reprint London: Macmillan.
McCarthy, E.J. (1960). Basic marketing, a managerial approach, Homewood, USA: R.D.
Irwin.
McGahan, A.M. (1999). The performance of U.S. corporations: 1981-1994, Journal of
Industrial Economics, 47, 373-398.
McKenna, R. (1995). Real-time marketing, Harvard Business Review, 73 (4), 87-95.
Merton, R.C. (1987). A simple model of capital market equilibrium with incomplete
information, Journal of Finance, 42 (3), 483-510.
Meuter, M.L. & Bitner M.J. (1998). Self-service technologies: extending service frameworks
and identifying issues for research, in AMA Winter Educators' Conference, D. Grewal
& C. Pechmann., Chicago: American Marketing Association, 12-19.
Midgley, D. (2009). The innovation manual: integrated strategies and practical tools for
bringing value innovation to the market. West Sussex: John Wiley & Sons Ltd.
Mizik, N. & Jacobson, R. (2007). Myopic marketing management: the phenomenon and its
long-term impact on firm value, Marketing Science, 26 (3), 361-79.
Mumford, E. (1979). Consensus systems design: an evaluation of this approach, design and
implementation of computer based information systems, Groningen: Sijthoff and
Noordhoff.
OECD (2008). Intellectual assets and value creation: synthesis report. Retrieved on April 12
2010; from the World Wide Web: http://www.oecd.org/.
The Value of Co-Creation
J.L. van de Mortel 44
Payne, A. & Frow, P. (2005). A strategic framework for customer relationship management,
Journal of Marketing, 69 (4), 167-176.
Payne, A., Storbacka, K. & Frow, P. (2008). Managing the co-creation of value, Journal of
the Academy of Marketing Science, 36 (1), 83-96.
Pedhazur E.J. & Pedhazur-Schmelkin, L. (1991). Measurement, design, and analysis: an
integrated approach, Hillsdale, USA: Lawrence Erlbaum Associates.
Pedrosa, A. (2009). Motivating stakeholders for co-created innovation, Open Source Business
Resource, (Dec.), 35-39.
Pine, B.J.H. (1997). The four faces of mass customization, Harvard Business Review, 75 (1),
91-101.
Porter, M.E. (1979). How competitive forces shape strategy, Harvard Business Review, 57
(2), 137-145.
Porter, M.E. (1980). Competitive strategy, New York: Free Press.
Porter, M.E. (1985). Competitive advantage, New York: Free Press.
Posner, R.A. (2010). The crisis of capitalist democracy, Cambridge, USA: Harvard
University Press.
Prahalad, C.K. & Ramaswamy, V. (2000). Co-opting customer competence, Harvard
Business Review, 78 (1), 79-87.
Prahalad, C.K. & Ramaswamy, V. (2004a). Co-creation experiences: The next practice in
value creation, Journal of Interactive Marketing, 18 (3), 5-14.
Prahalad, C.K. & Ramaswamy, V. (2004b). The future of competition: co-creating unique
value with customers, (1st ed.), Boston: Harvard Business School Publishing.
Prusak, L. (1997). Knowledge in organisations, Oxford: Butterworth-Heinemann.
Ramaswamy, V. (2008). Co-creating strategy with experience Co-Creation, Balanced
Scorecard Report, 10 (4), 9.
Ramaswamy, V. (2008). Co-creating value through customers’ experiences: the Nike case,
Strategy & Leadership, 36 (5), 9-14.
Ramaswamy, V. (2009a). Are you ready for the co-creation movement, IESE Insight, 2, 29-
35.
The Value of Co-Creation
J.L. van de Mortel 45
Ramaswamy, V. (2009b). Leading the transformation to co-creation of value, Strategy &
Leadership, 37 (2), 32-37.
Ramsey, J.B. (1969). Tests for specification errors in classical linear least squares regression
analysis, Journal of the Royal Statistical Society B, 31, 350-371.
Reeves, B., Malone, T.W. & O’Driscoll, T. (2008). Leadership’s online labs, Harvard
Business Review, 86 (5), 59-66.
Rego, L.L., Billett, M. & Morgan, N.A. (2009). Consumer-based brand equity and firm risk,
Journal of Marketing, 73 (6), 47-60.
Rifkin, J. (2010). The empathic civilization: the race to global consciousness in a world in
crisis, New York, USA: Jeremy P. Tarcher.
Ripley, B.D. (2004). Robust statistics, Retrieved August 5, 2010; form the World Wide Web:
http://www.stats.ox.ac.uk/pub/StatMeth/Robust.pdf.
Robey, D. & Farrow, D. (1979). Information system development: some dynamics of user
involvement, National AIDS Conference Proceedings, (Nov.), 149-151.
Roser, T., Samson, A., Humpreys, P. & Cruz-Valdivieso, E. (2009). Co-creation: new
pathways to value. An overview. London: LSE Enterprise. Retrieved January 5, 2010;
form the World Wide Web: http://www.promisecorp.com/newpathways/
Rousseeuw, P. J. & Leroy, A.M. (1987). Robust regression and outlier detection. New York,
USA: Wiley.
Rowley, J., Kupiec-Teahan, B. & Leeming, E. (2007). Customer community and co-creation:
a case study, Marketing Intelligence & Planning, 25 (2), 136-146.
Rust, R.T., Ambler, T., Carpenter, G.S., Kumar, V. & Srivastava, R.K. (2004). Measuring
marketing productivity: current knowledge and future directions, Journal of
Marketing, 68 (4), 76-89.
Sanders, L. & Simons, G. (2009). A social vision for value co-creation in design, Open
Source Business Resource, (Dec.), 27-34.
Senge, P.M. (2010). Systems citizenship: the leadership mandate for this millennium,
Retrieved May 5, 2010; from the World Wide Web: refelections.solonline.org.
Schneider, B. & Bowen, D.E. (1995). Winning the service game. Boston, USA: Harvard
Business School Press.
The Value of Co-Creation
J.L. van de Mortel 46
Shah, D., Rust, R.T., Parasuraman, A., Staelin, R. & Day, G.S. (2006). The path to customer
centricity, Journal of Service Research, 9 (2), 113-124.
Smith, A. (1904). An inquiry into the nature and causes of the wealth of nations, (1776),
Reprint, London: Dent & Sons.
Sorescu, A., Shankar, V. & Kushwaha, T. (2007). New product preannouncements and
shareholder value: don’t make promises you can’t keep, Journal of Marketing
Research, 44 (8), 468-489.
Srinivasan, S. & Hanssens, D.M. (2009). Marketing and firm value: metrics, methods,
findings, and future directions, Journal of Marketing Research, 46, 293-312.
Srivastava, R.K., Fahey, L. & Christensen, H.K. (2001). The resource-based view and
marketing: The role of market-based assets in gaining competitive advantage, Journal
of Management, 27, 777-802.
Srivastava, R.K., Shervani, T.A. & Fahey, L. (1997). Driving shareholder value: the role of
marketing in reducing vulnerability and volatility of cash flows, Journal of Market
Focused Management, 2 (1), 49-64.
Srivastava, R.K., Shervani, T.A. & Fahey, L. (1998). Market-based assets and shareholder
value: a framework for analysis, Journal of Marketing, 62 (1), 2-18.
Stromberg, A.J. (2004). Why write statistical software? The case of robust statistical methods,
Journal of Statistical Software. Retrieved August 5, 2010; from the World Wide Web:
http://www.jstatsoft.org/v10/i05/paper
Tabachnick, B. G. & Fidell, L. S. (2001). Using multivariate statistics (4th ed.). Needham
Heights, USA: Allyn & Bacon.
Thomke, S. & von Hippel, E. (2002). Customers as innovators: a new way to create value,
Harvard Business Review, 80 (4), 74-81.
Tobin, J. (1969). A general equilibrium approach to monetary theory, Journal of Money,
Credit and Banking, 1 (2), 15-29.
Vargo, S.L. & Lusch, R.F. (2004). Evolving to a new dominant logic for marketing, Journal
of Marketing, 68 (1), 1-17.
Villalonga, B. (2004). Intangible resources, Tobin’s q, and sustainability of performance
differences, Journal of Economic Behavior & Organization, 54 (2), 205-230.
The Value of Co-Creation
J.L. van de Mortel 47
Wald, A. (1940). Testing for straight lines if both variables are subject to error, Annals of
mathematical statistics, 11, 284-300.
Webster, F.E. (1992). The changing role of marketing in the corporation, Journal of
Marketing, 56 (10), 1-17.
Webster, F.E. (2002). Marketing management in changing times, Marketing Management, 11
(1), 18-24.
Wernerfelt, B. (1984). A resource-based view of the firm, Strategic Management Journal, 5,
171-180.
Whitwell, G.J., Lukas, B.A. & Hill, P. (2007). Stock analysts’ assessments of the shareholder
value of intangible assets, Journal of Business Research, 60 (1), 84-90.
Wooldridge, J.M. (2006). Introductory econometrics: a modern approach. Mason, USA:
South-Western/Cengage Learning.
Wunsch, S. & Vickery, G. (2007). Participative Web: User-Generated Content. Report by the
OECD, Directorate for Science, Technology and Industry, Retrieved May 5, 2010;
from the World Wide Web: http://www.oecd.org/dataoecd/57/14/38393115.pdf.
Zinkhan, G.M. & Verbrugge, J.A. (2000). The marketing/finance interface: two divergent and
complementary views of the firm, Journal of Business Research, 50(2), 143-148.
Zeithaml, V.A., Parasuraman, A. & Berry, L.L. (1990). Delivering quality service: Balancing
customer perceptions and expectations. New York, USA: Free Press.
Zimmermann, E.W. (1951). World resources and industries. New York, USA: Harper and
Row.
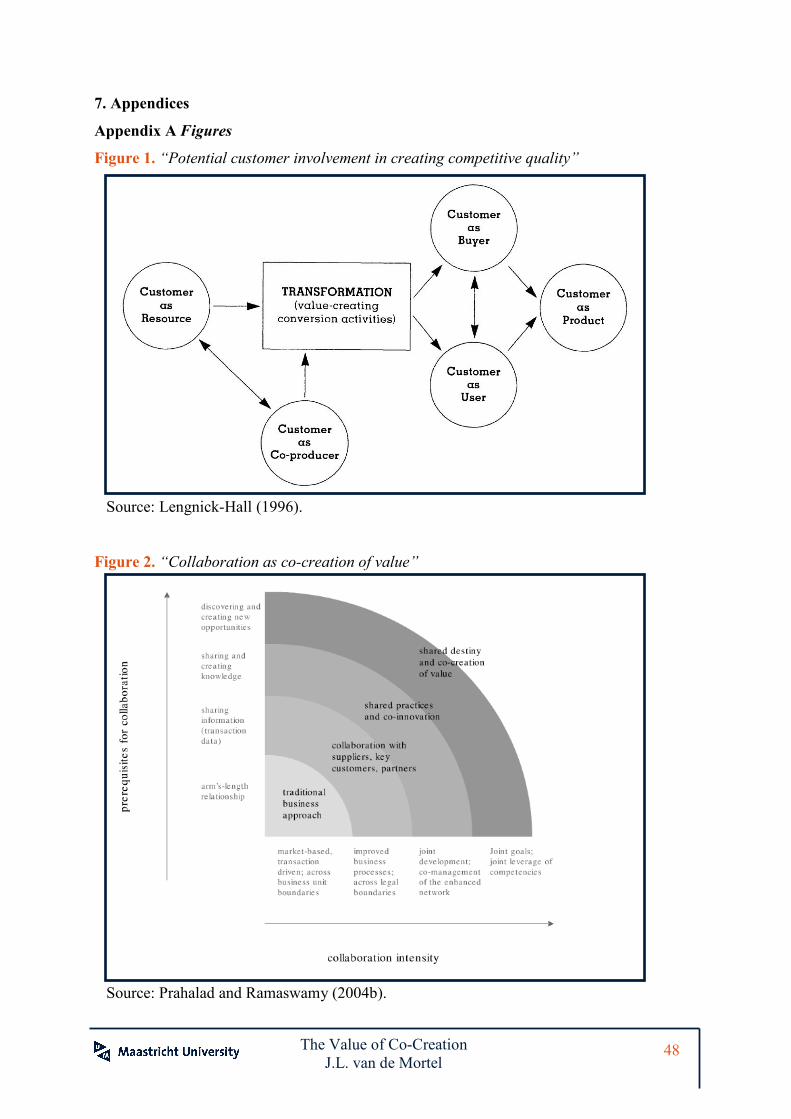
The Value of Co-Creation
J.L. van de Mortel 48
7. Appendices
Appendix A Figures
Figure 1. “Potential customer involvement in creating competitive quality”
Source: Lengnick-Hall (1996).
Figure 2. “Collaboration as co-creation of value”
Source: Prahalad and Ramaswamy (2004b).
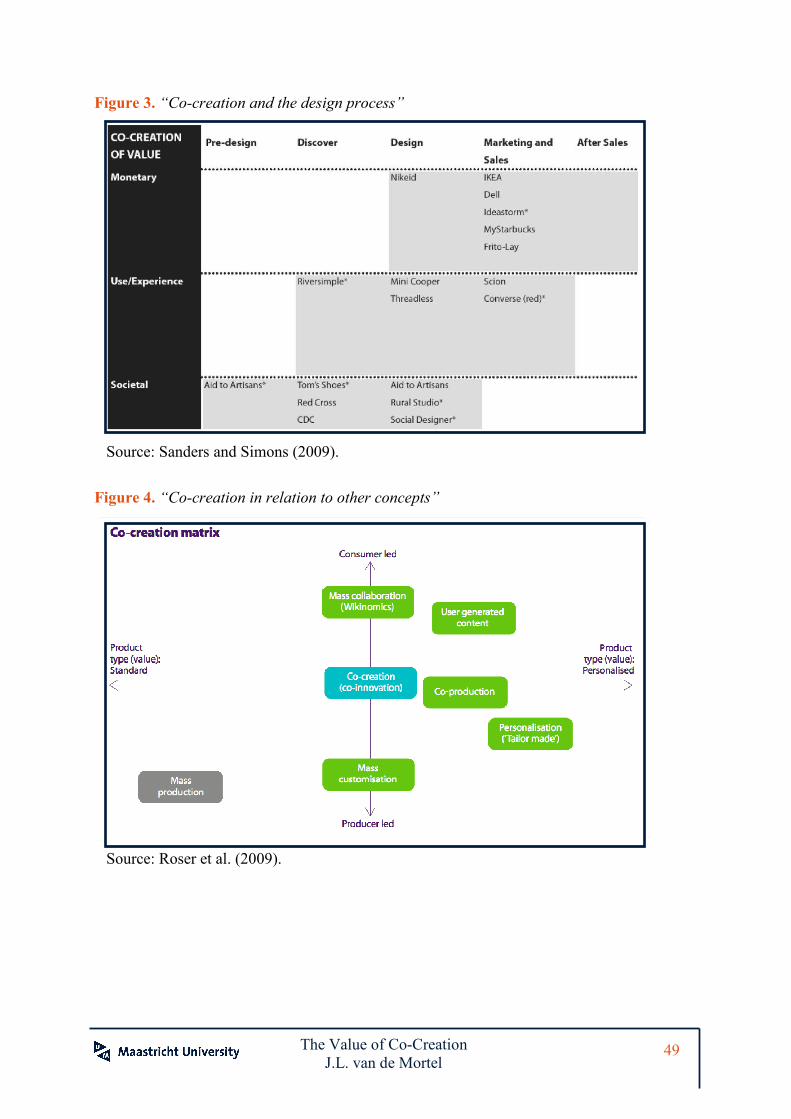
The Value of Co-Creation
J.L. van de Mortel 49
Figure 3. “Co-creation and the design process” Source: Sanders and Simons (2009).
Figure 4. “Co-creation in relation to other concepts”
Source: Roser et al. (2009).
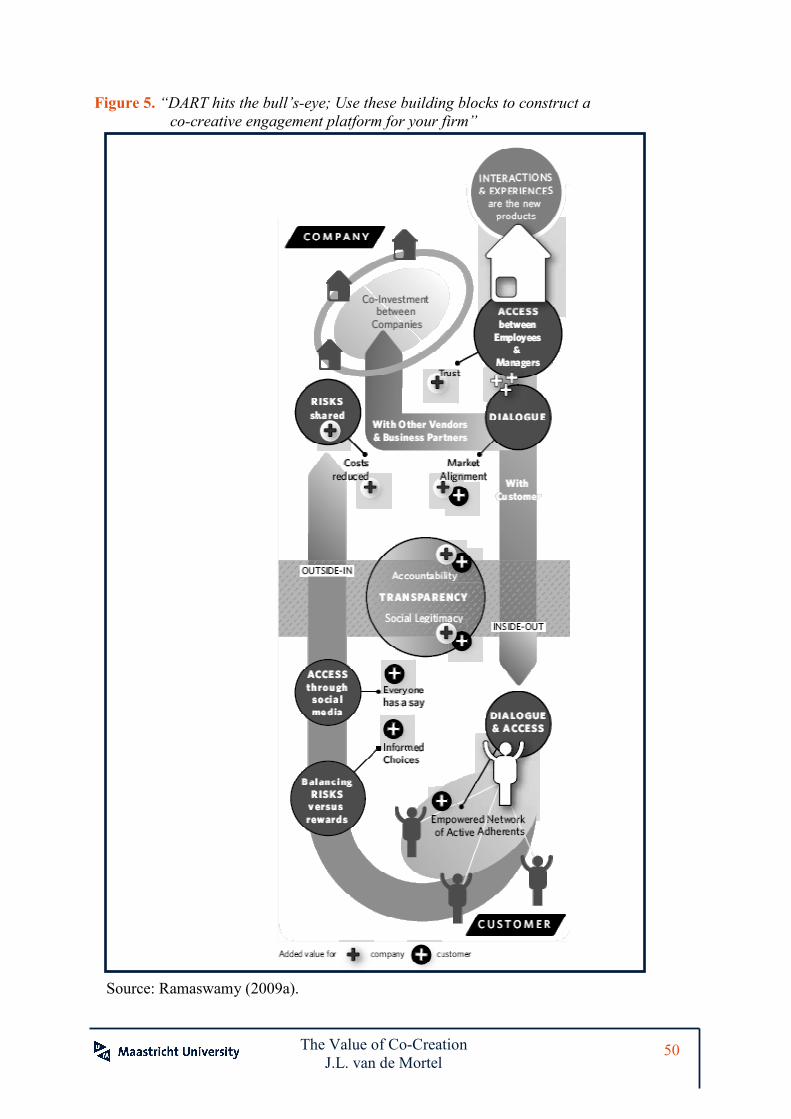
The Value of Co-Creation
J.L. van de Mortel 50
Figure 5. “DART hits the bull’s-eye; Use these building blocks to construct a co-creative engagement platform for your firm”
Source: Ramaswamy (2009a).
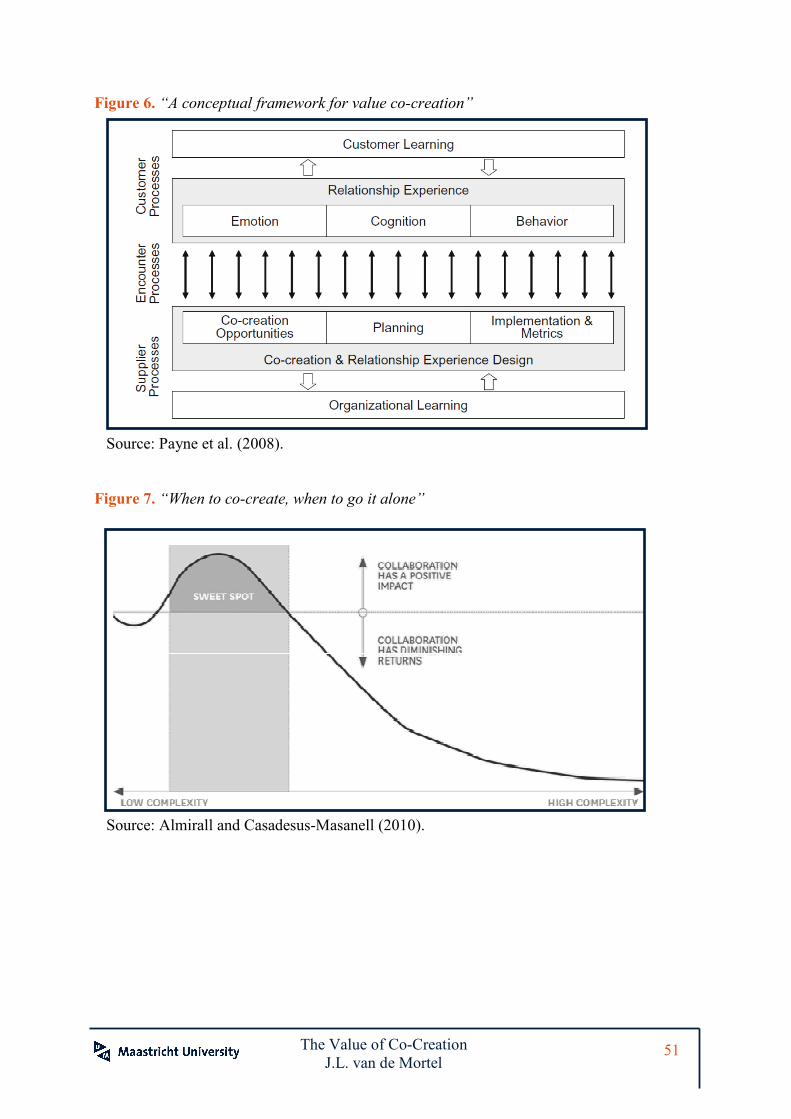
The Value of Co-Creation
J.L. van de Mortel 51
Figure 6. “A conceptual framework for value co-creation”
Source: Payne et al. (2008).
Figure 7. “When to co-create, when to go it alone”
Source: Almirall and Casadesus-Masanell (2010).
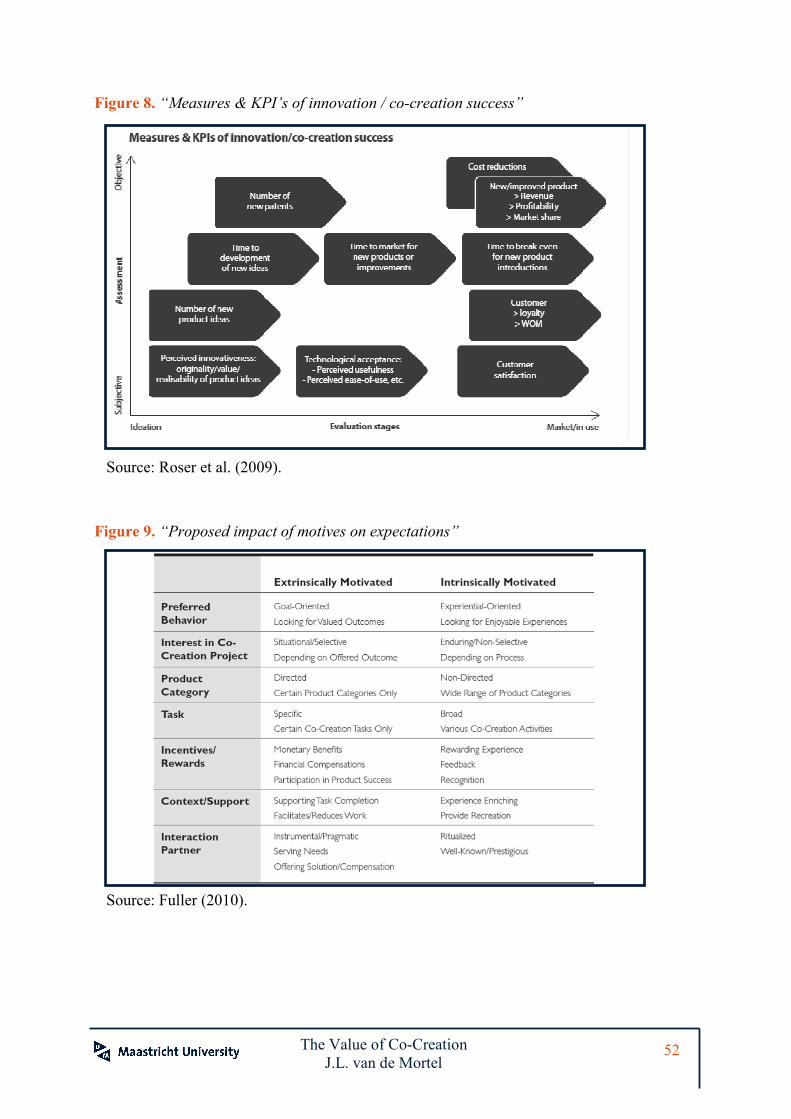
The Value of Co-Creation
J.L. van de Mortel 52
Figure 8. “Measures & KPI’s of innovation / co-creation success”
Source: Roser et al. (2009).
Figure 9. “Proposed impact of motives on expectations”
Source: Fuller (2010).
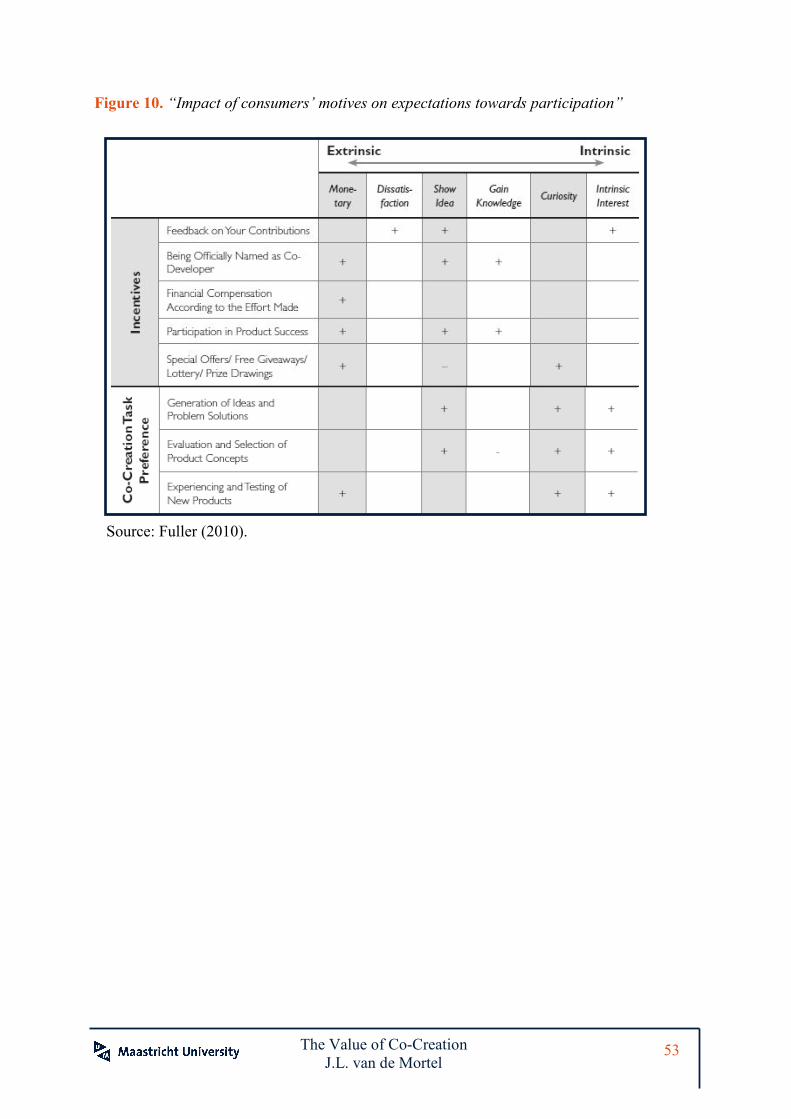
The Value of Co-Creation
J.L. van de Mortel 53
Figure 10. “Impact of consumers’ motives on expectations towards participation”
Source: Fuller (2010).
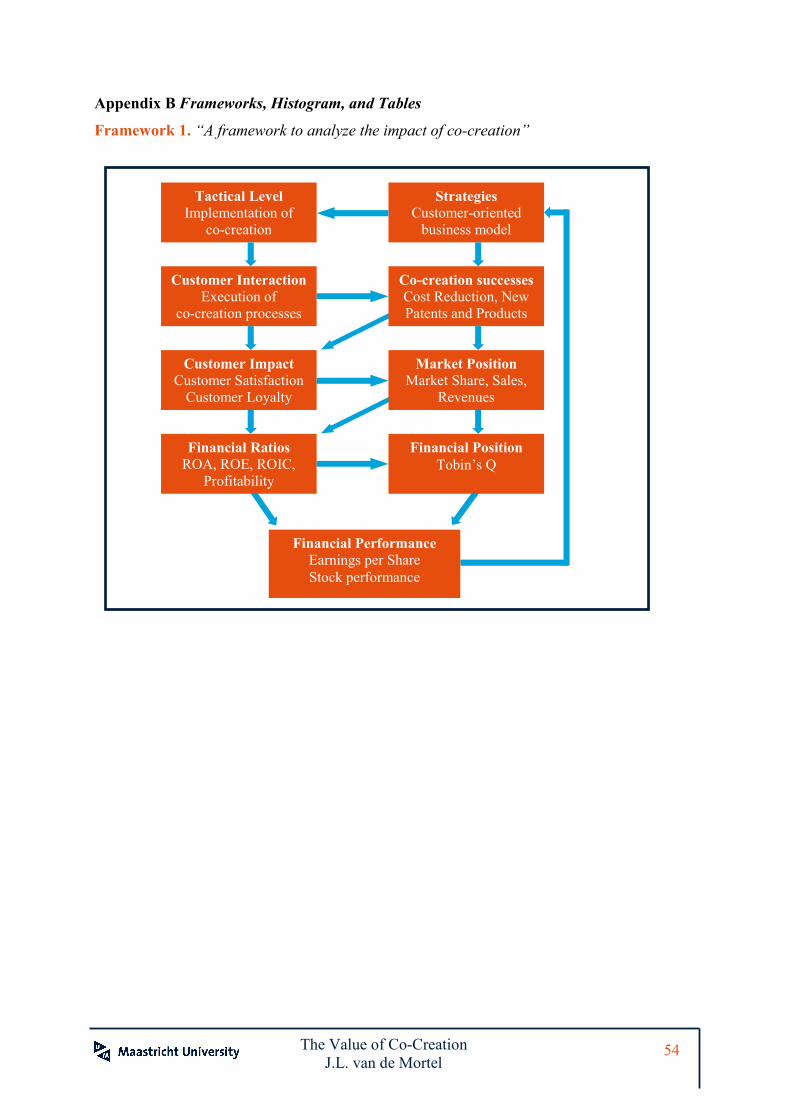
The Value of Co-Creation
J.L. van de Mortel 54
Appendix B Frameworks, Histogram, and Tables
Framework 1. “A framework to analyze the impact of co-creation”
Tactical Level Implementation of
co-creation
Strategies Customer-oriented
business model
Customer Interaction Execution of
co-creation processes
Co-creation successes Cost Reduction, New Patents and Products
Customer Impact Customer Satisfaction
Customer Loyalty
Market Position Market Share, Sales,
Revenues
Financial Ratios ROA, ROE, ROIC,
Profitability
Financial Position Tobin’s Q
Financial Performance Earnings per Share Stock performance
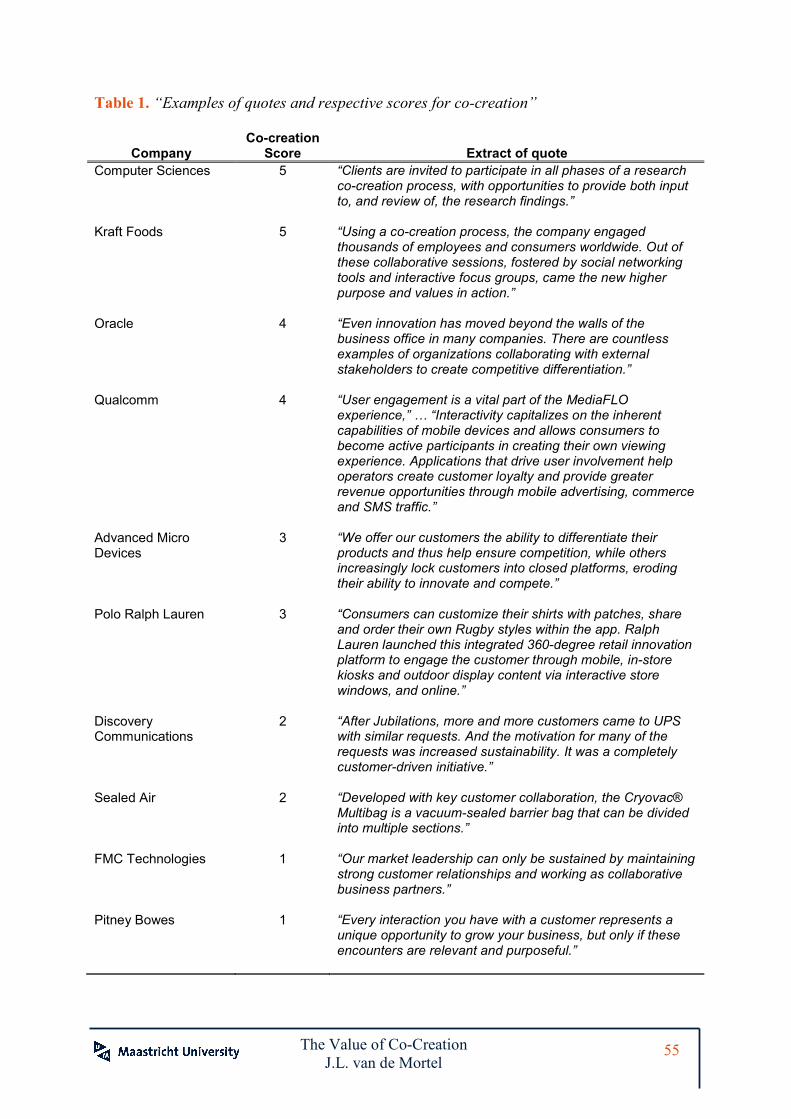
The Value of Co-Creation
J.L. van de Mortel 55
Table 1. “Examples of quotes and respective scores for co-creation”
Company Co-creation
Score Extract of quote Computer Sciences 5 “Clients are invited to participate in all phases of a research
co-creation process, with opportunities to provide both input to, and review of, the research findings.”
Kraft Foods 5 “Using a co-creation process, the company engaged thousands of employees and consumers worldwide. Out of these collaborative sessions, fostered by social networking tools and interactive focus groups, came the new higher purpose and values in action.”
Oracle 4 “Even innovation has moved beyond the walls of the business office in many companies. There are countless examples of organizations collaborating with external stakeholders to create competitive differentiation.”
Qualcomm 4 “User engagement is a vital part of the MediaFLO experience,” … “Interactivity capitalizes on the inherent capabilities of mobile devices and allows consumers to become active participants in creating their own viewing experience. Applications that drive user involvement help operators create customer loyalty and provide greater revenue opportunities through mobile advertising, commerce and SMS traffic.”
Advanced Micro Devices
3 “We offer our customers the ability to differentiate their products and thus help ensure competition, while others increasingly lock customers into closed platforms, eroding their ability to innovate and compete.”
Polo Ralph Lauren 3 “Consumers can customize their shirts with patches, share and order their own Rugby styles within the app. Ralph Lauren launched this integrated 360-degree retail innovation platform to engage the customer through mobile, in-store kiosks and outdoor display content via interactive store windows, and online.”
Discovery Communications
2 “After Jubilations, more and more customers came to UPS with similar requests. And the motivation for many of the requests was increased sustainability. It was a completely customer-driven initiative.”
Sealed Air 2 “Developed with key customer collaboration, the Cryovac® Multibag is a vacuum-sealed barrier bag that can be divided into multiple sections.”
FMC Technologies 1 “Our market leadership can only be sustained by maintaining strong customer relationships and working as collaborative business partners.”
Pitney Bowes 1 “Every interaction you have with a customer represents a unique opportunity to grow your business, but only if these encounters are relevant and purposeful.”
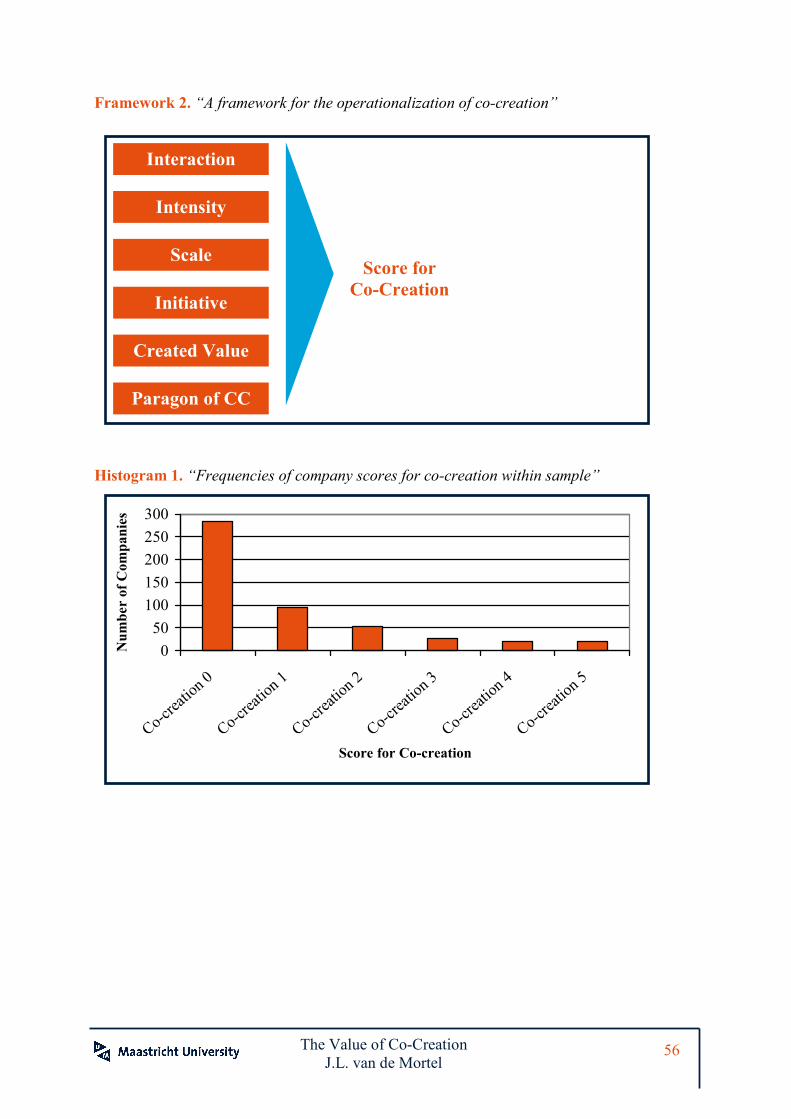
The Value of Co-Creation
J.L. van de Mortel 56
Framework 2. “A framework for the operationalization of co-creation”
Histogram 1. “Frequencies of company scores for co-creation within sample”
050
100150200250300
Co-crea
tion 0
Co-creat
ion 1
Co-creat
ion 2
Co-crea
tion 3
Co-creat
ion 4
Co-creat
ion 5
Score for Co-creation
Num
ber of Com
panies
Score for Co-Creation
Interaction
Intensity
Scale
Paragon of CC
Initiative
Created Value
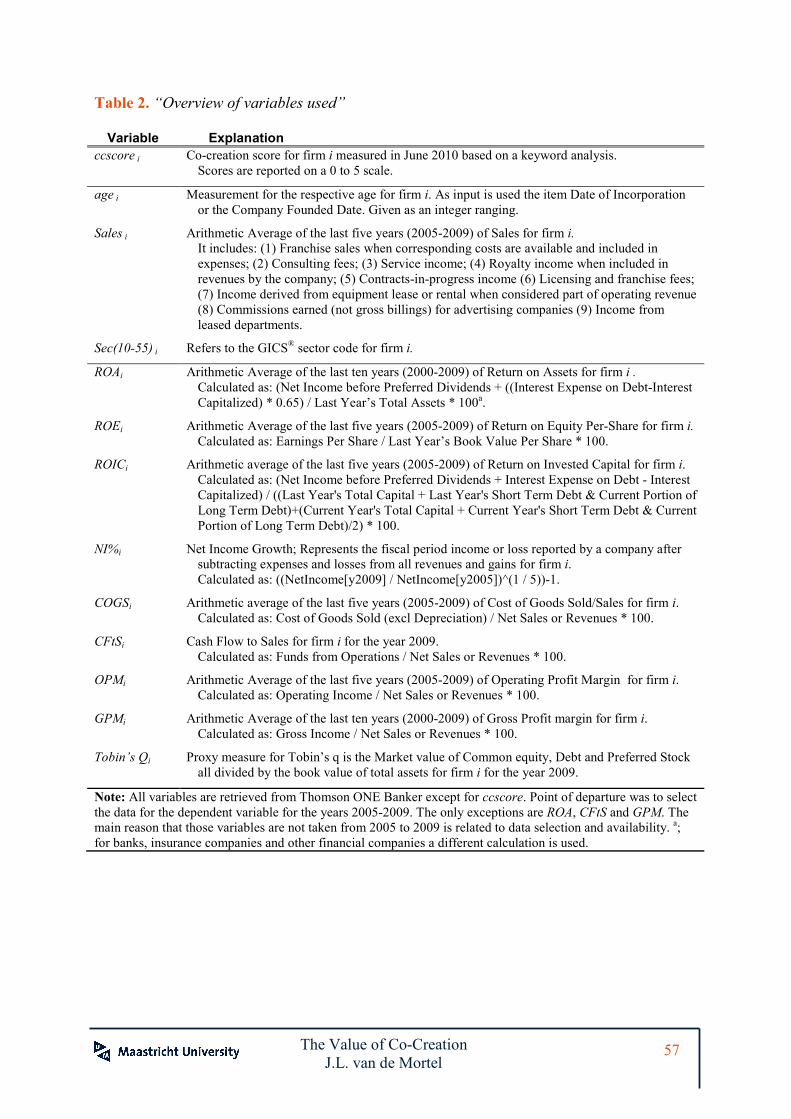
The Value of Co-Creation
J.L. van de Mortel 57
Table 2. “Overview of variables used”
Variable Explanation
ccscore i Co-creation score for firm i measured in June 2010 based on a keyword analysis. Scores are reported on a 0 to 5 scale.
age i Measurement for the respective age for firm i. As input is used the item Date of Incorporation or the Company Founded Date. Given as an integer ranging.
Sales i Arithmetic Average of the last five years (2005-2009) of Sales for firm i. It includes: (1) Franchise sales when corresponding costs are available and included in expenses; (2) Consulting fees; (3) Service income; (4) Royalty income when included in revenues by the company; (5) Contracts-in-progress income (6) Licensing and franchise fees; (7) Income derived from equipment lease or rental when considered part of operating revenue (8) Commissions earned (not gross billings) for advertising companies (9) Income from leased departments.
Sec(10-55) i Refers to the GICS® sector code for firm i.
ROAi
Arithmetic Average of the last ten years (2000-2009) of Return on Assets for firm i . Calculated as: (Net Income before Preferred Dividends + ((Interest Expense on Debt-Interest Capitalized) * 0.65) / Last Year’s Total Assets * 100a.
ROEi Arithmetic Average of the last five years (2005-2009) of Return on Equity Per-Share for firm i. Calculated as: Earnings Per Share / Last Year’s Book Value Per Share * 100.
ROICi Arithmetic average of the last five years (2005-2009) of Return on Invested Capital for firm i. Calculated as: (Net Income before Preferred Dividends + Interest Expense on Debt - Interest Capitalized) / ((Last Year's Total Capital + Last Year's Short Term Debt & Current Portion of Long Term Debt)+(Current Year's Total Capital + Current Year's Short Term Debt & Current Portion of Long Term Debt)/2) * 100.
NI%i Net Income Growth; Represents the fiscal period income or loss reported by a company after subtracting expenses and losses from all revenues and gains for firm i. Calculated as: ((NetIncome[y2009] / NetIncome[y2005])^(1 / 5))-1.
COGSi Arithmetic average of the last five years (2005-2009) of Cost of Goods Sold/Sales for firm i. Calculated as: Cost of Goods Sold (excl Depreciation) / Net Sales or Revenues * 100.
CFtSi Cash Flow to Sales for firm i for the year 2009. Calculated as: Funds from Operations / Net Sales or Revenues * 100.
OPMi Arithmetic Average of the last five years (2005-2009) of Operating Profit Margin for firm i. Calculated as: Operating Income / Net Sales or Revenues * 100.
GPMi Arithmetic Average of the last ten years (2000-2009) of Gross Profit margin for firm i. Calculated as: Gross Income / Net Sales or Revenues * 100.
Tobin’s Qi Proxy measure for Tobin’s q is the Market value of Common equity, Debt and Preferred Stock all divided by the book value of total assets for firm i for the year 2009.
Note: All variables are retrieved from Thomson ONE Banker except for ccscore. Point of departure was to select the data for the dependent variable for the years 2005-2009. The only exceptions are ROA, CFtS and GPM. The main reason that those variables are not taken from 2005 to 2009 is related to data selection and availability. a; for banks, insurance companies and other financial companies a different calculation is used.
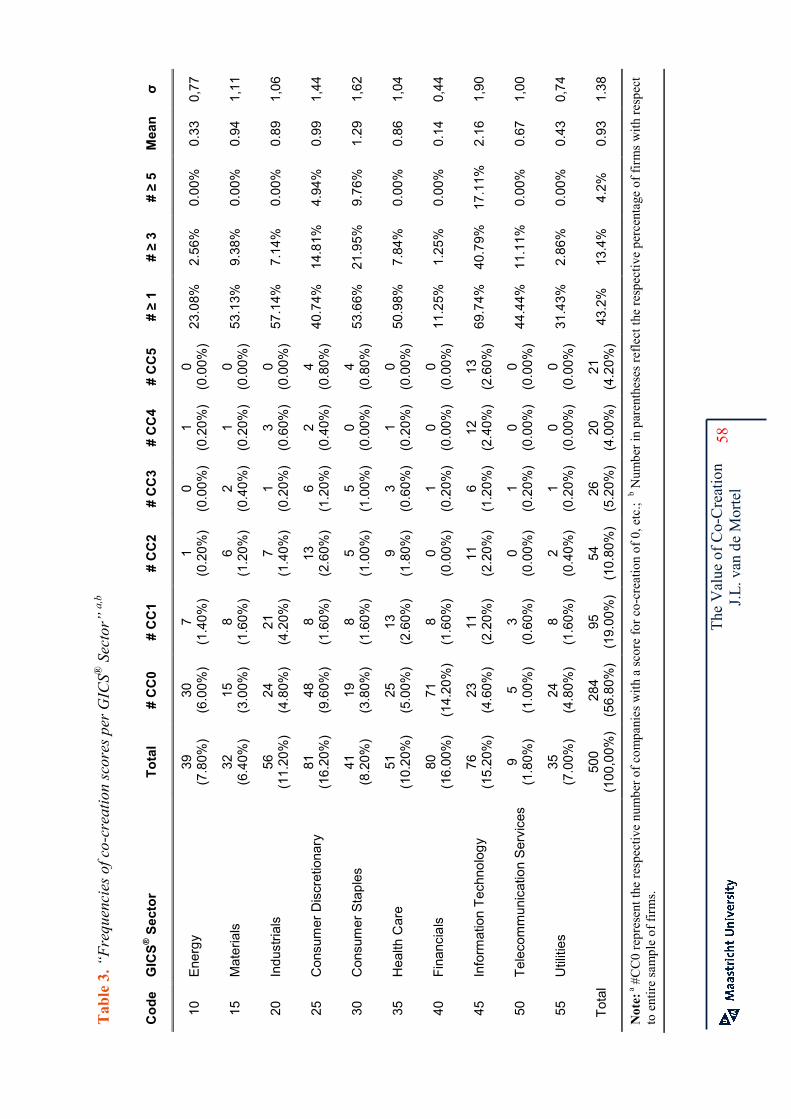
T
he V
alue
of C
o-C
reat
ion
J.
L. v
an d
e M
orte
l 58
Tab
le 3. “
Frequencies of co-creatio
n scores per GIC
S® Sector” a,
b
Co
de
GIC
S® S
ecto
r
To
tal
# C
C0
# C
C1
# C
C2
# C
C3
# C
C4
# C
C5
# ≥
1 #
≥ 3
# ≥
5 M
ean
σ
10
Energy
39
(7.80%
) 30
(6.00%
) 7
(1.40%
) 1
(0.20%
) 0
(0.00%
) 1
(0.20%
) 0
(0.00%
) 23.08%
2.56%
0.00%
0.33
0,77
15
Materials
32
(6.40%
) 15
(3.00%
) 8
(1.60%
) 6
(1.20%
) 2
(0.40%
) 1
(0.20%
) 0
(0.00%
) 53.13%
9.38%
0.00%
0.94
1,11
20
Industria
ls
56
(11.20%)
24
(4.80%
) 21
(4.20%
) 7
(1.40%
) 1
(0.20%
) 3
(0.60%
) 0
(0.00%
) 57.14%
7.14%
0.00%
0.89
1,06
25
Consumer Discretionary
81
(16.20%)
48
(9.60%
) 8
(1.60%
) 13
(2.60%
) 6
(1.20%
) 2
(0.40%
) 4
(0.80%
) 40.74%
14.81%
4.94%
0.99
1,44
30
Consumer Staples
41
(8.20%
) 19
(3.80%
) 8
(1.60%
) 5
(1.00%
) 5
(1.00%
) 0
(0.00%
) 4
(0.80%
) 53.66%
21.95%
9.76%
1.29
1,62
35
Health Care
51
(10.20%)
25
(5.00%
) 13
(2.60%
) 9
(1.80%
) 3
(0.60%
) 1
(0.20%
) 0
(0.00%
) 50.98%
7.84%
0.00%
0.86
1,04
40
Financials
80
(16.00%)
71
(14.20%)
8 (1.60%
) 0
(0.00%
) 1
(0.20%
) 0
(0.00%
) 0
(0.00%
) 11.25%
1.25%
0.00%
0.14
0,44
45
Inform
ation Technolog
y 76
(15.20%)
23
(4.60%
) 11
(2.20%
) 11
(2.20%
) 6
(1.20%
) 12
(2.40%
) 13
(2.60%
) 69.74%
40.79%
17.11%
2.16
1,90
50
Telecom
munication Services
9 (1.80%
) 5
(1.00%
) 3
(0.60%
) 0
(0.00%
) 1
(0.20%
) 0
(0.00%
) 0
(0.00%
) 44.44%
11.11%
0.00%
0.67
1,00
55
Utilities
35
(7.00%
) 24
(4.80%
) 8
(1.60%
) 2
(0.40%
) 1
(0.20%
) 0
(0.00%
) 0
(0.00%
) 31.43%
2.86%
0.00%
0.43
0,74
Total
500
(100,00%
) 284
(56.80%)
95
(19.00%)
54
(10.80%)
26
(5.20%
) 20
(4.00%
) 21
(4.20%
) 43.2%
13.4%
4.2%
0.93
1.38
Note:
a #
CC
0 re
pres
ent t
he re
spec
tive
num
ber o
f com
pani
es w
ith a
sco
re fo
r co-
crea
tion
of 0
, etc
.; b N
umbe
r in
pare
nthe
ses
refl
ect t
he re
spec
tive
perc
enta
ge o
f fir
ms
with
resp
ect
to e
ntir
e sa
mpl
e of
firm
s.
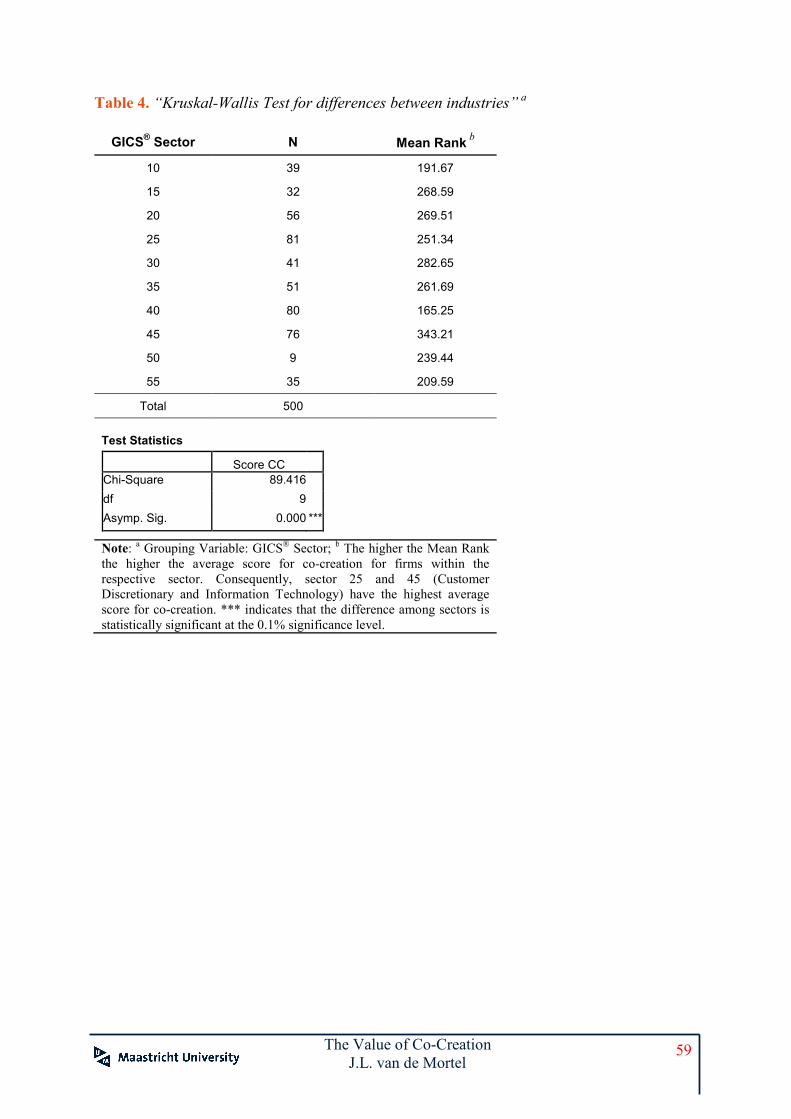
The Value of Co-Creation J.L. van de Mortel
59
Table 4. “Kruskal-Wallis Test for differences between industries” a
GICS® Sector N Mean Rank b
10 39 191.67
15 32 268.59
20 56 269.51
25 81 251.34
30 41 282.65
35 51 261.69
40 80 165.25
45 76 343.21
50 9 239.44
55 35 209.59
Total 500
Test Statistics
Score CC Chi-Square 89.416
df 9
Asymp. Sig. 0.000 ***
Note: a Grouping Variable: GICS® Sector; b The higher the Mean Rank the higher the average score for co-creation for firms within the respective sector. Consequently, sector 25 and 45 (Customer Discretionary and Information Technology) have the highest average score for co-creation. *** indicates that the difference among sectors is statistically significant at the 0.1% significance level.
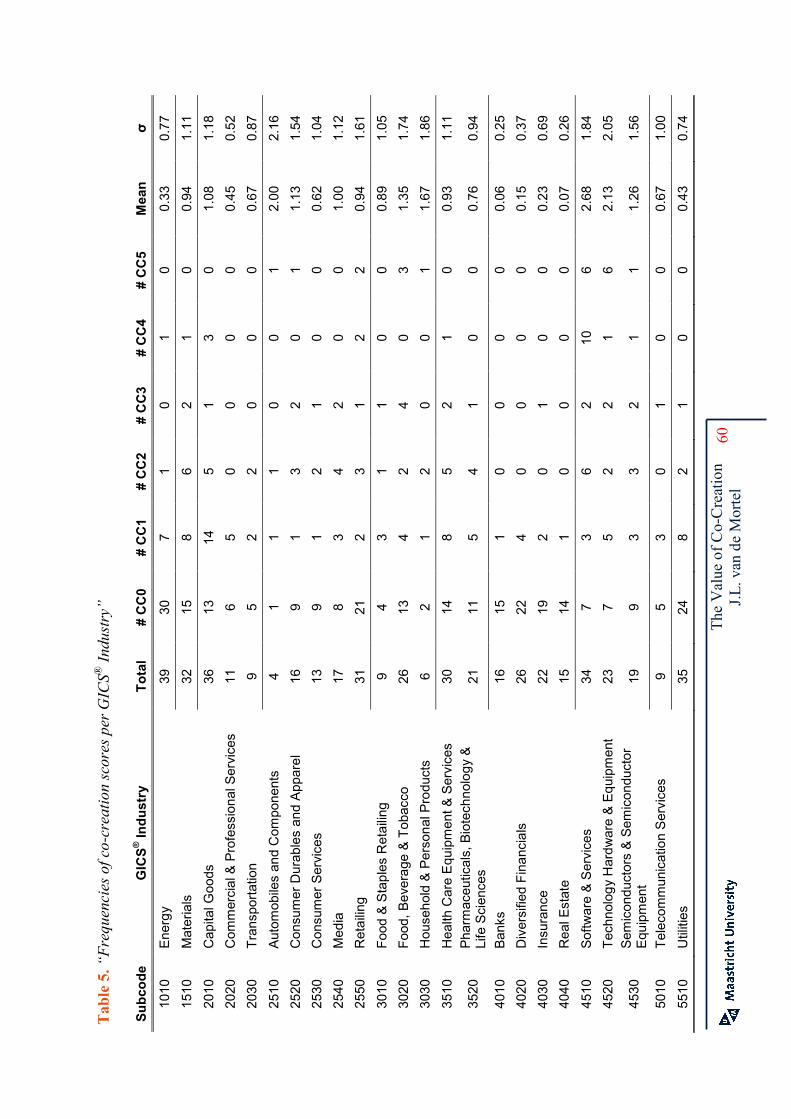
T
he V
alue
of C
o-C
reat
ion
J.
L. v
an d
e M
orte
l 60
Tab
le 5. “
Frequencies of co-creatio
n scores per GIC
S® In
dustry”
Su
bco
de
GIC
S® In
du
stry
T
ota
l #
CC
0 #
CC
1 #
CC
2 #
CC
3 #
CC
4 #
CC
5 M
ean
σ
1010
Energy
39
30
7 1
0 1
0 0.33
0.77
1510
Materials
32
15
8 6
2 1
0 0.94
1.11
2010
Capital G
oods
36
13
14
5 1
3 0
1.08
1.18
2020
Com
mercial & Professiona
l Services
11
6 5
0 0
0 0
0.45
0.52
2030
Transportation
9 5
2 2
0 0
0 0.67
0.87
2510
Autom
obiles an
d Com
ponents
4 1
1 1
0 0
1 2.00
2.16
2520
Consumer Durables and Apparel
16
9 1
3 2
0 1
1.13
1.54
2530
Consumer Services
13
9 1
2 1
0 0
0.62
1.04
2540
Med
ia
17
8 3
4 2
0 0
1.00
1.12
2550
Retailing
31
21
2 3
1 2
2 0.94
1.61
3010
Food & Staples Retailing
9 4
3 1
1 0
0 0.89
1.05
3020
Food, Beverag
e & Tobacco
26
13
4 2
4 0
3 1.35
1.74
3030
Househo
ld & Persona
l Products
6 2
1 2
0 0
1 1.67
1.86
3510
Health Care Equ
ipment &
Services
30
14
8 5
2 1
0 0.93
1.11
3520
Pharm
aceuticals, Biotechno
logy &
Life Sciences
21
11
5 4
1 0
0 0.76
0.94
4010
Banks
16
15
1 0
0 0
0 0.06
0.25
4020
Diversified Finan
cials
26
22
4 0
0 0
0 0.15
0.37
4030
Insurance
22
19
2 0
1 0
0 0.23
0.69
4040
Real E
state
15
14
1 0
0 0
0 0.07
0.26
4510
Software & Services
34
7 3
6 2
10
6 2.68
1.84
4520
Technolog
y Hardw
are & Equ
ipment
23
7 5
2 2
1 6
2.13
2.05
4530
Sem
iconductors & Sem
iconductor
Equ
ipment
19
9 3
3 2
1 1
1.26
1.56
5010
Telecom
munication Services
9 5
3 0
1 0
0 0.67
1.00
5510
Utilities
35
24
8 2
1 0
0 0.43
0.74
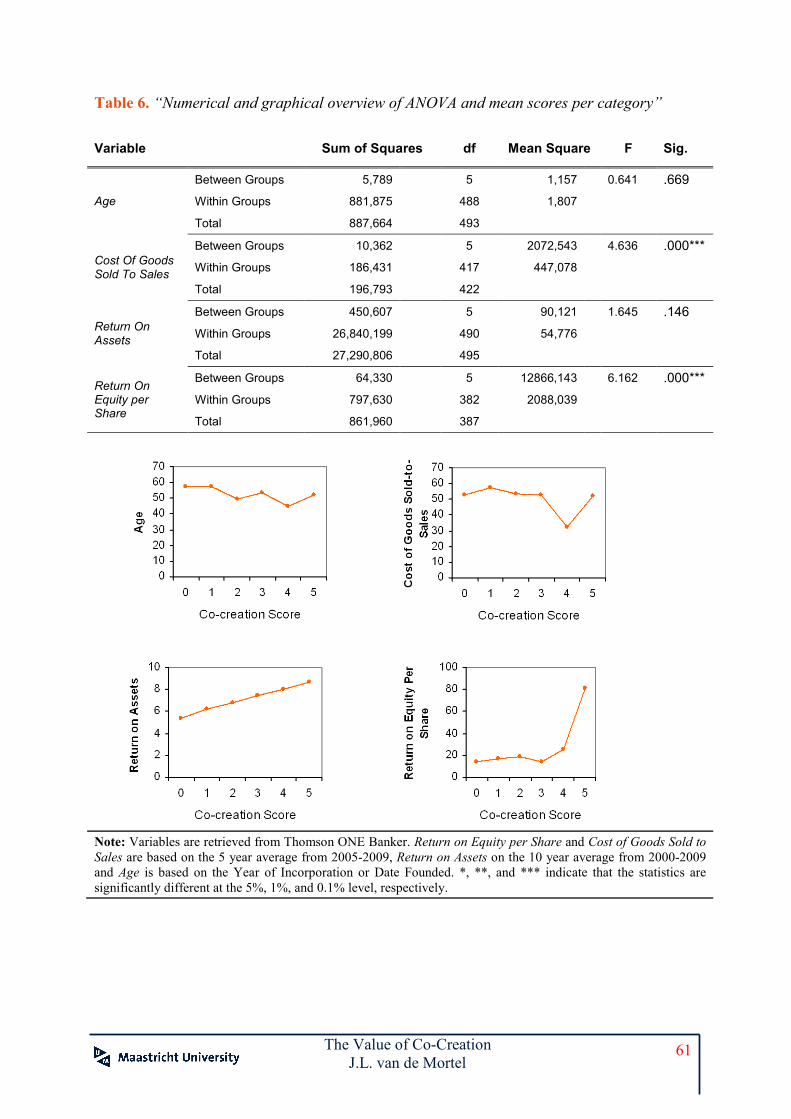
The Value of Co-Creation J.L. van de Mortel
61
Table 6. “Numerical and graphical overview of ANOVA and mean scores per category”
Variable Sum of Squares df Mean Square F Sig.
Age
Between Groups 5,789 5 1,157 0.641 .669
Within Groups 881,875 488 1,807
Total 887,664 493
Cost Of Goods Sold To Sales
Between Groups 10,362 5 2072,543 4.636 .000***
Within Groups 186,431 417 447,078
Total 196,793 422
Return On Assets
Between Groups 450,607 5 90,121 1.645 .146
Within Groups 26,840,199 490 54,776
Total 27,290,806 495
Return On Equity per Share
Between Groups 64,330 5 12866,143 6.162 .000***
Within Groups 797,630 382 2088,039
Total 861,960 387 Note: Variables are retrieved from Thomson ONE Banker. Return on Equity per Share and Cost of Goods Sold to Sales are based on the 5 year average from 2005-2009, Return on Assets on the 10 year average from 2000-2009 and Age is based on the Year of Incorporation or Date Founded. *, **, and *** indicate that the statistics are significantly different at the 5%, 1%, and 0.1% level, respectively.
010203040506070
0 1 2 3 4 5
Co-creation Score
Age
0102030
40506070
0 1 2 3 4 5
Co-creation Score
Co
st o
f Goo
ds S
old
-to-
Sal
es
0
20
40
60
80
100
0 1 2 3 4 5
Co-creation Score
Ret
urn
on
Eq
uity
Per
Sh
are
0
2
4
6
8
10
0 1 2 3 4 5
Co-creation Score
Ret
urn
on
Ass
ets
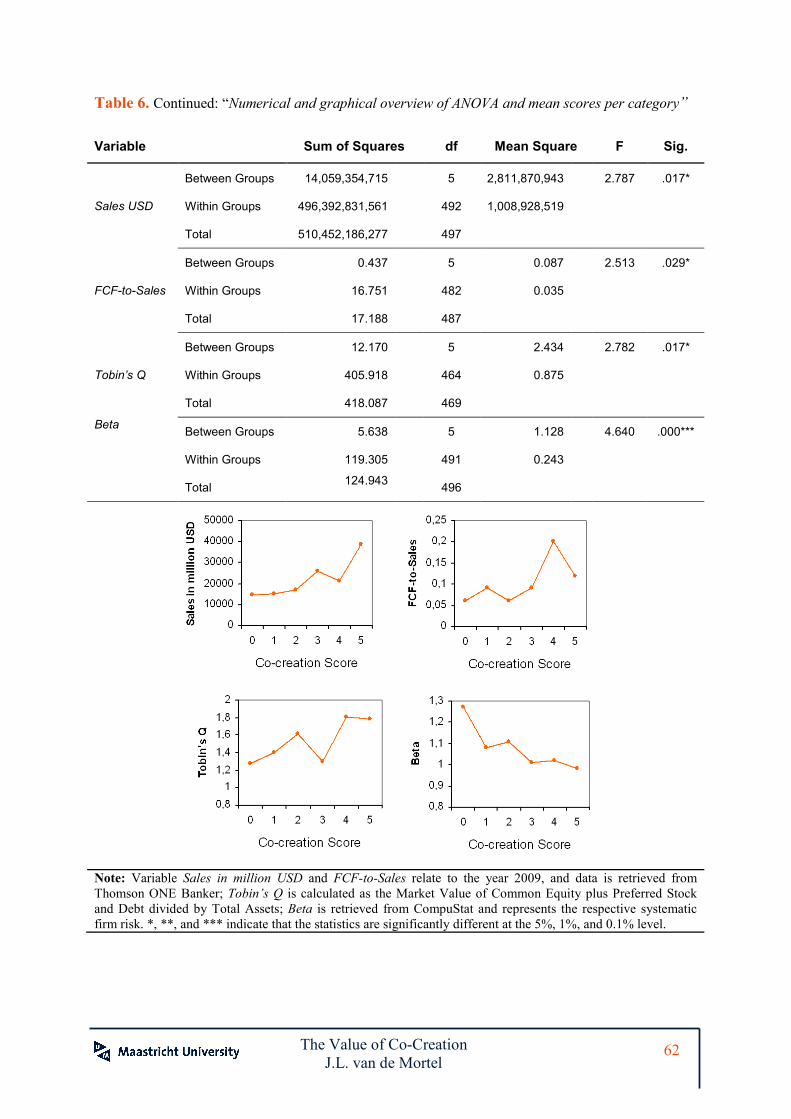
The Value of Co-Creation
J.L. van de Mortel 62
Table 6. Continued: “Numerical and graphical overview of ANOVA and mean scores per category”
Variable Sum of Squares df Mean Square F Sig.
Sales USD
Between Groups 14,059,354,715 5 2,811,870,943 2.787 .017*
Within Groups 496,392,831,561 492 1,008,928,519
Total 510,452,186,277 497
FCF-to-Sales
Between Groups 0.437 5 0.087 2.513 .029*
Within Groups 16.751 482 0.035
Total 17.188 487
Tobin’s Q
Between Groups 12.170 5 2.434 2.782 .017*
Within Groups 405.918 464 0.875
Total 418.087 469
Beta Between Groups 5.638 5 1.128 4.640 .000***
Within Groups 119.305 491 0.243
Total 124.943 496
Note: Variable Sales in million USD and FCF-to-Sales relate to the year 2009, and data is retrieved from Thomson ONE Banker; Tobin’s Q is calculated as the Market Value of Common Equity plus Preferred Stock and Debt divided by Total Assets; Beta is retrieved from CompuStat and represents the respective systematic firm risk. *, **, and *** indicate that the statistics are significantly different at the 5%, 1%, and 0.1% level.
0,8
0,9
1
1,1
1,2
1,3
0 1 2 3 4 5
Co-creation Score
Bet
a
0,8
1
1,2
1,4
1,6
1,8
2
0 1 2 3 4 5
Co-creation Score
Tob
in's
Q
0
10000
20000
30000
40000
50000
0 1 2 3 4 5
Co-creation Score
Sal
es
in m
illio
n U
SD
0
0,05
0,1
0,15
0,2
0,25
0 1 2 3 4 5
Co-creation Score
FC
F-t
o-S
ales
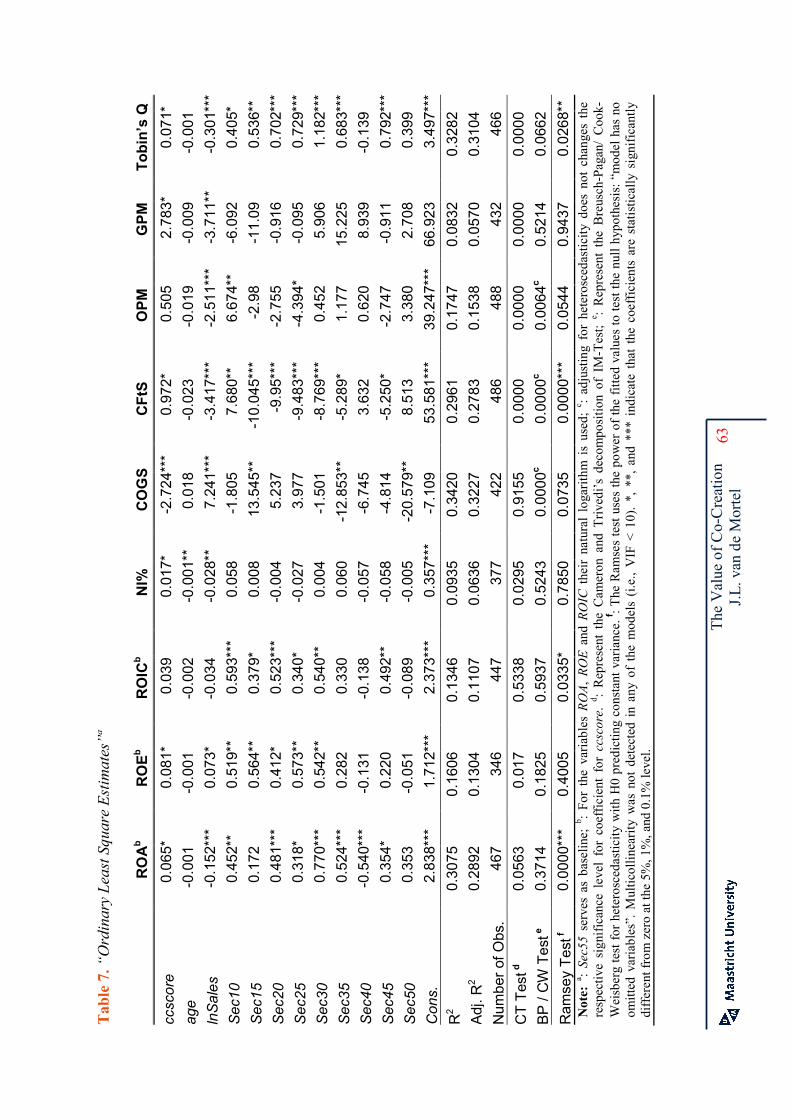
T
he V
alue
of C
o-C
reat
ion
J.
L. v
an d
e M
orte
l 63
Tab
le 7. “
Ordinary Le
ast S
quare Estim
ates”a
RO
Ab
RO
Eb
RO
ICb
NI%
C
OG
S
CF
tS
OP
M
GP
M
To
bin
’s Q
ccscore
0.065*
0.081*
0.039
0.017*
-2.724***
0.972*
0.505
2.783*
0.071*
age
-0.001
-0.001
-0.002
-0.001**
0.018
-0.023
-0.019
-0.009
- 0.001
lnSales
-0.152***
0.073*
-0.034
-0.028**
7.241***
-3.417***
-2.511***
-3.711**
- 0.301***
Sec10
0.452**
0.519**
0.593***
0.058
-1.805
7.680**
6.674**
-6.092
0.405*
Sec15
0.172
0.564**
0.379*
0.008
13.545**
-10.045***
-2.98
-11.09
0.536**
Sec20
0.481***
0.412*
0.523***
-0.004
5.237
-9.95***
-2.755
-0.916
0.702***
Sec25
0.318*
0.573**
0.340*
-0.027
3.977
-9.483***
-4.394*
-0.095
0.729***
Sec30
0.770***
0.542**
0.540**
0.004
-1.501
-8.769***
0.452
5.906
1.182***
Sec35
0.524***
0.282
0.330
0.060
-12.853**
-5.289*
1.177
15.225
0.683***
Sec40
-0.540***
-0.131
-0.138
-0.057
-6.745
3.632
0.620
8.939
- 0.139
Sec45
0.354*
0.220
0.492**
-0.058
-4.814
-5.250*
-2.747
-0.911
0.792***
Sec50
0.353
-0.051
-0.089
-0.005
-20.579**
8.513
3.380
2.708
0.399
Cons.
2.838***
1.712***
2.373***
0.357***
-7.109
53.581***
39.247***
66.923
3.497***
R2
0.3075
0.1606
0.1346
0.0935
0.3420
0.2961
0.1747
0.0832
0.3282
Adj. R
2 0.2892
0.1304
0.1107
0.0636
0.3227
0.2783
0.1538
0.0570
0.3104
Num
ber of Obs.
467
346
447
377
422
486
488
432
466
CT Test d
0.0563
0.017
0.5338
0.0295
0.9155
0.0000
0.0000
0.0000
0.0000
BP / CW Test e
0.3714
0.1825
0.5937
0.5243
0.0000
c 0.0000c
0.0064c
0.5214
0.0662
Ram
sey Test f
0.0000***
0.4005
0.0335*
0.7850
0.0735
0.0000***
0.0544
0.9437
0.0268**
Note:
a : Sec55
serv
es a
s ba
selin
e; b :
For
the
vari
able
s ROA
, ROE
and
ROIC
the
ir n
atur
al l
ogar
ithm
is
used
; c :
adju
stin
g fo
r he
tero
sced
astic
ity d
oes
not
chan
ges
the
resp
ectiv
e si
gnif
ican
ce l
evel
for
coe
ffic
ient
for
ccscore
. d :
Rep
rese
nt t
he C
amer
on a
nd T
rive
di’s
dec
ompo
sitio
n of
IM
-Tes
t; e :
Rep
rese
nt t
he B
reus
ch-P
agan
/ C
ook-
Wei
sber
g te
st f
or h
eter
osce
dast
icity
with
H0
pred
ictin
g co
nsta
nt v
aria
nce.
f: T
he R
amse
s te
st u
ses
the
pow
er o
f th
e fi
tted
valu
es to
test
the
null
hypo
thes
is: “
mod
el h
as n
o om
itted
var
iabl
es”.
Mul
ticol
linea
rity
was
not
det
ecte
d in
any
of
the
mod
els
(i.e
., V
IF <
10)
. *,
**,
and
***
ind
icat
e th
at t
he c
oeff
icie
nts
are
stat
istic
ally
sig
nifi
cant
ly
diff
eren
t fro
m z
ero
at th
e 5%
, 1%
, and
0.1
% le
vel.
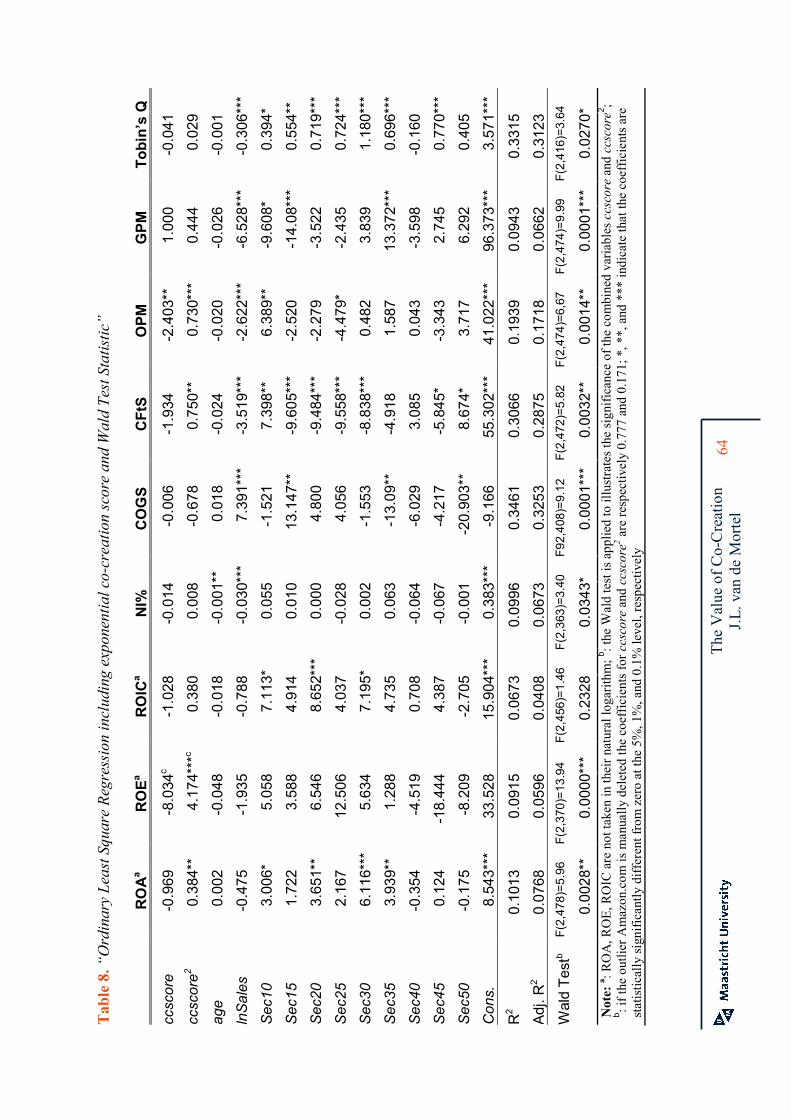
T
he V
alue
of C
o-C
reat
ion
J.L.
van
de
Mor
tel
64
Tab
le 8. “
Ordinary Le
ast S
quare Regression includ
ing expo
nential co-creatio
n score an
d Wald Test Statistic
”
R
OA
a R
OE
a R
OIC
a N
I%
CO
GS
C
FtS
O
PM
G
PM
T
ob
in’s
Q
ccscore
-0.969
-8.034
c -1.028
-0.014
-0.006
-1.934
-2.403**
1.000
-0.041
ccscore2
0.384**
4.174***
c 0.380
0.008
-0.678
0.750**
0.730***
0.444
0.029
age
0.002
-0.048
-0.018
-0.001**
0.018
-0.024
-0.020
-0.026
-0.001
lnSales
-0.475
-1.935
-0.788
-0.030***
7.391 ***
-3.519***
-2.622***
-6.528***
-0.306 ***
Sec10
3.006*
5.058
7.113*
0.055
-1.521
7.398**
6.389**
-9.608*
0.394 *
Sec15
1.722
3.588
4.914
0.010
13.147 **
-9.605***
-2.520
-14.08***
0.554 **
Sec20
3.651**
6.546
8.652***
0.000
4.800
-9.484***
-2.279
-3.522
0.719 ***
Sec25
2.167
12.506
4.037
-0.028
4.056
-9.558***
-4.479*
-2.435
0.724 ***
Sec30
6.116***
5.634
7.195*
0.002
-1.553
-8.838***
0.482
3.839
1.180 ***
Sec35
3.939**
1.288
4.735
0.063
-13.09 **
-4.918
1.587
13.372***
0.696 ***
Sec40
-0.354
-4.519
0.708
-0.064
-6.029
3.085
0.043
-3.598
-0.160
Sec45
0.124
-18.444
4.387
-0.067
-4.217
-5.845*
-3.343
2.745
0.770 ***
Sec50
-0.175
-8.209
-2.705
-0.001
-20.903 **
8.674*
3.717
6.292
0.405
Cons.
8.543***
33.528
15.904***
0.383***
-9.166
55.302***
41.022***
96.373***
3.571 ***
R2
0.1013
0.0915
0.0673
0.0996
0.3461
0.3066
0.1939
0.0943
0.3315
Adj. R
2 0.0768
0.0596
0.0408
0.0673
0.3253
0.2875
0.1718
0.0662
0.3123
Wald Testb
F(2,478)=5.96
F(2,370)=13
.94
F(2,456)=1.46
F(2,363)=3.40
F92
,408)=9.12
F(2,472)=5.82
F(2,474)=6,67
F(2,474)=9.99
F(2,416)=3.64
0.0028**
0.0000***
0.2328
0.0343*
0.0001 ***
0.0032**
0.0014**
0.0001***
0.0270 *
Note:
a : RO
A, R
OE
, RO
IC a
re n
ot ta
ken
in th
eir n
atur
al lo
gari
thm
; b: t
he W
ald
test
is a
pplie
d to
illu
stra
tes
the
sign
ific
ance
of t
he c
ombi
ned
vari
able
s ccscore
and ccscore2
; b : i
f the
out
lier
Am
azon
.com
is m
anua
lly d
elet
ed th
e co
effi
cien
ts fo
r ccscore
and
ccscore
2 are
resp
ectiv
ely
0.77
7 an
d 0.
171;
*, *
*, a
nd *
** in
dica
te th
at th
e co
effi
cien
ts a
re
stat
istic
ally
sig
nifi
cant
ly d
iffe
rent
from
zer
o at
the
5%, 1
%, a
nd 0
.1%
leve
l, re
spec
tivel
y
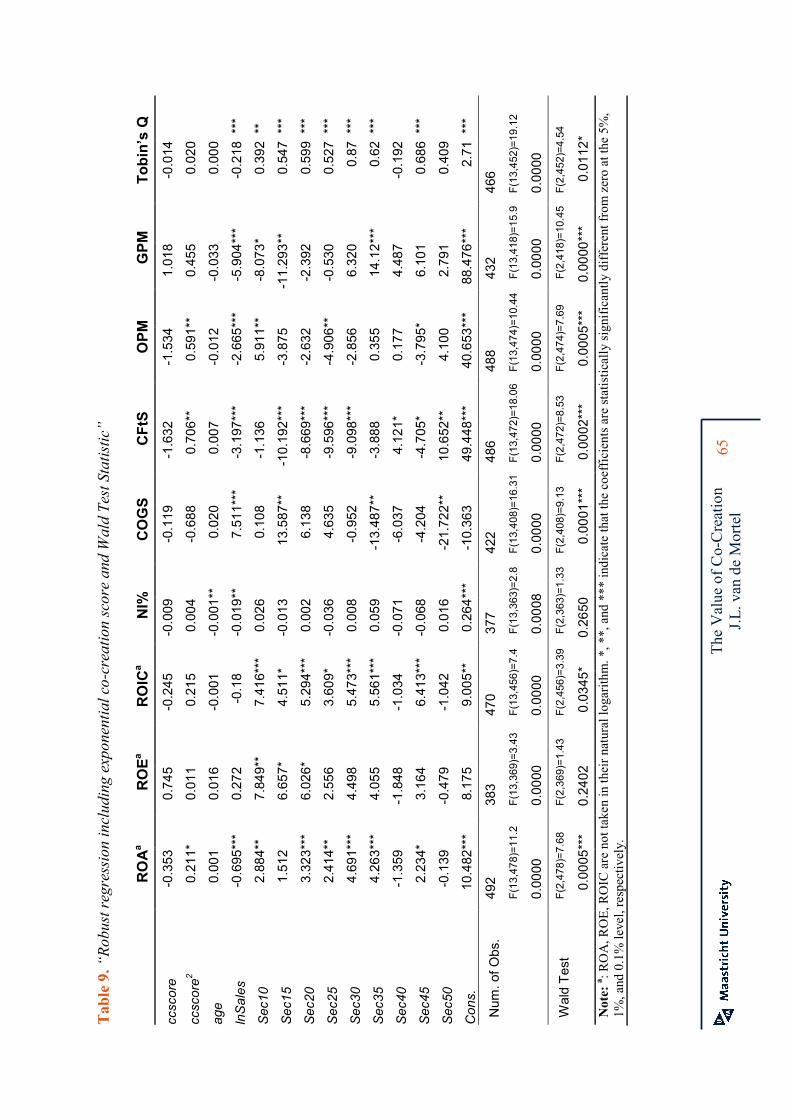
T
he V
alue
of C
o-C
reat
ion
J.L.
van
de
Mor
tel
65
Tab
le 9. “
Rob
ust regression including expo
nential co-creatio
n score and Wald Test Statistic”
RO
Aa
RO
Ea
RO
ICa
NI%
C
OG
S
CF
tS
OP
M
GP
M
To
bin
’s Q
ccscore
-0.353
0.74
5 -0. 245
-0.009
-0.119
-1.632
-1.534
1.01
8 -0.014
ccscore2
0.21
1*
0.01
1 0.21
5 0.00
4 -0.688
0.70
6**
0.59
1**
0.45
5 0.02
0
age
0.00
1 0.01
6 -0.001
-0.001
**
0.02
0 0.00
7 -0.012
-0.033
0.00
0
lnSales
-0.695
***
0.27
2 -0.18
-0.019
**
7.51
1***
-3.197
***
-2.665
***
-5.904
***
-0.218
***
Sec10
2.88
4**
7.84
9**
7.41
6***
0.02
6 0.10
8 -1.136
5.91
1**
-8.073
* 0.39
2 **
Sec15
1.51
2 6.65
7*
4.51
1*
-0.013
13.587
**
-10.19
2***
-3.875
-11.29
3 **
0.54
7 ***
Sec20
3.32
3***
6.02
6*
5.29
4***
0.00
2 6.13
8 -8.669
***
-2.632
-2.392
0.59
9 ***
Sec25
2.41
4**
2.55
6 3.60
9*
-0.036
4.63
5 -9.596
***
-4.906
**
-0.530
0.52
7 ***
Sec30
4.69
1***
4.49
8 5.47
3***
0.00
8 -0.952
-9.098
***
-2.856
6.32
0 0.87
***
Sec35
4.26
3***
4.05
5 5.56
1***
0.05
9 -13.48
7**
-3.888
0.35
5 14.12 ***
0.62
***
Sec40
-1.359
-1.848
-1.034
-0.071
-6.037
4.12
1*
0.17
7 4.48
7 -0.192
Sec45
2.23
4*
3.16
4 6.41
3***
-0.068
-4.204
-4.705
* -3.795
* 6.10
1 0.68
6 ***
Sec50
-0.139
-0.479
-1.042
0.01
6 -21.72
2**
10.652
**
4.10
0 2.79
1 0.40
9
Cons.
10.482
***
8.17
5 9.00
5**
0.26
4 ***
-10.36
3 49.448
***
40.653
***
88.476
***
2.71
***
Num
. of O
bs.
492
383
470
377
422
486
488
432
466
F(13,478)=1
1.2
F(13,369)=3
.43
F(13,456)=7
.4
F(13,363)=2
.8
F(13,408)=1
6.31
F(13,472)=1
8.06 F(13,474)=1
0.44
F(13,418)=1
5.9
F(13,452)=1
9.12
0.00
00
0.00
00
0.00
00
0.00
08
0.00
00
0.00
00
0.00
00
0.00
00
0.00
00
Wald Test
F(2,478)=7.68
F(2,369)=1.43
F(2,456)=3.39
F(2,363)=1.33
F(2,408)=9.13
F(2,472)=8.53
F(2,474)=7.69
F(2,418)=10.45
F(2,452)=4.54
0.00
05***
0.24
02
0.03
45*
0.26
50
0.00
01 ***
0.00
02***
0.00
05***
0.00
00 ***
0.01
12 *
Note:
a : RO
A, R
OE
, RO
IC a
re n
ot ta
ken
in th
eir n
atur
al lo
gari
thm
. *, *
*, a
nd *
** in
dica
te th
at th
e co
effi
cien
ts a
re s
tatis
tical
ly s
igni
fica
ntly
dif
fere
nt fr
om z
ero
at th
e 5%
, 1%
, and
0.1
% le
vel,
resp
ectiv
ely.

The Value of Co-Creation J.L. van de Mortel
66