Embed Size (px)
Citation preview

MSc in Business Administration
Factors influencing the bid/no bid
decision making and the success of
contract bids in the telecommunication
industry
University of Twente
Technische Universität Berlin
Jaakko Lemberg
s1184849
December 9, 2013

II
Formalities
Title: Factors influencing the bid/no bid decision making and the
success of contract bids in the telecommunication industry
Date: December 9, 2013
Student: Jaakko Lemberg
Linienstrasse 88
10119 Berlin
Germany
Student Number: s1184849
E-Mail: [email protected]
Telephone: +358405688481
University in the Netherlands: University of Twente
7500 AE Enschede
The Netherlands
University in Germany: Technische Universität Berlin
Straße des 17. Juni 135
10623 Berlin
Germany
Study Programme: Business Administration
Track: Innovation Management and Entrepreneurship
Faculty: School of Management and Governance
Twente Supervisor: Dr. ir Jeroen Kraaijenbrink
Dr. Michel Ehrenhard
TU Berlin Supervisor: Ingo Michelfelder

III
Acknowledgements
This master thesis is part of the double degree Master programme of University of Twente in
Business Administration and Technische Universität Berlin in Innovation Management and
Entrepreneurship.
The success of any project depends largely on the encouragement and support of many others. I
take this opportunity to express my gratitude to the people who have been highly important in the
successful completion of this research project.
I would like to acknowledge with much appreciation the crucial role of my first supervisor Dr. ir
Jeroen Kraaijenbrink from University of Twente who provided valuable feedback and guidance
during the entire research process. I would also like to thank my second supervisor Dr. Michel
Ehrenhard from University of Twente for the supervision and academic guidance. In addition I want
to thank my third supervisor Ingo Michelfelder from Technische Universität Berlin for the feedback
and advice on the final form of this master thesis.
I would like to thank my family and friends that have supported me throughout my studies and the
entire research process, motivated me and helped me putting the pieces together. I am grateful for
their constant support and help.

IV
Abstract
Evaluating customer tender enquiries and deciding whether to bid or not to bid can be complex and
time consuming process. A pre-bid screening and analysis procedure can save company resources
and lower overall expenses. This paper focuses on examining which factors influence the success of
a bid of a telecommunication system solution manufacturer and introduces 18 different factors that
have been found by previous studies to influence the bid/no bid decision making in construction and
electro mechanical industries. To measure the influence of these factors on the success of bids made
by a manufacturer of telecommunication system solutions, a questionnaire was used. The
management level respondents involved in the bidding processes identified altogether 56 successful
and 56 unsuccessful bids and indicated how each of the factors described the bidding situations.
Factor analysis was used to identify the underlying dimensions. Logistic regression models were
developed and the final model including all the predictors in the model was capable of classifying
the total sample with an overall predictive accuracy rate of 86 percent. The significant predictors
contributing to the prediction were the future business possibilities with the customer, the
compatibility of the products offered with the customer specifications, the competition in the market
and the availability of adequate financial resources.

V
Contents
Formalities .......................................................................................................................................... II
Acknowledgements ............................................................................................................................ III
Abstract .............................................................................................................................................. IV
List of Figures .................................................................................................................................. VII
List of Tables ................................................................................................................................... VII
1. Introduction ................................................................................................................................... 1
2. Research objective ........................................................................................................................ 2
3. Literature review ........................................................................................................................... 4
3.1. Individual and organizational decision making ..................................................................... 4
3.2. Decision-making in bid-processes......................................................................................... 5
3.3. Factors relating to bid/no bid decision making ..................................................................... 8
3.3.1. Company ...................................................................................................................... 11
3.3.2. Product ......................................................................................................................... 13
3.3.3. Market .......................................................................................................................... 15
3.3.4. Customer ...................................................................................................................... 18
4. Research methodology ................................................................................................................ 22
4.1. Sampling .............................................................................................................................. 22
4.2. Data collection ..................................................................................................................... 23
4.3. Data analysis........................................................................................................................ 24
5. Results......................................................................................................................................... 26
5.1. Response rate and characteristics of the respondents .......................................................... 26
5.2. Correlations, response summaries and t-tests for the difference between two means ........ 28
5.3. Factor analysis ..................................................................................................................... 36
5.4. Logistic regression analyses ................................................................................................ 38
6. Discussion ................................................................................................................................... 43

VI
6.1. Future business possibilities with the customer .................................................................. 44
6.2. The compatibility of the products offered ........................................................................... 45
6.3. The availability of adequate financial resources ................................................................. 46
6.4. Competition in the market ................................................................................................... 47
6.5. The role of the other variables in the final model ............................................................... 48
7. Conclusions and implications ..................................................................................................... 49
7.1. Managerial implications ...................................................................................................... 51
7.2. Contribution to theory ......................................................................................................... 51
8. Limitations and further research ................................................................................................. 52
9. Bibliography ............................................................................................................................... 55
10. Appendices .............................................................................................................................. 61
10.1. Appendix: Questionnaire ................................................................................................. 61
10.2. Appendix: Personalized email invitation to participate in the research .......................... 66
10.3. Appendix: Reminder to participate in the research ......................................................... 66
10.4. Appendix: Factor analysis – Scree plot ........................................................................... 67
10.5. Appendix: Logistic regression – Observed Groups and Predicted Probabilities ............. 68
10.6. Appendix: Logistic regression – ROC curve ................................................................... 69

VII
List of Figures
Figure 1: Holtzmann´s decision analysis cycle .................................................................................... 6
Figure 2: Tender enquiry and bid process by B.G. Kingsman and de Souza ...................................... 7
Figure 3: The beginning of the enquiry process by Kingsman, Hendry, Mercer & de Souza (1996) . 8
Figure 4: Buy-Sell Hierarchy derived from Miller ............................................................................ 20
Figure 5: Variables influencing the success of a bid in telecommunication industry ........................ 21
Figure 6: Variables influencing the success of a bid and odds ratios from logistic regression ......... 49
List of Tables
Table 1: Factors identified from previous studies with key references ............................................. 11
Table 2: Characteristics of the respondents ....................................................................................... 28
Table 3: Pearson correlation coefficients of the factors identified from the literature ...................... 30
Table 4: The mean answers of respondents for successful and unsuccessful bids, the difference
between the means, t-values and the significance of two-sample t-test ............................................. 36
Table 5: Factor analysis ..................................................................................................................... 38
Table 6: Logistic regression analysis results with factors .................................................................. 40
Table 7: Groups of variables from the initial factor analysis ............................................................. 41
Table 8: Logistic regression analysis results with groups of variables .............................................. 43

1
1. Introduction
Responding to customer tender enquiries has to be handled carefully and in good time or otherwise
it might affect organization´s credibility and reliability. Effective customer tender enquiry
management is highly important for majority of enterprises (Oduoza & Xiong, 2009). The more
customer tender enquiries the company receives, and the more enquiries it is able to bid on in time,
the more chances the company has to get actual orders (B. G. Kingsman & de Souza, 1997).
Evaluating customer tender enquiries and deciding whether to bid or not to bid can be complex and
time consuming process and involve the utilization of company´s resources and create expenses that
can be damaging for other company business areas (Buzby, 2002; Cova, Salle, & Vincent, 2000).
On the other hand, decisions to bid or not to bid, or the overall engagement in the tender process,
can be based on subjective evaluation and decision making (Ahmad, 1990). In order to avoid
situations where too many resources are used or where decision making is based only on a gut
feeling, a pre-bid screening and analysis procedure can become a strategic tool (Cova et al., 2000).
Garrett points out that a simple, repeatable, and effective bid/no bid decision making process can be
valuable to a company by reducing costs and improving revenues and profits (Garret, 2005).
(Text removed for confidentiality purposes)

2
2. Research objective
The aim of this research paper is to present a checklist that allows the decision-maker in the bidding
process to combine subjective evaluation and data based on past experience into the bid/no bid
decision making.
According to the literature review in chapter 3, internal tender analysis processes are stepwise
procedures that include several different decision making points. However, before these processes
can begin the most important decision needs to be made, to bid or not to bid. This decision can be
based on several factors that are transparent and known inside the decision making organization.
However, it is also possible that these factors are difficult to identify and analyze as managers use
past experience and inner feeling in a situation where fast decision making is needed. This leads to a
situation where the initial decision is based on weak reasoning and gut feeling and thus resulting in
unbalanced decision making.
Majority of the research conducted on bid/no bid decision making processes and the factors that
influence the decision making concern construction industry and large project contracts (Bagies &
Fortune, 2006; Stark & Rothkopf, 1979). However, there is a need for effective bidding in every
industry as company resources are scarce and bidding for badly chosen requests may result in great
loss of time and other assets. Previous literature have identified factors that are important in the
bid/no bid decision making, but as the factors are related to large projects they emphasize the need
for secure financial resources and minimizing possible risk factors. However, for a manufacturing
company the factors can differ, as the number of tenders is higher, the tenders are smaller and as the
relationship with the customer can influence the long-term decision making. Therefore, the first
focus of this research paper is to identify those critical factors that influence the bid/no bid decision
making of a telecommunication system solution manufacturer.
The second focus of this study is to examine what the manufacturing company should consider
when pursuing for successful bids. Responding to all possible customer tender requests takes time
and overloads the team working with tenders. This may affect the quality of all bids and decrease
the overall win rate of bids. The amount of effort put into the specification and estimation process
can differ according to the customer request. The company can choose to concentrate more efforts
on larger, more profitable tenders and prepare a quick estimate with high margin for other tenders
3
where later negotiations with the customer are expected (B. G. Kingsman, Hendry, L., Mercer, A.,
& de Souza, A., 1996). However, the main goal of the manufacturing company would be to
concentrate efforts on bids that would be successful in the end and bring in customer orders. As part
of the bid/no bid decision making the company could evaluate tenders according to the influencing
factors and identify bids that would be successful. Therefore, the second focus of this study is to
identify which of the factors influence the success of a bid in the telecommunication industry in the
European, Middle East and African (EMEA) region. Based on this the research question of this
paper is:
Which factors influence the success of a bid of a telecommunication system solution manufacturer
in the EMEA region?
After identifying from the literature the factors that influence the bid/no bid decision making and
examining the factors that influence the success of tenders of a telecommunication system solution
manufacturer, this study attempts to provide a checklist that can support the bid evaluation process
and yield benefits for the manufacturing companies. In the ever tightening global competition such
list can help and increase the possibilities of successful bids.
As a summary, the research objective of this paper is to understand and identify which factors
influence the bid/no bid decision making and the ultimate success of tenders of a
telecommunication system solution manufacturer. Examining these factors scientifically and
bringing them to the attention of the decision making managers this research paper contributes to
the business operations of manufacturing organizations in telecommunication industry. By
indentifying and acknowledging the factors influencing the bid/no bid decision making and the
success of tenders, the results of this research set certain guidelines for the decision making
managers to evaluate. By taking into consideration the influencing factors the management can
increase the likelihood of winning a tender and acquiring prospective new customers.
In order to answer the research question, first a literature review is conducted. The aim of the
literature review is to describe individual and organizational decision making and in more detail the
decision making of bid processes. Through the literature review the relevant factors that have been
considered important by previous studies in the bid/no bid decision making are indentified. After
this the factors influencing the success of a bid are measured with a questionnaire. By analyzing the

4
questionnaire results the aim is to identify those factors that influence the success of a bid and use
this information to guide the bid/no bid decision making of a telecommunication system solution
manufacturer.
3. Literature review
After a company receives a customer tender enquiry, the request goes through several different
processes where different kinds of decisions are made. In the following paragraphs first the
individual and organizational decision making processes are discussed. After this the focus is on
literature concerning decision making in bid processes and specifically on the pre analysis stage of
the bid process and the factors related to that stage.
3.1. Individual and organizational decision making
The individual decision making can be described in several ways such as intuitive (Sauter, 1999), as
a political process (Pfeffer & Salancik, 1974) or as socialized (van Dijk & Vermunt, 2000). This
paper focuses on the individual decision making of managers through rational approach and through
bounded rationality perspective. Rational approach is based on systematic analysis of a problem
which is followed by choice and implementation in a logical cycle. When managers understand and
are willing to use the rational decision making process it can help them to make decisions even
when there is a shortage of information (Etzioni, 1967; Simon, 1955).
However, as the real world is uncertain, complex and rapidly changing, the process is not
necessarily fully achievable. In combination with time pressure, a number of internal and external
factors and the ill-defined nature of many problems, managers have to rely on intuition and
experience (J. W. Dean & Sharfman, 1993). Decision making in these situations is described by the
bounded rationality perspective according to which the rational thinking of managers is limited by
the complexity of problems (Simon, 1955). Nevertheless, intuition is not arbitrary or irrational but
more of a hands-on experience from a longer period of time which helps managers to perceive and
understand problems more rapidly and develop gut feeling on how to solve different kind of issues.
Incorporating previous experience and judgement into decision making brings intangible aspects
into problem solving and thus ensures that more factors are taken into account (Daft, 2010).

5
Organizational decision making deals with problem solving that involves several managers. The
management science approach is equivalent to the rational approach by individual managers and
helps in problem solving when problems are analyzable and when different factors and variables
can be identified and measured (Courtney, 2001). However, as the quantitative data are not rich and
do not contain tacit knowledge, the management perception is needed. Therefore management
science should supplement the actual decision making by management as then both qualitative and
quantitative data are combined (Daft, 2010). This paper concentrates on indentifying and
quantifying the relevant factors that are important in the bid/no-bid decision making and thus
develops a management science approach that can be used in combination with managerial
experience in organizational decision making.
3.2. Decision-making in bid-processes
A great volume of literature has focused on bidding strategies and bid/no bid decision making since
Friedman (1956) introduced his mathematical model (Drew & Skitmore, 1997; Drew, Skitmore, &
Lo, 2001; Drew, Tang, & Lo, 2002; Friedman, 1956; Skitmore, 2002). Based on this approach is
also the school of research that has focused on mark-up decisions, models that focus on maximizing
the expected profit from a tender (Dozzi, AbouRizk, & Schroeder, 1996; Fayek, 1997; Li, Shen, &
Love, 1999; M. Liu & Ling, 2005; S. L. Liu, Wang, & Lai, 2005; Mochtar & Arditi, 2001; Parvar,
Lowe, Emsley, & Duff, 2000; Seydel & Olson, 2001). Another research stream has concentrated on
bid decision making processes (Ahmad, 1990; Gunner & Skitmore, 1999; B. G. Kingsman & de
Souza, 1997; B. G. Kingsman, Hendry, Mercer, & de Souza, 1996; B. G. Kingsman, Hendry, L.,
Mercer, A., & de Souza, A., 1996; Paranka, 1971) and on factors that affect the bid/no bid decisions
(Dulaimi & Shan, 2002; Lowe & Parvar, 2004; Shash, 1998; Wanous, Boussabaine, & Lewis, 1998,
2000, 2003).
As bidding strategies or mark-up decision are not the focuses of this paper, the following
paragraphs concentrate first on some of the studies describing the decision making in bid processes.
This is followed by a selection of studies in which the factors that are important in bid/no bid
decision making were identified.
Paranka (1971) divides the bidding strategy into a pre-bid analysis stage and a bid determination
stage. According to Paranka (1971) it is crucial to assess first the pay-off value of a bid opportunity

6
before placing an actual bid. Ahmad (1990) presented another decision analysis cycle and
concentrated on the treatment of the first stage, i.e. the deterministic bid/no bid decision making
process of the decision analysis cycle by Holtzmann (1989) (Figure 1). In Ahmad´s (1990) model
the individual worths on the factors are weighted and combined additively. This results in an overall
score that is based on the subjective evaluation of the request. Ahmad´s (1990) model is flexible as
management can change the attributes in the model according to the changes in the business
environment.
Figure 1: Holtzmann´s decision analysis cycle
Bidding
decision
problem
Selected
markup
Def
inin
g c
rite
ria/
bas
is
Det
erm
inis
tic
bid
/no
-
bid
dec
isio
n a
nal
ysi
s
Det
erm
inis
tic
bas
is
app
rais
al
Mea
sure
of
un
cert
ainti
es a
nd
ris
k
atti
tud
e
Uti
lity
-th
eore
tic
anal
ysi
s
Exp
ecte
d u
tili
ty a
nd
pro
bab
ilit
y o
f w
inn
ing
Deterministic
basis
Basis refinement
Attention-focusing method Decision method
Decision-Analysis Cycle for Bidding Problem as Closed-Loop Progressive-Formulation Framework
Source: Holtzmann (1989)
B. G. Kingsman and de Souza (1997) studied 12 different versatile manufacturing companies and
interviewed management level representatives of the organizations in order to understand the work
routines and procedures involved in customer tender enquiry and bid process. The result of the
research was a sequential stage process describing the different stages that most of the studied
organizations implemented as part of their customer enquiry-bid process (Figure 2).

7
Figure 2: Tender enquiry and bid process by B.G. Kingsman and de Souza
Reject bid
Seek reasons
Customer places
order on salesManufacturing
Seek clarification
Additional information
Reject the
enquiryAviableenquiry?
Customer decision?
9. Reconsider design
Refine estimates
Bid price approved?
Record bid details
10. Submit
tender to
customer
11. Customer asks for
renegotiation
2. Initial evaluation1. Receive enquiry
3. Review specifications
Clear specifications?
4. Decide level of detail for
design and estimation
5. Allocate tasks
6. Do design
work/Prepareestimates
7. Prime cost proposal
8. Tender vetting
Approve contract
details
Source: B.G. Kingsman and de Souza (1997)
B. G. Kingsman and de Souza (1997) divide the process stages into two different groups. The first
group consists of stages that require judgments or decisions, i.e. stages where management has to
evaluate and judge factors that influence the decision making. These factors and situations can
involve estimations on how likely it is that the particular enquiry will lead to future profitable
business or what is the strategic importance of the enquiry for the organization. The second group
of stages requires actions and information transfers as in when receiving the customer enquiry,
allocating the work concerning the enquiry to different departments and finally delivering the quote
to the customer. The first decision made in the process is at stage 2, namely the initial decision if it
is worth to continue with the enquiry or leave it aside, i.e. to bid or not to bid.
The focus of the present paper is to concentrate on the bid/no bid decision making stage that can be
found from the models of Paranka (1971), Holtzmann (1989), Ahmad (1990) and B.G. Kingsman
and de Souza (1997). The bid/no bid decision making stage is a part of a larger process in all of the
models, but has an important role as the decisions in that stage either initiate the process or not. The
present paper looks into the variables which influence the decision making in the bid/no bid

8
decision making stage and investigates which variables have a significant influence on the success
of bids. After identifying the variables that influence the success of bids these variables can be
given more attention to in the initial bid/no bid decision making stage and thus make the decision
making of the management more efficient and productive. In the following paragraphs previous
studies and the variables that have been identified important in the bid/no bid decision making in
those studies are presented.
3.3. Factors relating to bid/no bid decision making
In order to make justified decisions that are based on a broad perspective and valid data, several
variables needs be taken into account in the evaluation of the enquiries. This will help in
determining if it is profitable to bid on an enquiry and realize what the possibilities of winning the
bid are.
Ahmad (1990) concentrated in his study on the overall worth of a project, position and goals of the
company, resource constraints and market conditions by dividing the factors into 4 main categories;
job, firm, market and resource related. These main categories included altogether 13 different
factors. B. G. Kingsman et al. (1996) identified certain variables that affect the process stages and
separated them into (1) company capabilities and strategy, (2) product related variables, (3)
customer related variables and (4) market competitiveness. According to the framework by B. G.
Kingsman et al. (1996) company capabilities and strategy with product related variables affect the
initial evaluation step of the process; whether to bid or not (Figure 3).
Figure 3: The beginning of the enquiry process by Kingsman, Hendry, Mercer & de Souza (1996)
Initial evaluation:
Bid/no-bid decision
Company capabilities
and strategy
Receive customer
enquiry
Product related
variables
Variables affecting process
Further steps

9
M. King and Phythian (1992) identified 18 factors that have an effect on the bid/no-bid decision
making by examining managerial decision making regarding 14 different historic customer
enquiries. In another study Phythian and King (1992) collected 26 different factors by asking
managers to consider 12 previous tender enquiries and specify the factors that we used to
discriminate between the tenders.
Shash (1998) concentrated on the construction industry and identified 16 different factors that have
an effect on the bid/no-bid decision making of subcontractors. The main factors emphasized the
importance of financial and experience related issues as the most important factors were the credit
history of the main contractor, the issuance of periodical payment and leadership and capability in
planning and managing a project. Another study from the construction industry by Egemen and
Mohamed (2007) listed 50 different factors based on questionnaires answered by small- and
medium sized contractor companies. The factors between different industries are similar even
though in construction industry factors relating to financial resources and experience in large
project management were emphasized.
Ward and Chapman (1988) listed 8 non-price criteria to be important in the decision making.
Mustafa and Ryan (1990) identified technical and cost criteria as main factors while Lin and Chen
(2004) found 6 main criteria and 11 sub-criteria that affect the bid/no-bid decision making. Wanous
et al. (2000) generated 38 different factors through interviews and questionnaires, while Cova et al.
(2000) list altogether 15 factors divided into factors that measure the attractiveness of the project to
the bidder and the competitive strengths of the bidder. Lowe and Parvar (2004) indentified 21
factors but concluded that only 8 of them had a linear relationship with the decision to bid.
This paper follows Ahmad (1990), B. G. Kingsman et al. (1996) and Egemen and Mohamed (2007)
and divides the factors into four groups to distinguish between the different factors that are
important in the bid/no bid decision making. Ahmad (1990), B.G, Kingsman et al. (1996) and
Egemen and Mohamed (2007) distinguish between the categories of factors as these present
different subgoals in their bid/no bid decision making models. Achieving lower level goals
contribute to the overall achievement of the higher level goals that are presented by the variable
groups. Furthermore, B.G. Kingsman et al. (1996) point out that this categorization helps the
management level to understand better the different variables and the way judgments are made
about the variables. In the present paper the categorization of the variables into different groups is

10
made to help the researcher and the readers to distinguish between the different variables and to
understand how the variables relate to the bid/no bid decision making. The factors in these groups
are factors that have been identified through literature research. A comparison of 13 different
studies was conducted. Each of these studies discussed the factors influencing bid/no bid decision
making. The factor groups in this paper are company, product, market, and customer. Each of these
groups contains factors that relate either to the company, product, market or the customer related
matters.
As previous studies have focused in different industries, such as construction and electro
mechanical industries, the factors that appeared in majority of the previous studies and that could
also be applied to telecommunication industry were chosen. 23 factors that appeared at least in four
of the thirteen articles studied were chosen for further analysis. Out of these 23 factors 13 were
chosen for this study. The ten factors not chosen emphasized mainly the needs of large projects that
require extensive financial resources and long-term project planning. Construction business is
characterized by long-term nature of the contract implementation and joint venture construction
projects. Project costs usually include those for land acquisition, planning, financing, design,
construction, operations, maintenance and repairs. Furthermore, most construction projects are
developed in stages and may take from 1 to 5 or more years (Committee of Advancing the
Competitiveness and Productivity of the U.S. Construction Industry, 2009). These large projects are
typical for construction business where as the projects in the telecommunication system solution
manufacturing business are shorter and require less financial resources to implement. Five other
factors not mentioned in the studied articles were added to the list on basis of conversations with the
representatives of a telecommunication system solution manufacturer and separate literature
research. Market share factor was an exception of other factors as it only appeared in two of the
articles studied. However, as the EMEA region is highly diverse and contains several different
market areas, market share in a particular area can have great importance in the bid/no bid decision
making. Therefore market share factor was added to the final factor list to be studied. Altogether 18
factors are studied in this research paper. The 18 variables and the key literature references are
listed in Table 1 below. In the following chapters each of the groups and relevant factors are
discussed. The aim is to accomplish an understanding of what each of the factors mean, how they
are used in previous studies and how the factors are measured in this study.

11
Table 1: Factors identified from previous studies with key references
Group Factor Key references
Availability of free
manufacturing capacity
Paranka (1971), Ahmad (1990), M. King & Phythian (1992), Wanous et
al. (2000), Egemen & Mohamed (2007)
ExperienceAhmad (1990), Mustafa (1990), Shash (1998), Cova (2000),
Wanous et al. (2000), Egemen & Mohamed (2007)
Financial resourcesM. King & Phythian (1992), Cova (2000), Wanous et al. (2000), Lowe
(2004), Egemen & Mohamed (2007)
Internal resourcesAhmad (1990), Mustafa (1990), Cova (2000), Wanous et al. (2000),
Lowe (2004), Egemen & Mohamed (2007)
PartnersCova (2000), Wanous et al. (2000),
Lowe (2004), Egemen & Mohamed (2007)
IncumbencyTeece (1986), Tripsas (1997),
A.A. King & Tucci (2002), Rubel (2013)
Novelty of the productsDean (1969), Wasson (1976), Kingsman & de Souza (1997),
Bijmolt, Van Heerde & Pieters (2005)
Rigidity of
customer specifications
Ward & Chapman (1988), Ahmad (1990), Shash (1998), Wanous et al.
(2000), Egemen & Mohamed (2007)
Compatibility Kelly & Coaker (1976), Katz & Shapiro (1994)
Competition in the marketParanka (1971), Ahmad (1990), M. King & Phythian (1992),
Kingsman & de Souza (1997), Lin & Chen (2004)
Market areaWard & Chapman (1988), Ahmad (1990),
Wanous et al. (2000), Egemen & Mohamed (2007)
Market share Lin & Chen (2004), Egemen & Mohamed (2007)
Total value of the bidParanka (1971), Ahmad (1990), M. King & Phythian (1992), Wanous et
al. (2000), Egemen & Mohamed (2007)
Availability of other
projects in the market
Paranka (1971), Kingsman & de Souza (1997),
Wanous et al. (2000), Egemen & Mohamed (2007)
Price sensitivityMorris & Joyce (1988), Tellis (1988),
Bijmolt, Van Heerde & Pieters (2005)
Sourcing strategy Kortge & Okonkwo (1993), Choi & Linton (2011)
Current relationshipWanous et al. (2000), Lowe & Parvar (2004),
Miller (2006), Smith (2012)
Future business possibilities
with the customer
Paranka (1971), Shash (1998), M. King & Phythian (1992),
Cova (2000), Egemen & Mohamed (2007)
Company
Product
Market
Customer
Bid
/no b
id d
ecis
ion
mak
ing
3.3.1. Company
In this paper the factors that are related to the bidding company and its resources are grouped under
the company category. First the factor that measures the need for work is discussed after which the
factors describing the company strengths are explained.

12
3.3.1.1. Availability of free manufacturing capacity
Different studies have emphasized the importance of need for work in bid/no bid decision making
and measured it with different factors. Egemen and Mohamed (2007) found out that one of the most
important sub goals for a bid/no bid decision process involved the factor need for work. Ahmad
(1990) found out that the factor current work load is important for the bid/no bid decision making
and Wanous et al. (2000) shared this view while they treated the factor current workload as a
negative factor as a high score for this factor would encourage companies not to bid. If the bidding
company is experiencing a period of low workload and has available manufacturing capacity it
would be reasonable to bid the most competitive price to the customer in order to make sure to get
the upcoming order (B. G. Kingsman & de Souza, 1997). This paper follows M. King and Phythian
(1992) and uses the factor availability of manufacturing capacity to measure the importance of need
for work in the bidding company.
When considering different bidding opportunities the company must evaluate its own strengths and
weaknesses related to the opportunities. Companies with broad experience and large resource base
are able to rely on their expertise and resources in their bidding decisions. In the following
paragraphs the importance of the experience of the company, available resources and the level of
incumbency are discussed.
3.3.1.2. Experience of the bidding company
The experience of the company in managing similar projects or producing similar products has been
identified as an important factor in the bid/no bid decision making. Shash (1998) ranked experience
as the fifth important factor and Wanous et al. (2000) concluded that experience is one of the factors
that have moderate or high importance in the bid/no bid decision making. Egemen and Mohamed
(2007) found out that the experience and familiarity of the firm in the specific type of work was the
eight important factor. As the experience factor has been identified to be an important part of the
bid/no bid decision making in previous studies, it has been included into this study as well.
3.3.1.3. Financial resources, internal resources and external partners
Several authors have discussed the importance of the company resources in supporting projects
(Cova et al., 2000; Egemen & Mohamed, 2007; Lowe & Parvar, 2004; Wanous et al., 2000).
Previous studies have concentrated on the financial resources of the bidding company and
especially on the importance of the financial status of the company on the bid/no-bid decision
13
making. In addition, the importance of the company internal resources, such as qualified employees,
plants and equipment, and the importance of the company external resources, such as qualified
subcontractors and material suppliers on the bid/no-bid decision making have been investigated.
Egemen and Mohamed (2007) included all the factors relating to financial, internal and external
resources into their final bid/no bid decision model as the overall importance weights of the factors
were relatively high.
3.3.1.4. Incumbency of the bidding company
A supplier can have an incumbent position in the established market but when entering new market
areas the supplier faces the threat of competitors or is at the same starting line with smaller
suppliers. However, an incumbent supplier company is able to rely on its previous investments,
technological capabilities and especially on its complementary assets to survive in the new market
(A. A. King & Tucci, 2002; Teece, 1986; Tripsas, 1997). Furthermore, Rubel (2013) found out that
incumbent companies should keep their pricing strategies constant, even though their pricing might
influence the behaviors of the competitors, as with constant pricing strategies companies are able to
capture higher margins. Constant pricing generates early cash-flows over future ones which is
preferable under the uncertainty of random competitive market entries (Rubel, 2013). Keeping the
pricing constant can influence the bid/no bid decision making of an incumbent company. As
constant pricing can increase the margins it is more lucrative for the company to bid in the first
place.
3.3.2. Product
The factors that are related to the requested product offer or project are grouped into the product
category. With a novel product or application the supplier might be able to use higher pricing when
determining the value of the product to the customer. This might give an advantage for the bidding
company and increase the interest in bidding. In addition to this the specific customer requirements
can set boundaries on what companies can bid if the requested products are not standard items but
customized. The compatibility of the offered products can also have an effect on the bid/no bid
decision making. These three factors are further discussed in the following paragraphs.
3.3.2.1. Novelty of the products
Pricing of a novel product is challenging as the possible market might be ill-defined, future
applications unforeseen and competitors´ capabilities unpredictable. Short product life cycles and

14
high market failure rate of new products make the pricing even more difficult as the manufacturer
might have to consider wide margins of error in the forecasts of demand (J. Dean, 1969). Pricing
decisions concerning new products can have a static perspective by setting prices at high-, medium-
or low level when entering the market. Decisions can also be based on dynamic perspective with
skimming and penetration strategies (Rao, 1984). All these decisions and practices are dependent on
the product´s life-cycle stage (Wasson, 1976). Bijmolt, Van Heerde, and Pieters (2005) found out
that price elasticities are stronger in the product´s introduction stage than in the mature stage, thus
affecting the pricing. B. G. Kingsman and de Souza (1997) found out in their research through
interviews with company cost estimators that the product life cycle was one of the factors that
affected the initial evaluation and the bid/no bid decision making. The decisions involved
considering higher price level for the product that is technically more advanced than those normally
produced in order to cover risk of adverse cost variations and time delays during manufacturing due
of the complexity of the product. The requested product can be so novel that the company is not
sure if it is capable of supplying the product in the needed timeframe. Or the manufacturing
expenses of the novel product are not clear or much higher than the product from the previous
product generation. Therefore the degree of novelty of the requested products can be an important
factor in the bid/no bid decision making.
3.3.2.2. Rigidity of the customer product specifications
Kelly and Coaker (1976) cites the most frequent reason that did not allow the buying organization
to accept the lowest bid in the competition as a situation where the offer by the supplier did not
meet the customer specifications. Fulfilling the customer requirements in product specifications is
also essential in the telecommunication industry as customers have different operational and
performance requirements that need to be taken into account. Wanous et al. (2000) found out that
the factor rigidity of specifications has a moderate to high importance in the bid/no bid decision
making and Shash (1998) ranked the factor clearness of work´s specifications in the third position
among 16 different factors. Based on these previous studies it can be argued that the product
specifications are important in the initial bid/no bid decision making.
3.3.2.3. Compatibility
The importance of interchangeability with or duplication of existing equipment by the customer
should not be undervalued in the bidding process (Kelly & Coaker, 1976). If systems are
compatible and several suppliers offer compatible products for customers, the competition moves to

15
emphasize costs and specific performance characteristics of the components (Katz & Shapiro,
1994). Katz and Shapiro (1994) found out that compatibility decreases competition in the early
phases of the product life-cycle, but increases it in the later phases as the compatibility prevents one
company to have the control of the market. In some bids the compatibility can be an advantage as
the bidding company is able to provide similar products as the competitors and compete more with
the pricing than product performance characteristics. On the other hand, offering non compatible
products can be a way to highlight the performance and value of the offered product even though
there is a risk that the customer might turn to the competitor´s product offering. Therefore the
compatibility of the offered products can be an important factor already in the bid/no bid decision
making.
3.3.3. Market
The factors that are related to the competitive environment are discussed in the following
paragraphs. First the factors that relate to the competition are explained followed by factors that
have in the previous studies been identified to have a strategic importance in the bid/no bid decision
making.
Companies follow competitors in order to understand how much competitors charge for their
equivalent products and services (Abratt & Pitt, 1985). Combining this information to the market
position information, companies have the possibility to assess their own position in the market
(Ingenbleek, Debruyne, Frambach, & Verhallen, 2003). According to Paranka (1971) the
investigation of expected competition is crucial for an effective pre-bid analysis. Several authors
have identified different factors that measure the importance of competition in the bid/no bid
decision making in different industries. The number of competitors, the market area and the market
share of the bidding company can influence the decision making. These factors are discussed in the
following paragraphs.
3.3.3.1. Competition in the market
The number of competitors in a certain market can have an effect on the level of competition. If the
incumbent supplier is competing on a market with few other smaller suppliers the price levels might
be close to each other while comparing to competition in a market where several major competitors
are trying to achieve market leadership. Paranka (1971) points out that knowing the expected
competition is crucial for the pre-bid analysis to be effective as for example previous competitive

16
bids will lure competition to supply similar products to the customers. Wanous et al. (2000) and
Egemen and Mohamed (2007) investigated the importance of the number of competitors in the
market for the bid/no bid decision making. Both studies concluded that the number of competitors
does not have high importance in the bid/no bid decision making in construction business.
However, Ahmad (1990), M. King and Phythian (1992), B. G. Kingsman and de Souza (1997) and
Paranka (1971) consider the number of competitors and degree of competition as important part of
their decision making models. As the manufacturer operates in a competitive environment and is
currently facing competition from large Asian manufacturers, the number of competitors is rising in
each market and influencing the strategic decision making and pricing of the manufacturer.
Therefore it can be argued that the number of competitors is an important already in the bid/no bid
decision making.
3.3.3.2. Market area
Egemen and Mohamed (2007) theorized that the location of the request would contribute to the
profitability of the request but did not find scientific support for their assumption. Ahmad (1990)
however found out that the location is important for the bid/no bid decision making. In this study
the focus is on the EMEA region that contains several market areas that differ from each other.
Therefore it would be reasonable to argue that also the market area, or more specifically the
country, would have importance in the bid/no bid decision making.
3.3.3.3. Market share
Egemen and Mohamed (2007) did not find market share to be among the important factors that
influence the bid/no bid decision making. However, Lin and Chen (2004) considered market
position as an important part of their bid/no bid decision model. As the focus of this paper is in the
EMEA region which contains several different markets, the market share of the company in
different areas places the company into different positions. Therefore the importance of the market
share in a particular market for the bid/no bide decision making is of great interest.
Strategic considerations regarding the market situation concentrate on the opportunity under
analysis and possible other opportunities available in the market. The operating company has to
make strategic decisions between the opportunities and realize which of them would be the most
beneficial for the company itself. In the following paragraphs the factors total value of the bid and
the availability of other projects in the market are discussed.

17
3.3.3.4. Total value of the bid
The total value of the request can have an effect on the bid/no bid decision making. When a
customer submits a request for quotation (RFQ) for products based on certain levels of quantities
and conditions the new request will be considered and evaluated. If the production capacity of the
bidding company is full, the customer has no strategic importance for the manufacturing company
and the quantities in the customer request are small, the supplier company might decide not to bid
on the request. If the customer submits an updated RFQ with new set of conditions or raises the
existing order quantities in the request, a new evaluation could be needed. If the updated RFQ
contains new products, or both, new quantities and new products, the total revenue of the
opportunity increases and request might become more interesting for the bidding company to bid
for. Therefore, the total value of the request can have an effect on the bid/no bid decision making of
the supplier company.
According to study results from Wanous et al. (2000) the size of the opportunity is the fourth
important factor to have moderate to high importance in the bid/no bid decision making. Egemen
and Mohamed (2007) found out that the size of the opportunity is the most important factor in
bid/no bid decision making. These results indicate that the total value of the bid can have great
importance in the decision making process.
3.3.3.5. Availability of other projects in the market
Wanous et al. (2000) and Egemen and Mohamed (2007) investigated the importance of other
profitable projects within the market for the bid/no bid decision making but did not find significant
results. However, it seems reasonable to assume that if there are several other requests or projects
available, the bidding company can choose the ones that would be most profitable for the company
and decide not to bid on requests that would not benefit the company. Paranka (1971) states that by
winning a contract the company can create awareness of the company products among other
potential users and that way acquire new opportunities. B. G. Kingsman and de Souza (1997)
consider in their model the opportunity to acquire new users for a recently developed technology as
a factor influencing the bid/no bid decision making. Therefore the availability of other requests or
projects in the market can be important in the bid/no bid decision making.

18
3.3.4. Customer
Many of the previous research papers that have focused on large projects have emphasized factors
that express the financial capabilities of the customers. Financial resources and prompt payment
habits of the customers are important for every industry to operate, but when the customer requests
are smaller than for example large construction projects, other factors become as important. In the
following paragraphs factors relating to customer characteristics and customer relationship are
discussed.
Customers can be divided into different categories by the supplier in order to distinguish them from
each other and serve them the best possible way. In the following the customer price sensitivity and
customer´s sourcing strategy are discussed as a basis for the supplier company to decide whose
requests the company should pay more attention to.
3.3.4.1. Customer price sensitivity
Price sensitivity is “the relative consciousness of customers regarding price levels when making
purchase decisions” (Morris & Joyce, 1988). The price sensitivity is related to the elasticity of
demand as it reflects customers´ price behavior by measuring the percentage change in item´s unit
sales generated by one percent change in its price (Morris & Joyce, 1988). Previous research has
concentrated on several factors that determine elasticity of demand. The elasticity differs over
product´s life cycle and product categories (Bijmolt et al., 2005; Tellis, 1988) and between different
countries (Tellis, 1988). Demand will be more inelastic for products which have unique attributes,
have few substitutes on the market, are difficult to compare with competitors products, have high
switching costs and rely on price to express a high quality image (Morris & Joyce, 1988). The
requests that come from customers that are known by the supplier company and that have
previously shown how they value the products and services provided, without paying too much
attention to the pricing issues, are most likely to be bid by the supplier company. Therefore it can be
hypothized that the price sensitivity of the customer will be important in the bid/no bid decision
making.
3.3.4.2. Sourcing strategy
Customers might re-organize their sourcing strategies and make changes into their existing
relationships which results in a higher competition inside an industry. Intensified industry
competition moves pricing in the direction of costs while the demand is gradually more saturated.

19
Reasons for customers to reorganize their sourcing strategy are many fold. The customer can
concentrate on the items that have the most significant impact on the total cost of goods sold and
this way retain the control over the most strategic components. The customer might follow the
innovation potential of the suppliers and reorganize the suppliers according to their future
relationship importance. Other reasons for the reorganization of the supplier base can be
environmental and employment issues as well as how well the existing suppliers are able to provide
information in shifts in the economy (Choi & Linton, 2011). Depending on the needs of the
customers these issues can bring new opportunities for the suppliers or tighten the existing
competition. Customer can evaluate its vendors and make a difference between good and marginal
suppliers by analyzing the suppliers with a rating system (Kortge & Okonkwo, 1993). If the bidding
company is aware of the analysis systems and the criteria used by the customer it is possible for the
supplier to evaluate its own position and the customer-supplier relationship from the buyer´s
perspective and advance on the rating list. The customer might inform the suppliers of the
upcoming re-organizations and that way increase the interest of the suppliers to bid for the request
in order to acquire a certain share of the supply. Therefore the sourcing strategy of the customer can
have high importance in the bid/no bid decision making of the supplier company.
3.3.4.3. Current relationship
The importance of close, collaborative, reciprocal and trusting relationships where both parties have
the opportunity to benefit from the relationship have become the focus of customer relationship
management. For example, the lean approach supports the idea of reducing the number of suppliers
and concentrating more on partnerships with long-term perspective (Cox, 1999; Monczka, 2009). A
Buy-Sell Hierarchy model by Miller (2006) explains how competition, pricing and product features
have an effect on the customer-supplier relationship and expectations about it. The Buy-Sell
Hierarchy model considers how the customer perceives the supplier. The sales team and the
management of the supplier organization need to evaluate the relationship from the customer
perspective. Evaluating the relationship on a five level continuum (Figure 4) from being a
commodity provider (Level 1) to a strategic partner (Level 5), the supplier is able to consider
customers not just by the size of the customer, but by the value of the relationship to the customer.
Furthermore, as the price sensitivity of the customer correlates with the relationships status, the
supplier is able to strategically consider proper pricing practice for each customer relationship
(Smith, 2012).

20
Figure 4: Buy-Sell Hierarchy derived from Miller
Source: Miller (2006)
Lowe and Parvar (2004) considered the current relationship with the customer as an important part
of their conceptual decision to bid model while Wanous et al. (2000) considered the relations with
the customer as a third important factor to affect bid/no bid decision making. The current
relationship with the customer, whether the relationship is a partnership, historical collaboration or
new relationship, can influence the bid/no bid decision making of the supplier company as the more
established the relationship is the more important it becomes to the bidding company.
3.3.4.4. Future business possibilities with the customer
Several research papers emphasize the potential to have future business transactions with the
customer after bidding for the first opportunity (Cova et al., 2000; M. King & Phythian, 1992; B. G.
Kingsman & de Souza, 1997; Phythian & King, 1992; Shash, 1998). Egemen and Mohamed (2007)
included the factor relating to upcoming profitable projects with the client into their model for
bid/no bid decision making and concluded that larger-size contractors take strategic issues into
consideration already in the bidding decision process. Paranka (1971) argues that after winning a
bid the company will most likely receive repeat orders from the customer. In the case of small
urgent request the customer will most likely contact a reliable supplier that have previously
provided excellent performance and also include the supplier into future tender requests because of

21
the previous experience with the supplier. Based on this it can be argued that the future business
possibilities with the customer can have an importance in the bid/no bid decision making.
This research paper builds on the previous literature and proposes that each of the factors that have
been identified to influence the bid/no bid decision making in construction and electro-mechanical
industries, also influences the bid/no bid decision making of a telecommunication system solution
manufacturer in telecommunication industry. Furthermore, as each of the factors have been
identified to be related to the bid/no bid decision making, this study elaborates on this and
hypothesizes that there is a relationship between each of the factors and the success of a bid. This
hypothesis is illustrated in Figure 5.
Figure 5: Variables influencing the success of a bid in telecommunication industry
Success of a bid
Availability of free
manufacturing capacity
Experience
Financial resources
Internal resources
Partners
Incumbency
Novelty of the products
Rigidity of customer
specifications
Compatibility
Competition in the market
Market area
Market share
Total value of the bid
Availability of other
projects in the market
Price sensitivity
Sourcing strategy
Current relationship
Future business possibilities
with the customer

22
4. Research methodology
In this chapter the research methodology of this paper is explained. First, the sampling of
respondents is discussed followed by the data collection methods. The final part of this chapter
concentrates on the data analysis procedures used in this research.
4.1. Sampling
The interest of this study is to examine the factors influencing the success of bids in manufacturing
companies of the telecommunication industry. This research concentrates on one
telecommunication system solution manufacturing company and its customer enquiry assessment
process in the EMEA region (Europe, The Middle East and Africa) within the telecom sales
business. In collaboration with this manufacturer, this research paper examines the factors that
should be taken into account when making bid/no bid decisions.
To answer the research questions this study has two different approaches. First, this study examined
the factors that influence the bid/no bid decision making in telecommunication industry by
indentifying the critical factors through literature research. Second, this study examined which of
the factors described earlier influence the success of bids. To answer the research question,
altogether 115 employees of a manufacturing company from different departments (sales,
marketing, quotations, commercial operations, business operations, and product line management)
were contacted and requested to fill in a questionnaire. These employees had been identified
according to their position and responsibilities in the company to be involved in the bidding
processes and therefore have the required information to complete the questionnaire. The
respondents were responsible of the market areas, customer relationships, offered product lines,
commercial operations and the actual bid and quotation processes of each individual bid and
therefore these respondents had more specific information of the particular market situations,
products and customer relationships in each case.

23
4.2. Data collection
This research takes a historical look and examines how the factors indentified in previous studies
influence the success of the bids placed earlier by the manufacturer. The research question of this
study concentrates on examining which factors influence the success of bids and therefore to
measure the influence of the factors on the success of the bids a questionnaire was used. A copy of
this questionnaire can be found from the Appendix (10.1. Appendix: Questionnaire). The
respondents were requested to consider one successful and one unsuccessful bid that they were
familiar with and name those bids in the beginning of the questionnaire. After this the respondents
were requested to rate the factors separately on both bids. In the questionnaire the respondents were
presented 18 statements that described the factors indentified from the literature. The respondents
were requested to indicate to what extent he or she agrees with the statement when considering the
successful bid and the unsuccessful bid. The closed-ended statements were presented in matrix
question formats that have the same response categories. The respondent were able to choose an
option from a five point response category; “Strongly Disagree”, “Disagree”, “Neither Agree nor
Disagree”, “Agree” and “Strongly Agree” (Babbie, 2010).
For example, in the case of the competition in the market, it can be assumed that the more
competitors are in the market, the higher is the competition. Higher number of competitors
increases the number of offers of similar products to the customer and thus tightens the competition
(Paranka, 1971). Regarding the factor “competition in the market” the respondents were requested
to express to what extent they agreed with the statement “The competition in the market concerning
the bid was fierce at the time of making the bid” when they considered the successful bid and
unsuccessful bid separately. This generated information of the actual bidding situation and the
market where the bid was made. This information was used for further analysis.
To exclude the effect of other variables on the relationship between the factors and the success of
the bids some additional information was collected in the questionnaire. These control variables
were the current department of the respondent in the manufacturing company, the current position
in the organization and the years of employment the manufacturing company. The departments in
the company were sales, marketing, business operations, quotations, pricing office and product line
management. The respondents worked in the following positions in the organization: vice president,
director, manager, specialist and coordinator. The years of employment in the company were

24
divided between 1-5 year, 6-10 years, 11-15 years, 16-20 years, 21-25 years, 26-30 years and above
30 years. The respondents were requested to indicate their department, position and years of
employment in the end of the questionnaire according to the above mentioned options.
An online survey portal was used to build the questionnaire, collect the responses and generate raw
data for further analysis. Before sending the questionnaire website link to the respondents, the
questionnaire was pretested by two persons outside the manufacturing company and by one person
in management position in the manufacturing company. The aim was to test if the questionnaire in
general and the statements in particular were understandable and possible to answer (Babbie, 2010).
This pretesting provided valuable feedback concerning the length of the entire questionnaire, the
wording of the statements and the selection of answer options. All received feedback was
considered and incorporated into the questionnaire in order to avoid ambiguous statements.
Reliability of the data refers to the extent to which the data collection techniques or analysis
procedures will yield consistent findings. In this study the observer error was minimized as the data
was collected with a questionnaire. Observer bias that refers to different ways of interpreting the
replies was also low as the scale for responses was fixed and the data was analyzed with a statistical
program. Participant error, which refers to a situation where a questionnaire that is completed by
respondents at different times of the week yields different results, and participant bias, which refers
to respondents answering what respondents thought their bosses wanted them to say, are threats to
reliability as well (Saunders, 2009). To minimize the participant error, the questionnaire was
available for the respondents for 14 days so that majority of the respondents would have had the
possibility to answer the questionnaire and share their knowledge. The possible participant bias was
minimized by informing the respondents that the questionnaire is entirely anonymous so that the
answers could not be linked to any individual respondent.
4.3. Data analysis
After the data collection a general analysis of the gathered data was conducted. First the data set
was checked for possible errors, missing values and outliers. Second, the response rates were
calculated and the characteristics of the respondents were analyzed. Third, correlation coefficients
were calculated. Fourth, contingency tables of the different variables indentified from the literature
concerning successful and unsuccessful bids were formulated and analyzed. This was followed by

25
two-sample t-test for the difference between two means. Before further analyses, a factor analysis
was done to check how the variables load on different factors.
Fifth, logistic regression analyses were conducted in order to find out which variables contribute to
the probability of a bid to be successful. Logistic regression is used to describe data and to explain
the relationship between one dependent variable and one or more independent variables. As logistic
regression does not assume a linear relationship between the dependent and independent variable it
is suitable for a dependent variable with two categories (Burns, 2009). The dependent variable in
this study is dichotomous variable having two values, successful or unsuccessful bid, so it is
possible to use logistic regression to make further analysis (De Veaux, 2008). Logistic regression
has become an important modeling tool in science, economics and industry as many response
variables are dichotomous and researchers are interested to model data like these (Davis, 1997; De
Veaux, 2008). This supports the usage of logistic regression approach in this study as well.
In logistic regression analysis the independent variables do not need to be interval, normally
distributed, linearly related or of equal variance within each group. However, a case can only be in
one category, in this study either successful or unsuccessful, and every case must be a member of
one of the groups. In logistic regression a minimum of 50 cases per predictor is recommended
because maximum likelihood coefficients are large sample estimates (Burns, 2009).
Logistic regression assumes that P(Y=1) is the probability of the event occurring and therefore the
dependent variable must be coded accordingly. The desired outcome of the dependent variable,
which in this study is a successful bid, is coded as “1”. Unsuccessful bid is therefore coded as “0”
(Davis, 1997). As the bid can only be either successful or unsuccessful, logistic regression thinks in
likelihood of the bid being successful. If the likelihood of the bid being successful is greater than
0.5 it is assumed to be successful, if it is less than 0.5 the bid is assumed to be unsuccessful (Burns,
2009).
Instead of adding all independent variables into the model at once, in the first analysis the variables
that load on the same factors are added into the analysis separately as combined factors. In the
second logistic regression analysis groups of variables are added into the analysis in order to
investigate if the model is better when a group of variables is included or left out of the model. This
hierarchical entry of variable groups is based on the above mentioned factor analysis. The variable

26
groups form sets of variables that load on the same factor. First the constant model is calculated,
after which the variable groups are added in to the model one by one. In the final model all
variables are included in the model. In the following chapter the results of these analyses are
explained in more detail.
5. Results
In this chapter the results of the data analysis are presented. First the overall response rates and
characteristics of the respondents are summarized. After this the answers of respondents for each
individual variable for successful and unsuccessful bids are considered and the results of an
independent two-sample t-test for the difference between two means are analysed. The t-tests were
conducted to see if there is a statistically significant difference between the means of successful and
unsuccessful bids when considering the different variables indentified from the literature.
After analysing the answers for each variable and the t-test results for the difference between two
means, the results chapter continues with the logistic regression analyses. The results are
summarised from a step by step procedure where the independent variables from different groups
indentified with factor analysis were added into the regression analysis.
5.1. Response rate and characteristics of the respondents
The initial request to participate in the research was sent to 115 respondents by using personalized
emails (10.2. Appendix: Personalized email invitation to participate in the research). After 5 days a
reminder was sent to the respondents (10.3. Appendix: Reminder to participate in the research).
Overall 72 employees out of 115 responded to the questionnaire generating an overall response rate
of 62.6%. From these 72 responses 56 contained sufficient data that could be used for further
analysis resulting in a response rate of 48.7%. As each of the 56 respondents considered one
successful and one unsuccessful bid the result was 112 different bids with analyzable data.
16 out of the 72 respondents indicated in the beginning of the questionnaire that they are not able to
name one successful and one unsuccessful bid which they could think while considering the

27
statements presented in the questionnaire. Therefore these 16 responses did not contain any data
that could have been used in the analysis.
Table 2 summarizes the characteristics of the 56 respondents that provided data for further analysis,
compared with the characteristics of the 72 respondents who replied to the questionnaire. Almost 34
percent of the respondents were from the Sales department and 30 percent were from the Product
Line Management department. Sales people are involved in the bidding processes from the
beginning to the end as they usually receive the initial request from the customers and are also
involved in the final submission of the offer to the end customer. As Product Line Managers are
responsible of the particular product lines they are also involved from the beginning when
confirmations are needed on particular production dates or quantities, or when modified solutions
are needed. Therefore these two departments have more employees than other smaller departments
which explain the higher participation from these functions. The function “Other” that was the third
biggest group of respondents, constituting 16% percent, included employees from Application
Engineering, Strategy, Customer Experience, Commercial and Market Development departments.
51.8 percent of the respondents were Manager level employees and 62.5 percent of the respondents
had worked for the manufacturing company 1 to 10 years.

28
Table 2: Characteristics of the respondents
Function Frequency Percentage Frequency Percentage
Sales 19 33,9% 25 34,7%
Marketing 6 10,7% 6 8,3%
Product Line Management 17 30,4% 23 31,9%
Quotations 1 1,8% 1 1,4%
Business Operations 3 5,3% 3 4,2%
Pricing Office 1 1,8% 2 2,8%
Other 9 16,1% 12 16,7%
56 100% 72 100%
Position Frequency Percentage Frequency Percentage
Vice President 3 5,4% 4 5,6%
Director 10 17,8% 13 18,1%
Manager 29 51,8% 38 52,8%
Specialist 10 17,8% 11 15,3%
Coordinator 1 1,8% 1 1,4%
Other 3 5,4% 5 6,9%
56 100% 72 100%
Years of Employment Frequency Percentage Frequency Percentage
1-5 years 21 37,5% 24 33,3%
6-10 years 14 25,0% 15 20,8%
11-15 years 5 8,9% 9 12,5%
16-20 years 8 14,3% 10 13,9%
21-25 years 7 12,5% 10 13,9%
26-30 years 0 0,0% 1 1,4%
31 years and more 0 0,0% 0 0,0%
Blank 1 1,8% 3 4,2%
56 100% 72 100%
56 respondents with data All 72 respondents
5.2. Correlations, response summaries and t-tests for the difference between two means
In Table 3 the correlation coefficients of the factors identified from the literature are shown.
Majority of the correlations are weak and close to 0 which indicates the absence of linear
relationship. However, incumbency has positive linear relationships with several factors of which

29
the strongest positive statistically significant relationship is with market share (r = .504, p < .01).
This confirms that there is a relationship between being an incumbent supplier on a market and
market share in a particular market. Financial resources and internal resources have a moderate,
positive and statistically significant relationship (r = .455, p < .01) as well as financial resources and
partners (r = .343, p < .01), and internal resources and partners (r = .482, p < .01). This shows that
different company resources that are needed for manufacturing correlate with each other.

30
Table 3: Pearson correlation coefficients of the factors identified from the literature
1 2 3 4 5 6 7 8 9 10 11 12 13 14 15 16 17 18
1. Free manufacturing capacity - .067 .030 .090 .129 .193* -.001 .002 -.020 -.013 .104 .324** .072 .171 .130 -.072 -.091 -.035
2. Experience - .268** .247* .190* .190* -.018 .077 .403** -.124 .006 .268** .053 .213* -.022 -.041 .195* .049
3. Financial resources - .455** .343** .286** .086 .079 .290** -.087 -.063 .244* .072 -.035 -.103 -.061 .011 .083
4. Internal resources - .482** .316** .019 .050 .440* .044 .143 .173 -.001 -.048 -.072 -.098 -.043 .087
5. Partners - .276** .268** .090 .306** -.064 .039 .274** .003 .009 -.047 -.164 .038 .256**
6. Incumbency - .055 -.006 .423** -.020 .066 .504** .083 -.171 -.052 -.119 .258** .175
7. Degree of novelty - .452** .185 -.122 .155 .265** .025 .166 -.032 .079 .022 .117
8. Rigidity - .141 .064 .328** .338** .032 .056 .079 .069 .012 -.047
9. Compatibility - -.013 .000 .324** .039 -.044 .005 -.120 .163 .215*
10. Competition - .128 .076 .120 -.114 .159 .176 .024 .138
11. Market area - .151 .083 .093 .199* .119 .147 .151
12. Market share - .175 .123 .029 .077 .237* .219*
13. Total value - .172 .039 .093 .104 .174
14. Other projects - .090 .052 .013 .104
15. Price sensitivity - .198* -.077 .043
16. Sourcing strategy - .016 .039
17. Relationship - .409**
18. Future projects -
**. Correlation is significant at the 0.01
level (2-tailed)
*. Correlation is significant at the 0.05
level (2-tailed)

31
The division of answers of the respondents for each independent variable were calculated and
analysed separately for successful and unsuccessful bids by creating contingency tables and boxplot
figures. The percentages of answers for each answer option were compared between successful and
unsuccessful bids to investigate if there is a difference between the answers or if the answers reflect
a value that should be given a special attention to.
After this a two-sample t-test for the difference between two means was conducted. This was
carried out to investigate if there is a statistically significant difference between the mean values of
successful and unsuccessful bids. First, Levene´s test was checked to see if equal variance is
assumed or not. Second, the t-value and its level of significance were observed. Third, based on the
significance of the t-value it was concluded that there was, or there was not, a statistically
significant difference between the mean values of successful and unsuccessful bids when
considering the independent variable in question. In table 4 the mean values of the successful and
unsuccessful bids, differences in the mean values, the t-values and their significance levels are
summarised. In the following paragraphs the main findings from the contingency tables and t-tests
are shortly presented.
The answers for the independent variable free manufacturing capacity indicated that for the
majority of the bids there were free manufacturing capacity available in the manufacturer´s plants.
The t-value was not significant which showed that there was no statistically significant difference
between the means of successful and unsuccessful bids when considering the availability of free
manufacturing capacity at the manufacturer´s plants.
The independent variable experience refers to knowledge and skills gained from previous bids that
helped to win the bid in question. In 80.4 percent of the successful bids and 64.8 percent of the
unsuccessful bids the experience was available (combined responses for Agree and Strongly Agree
answers). In the two-sample t-test the t-value of 2.562 was significant (p = 0.012). According to the
answers the bids for which the manufacturer was able to use previously gained experience for were
more often successful in the end.
When considering the independent variable financial resources 69.1 percent of the successful bids
and 69.8 percent of the unsuccessful bids had the necessary financial resources available (Agree and
Strongly Agree answers combined). Furthermore, in the two-sample t-test the t-value of 0.602 was

32
not significant. These results indicate that for the majority of both successful and unsuccessful bids
there were the necessary financial resources available to win the bid.
The independent variable internal resources refer to qualified employees, plants and equipment that
are available to win a bid. For 89.1 percent of the successful bids and for 69.3 percent of the
unsuccessful bids there were the necessary internal resources available (Agree and Strongly Agree
answers combined). Moreover, the t-test for the difference between the two means had a t-value of
2.842 which was significant (p = 0.006) and thus indicating a statistically significant difference
between the means. These results imply that for successful bids the internal resources were
available more often than for the unsuccessful bids.
For 65.4 percent of the successful bids and for 33.9 unsuccessful bids there were the necessary
partners, such as qualified subcontractors and material suppliers, available to win the bid (Agree
and Strongly Agree answers combined). In the two-sample t-test the t-value of 3.078 was significant
(p = 0.003) which means that there was a statistically significant difference in the means of
successful and unsuccessful bids when considering the existence of necessary external partners.
These results indicate that in majority of the successful bids the relationships with the qualified
subcontractors and material suppliers were already established when making the bid, while for
unsuccessful bids this was not the case.
For 68.5 percent of the successful bids and 48.1 percent of the unsuccessful bids the manufacturer
had an established position in the industry that made it possible to win the bid (Agree and Strongly
Agree answers combined). In the two-sample t-test the t-value of 2.902 was significant (p = 0.005)
showing that there was a statistically significant difference between the means of successful and
unsuccessful bids when considering the manufacturer´s established position in the industry. This
indicates that in areas where the manufacturer had an established position in the industry, the bids
were more often successful.
45.5 percent of the successful bids and 46.3 percent of the unsuccessful bids contained products
with high degree of novelty (Agree and Strongly Agree answers combined). 34.5 percent of the
successful bids and 35.2 percent of the unsuccessful bids did not contain products with high degree
of novelty (Disagree and Strongly Disagree answers combined). The t-value of 0.235 was not
significant which means that there was no statistically significant difference between the means of

33
successful and unsuccessful bids when considering the degree of novelty of the products offered in
the bids.
54.6 percent of the successful bids and 53.7 percent of the unsuccessful bids were based on rigid
customer specifications (Agree and Strongly Agree answers combined). The two-sample t-test with
t-value of 0.228 which was not significant shows that there was no statistically significant
difference between the means of successful and unsuccessful bids when considering the rigidity of
customer specifications. This indicates that the rigidity of customer specifications does not differ
between successful and unsuccessful bids.
90.9 percent of the successful bids and 51.9 percent of the unsuccessful bids contained products that
were compatible with the customer specifications (Agree and Strongly Agree answers combined).
In the two-sample t-test the t-value of 5.219 was significant (p < 0.001). It can be concluded that
there was a statistically significant difference in the means of successful and unsuccessful bids
when considering the compatibility of the offered products. The products offered by the
manufacturer to the customer were compatible with the customer specifications more often in
successful bids than in the unsuccessful bids.
81.5 percent of the successful bids and 92.4 percent of the unsuccessful bids were made for a
market where the competition was fierce at the time of making the bid (Agree and Strongly Agree
answers combined). In the two-sample t-test the t-value of -1.240 was not significant and therefore
it can be concluded that there was no statistically significant difference between the means of
successful and unsuccessful bids when considering the competition in the market.
60 percent of the successful bids and 52.8 percent of the unsuccessful bids were made for a
customer market area that had regulatory and other special requirements in place (Agree and
Strongly Agree answers combined). In the two-sample t-test the t-value of -0.077 was not
significant. There was no statistically significant difference between the means of successful and
unsuccessful bids when considering the regulatory and other special requirements in the market area
where the bid was made.
42.6 percent of the successful bids and 17.3 percent of the unsuccessful bids were made for a
customer market where the manufacturer had one of the largest market shares in the region

34
concerning the bid (Agree and Strongly Agree answers combined). 35.2 percent of the successful
bids and 65.4 percent of the unsuccessful bids were made for a market where the manufacturer did
not have one of the largest market shares in the region (Disagree and Strongly Disagree answers
combined). In the two-sample t-test the t-value of 3.182 was significant (p = 0.002) which means
that there was a statistically significant difference between the means of successful and
unsuccessful bids when considering the market share of the manufacturer in the region of the bid.
Bids were more often unsuccessful in regions where the manufacturer did not have one of the
largest market shares.
69.1 percent of the successful bids and 64.1 percent of the unsuccessful bids had a high total Euro
value (Agree and Strongly Agree answers combined). In the two-sample t-test the t-value of 0.625
was not significant which means that there was no statistically significant difference in the means of
successful and unsuccessful bids when considering the total Euro value of the bid offered by the
manufacturer.
50.9 percent of the successful bids and 43.4 percent of the unsuccessful bids were made for a region
where there was not high number of other projects available at the time of making the bid (Disagree
and Strongly Disagree answers combined). Furthermore, in the two-sample t-test the t-value of -
1.084 was not significant.
81.9 percent of the successful bids and 81.1 percent of the unsuccessful bids were made for
customers that were highly sensitive to price (Agree and Strongly Agree answers combined). The t-
value of -0.587 was not significant which indicates that customers are overall highly price sensitive
and no significant division can be made between successful and unsuccessful bids.
69.1 percent of the successful bids and 64.1 percent of the unsuccessful bids were made for
customers whose strategy was to limit the number of suppliers (Agree and Strongly Agree answers
combined). The t-value of 0.746 was not significant. The percentages and mean values indicate that
in majority of the successful and unsuccessful bids the customers´ strategy was to limit the number
of suppliers.
70.9 percent of the successful bids and 50.9 percent of the unsuccessful bids were made for
customers that the manufacturer had an established relationship with (Agree and Strongly Agree

35
answers combined). In the two-sample t-test the t-value of 3.144 was significant (p = 0.002). To
conclude, there was a statistically significant difference between the means of successful and
unsuccessful bids when considering the relationship with the customer. Moreover, successful bids
were more often related to established relationships with the customers.
In 87.1 percent of the successful bids and 54.7 percent of the unsuccessful bids the manufacturer
expected the customer to request more bids in the future (Agree and Strongly Agree answers
combined). In the two-sample t-test the t-value of 4.389 was significant (p < 0.001). As a
conclusion, there was a statistically significant difference between the means of successful and
unsuccessful bids when considering the expectations of the manufacturer that the customer will
request more future bids after the current bid.
To summarize, statistically significant differences between the means of successful and
unsuccessful bids were detected for independent variables experience, internal resources, partners,
incumbency, compatibility, market share, relationship and future projects (Table 4).

36
Table 4: The mean answers of respondents for successful and unsuccessful bids, the difference
between the means, t-values and the significance of two-sample t-test
Variable
Mean value of
successful
bids
Mean value of
unsuccessful
bids
Mean
differencet-value
Sig.
(2-tailed)
Free capacity 3.55 3.64 -0.096 -0.555 p = 0.580
Experience 4.09 3.61 0.478 2.562 p = 0.012
Financial resources 3.85 3.75 0.100 0.602 p = 0.548
Internal resources 4.18 3.69 0.490 2.842 p = 0.006
Partners 3.73 3.13 0.595 3.078 p = 0.003
Incumbency 3.93 3.24 0.685 2.902 p = 0.005
Novelty of the products 3.20 3.15 0.052 0.235 p = 0.814
Rigidity of specifications 3.51 3.46 0.046 0.228 p = 0.820
Compatibility 4.25 3.37 0.884 5.219 p < 0.001
Competition 4.07 4.25 -0.171 -1.240 p = 0.218
Market area 3.44 3.45 -0.016 -0.077 p = 0.939
Market share 3.09 2.31 0.785 3.182 p = 0.002
Total value 3.84 3.72 0.119 0.625 p = 0.533
Other projects 2.58 2.79 -0.211 -1.084 p = 0.281
Sensitivity 4.15 4.25 -0.100 -0.587 p = 0.558
Sourcing strategy 3.82 3.66 0.158 0.746 p = 0.457
Relationship 3.95 3.21 0.738 3.144 p = 0.002
Future projects 4.20 3.43 0.770 4.389 p < 0.001
5.3. Factor analysis
To assess the variables based on literature research and to analyse how these variables reflect the
variations in fewer unobserved variables, a factor analysis was conducted. First a factor analysis
that was based on principal component analysis with direct oblimin rotation was conducted. With
eigenvalue greater than 1.0, the variables were free to load on factors. The results showed that the
variables loaded on 7 different factors with cumulative variance explained as 64.54%, but that the
loadings started to level off after the third factor (10.4. Appendix: Factor analysis – Scree plot). In
this analysis a direct oblimin rotation was used which is an oblique rotation method that assumes
that the factors are correlated. If the correlations among the factors exceed .32 there is an overlap in
variance among factors and oblique rotation should be used. In the analysis between the 7 different
factors the correlation matrix for correlations among the factors indicates that the highest

37
correlation is .158 which is below .32. This indicates that orthogonal rotation method could be used
as well (Brown, 2009).
The next factor analysis was a principal component analysis with varimax rotation method which is
an orthogonal rotation method that assumes that the factors are uncorrelated. The variables were
forced to load on three factors and the variables were grouped together according to the factor
loadings which exceeded .5. The variables experience, other projects, price sensitivity, free
manufacturing capacity, sourcing strategy, competition and total value of the bid were excluded
from the analysis as their factor loadings were lower than .5. Table 5 below shows the factor
loadings of the variables for each factor. The Kaiser-Meyer-Olkin value was .626 which is above .6,
and Bartlett´s Test of Sphericity was significant (< .001) indicating that factor analysis can be
continued. The three factors explained 38.388 percentage of the variance.
The first factor contained company and resource related variables and had Cronbach´s alpha of
.748. The second factor contained variables referring to product specifications and had Cronbach´s
alpha of .572 while the third factor contained customer relationship related variables and had
Cronbach´s alpha of .567. Cronbach´s alphas for these groups of variables were higher than when
using the groups of variables identified from the literature (Cronbach´s alpha for the company
related variables was .64, for the product related variables .52, for the market related variables .38
and for the customer related variables .33).
For the dataset to be reliable Cronbach´s alpha should be greater than .7. However, the
questionnaire was fairly short (in order to increase the interest of the respondents to answer the
questionnaire) and the factors identified from the literature were measured with only one statement
each, which can affect the Cronbach´s alpha and result in lower value (Cortina, 1993).
The reasoning for the usage of factor analysis where the variables were forced to load on three
different factors lies in the possibility to form groups of variables with the highest possible
Cronbach´s alpha values. However, this particular analysis has some drawbacks when compared to
other factor analysis options. The total cumulative variance explained by the factors is higher for
factor analyses where the variables are forced to load on four different factors (45.471% of variance
explained cumulatively) or where the variables are free to load on any factors as long as eigenvalue
is 1.0 (64.54% of total variance explained cumulatively). Same applies for the communalities as in

38
the analysis where the variables are forced to load on three different factors the communalities
range from .163 to .608, while in the analysis where factors are forced to load on four different
factors the communalities range from .200 to .703 and in the analysis where the variables are free to
load on any factor (as long as eigenvalue is 1.0) the communalities range from .304 to .812.
The total variance explained and the communalities indicate that in the analysis where the variables
are forced to load on three different factors the common factors explain less of the variance than in
the other analyses. However, as indicated above, in this analysis the internal reliabilities are higher
for the variable groups forming the factors. These three groups of variables that form the three
factors named company and resources, product specifications and customer relationship, are used in
the hierarchical logistic regression analysis that is explained in more detail in the next chapter.
Table 5: Factor analysis
Component
1
Component
2
Component
3
Name of
the factor
Internal resources .690
Partners .676
Financial resources .631
Compatibility .696
Incumbency .647
Market share .533
Rigidity .704
Degree of novelty .609
Market area .527
Relationship .691
Future projects .690
Varimax rotation
Cumulative variance explained: 38.388%
Cronbach´s
alpha
.748Company and
resources
.572Product
specifications
.567Customer
relationship
5.4. Logistic regression analyses
In this chapter the logistic regression analyses are presented. First, a hierarchical logistic regression
analysis is conducted by adding factor 1, factor 2 and factor 3 from the factor analysis as predictors.
After this a second, more detailed hierarchical logistic regression analysis is done by adding all of
the variables identified from the literature as predictors in three different groups.

39
The logistic regression begins with the constant model before any coefficients are entered into the
equation. This constant model will be compared to the other models including the predictors. The
goal is to find out if the model with the predictor groups is more appropriate. The results for the
constant model suggest that if we did not know anything about our variables and only guessed that
the bid would be unsuccessful, we would be correct 50.9 percent of the time. After the constant
model the control variables function, position and years of employment of the respondent are added
into the model. In the next three phases the predictors factor 1, factor 2 and factor 3 are added into
the analysis in separate steps, creating 4 different models.
The overall significance of the model can be described by the model Chi-square (Burns, 2009). The
null hypothesis is that adding new variables to the model has not significantly increased the ability
to predict if a bid is successful or not (Wuensch, 2011). Therefore a significant result is desired in
order to increase the predictive ability of the model. The Chi-square value increases towards the
final fourth model and in the three last models, with factors as predictors, the Chi-square values are
significant. Although there is no close equivalent to the coefficient of determination R² in logistic
regression there are some other statistics that provide information concerning the model. The
smaller the value of the -2 Log Likelihood statistics is, the better the model, as the -2 Log
Likelihood measures how poorly the model predicts (Wuensch, 2011). In this test the -2 Log
Likelihood value decreases towards the final model. The fourth model has the lowest -2 Log
Likelihood value of 109.920 indicating that the final model is the best prediction. Cox and Snell´s
R-Square value demonstrates what percentage of the variation in the dependent variable is
explained by the logistic model. The Cox and Snell´s R-Square value increases towards the final
fourth model in which 30.8 percentage of the variation in the dependent variable is explained by the
logistic model. The Nagelkerke´s R-Square value indicates the strength of the relationship between
the predictors and the prediction. In the fourth model the Nagelkerke´s R-Square value of 0.411
suggest a weak relationship of 41.1 percentages between the predictors and the prediction. In the
final model, overall 74.1 percent of the cases were correctly classified. This shows an improvement
when compared to the previous models with lower overall percentages (Burns, 2009). The factor 1,
named company and resources, contributes significantly to the prediction in three of the models. In
the final fourth model, which has the highest Cox & Snell´s R-Squared and Nagelkerke R-Squared
values and the highest classification accuracy, factor 1 (p < .001) and factor 3 (p < .001) contribute
significantly to the prediction while factor 2 does not.

40
In the final fourth model, the Exp(B) value of 5.390 for the factor 1 (p < .001) suggests that when
company and resource related variables increase with one unit (e.g. a response moving from Agree
to Strongly Agree answer option), the odds ratio is more than 5 times as large and therefore a bid is
5 more times likely to belong to the successful bid group. The Exp(B) value of 3.246 for the factor
3 (p < .001) suggest that when the customer relationship variables increase with one unit, the odds
ratio is more than 3 times as large and the bid is 3 more times likely to belong to the successful bid
group. The test statistics for this logistic regression analysis are summarized in Table 6.
Table 6: Logistic regression analysis results with factors
Variable B SE Exp(B) B SE Exp(B) B SE Exp(B) B SE Exp(B)
Constant .045 1.211 1.046 -5.655 2.016 .003 -5.016 2.113 .007 -7.225 2.433 .001
Function
Sales .018 .627 1.019 .372 .734 1.451 .407 .744 1.502 .281 .787 1.324
Marketing .183 .792 1.201 -.244 .938 .783 -.279 .947 .757 -1.146 1.028 .318
Product Line Mngt -.009 .642 .991 -.127 .749 .881 -.124 .758 .883 -.164 .821 .849
Quotations .045 1.595 1.046 -.301 1.717 .740 -.390 1.716 .677 .723 1.816 2.061
Business Operations .051 1.001 1.053 -1.130 1.121 .323 -1.179 1.140 .308 -1.125 1.261 .325
Pricing Office -.022 1.598 .978 -.873 1.688 .418 -1.006 1.697 .366 -.811 1.835 .444
(base = Other)
Position
Vice President .064 1.436 1.066 .081 1.644 1.084 -.021 1.639 .979 -1.161 2.016 .313
Director .131 1.143 1.140 .086 1.310 1.090 .120 1.309 1.127 -.871 1.648 .418
Manager .034 1.049 1.035 .003 1.210 1.003 .010 1.208 1.010 -.455 1.546 .634
Specialist .010 1.134 1.010 .267 1.290 1.306 .265 1.289 1.304 -.489 1.637 .613
Coordinator -.003 1.755 .997 -1.068 1.862 .344 -.866 1.886 .421 -.101 2.447 .904
(base = Other)
Years of employment -.033 .174 .967 -.019 .198 .982 -.044 .201 .957 -.100 .221 .905
Factor 1 1.603** .391 4.970 1.754** .430 5.777 1.685** .471 5.390
Company and resources
Factor 2 -.338 .302 .713 -.661 .356 .516
Product specifications
Factor 3 1.177** .336 3.246
Customer relationship
-2LL 149.541 126.917 125.632 109.920
x² = .142, df = 12, p = 1.000 x² = 22.766, df = 13, p = .045 x² = 24.051, df = 14, p = .045 x² = 39.763, df = 15, p < .001
Cox & Snell´s R-Squared 0.1% 19.0% 20.0% 30.8%
Nagelkerke R-Squared 0.2% 25.3% 26.6% 41.1%
Hosmer & Lemeshow test p = 1.000 p = .055 p = .369 p = .285
Classification accuracy 50.9% 72.2% 67.6% 74.1%
*p < .05. **p < .01.
Model 3 Model 4
Co
ntr
ol
vari
ab
les
Model 1 Model 2
However, as the factor 1 and the factor 3 contain several variables it is difficult to understand and
explain which aspects of the factors influence the success of bids and to what extent. Therefore in
the following hierarchical logistic regression analysis all the 18 variables identified from the

41
literature are added into the model in three different groups based on the factor loadings in the
factor analysis. Table 7 shows the group division of the variables from the initial factor analysis.
Table 7: Groups of variables from the initial factor analysis
Group 1 Group 2 Group 3
Experience Free manufacturing capacity Competition
Financial resources Degree of novelty Total value
Internal resources Rigidity Relationship
Partners Market area Future projects
Incumbency Other projects
Compatibility Price sensitivity
Market share Sourcing stragegy
The logistic regression analysis begins with the constant model after which the control variables are
added into the model creating the first model (table 8). After this the three groups of variables are
added into the analysis in separate steps, altogether creating four different models. In the first model
none of the control variables contribute significantly to the prediction. In the second model where
group 1 variables are entered into the model, variable compatibility has a significant value (B =
.694, Exp(B) = 2.002, p = .042). In the third model where group 2 variables are entered into the
model, variables compatibility (B = .934, Exp(B) = 2.544, p = .029) and market share (B = .742,
Exp(B) = 2.100, p = .021) contribute significantly to the prediction.
In the fourth and last step the group 3 variables are added into the fourth model. The model chi
square has 30 degrees of freedom, a value of 65.238 and a probability of p < 0.001. We can reject
the null hypothesis and conclude that the predictors have a significant effect and create a different
model. The -2 Log Likelihood value has decreased to 73.392 indicating an improvement in the
model when compared to the previous models. Cox and Snell´s R-Square value is 0.479 indicating
that 47.9 percent of the variation in the dependent variable is explained by the logistic model. The
Nagelkerke´s R-Square value of 0.639 indicates a moderately strong relationship of 63.9 percent
between the predictors and the prediction. The Hosmer and Lemeshow goodness-of-fit test statistic
is 0.403 which is greater than 0.05 indicating that there is no difference between observed and
model-predicted values and that the model´s estimates fit the data at an acceptable level. In this
final model 4, 88 percent of the cases were correctly classified for the successful bid group and 84

42
percent for the unsuccessful bid group. Overall 86 percent of the cases were correctly classified.
This shows an improvement when compared to the previous models with lower overall percentages.
The classification plot output from SPSS provides a visual demonstration of the correct and
incorrect predictions. A U-shaped distribution would indicate that predictions are differentiated as
cases would be clustered at each end of the prediction, for clearly successful and unsuccessful
predictions (Burns, 2009). For the final fourth model the classification plot figure is closer to a U-
shaped than normal distribution which indicates that the predictors are well-differentiated (10.5.
Appendix: Logistic regression - Observed Groups and Predicted Probabilities). Another measure of
the goodness-of-fit in logistic regression is the receiver operating characteristic (ROC) curve. This
curve is based on the simultaneous measure of sensitivity (true positive) and specificity (true
negative) for all cut off points (Zhou, 2011). For the final model 4 the area under the ROC curve is
.918 with 95 percent confidence interval (.860, .976). This area is significantly different from 0.5 as
p < .001 which indicates that the logistic regression classifies the group significantly better than by
chance (10.6. Appendix: Logistic regression – ROC curve).
In the final model that contains all the variables, financial resources (B = -1.094, Exp(B) = .335, p =
.035), compatibility (B = 1.122, Exp(B) = 3.072, p = .029), competition (B = -1.271, Exp(B) = .281,
p = .023) and future projects (B = 1.652, Exp(B) = 5.217, p = .009) contribute significantly to the
prediction, but the other independent variables do not contribute as they are non-significant (Table
8).

43
Table 8: Logistic regression analysis results with groups of variables
Variable B SE Exp(B) B SE Exp(B) B SE Exp(B) B SE Exp(B)
Constant -.290 1.253 .748 -5.982 2.866 .003 -3.385 4.063 .034 -4.671 5.608 .009
Function
Sales .422 .710 1.524 1.287 1.028 3.620 1.415 1.174 4.115 1.799 1.481 6.043
Marketing .486 .846 1.627 -.200 1.124 .819 .048 1.260 1.049 -1.136 1.614 .321
Product Line Mngt .342 .720 1.408 .564 1.039 1.758 .507 1.146 1.661 .765 1.423 2.150
Quotations .564 1.648 1.758 1.003 2.246 2.726 .615 2.239 1.849 3.432 2.538 30.924
Business Operations .445 1.061 1.561 .352 1.465 1.422 .013 1.586 1.013 .259 2.013 1.296
Pricing Office .442 1.642 1.556 .330 2.086 1.391 .751 2.144 2.119 .251 2.941 1.285
(base = Other)
Position
Vice President .320 1.454 1.377 1.003 1.878 2.727 -.538 2.156 .584 .092 3.146 1.097
Director .123 1.153 1.131 .400 1.542 1.492 -.485 1.812 .616 -1.097 2.627 .334
Manager .149 1.054 1.161 -.042 1.475 .959 -.519 1.716 .595 -.537 2.489 .585
Specialist -.090 1.145 .913 -.251 1.633 .778 -.530 1.842 .589 -1.301 2.697 .272
Coordinator -21.194 40192.970 .000 -22.439 40192.970 .000 -21.937 40192.970 .000 -18.054 40192.970 .000
(base = Other)
Years of employment -.061 .180 .941 -.076 .236 .927 -.038 .282 .962 -.258 .361 .772
Experience .178 .301 1.195 .205 .343 1.227 .070 .400 1.072
Financial resources -.766 .393 .465 -.768 .426 .464 -1.094* .520 .335
Internal resources .321 .405 1.379 .284 .442 1.328 .887 .616 2.428
Partners .489 .312 1.631 .614 .340 1.847 .405 .429 1.500
Incumbency .213 .248 1.237 .022 .290 1.022 -.074 .360 .928
Compatibility .694* .341 2.002 .934* .427 2.544 1.122* .515 3.072
Market share .478 .246 1.613 .742* .321 2.100 .660 .418 1.935
Free manuf. capacity -.201 .340 .818 .159 .464 1.172
Degree of novelty -.239 .310 .787 -.737 .414 .479
Rigidity -.313 .332 .731 .023 .418 1.023
Market area -.026 .272 .974 -.463 .344 .630
Other projects -.448 .337 .639 -.664 .410 .515
Price sensitivity -.218 .335 .804 -.249 .402 .779
Sourcing strategy .324 .278 1.382 .450 .345 1.569
Competition -1.271* .560 .281
Total value -.087 .359 .917
Relationship .494 .321 1.639
Future projects 1.652** .629 5.217
-2LL 136.471 102.103 94.748 73.392
x² = 2.158, df = 12, p = .999 x² = 36.526, df = 19, p = .009 x² = 43.881, df = 26, p = .016 x² = 65.238, df = 30, p < .001
Cox & Snell s R-Squared 2.1% 30.6% 35.5% 47.9%
Nagelkerke R-Squared 2.8% 40.8% 47.4% 63.9%
Hosmer & Lemeshow test p = 1.000 p = .238 p = .100 p = .403
Classification accuracy 53% 79% 77% 86%
*p < .05. **p < .01.
Gro
up
3
Model 3 Model 4
Co
ntr
ol
vari
able
s
Model 1 Model 2
Gro
up
1G
rou
p 2
6. Discussion
The findings of this research paper suggest that only four out of the eighteen different variables
identified from the literature contribute significantly to the prediction of a bid being a successful
bid. A test of the full model against a constant only model was statistically significant, indicating

44
that the predictors as a set reliably distinguished between successful and unsuccessful bids (chi
square = 73.392, p < 0.001 with df = 30). The Wald criterion demonstrated that variables financial
resources, compatibility, competition and future projects made a significant contribution to the
prediction. In the following paragraphs these variables are discussed in more detail starting with the
variable future projects which had the highest predictive value.
6.1. Future business possibilities with the customer
The future business possibilities with the customer relates to the potential new business transactions
with the customer after bidding for the first opportunity. The results from the two-sample t-test for
the difference between two means show that there is a significant statistical difference between the
mean answers of the respondents when considering the expectations for possible future bids
requested by the customer for successful and unsuccessful bids. Based on the results it can be
argued that in the case of successful bids the manufacturer had more often expected future bids to
be requested by the customer at later point.
In the final model of the logistic regression analysis the Exp(B) value of 5.217 for the variable
future projects (p = .009) indicates that when the expectations for future business possibilities with
the customer increase with one unit (e.g. a response moving from Agree to Strongly Agree that the
manufacturer expected more future bids to be requested by the customer after the current bid), the
odds ratio is more than 5 times as large and therefore a bid is 5 more times likely to belong to the
successful bid group. The logistic regression analysis results indicate that bids after which the
manufacturer expected to receive more future bid requests from the customer were 5 more times
likely to be successful.
Based on the logistic regression results is can be concluded that future business possibilities have an
influence on the bid´s success and should therefore be regarded as an influencing factor in the
bid/no bid decision making as well. The results of this paper follow the conclusions of Egemen and
Mohamed (2007) who found out that larger-size companies consider strategic considerations
already in the bidding decision process, especially issues related to foreseeable future market
conditions. From management point of view this means that future business possibilities should be
taken into consideration when preparing a bid for the first opportunity by looking at the possibilities
available in a long-term period. This usually means developing the customer relationship with a

45
long-term perspective. The Pearson correlation coefficients in the present study showed that there is
a significant and relatively strong positive correlation between the relationship with the customer
and possible future projects. According to this as the relationship with the customer becomes more
established the more future business possibilities can be expected and vice versa. Relationships can
be based on repeated transactions over time without close interaction, or relationships can be
developed over time towards mutually beneficial partnerships (Anderson, 1990). An empirical
study by Kalwani (1995) shows that the rate of sales in growth does not decrease for a supplier
company that maintains a long-term relationship with selected customers. Instead, suppliers with
long-term relationships are able to achieve the same level of growth as companies that employ a
transactional approach in their selling operations. Kalwani (1995) found out that these companies
are able to reduce costs over time through better inventory utilization and reductions in selling,
general and administrative costs. These results imply that focusing on customer tender enquiries
from which future business opportunities can be expected, and fostering trusting relationships can
be beneficial in the long-term.
6.2. The compatibility of the products offered
The compatibility of the products offered refers to the degree of compatibility of the offered
products with the customer specifications. The results from the two-sample t-test for the difference
between two means show that there is a significant statistical difference between the mean answers
of the respondents when considering the compatibility of the products in the successful and
unsuccessful bids. According to the results successful bids contained products that were more
compatible with the customer specifications than unsuccessful bids.
In the final model of the logistic regression analysis the Exp(B) value of 3.072 for the variable
compatibility (p = .029) implies that when compatibility increases with one unit (e.g. a response
moving from Agree to Strongly Agree that the products offered by the manufacturer to the customer
were compatible with the customer specifications), the odds ratio is 3 times as large and therefore a
bid is 3 more times likely to belong to the successful bid group. This indicates that the more
compatible the products in the bid are with the customer specifications, the more likely the bid is to
be successful.

46
To ensure that the offered products are compatible with the customer specifications management
needs to make sure that engineering and product line management are involved in the bidding
process from the beginning so that the company is able to offer products that fulfil the needs of the
customer. This means tight cross departmental cooperation inside the company but also cooperation
with external partners. As the Pearson correlation results of this study show there exists a significant
positive correlation between compatibility of the products and company resources, more precisely
financial resources, internal resources and external partners. This can be explained by cooperative
activities among different organizational departments. As the manufacturer´s organisation consists
of several departments in different sizes and functions, there is a need for a project organizer of the
bidding process who knows in more detail which departments need to be involved and to what
extent. This way the bidding process in general, the timing and the decisions made are monitored,
written down and executed by the responsible party.
6.3. The availability of adequate financial resources
The availability of adequate financial resources relates to the financial resources of the bidding
company that make it possible for the company, first to bid, and second to manufacture the
requested products. The results from the two-sample t-test for the difference between two means
show that there is no statistically significant difference between the mean answers of the
respondents when considering the availability of adequate financial resources for winning the bid.
This indicates that similar financial resources are available for all bids.
In the final model of the logistic regression analysis the Exp(B) value of 0.335 for the variable
financial resources (p = .035) implies that when financial resources increase with one unit (e.g. a
response moving from Agree to Strongly Agree that the manufacturer had the adequate financial
resources available to win the bid), the odds ratio decreases with 66.5 percent and therefore it is less
likely that a bid belongs to the successful bid group.
Previous studies (Cova et al., 2000; Egemen & Mohamed, 2007; Lowe & Parvar, 2004); Wanous et
al., 2000) have considered financial resources as an important factor in the bid/no bid decision
making. Egemen and Mohamed (2007) found out that the strength of the firm, partly measured by
the financial status of the company, is one of the most important factors in the bid/no bid decision
process. The results of this paper indicate that the financial resources have a significant influence on

47
the success of a bid and should be taken into consideration in the bid/no bid decision making.
However, the results show that the better the availability of financial resources the less successful a
bid is. This can be interpret in a way that a strong financial situation can have a negative influence
on the need to win new bids and how much consideration is given to a bid and the bidding process.
Large established companies such as the manufacturer usually have a secure financial situation that
helps the company to survive in different markets longer than smaller competitors. This can also
generate a secure and comfortable feeling inside the company as winning every bid is not
necessarily needed. Large established companies are usually also more bureaucratic and therefore
not able to response to the needs of the customers as quickly as necessary. This was also indicated
by one of the respondents who commented that the manufacturer´s internal decision making is slow
and that the company is too complex which makes operations “even more complicated by requiring
too many executive approvals”. To avoid problems like these the management should streamline the
decision making and point out to the customer the benefits of strong financial background.
6.4. Competition in the market
The variable competition in the market relates to the number of competitors and degree of
competition in the particular market where the bid was made by the manufacturer. The results from
the two-sample t-test for the difference between two means indicate that there is no statistically
significant difference between the mean answers of the respondents when considering the
competition in the market where the bids were made. This demonstrates that the competition in
different markets is fierce and even in markets where bids are successful the competition is high.
In the final model of the logistic regression analysis the Exp(B) value of 0.281 for the variable
competition (p = .023) imply that when competition increases with one unit (e.g. a response moving
from Agree to Strongly Agree that the competition in the market concerning the bid was fierce at
the time of making the bid), the odds ratio decreases and therefore a bid is less likely to belong to
the successful bid group. In other words, in a market where the competition is fiercer, the odds of a
bid to be a successful bid are lower by 71.9 percent. Therefore the odds of a bid being a successful
bid are lower in a market where there is fiercer competition.
These results are in line with the decision making models by Ahmad (1990), M. King and Phythian
(1992), B.G. Kingsman and de Souza (1997) and Paranka (1971) who consider the number of

48
competitors and the degree of competition as important elements of their models. First of all
identifying the competitors is important. As large Asian manufacturers are entering the European,
Middle East and African markets with competitive offerings, the manufacturer´s management needs
to emphasize the importance of following the moves of competitors, their strategies and approaches.
The manufacturer has to know what is offered by the competitors and how they are organized in
different markets. Finding this information can be done by using public information and industry
networks. Furthermore, collecting competitive information for example concerning products offered
by competitors, pricing and contract terms, the manufacturer is prepared for competition already
from the start of the bidding process. Knowing the risks associated with the competitors, for
example frequent delays in the supply, the manufacturer can highlight these risks to the customer
and stand out with positive differentiators in the offer.
6.5. The role of the other variables in the final model
The other independent variables were non-significant which implies that they do not contribute
significantly to the prediction. However, the logistic regression calculates odd ratios, Exp(B), for all
variables which indicate the relationship between the independent variables and the prediction. If
the value of Exp(B) exceeds 1 then the odds of an outcome occurring increase. If the value is less
than 1 then any increase in the predictor leads to a drop in the odds of the outcome occurring. As
can be seen from the table 8, experience of the manufacturer, internal resources, partners, the
market share, free manufacturing capacity, rigidity of the customer specifications, the sourcing
strategy and the current relationship have a positive relationship with the success of the bids. One
unit increase in the independent variable leads the bid to be more successful by the amount
indicated by the odds ratio Exp(B). For the variables incumbency of the manufacturer, novelty of
the products offered, market area restrictions, the availability of other profitable projects, price
sensitivity of the customer and the total value of the bid have a negative relationship with the
prediction. This means that one unit change in the independent variable leads to a decrease in the
bid success. The decrease in success as percentage can be calculated by multiplying the odds ration
Exp(B) by hundred and deducting hundred from the result. As an example, when considering
market area restrictions the logistic regression results indicate that one unit increase in the market
area restrictions leads the odds of the bid being a successful bid to lower by 37 percent. However, as
these results are not significant the odds ratios should be interpret with caution. The final model is
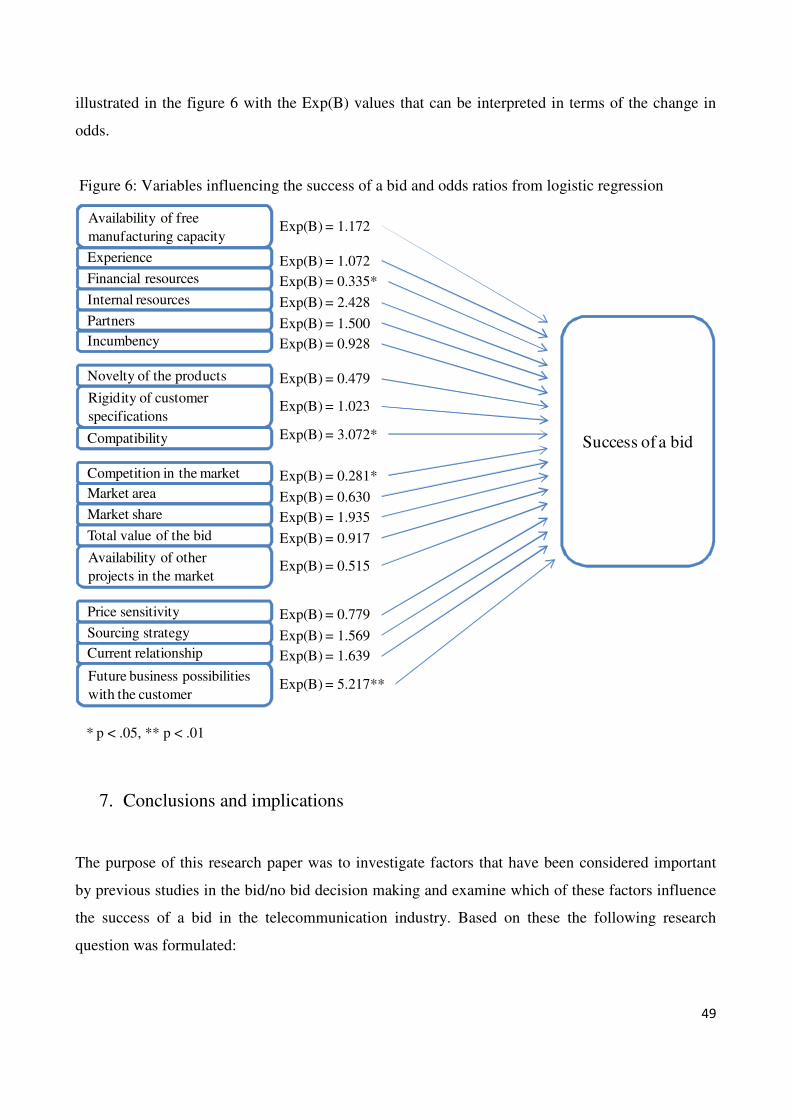
49
illustrated in the figure 6 with the Exp(B) values that can be interpreted in terms of the change in
odds.
Figure 6: Variables influencing the success of a bid and odds ratios from logistic regression
Success of a bid
Availability of free
manufacturing capacity
Experience
Financial resources
Internal resources
Partners
Incumbency
Novelty of the products
Rigidity of customer
specifications
Compatibility
Competition in the market
Market area
Market share
Total value of the bid
Availability of other
projects in the market
Price sensitivity
Sourcing strategy
Current relationship
Future business possibilities
with the customer
Exp(B) = 1.172
Exp(B) = 1.072
Exp(B) = 0.335*
Exp(B) = 2.428
Exp(B) = 1.500
Exp(B) = 0.928
Exp(B) = 0.479
Exp(B) = 1.023
Exp(B) = 3.072*
Exp(B) = 0.281*
Exp(B) = 0.630
Exp(B) = 1.935
Exp(B) = 0.917
Exp(B) = 0.515
Exp(B) = 0.779
Exp(B) = 1.569
Exp(B) = 1.639
Exp(B) = 5.217**
* p < .05, ** p < .01
7. Conclusions and implications
The purpose of this research paper was to investigate factors that have been considered important
by previous studies in the bid/no bid decision making and examine which of these factors influence
the success of a bid in the telecommunication industry. Based on these the following research
question was formulated:

50
Which factors influence the success of a bid of a telecommunication system solution manufacturer
in the EMEA region?
In order to answer the research question a literature review was conducted on the theories and the
underlying factors that influence the bid/no-bid decision making. Theoretical frameworks of
thirteen different articles were considered and factors that appeared in these publications were used
in the theoretical model of this paper. Altogether 18 factors were selected to fit the bid/no-bid
decision making of the telecommunication industry. These factors were divided into company,
product, market and customer related factors. Company factors were free manufacturing capacity,
experience, financial resources, internal resources, partners and incumbency of the bidding
company. Product related factors were the degree of novelty of the products offered, rigidity of the
customer specifications and compatibility of the product offered. Market related factors were
competition in the market where bids were made, market area restrictions, market share of the
bidding company, total value of the bid offered and other available projects in the market. Customer
related factors were price sensitivity of the customer, sourcing strategy of the customer, the current
relationship with the customer and possible future projects available after the first bid.
The influence of these factors on the success of a bid was measured with a questionnaire that was
answered by 56 respondents who had been involved in the bidding processes of one
telecommunication system solution manufacturer. The respondents identified 56 successful and 56
unsuccessful bids previously made by the manufacturer and expressed how each of the factors
related to a particular bidding situation. The answers were analysed by creating contingency tables
and conducting two-sample t-tests for the difference between the mean values of successful and
unsuccessful bids. Furthermore, a logistic regression analysis was conducted to predict which
factors influence the success of a bid for 112 bids using 18 different independent variables as
predictors. A test of the full model against a constant only model was statistically significant,
indicating that the predictors as a set reliably distinguished between successful and unsuccessful
bids. The overall prediction success was 86 percent. In the full model four variables contributed
significantly to the prediction. These variables were future business possibilities with the customers,
competition in the market, the availability of the adequate financial resources and the compatibility
of the products offered. In the following paragraph the main results of this research paper are
summarized from a management point of view.

51
7.1. Managerial implications
According to the logistic regression analysis four different variables contributed significantly to the
prediction the model. The significant role of the future business possibilities with the customer
imply that companies operating in the telecommunication system solution manufacturing industry
should acknowledge the possibilities for future transactions already from the first bid, and value and
build the customer relationships with a long-term perspective. Moreover, the manufacturer needs to
highlight the importance of cooperation between departments inside the company as well as
cooperation with the external partners. Using the extensive cooperation to ensure that the offered
products are compatible with the customer specifications can increase the possibilities for
successful bids. Furthermore, ensuring adequate financial resources to prepare a bid and
manufacture the offered products is essential. However, the manufacturer should not let the size of
the company blind the operations, but help to stay focused and aware what is happening in the
markets. Finally, the manufacturer should also focus on the competition in the different markets as
this study shows that competition influences the success of bids negatively. By following what
competitors do in the markets and what do they offer can prepare the company to make a bid that
will be successful.
In the following paragraph the main contributions to theory by this research paper are presented.
7.2. Contribution to theory
The bid/no-bid decision making processes discussed in the literature review chapter showed several
different theoretical approaches to explain the decision making processes and the factors
influencing the decision making. Several of the frameworks were based on questionnaires or
interviews answered by employees of large and medium sized organizations (Ahmad, 1990;
Egemen & Mohamed, 2007; M. King & Phythian, 1992; B.G. Kingsman and de Souza, 1997).
These studies provided an extensive list of factors that should be taken into consideration in the
bid/no-bid decision making of the bidding companies. Two of the studies provided practical
evidence on which variables to concentrate (Paranka, 1971; Lowe, 2004). None of the studies
provided a quantitative analysis of the factors and their influence on the successfulness of bids.
However, Lowe (2004) identified significant factors in the decision to bid process by investigating
past bid/no-bid decisions of an UK based construction company by using logistic regression

52
analysis. One of the significant factors identified by Lowe (2004) was the competitive environment,
reflecting similar aspects as the variable competition in the study at hand.
The present study shows that there are a smaller number of variables that have significant influence
on the success of a bid and therefore this study implies that it is of most importance to take these
variables into close consideration in the bid/no-bid decision making. Following the management
science approach this paper introduces different factors that can be identified and measured, and
finally combined with management perception in the decision making processes. Concentrating first
on these most influential variables (the future business possibilities, competition in the market,
availability of adequate financial resources and the compatibility of the products offered) the
companies in the telecommunication industry can save resources and analyse customer tender
enquiries faster. As the previous bid/no-bid decision making models and the factors influencing the
decision making have mostly been generated to fit the needs of construction industry, the present
study contributes to the theory by presenting factors that have been studied quantitatively and
showed to influence the success of bids in the telecommunication system solution manufacturing
industry. Furthermore, while in Ahmad´s (1990) model the factors had individual worths that were
weighted, the present study introduced a flexible way for management to evaluate the influence of
the factors on the success of the bids by using the odds ratios from the logistic regression.
8. Limitations and further research
In this chapter the limitations of the present study are discussed. After this possible further research
approaches are presented.
Validity refers to whether the findings are really what they appear to be about (Saunders, 2009).
Even though great consideration was taken when designing the operationalization of this research,
there exist some threats to construct validity. In order to keep the questionnaire short and to get as
many respondents as possible to answer the questionnaire, each variable was measured with only
one statement for both successful and unsuccessful bid. This however creates a mono-operation
bias that lowers the construct validity. Single operations under represent constructs and may contain
irrelevancies. To increase the construct validity the items should be measured with multiple
operationalizations (Shadish, 2002). This would create more robust measures and also influence the
internal consistency of the questionnaire (Tavakol, 2011). As the statements were all worded in one

53
direction this can create a monomethod bias to the construct validity (Shadish, 2002). In addition to
adding more operationalizations to each construct positive and negative wordings should be used.
The validity of the questionnaire statements is a question of the degree to which a measure captures
what it is intended to measure (Tavakol, 2011). The questionnaire statements can be interpreted
differently because of the wordings of the statements. Some of the statements include words that are
not exhaustively explained. As an example a statements that measures the influence of the total
value of the bid offered to the success of the bid “The total value of the bid offered was high”. As
the word high is not explained the respondents can interpret this differently and thus one respondent
can consider a range of values that another respondent would never consider to belong to a group of
high values. This ambiguous wording can create differences in the considerations of the
respondents.
Furthermore, it is impossible to indicate how much thought each respondent has put in the
answering process and if the respondents have been thinking within the full context of the situation.
The respondents may have interpreted the statements differently even though the meanings of the
statements were assessed by 3 test persons before launching the questionnaire. There also exists a
possibility for researcher imposition where the researcher is making his own assumptions what is
important and what is not, and therefore the questionnaire may be missing something that is of
importance to the subject of interest. Moreover, as the respondents were requested to think of a bid
that they have been involved with or that they know, the information the respondents provided was
highly subjective.
One of the limitations of this study is the sample of bids identified by the respondents. As the bids
considered by the respondents represent bids of an incumbent manufacturer with global operations
the results might not be generalisable, for example, to the operations of a single more focused
manufacturer. As the results of this research present the operations of an incumbent manufacturer it
is questionable if the results can be generalized to the entire industry. However, as there are several
established fiber optic communications system solutions manufacturers operating in the industry the
results of this research can reflect the average outcomes of the industry. But as the bids of only one
organization were considered in this paper there is a need for further research that would take into
consideration the bids of several manufacturers from the industry.

54
Concerning further research and quantitative data collection methods, different information
concerning bids, markets and customers should be collected when the bids are prepared and
delivered to the customer. By collecting the information in real time there is no need to rely on the
memory of respondents.
Another approach for investigating the factors influencing the success of bids is to conduct semi
constructed interviews with employees that are highly involved in the bidding processes. This
method would yield broader information that could then be analyzed in detail and compared to
quantitative studies available.

55
9. Bibliography
Abratt, R., & Pitt, L. F. (1985). Pricing practices in two industries. Industrial Marketing
Management, 14(4), 301-306. doi: http://dx.doi.org/10.1016/0019-8501(85)90023-9
Ahmad, I. (1990). Decision-Support System for Modeling Bid No-Bid Decision Problem. Journal
of Construction Engineering and Management-Asce, 116(4), 595-608. doi: Doi
10.1061/(Asce)0733-9364(1990)116:4(595)
Anderson, J. C., & Narus, J.A. (1990). A Model of Distributor Firm and Manufacturer Firm
Working Partnerships. Journal of Marketing, 54, 42-58.
Babbie, E. (2010). The Practice of Social Research (12th ed.). Belmont, CA, USA: Wadsworth,
Cengage Learning.
Bagies, A., & Fortune, C. (2006). Bid/no bid decision modelling for construction projects. Paper
presented at the Proceedings of the Association of Researchers in Construction Management
Annual Conference, 4-6 September, Birmingham.
Bijmolt, T. H. A., Van Heerde, H. J., & Pieters, R. G. M. (2005). New Empirical Generalizations on
the Determinants of Price Elasticity. Journal of Marketing Research (JMR), 42(2), 141-156.
Brown, J. D. (2009). Statistics Corner. Questions and answeres about language testing statistics:
Choosing the Right Type of Rotations in PCA and EFA. Shiken: JALT Testing & Evaluation
SIG Newsletter, 13(3), 20-25.
Burns, R. B., & Burns, R.A. (2009). Business Research Methods and Statistics using SPSS. London:
Sage Publications Ltd.
Buzby, C. M., Gerstenfeld, A., Voss, L.E, Zeng, A.Z. (2002). Using lean principles to streamline
the quotation process: a case study. Industrial Management & Data Systems, 102(9), 513-
520. doi: 10.1108/02635570210450190
Choi, T., & Linton, T. (2011). Don't Let Your Supply Chain Control Your Business. Harvard
Business Review, 89(12), 112-117.
Committee of Advancing the Competitiveness and Productivity of the U.S. Construction Industry,
N. R. C. (2009). Advancing the Competitiveness and Efficiency of the U.S. Construction
Industry: The National Academies Press.
Courtney, J. F. (2001). Decision making and knowledge management in inquiring organizations:
toward a new decision-making paradigm for DSS. Decision Support Systems, 31(1), 17-38.
doi: http://dx.doi.org/10.1016/S0167-9236(00)00117-2
Cova, B., Salle, R., & Vincent, R. (2000). To bid or not to bid: screening the Whorcop project.
European Management Journal, 18(5), 551-560. doi: http://dx.doi.org/10.1016/S0263-
2373(00)00044-X

56
Cox, A. (1999). Power, value and supply chain management. Supply Chain Management: An
International Journal, 4(4), 167-175. doi: 10.1108/13598549910284480
Daft, R. L. (2010). Understanding the Theory and Design of Organizations. (Tenth ed.). London:
South-Western, Cengage Learning.
Davis, L. J., & Offord, K.P. (1997). Logistic Regression. Journal of Personality Assessment, 68(3),
497-507.
De Veaux, R. D., Velleman, P.F., & Bock, D.A. (2008). Stats: Data and Models (2nd ed.). Boston:
Pearson Education Inc.
Dean, J. (1969). Pricing Pioneering Products. The Journal of Industrial Economics, 17(3), 165-179.
doi: 10.2307/2097492
Dean, J. W., & Sharfman, M. P. (1993). Procedural Rationality in the Strategic Decision-Making
Process. Journal of Management Studies, 30(4), 587-610. doi: DOI 10.1111/j.1467-
6486.1993.tb00317.x
Dozzi, S., AbouRizk, S., & Schroeder, S. (1996). Utility-Theory Model for Bid Markup Decisions.
Journal of Construction Engineering and Management, 122(2), 119-124. doi:
doi:10.1061/(ASCE)0733-9364(1996)122:2(119)
Drew, D., & Skitmore, M. (1997). The effect of contract type and size on competitiveness in
bidding. Construction Management and Economics, 15(5), 469-489. doi:
10.1080/014461997372836
Drew, D., Skitmore, M., & Lo, H. P. (2001). The effect of client and type and size of construction
work on a contractor’s bidding strategy. Building and Environment, 36(3), 393-406. doi:
http://dx.doi.org/10.1016/S0360-1323(00)00009-3
Drew, D., Tang, S. L. Y., & Lo, H. P. (2002). Developing a tendering strategy in two-envelope fee
tendering based on technical score-fee variability. Construction Management and
Economics, 20(1), 67-81. doi: 10.1080/01446190110096918
Dulaimi, M. F., & Shan, H. G. (2002). The factors influencing bid mark-up decisions of large- and
medium-size contractors in Singapore. Construction Management and Economics, 20(7),
601-610. doi: 10.1080/01446190210159890
Egemen, M., & Mohamed, A. N. (2007). A framework for contractors to reach strategically correct
bid/no bid and mark-up size decisions. Building and Environment, 42(3), 1373-1385. doi:
http://dx.doi.org/10.1016/j.buildenv.2005.11.016
Etzioni, A. (1967). Mixed-Scanning: A "Third" Approach to Decision-Making. Public
Administration Review, 27(5), 385-392. doi: 10.2307/973394
Fayek, A. (1997, 8-10 Dec1997). A competitive tendering strategy model and software system
based on fuzzy set theory. Paper presented at the Intelligent Information Systems, 1997. IIS
'97. Proceedings.

57
Friedman, L. (1956). A Competitive-Bidding Strategy. Operations Research, 4(1), 104-112. doi:
10.2307/167522
Garret, G. A., & Kipke, R. J. (2005). Bid/No-bid Decision-Making - Tools and Techniques.
Capture Management: Winning More Business: Cch Incorporated, Navigant Consulting.
Gunner, J., & Skitmore, M. (1999). Comparative analysis of pre-bid forecasting of building prices
based on Singapore data. Construction Management and Economics, 17(5), 635-646. doi:
10.1080/014461999371240
Holtzmann, S. (1989). Intelligent decision systems. Reading, Mass.: Addison-Wesley Publishing
Company, Inc.
Ingenbleek, P., Debruyne, M., Frambach, R., & Verhallen, T. M. (2003). Successful New Product
Pricing Practices: A Contingency Approach. Marketing Letters, 14(4), 289-305. doi:
10.1023/B:MARK.0000012473.92160.3d
Kalwani, M. U., & Narayandas, N. (1995). Long-Term Manufacturer-Supplier Relationships: Do
They Pay Off for Supplier Firms? Journal of Marketing, 59, 1-16.
Katz, M. L., & Shapiro, C. (1994). Systems Competition and Network Effects. Journal of Economic
Perspectives, 8(2), 93-115.
Kelly, J. P., & Coaker, J. W. (1976). The importance of price as a choice criterion for industrial
purchasing decisions. Industrial Marketing Management, 5(5), 281-293. doi:
http://dx.doi.org/10.1016/0019-8501(76)90023-7
King, A. A., & Tucci, C. L. (2002). Incumbent Entry into New Market Niches: The Role of
Experience and Managerial Choice in the Creation of Dynamic Capabilities. Management
Science, 48(2), 171-186.
King, M., & Phythian, G. J. (1992). Validating an expert support system for tender enquiry
evaluation: a case study. Journal of the Operational Research Society, 203-214.
Kingsman, B. G., & de Souza, A. A. (1997). A knowledge-based decision support system for cost
estimation and pricing decisions in versatile manufacturing companies. International
Journal of Production Economics, 53(2), 119-139. doi: Doi 10.1016/S0925-5273(97)00116-
3
Kingsman, B. G., Hendry, L., Mercer, A., & de Souza, A. (1996). Responding to customer
enquiries in make-to-order companies: Problems and solutions. International Journal of
Production Economics, 46, 219-231. doi: Doi 10.1016/0925-5273(95)00199-9
Kingsman, B. G., Hendry, L., Mercer, A., & de Souza, A. (1996). Responding to customer
enquiries in make-to-order companies: Problems and solutions. International Journal of
Production Economics, 46, 219-231. doi: 10.1016/0925-5273(95)00199-9
Kortge, G. D., & Okonkwo, P. A. (1993). Perceived value approach to pricing. Industrial Marketing
Management, 22(2), 133-140. doi: http://dx.doi.org/10.1016/0019-8501(93)90039-A
58
Li, H., Shen, L., & Love, P. (1999). ANN-Based Mark-Up Estimation System with Self-
Explanatory Capacities. Journal of Construction Engineering and Management, 125(3),
185-189. doi: doi:10.1061/(ASCE)0733-9364(1999)125:3(185)
Lin, C.-T., & Chen, Y.-T. (2004). Bid/no-bid decision-making–a fuzzy linguistic approach.
International Journal of Project Management, 22(7), 585-593.
Liu, M., & Ling, Y. (2005). Modeling a Contractor’s Markup Estimation. Journal of Construction
Engineering and Management, 131(4), 391-399. doi: doi:10.1061/(ASCE)0733-
9364(2005)131:4(391)
Liu, S. L., Wang, S. Y., & Lai, K. K. (2005). A general multivariate analysis approach for
determining bid mark‐up strategy. Construction Management and Economics, 23(4), 347-
353. doi: 10.1080/0144619042000190216
Lowe, D. J., & Parvar, J. (2004). A logistic regression approach to modelling the contractor's
decision to bid. Construction Management and Economics, 22(6), 643-653.
Miller, R. B., Heiman, S. E. & Tuleja, T. (2006). The New Successful Large Account Management:
How to Hold Onto Your Most Important Customers and Turn Them Into Long-term Assets.
London: Kogan Page Publishers.
Mochtar, K., & Arditi, D. (2001). Pricing strategy in the US construction industry. Construction
Management and Economics, 19(4), 405-415. doi: 10.1080/01446190010020372
Monczka, R. M., Handfield, R.B., Giunipero, L.C., Patterson, J.L. (2009). Purchasing and Supply
Chain Management (4th ed.). Mason, OH, USA: South-Western Cengage Learning.
Morris, M. H., & Joyce, M. L. (1988). How marketers evaluate price sensitivity. Industrial
Marketing Management, 17(2), 169-176. doi: http://dx.doi.org/10.1016/0019-
8501(88)90019-3
Mustafa, M. A., & Ryan, T. C. (1990). Decision support for bid evaluation. International Journal of
Project Management, 8(4), 230-235.
Oduoza, C. F., & Xiong, M. H. (2009). A decision support system framework to process customer
order enquiries in SMEs. International Journal of Advanced Manufacturing Technology,
42(3-4), 398-407. doi: DOI 10.1007/s00170-008-1596-0
Paranka, S. (1971). Competitive bidding strategy: A procedure for pre-bid analysis. Business
Horizons, 14(3), 39-43. doi: http://dx.doi.org/10.1016/0007-6813(71)90115-7
Parvar, J., Lowe, D., Emsley, M., & Duff, R. (2000). Neural networks as a decision support system
for the decision to bid process. Paper presented at the Proc., ARCOM Conf.
Pfeffer, J., & Salancik, G. R. (1974). Organizational Decision Making as a Political Process: The
Case of a University Budget. Administrative Science Quarterly, 19(2), 135-151. doi:
10.2307/2393885

59
Phythian, G. J., & King, M. (1992). Developing an expert support system for tender enquiry
evaluation: a case study. European Journal of Operational Research, 56(1), 15-29.
Rao, V. R. (1984). Pricing Research in Marketing: The State of the Art. The Journal of Business,
57(1), S39-S60. doi: 10.2307/2352922
Rubel, O. (2013). Stochastic Competitive Entries and Dynamic Pricing. European Journal of
Operational Research(0). doi: http://dx.doi.org/10.1016/j.ejor.2013.05.014
Saunders, M., Lewis, P., & Thornhill, P. (2009). Research methods for business students (5th ed.).
Harlow: Pearson.
Sauter, V. L. (1999). Intuitive decision-making. Commun. ACM, 42(6), 109-115. doi:
10.1145/303849.303869
Seydel, J., & Olson, D. L. (2001). Multicriteria support for construction bidding. Mathematical and
Computer Modelling, 34(5–6), 677-701. doi: http://dx.doi.org/10.1016/S0895-
7177(01)00091-7
Shadish, W. R., Cook, T.D., & Campbell, D.T. (2002). Experimental and Quasi-Experimental
Designs for Generalized Causal Inference. Belmont: Wadsworth.
Shash, A. (1998). Subcontractors' Bidding Decisions. Journal of Construction Engineering and
Management, 124(2), 101-106. doi: doi:10.1061/(ASCE)0733-9364(1998)124:2(101)
Simon, H. A. (1955). A Behavioral Model of Rational Choice. The Quarterly Journal of
Economics, 69(1), 99-118. doi: 10.2307/1884852
Skitmore, M. (2002). Predicting the Probability of winning Sealed Bid Auctions: A Comparison of
Models. The Journal of the Operational Research Society, 53(1), 47-56. doi:
10.2307/822878
Smith, T. J. (2012). Sales vs. Pricing and Large Account Management. The Wiglaf Journal, 1.
http://www.wiglafjournal.com/pricing/2012/01/sales-vs-pricing-and-large-account-
management/
Stark, R. M., & Rothkopf, M. H. (1979). Competitive bidding: A comprehensive bibliography.
Operations Research, 27(2), 364-390.
Tavakol, M., & Dennick, R. (2011). Making sense of Cronbach´s alpha. International Journal of
Medical Education, 2, 53-55. doi: 10.5116/ijme.4dfb.8dfd
Teece, D. J. (1986). Profiting from technological innovation: Implications for integration,
collaboration, licensing and public policy. Research Policy, 15(6), 285-305. doi:
http://dx.doi.org/10.1016/0048-7333(86)90027-2
Tellis, G. J. (1988). The Price Elasticity of Selective Demand: A Meta-Analysis of Econometric
Models of Sales. Journal of Marketing Research, 25(4), 331-341.
60
Tripsas, M. (1997). Unraveling the Process of Creative Destruction: Complementary Assests and
Incumbent Survival in the Typesetter Industry. Strategic Management Journal, 18(S1), 119-
142. doi: 10.1002/(SICI)1097-0266(199707)18:1+<119::AID-SMJ921>3.0.CO;2-0
van Dijk, E., & Vermunt, R. (2000). Strategy and Fairness in Social Decision Making: Sometimes It
Pays to Be Powerless. Journal of Experimental Social Psychology, 36(1), 1-25. doi:
http://dx.doi.org/10.1006/jesp.1999.1392
Wanous, M., Boussabaine, A., & Lewis, J. (1998). Tendering factors considered by Syrian
contractors. Paper presented at the Proceedings of the 14th annual ARCOM conference.
Wanous, M., Boussabaine, A., & Lewis, J. (2000). To bid or not to bid: a parametric solution.
Construction Management & Economics, 18(4), 457-466.
Wanous, M., Boussabaine, A., & Lewis, J. (2003). A neural network bid/no bid model: the case for
contractors in Syria. Construction Management and Economics, 21(7), 737-744.
Ward, S., & Chapman, C. (1988). Developing competitive bids: a framework for information
processing. Journal of the Operational Research Society, 123-134.
Wasson, C. R. (1976). The importance of the product life cycle to the industrial marketer. Industrial
Marketing Management, 5(6), 299-308. doi: http://dx.doi.org/10.1016/0019-8501(76)90012-
2
Wuensch, K. L. (2011). Binary Logistic Regression with PASW/SPSS. Retrieved 7.10.2013, from
http://core.ecu.edu/psyc/wuenschk/MV/Multreg/Logistic-SPSS.pdf
Zhou, X. H., Obuchowski, N.A., & McClish, D.K. (2011). Statistical Methods in Diagnostic
Medicine (2nd ed.). Hoboken, New Jersey: John Wiley & Sons.

61
10. Appendices
10.1. Appendix: Questionnaire
(Text removed for confidentiality purposes)
The purpose of this questionnaire is to understand the factors that influence the success of a bid.
The questionnaire results and the corresponding analysis will provide (text removed for
confidentiality purposes) a fresh organizational insight into the factors that influence the success of
a bid. Therefore your feedback is highly appreciated.
Throughout this questionnaire you will be asked to consider two different bids (two different offers
made by (text removed for confidentiality purposes) to the end customers) and rate the factors
related to these bids. You can decide yourself which bids to consider.
However, the first bid should be successful: a bid that (text removed for confidentiality purposes)
won and that generated an order. The second bid should be unsuccessful: an opportunity that (text
removed for confidentiality purposes) lost to a competitor. In naming the bids you can use for
example the name of the project to indicate which bid you refer to (you can also use the name of the
customer, the offered products or the size of the bid when differentiating between the bids).
Before continuing to the questionnaire, please consider which bids you are going to include into the
questionnaire and reserve approximately 5 minutes to complete the questionnaire.
Thank you!
Please name a successful bid that you have been involved with / are familiar with:
Please name an unsuccessful bid (opportunity lost to competition) that you have been involved with
/ are familiar with:
Please indicate to what extent you agree with the following statements by choosing the most
suitable option from the given alternatives for both the successful and for the unsuccessful bid:

62
Factors relating to the manufacturer:
1. The availability of free manufacturing capacity at the manufacturer´s plants
“There was free manufacturing capacity available in the plants at the time of making the bid”
Strongly Disagree DisagreeNeither agree
nor disagreeAgree Strongly Agree
2. The experience of the manufacturer from previous bids/projects
“The manufacturer had the necessary experience (knowledge and skills from previous bids) to win
the bid”
Strongly Disagree DisagreeNeither agree
nor disagreeAgree Strongly Agree
3. The financial resources of the manufacturer needed to implement a bid
“The manufacturer had the adequate financial resources available to win the bid”
Strongly Disagree DisagreeNeither agree
nor disagreeAgree Strongly Agree
4. The internal resources of the manufacturer needed to implement a bid
“The manufacturer had the necessary internal resources (qualified employees, plants and
equipment) to win the bid”
Strongly Disagree DisagreeNeither agree
nor disagreeAgree Strongly Agree
5. The partners of the manufacturer needed to implement a bid
“The manufacturer had the necessary external partners (qualified subcontractors and material
suppliers) to win the bid”
Strongly Disagree DisagreeNeither agree
nor disagreeAgree Strongly Agree
6. Manufacturer´s established position in the telecommunication industry
“The manufacturer had a well established position in the industry (incumbent position) that made it
possible to win the bid”
Strongly Disagree DisagreeNeither agree
nor disagreeAgree Strongly Agree

63
Factors relating to the products:
7. The degree of novelty of the products offered
“The products requested by the customer had a high degree of novelty”
Strongly Disagree DisagreeNeither agree
nor disagreeAgree Strongly Agree
8. The rigidity of customer product specifications
“The product specifications by the customer were highly rigid”
Strongly Disagree DisagreeNeither agree
nor disagreeAgree Strongly Agree
9. The compatibility of the offered products
“The products offered by the manufacturer to the customer were compatible with the customer
specifications”
Strongly Disagree DisagreeNeither agree
nor disagreeAgree Strongly Agree
Factors relating to the market:
10. The number of competitors in a market
“The competition in the market concerning the bid was fierce at the time of making the bid”
Strongly Disagree DisagreeNeither agree
nor disagreeAgree Strongly Agree
11. The market area
“The customer market area had regulatory and other special requirements”
Strongly Disagree DisagreeNeither agree
nor disagreeAgree Strongly Agree
12. The market share
“The manufacturer had one of the largest market shares in the region concerning the bid”
Strongly Disagree DisagreeNeither agree
nor disagreeAgree Strongly Agree
13. The size of the opportunity
“The total value of the bid offered by the manufacturer was high”

64
Strongly Disagree DisagreeNeither agree
nor disagreeAgree Strongly Agree
14. The availability of other projects in the market
“There were a high number of other profitable projects available in the region concerning the bid”
Strongly Disagree DisagreeNeither agree
nor disagreeAgree Strongly Agree
Factors relating to the customers:
15. The price sensitivity of the customer
“The customer was highly sensitive to price”
Strongly Disagree DisagreeNeither agree
nor disagreeAgree Strongly Agree
16. The sourcing strategy of the customer
“The sourcing strategy of the customer was to limit the number of suppliers”
Strongly Disagree DisagreeNeither agree
nor disagreeAgree Strongly Agree
17. The current relationship with the customer
“The manufacturer had an established relationship with the customer”
Strongly Disagree DisagreeNeither agree
nor disagreeAgree Strongly Agree
18. Future business possibilities with the customer
“The manufacturer expected more future bids to be requested by the customer after this bid”
Strongly Disagree DisagreeNeither agree
nor disagreeAgree Strongly Agree
General information:
Please choose the function you work at:
• Sales
• Marketing
• Product Line Management
• Quotations
• Business Operations
• Pricing Office

65
• Other (Please Specify):
Please specify your position in the organization:
• Vice President
• Director
• Manager
• Specialist
• Coordinator
• Other (Please Specify):
Please indicate the years of employment in:
• 1-5 years
• 6-10 years
• 11-15 years
• 16-20 years
• 21-25 years
• 26-30 years
• 31 and above years
If you have any questions, feedback or something to add, please feel free to use the text box below:
If you are interested in receiving a copy of the survey results, please leave your email address in the
field below:
Thank you for taking the survey. Your response is highly appreciated.

66
10.2. Appendix: Personalized email invitation to participate in the research
(Text removed for confidentiality purposes)
10.3. Appendix: Reminder to participate in the research
(Text removed for confidentiality purposes)

67
10.4. Appendix: Factor analysis – Scree plot

68
10.5. Appendix: Logistic regression – Observed Groups and Predicted Probabilities
Step number: 1
Observed Groups and Predicted Probabilities
16 + +
I I
I I
F I I
R 12 + +
E I I
Q IU I
U IU I
E 8 +U +
N IU I
C IU I
Y IU I
4 +U U S +
IUU U U S S S S S SI
IUU SU USU U U S S S S S S S S SSSSSSI
IUUUUU U U U UUU UU U S UU UU U S US UU U SS U U U S S SS UUU S S S SS SSSSS SSSS USUSSSI
Predicted ---------+---------+---------+---------+---------+---------+---------+---------+---------+----------
Prob: 0 ,1 ,2 ,3 ,4 ,5 ,6 ,7 ,8 ,9 1
Group: UUUUUUUUUUUUUUUUUUUUUUUUUUUUUUUUUUUUUUUUUUUUUUUUUUSSSSSSSSSSSSSSSSSSSSSSSSSSSSSSSSSSSSSSSSSSSSSSSSSS
Predicted Probability is of Membership for Successful bid
The Cut Value is ,50
Symbols: U - Unsuccessful bid
S - Successful bid
Each Symbol Represents 1 Case.

69
10.6. Appendix: Logistic regression – ROC curve