Embed Size (px)
Citation preview

Seediscussions,stats,andauthorprofilesforthispublicationat:https://www.researchgate.net/publication/290996133
Massiveandprolongeddeepcarbonemissionsassociatedwithcontinentalrifting
ARTICLEinNATUREGEOSCIENCE·JANUARY2016
ImpactFactor:11.74·DOI:10.1038/NGEO2622
READS
96
7AUTHORS,INCLUDING:
MuirheadJamesD.
UniversityofIdaho
17PUBLICATIONS56CITATIONS
SEEPROFILE
CindyEbinger
UniversityofRochester
202PUBLICATIONS5,783CITATIONS
SEEPROFILE
SimonA.Kattenhorn
ConocoPhillips
212PUBLICATIONS670CITATIONS
SEEPROFILE
ZacharySharp
UniversityofNewMexico
29PUBLICATIONS1,384CITATIONS
SEEPROFILE
Allin-textreferencesunderlinedinbluearelinkedtopublicationsonResearchGate,
lettingyouaccessandreadthemimmediately.
Availablefrom:MuirheadJamesD.
Retrievedon:03February2016

LETTERSPUBLISHED ONLINE: 18 JANUARY 2016 | DOI: 10.1038/NGEO2622
Massive and prolonged deep carbon emissionsassociated with continental riftingHyunwoo Lee1*, James D. Muirhead2, Tobias P. Fischer1, Cynthia J. Ebinger3, Simon A. Kattenhorn2,4,Zachary D. Sharp1 and Gladys Kianji5
Carbon from Earth’s interior is thought to be released tothe atmosphere mostly via degassing of CO2 from activevolcanoes1–4. CO2 can also escape along faults away fromactive volcanic centres, but such tectonic degassing is poorlyconstrained1. Here we use measurements of di�use soil CO2,combined with carbon isotopic analyses to quantify the fluxof CO2 through fault systems away from active volcanoes inthe East African Rift system. We find that about 4Mt yr−1 ofmantle-derived CO2 is released in the Magadi–Natron Basin,at the border between Kenya and Tanzania. Seismicity atdepths of 15–30 km implies that extensional faults in thisregion may penetrate the lower crust. We therefore suggestthat CO2 is transferred from upper-mantle or lower-crustalmagma bodies along these deep faults. Extrapolation of ourmeasurements to the entire Eastern rift of the rift systemimplies a CO2 flux on the order of tens of megatonnes peryear, comparable to emissions from the entire mid-oceanridge system2,3 of 53–97Mt yr−1. We conclude that widespreadcontinental rifting and super-continent breakup could producemassive, long-termCO2 emissions and contribute to prolongedgreenhouse conditions like those of the Cretaceous.
Emissions of mantle-derived CO2 are thought to be sourcedprimarily at volcanic centres, where it is currently estimated that∼90% of Earth’s natural CO2 is released through active degassingof volcanic plumes or passive, diffuse emissions around volcanicedifices, mid-ocean ridges, and volcanic lakes1–4. One major sourceof discrepancy in global flux estimates relates to sparse samplingof diffuse CO2 flux in fault systems away from volcanic centres5.These areas of tectonic degassing (for example, the Apennines, Italy;ref. 6) exhibit high surface CO2 fluxes sourced from deep magmabodies, yet have no expression of recently active volcanism (such ascomposite volcanoes or calderas, see Supplementary Information).Although magma-rich continental rifts (for example, the EastAfrican and Rio Grande rifts) represent prime targets to testand quantify this mode of CO2 transfer, gross estimates of CO2flux within areas of tectonic degassing are currently restricted toonly a few localities globally (Italy and the Pacific Rim; refs 5,6).Consequently, global CO2 flux from natural systems is likely tobe underestimated5.
The East African Rift (EAR) is the world’s largest activecontinental rift, comprising distinct western and eastern sectorswith a cumulative length of >3,000 km (ref. 7). Active volcanoes inthe EAR, such as Nyiragongo (≥3.4Mt yr−1; ref. 8) and OldoinyoLengai (2.42Mt yr−1; ref. 9), emit large volumes of CO2 and
significant amounts of CO2 are stored in large anoxic lakes (forexample, Lake Kivu; ref. 10). Fault systems dissecting active volcaniccentres in the EAR (such as the Aluto complex, Ethiopia) havebeen shown to provide local pathways through which CO2-richfluids are transported from shallowly degassing magma chambers11.However, earthquake swarms spanning the crustal depth range,interpreted as the release and rise of CO2-rich fluids through faults,are also observed in EAR basins away from active volcanic centres(for example, Albertine basin; ref. 12). Despite these findings, nostudy has tested the volumetric capacity of rift-wide fault systemsin the EAR to transport deeply derived CO2. Here we providestrong evidence that significant volumes of CO2, probably sourcedfrom upper mantle and/or lower crustal magma bodies, are emittedthrough fault systems positioned away from active volcanic centresin the EAR.
The volume of CO2 released diffusively at any volcanic-tectonicsetting can be estimated from soil CO2 flux measurements, whereasCO2 sources (mantle and/or biogenic, for example) may becharacterized by carbon isotope compositions13,14. We investigateddiffuse CO2 emissions within fault populations in the Magadi–Natron basin at the Kenya–Tanzania border (Fig. 1 and Table 1).Diffuse CO2 flux was measured with an accumulation chamber13 atthe base of fault scarps (termed here fault zones) and compared withbackground values in hanging walls and footwalls across horst andgraben structures (see Supplementary Information). Gas sampleswere collected by diverting gas from the chamber into pre-evacuatedglass vials during fluxmeasurements15. These sampleswere analysedin the laboratory for δ13C-CO2 (h) and CO2 concentrations, andcompared with samples collected on Oldoinyo Lengai, an activevolcano at the southern terminus of the Natron basin (Fig. 1a).Seismicity data were collected on the 38-stationCRAFTI broadbandseismic array (see Methods).
Carbon isotope compositions indicate a strong mantlecontribution to the observed CO2 (Fig. 2). Measured δ13C-CO2values range from −3.8 to −11.7h with a mean value of−8.0± 1.3h (Table 1), and 78% of values fall within the mantlerange (−6.5 ± 2.5h; ref. 16). All δ13C-CO2 values are distinctivelyheavier than biogenic δ13C values from soil CO2 studies alongtransform plate boundaries elsewhere, such as the San Andreasfault (−21.6 to −23.7h; ref. 14). Although two samples havesimilar δ13C-CO2 values (−3.8h and −4.3h, respectively) tofumaroles on Oldoinyo Lengai volcano (−2.36 to−4.01h; ref. 17),they are within the range of isotope values from mantle-derivedCO2 collected in volcanic and geothermal areas in the Kenya rift
1Department of Earth and Planetary Sciences, University of New Mexico, Albuquerque, New Mexico 87131-0001, USA. 2Department of GeologicalSciences, University of Idaho, Moscow, Idaho 83844-3022, USA. 3Department of Earth and Environmental Sciences, University of Rochester, Rochester,New York 14627, USA. 4ConocoPhillips, Houston, Texas 77079, USA. 5Department of Geology, Chiromo Campus, University of Nairobi,PO Box 30197-00100, GPO Nairobi, Kenya. *e-mail: [email protected]
NATURE GEOSCIENCE | ADVANCE ONLINE PUBLICATION | www.nature.com/naturegeoscience 1© 2016 Macmillan Publishers Limited. All rights reserved.
LETTERS NATURE GEOSCIENCE DOI: 10.1038/NGEO2622
−30
−20
−10
0
0 20 40 60 80 100A A′
Ngurumanborderfault
Dep
th (k
m)
40
500 km
Eastern riftWestern rift
Indian Ocean
Magadi−Natron
Gulf of Aden
30
10
0
50b
B
Distance (km)
B′
Natronborderfault
−30
−20
−10
0
Dep
th (k
m)
Magadi
Natron
35.5
1.5
2.0
3.0
Latit
ude
(° S
)
Latit
ude
(° N
)
2.5
36.0Longitude (° E) Longitude (° E)
36.5a
c
A
A′
25 km
Oldoinyo Lengai
B
B′
Gelai
Suswa
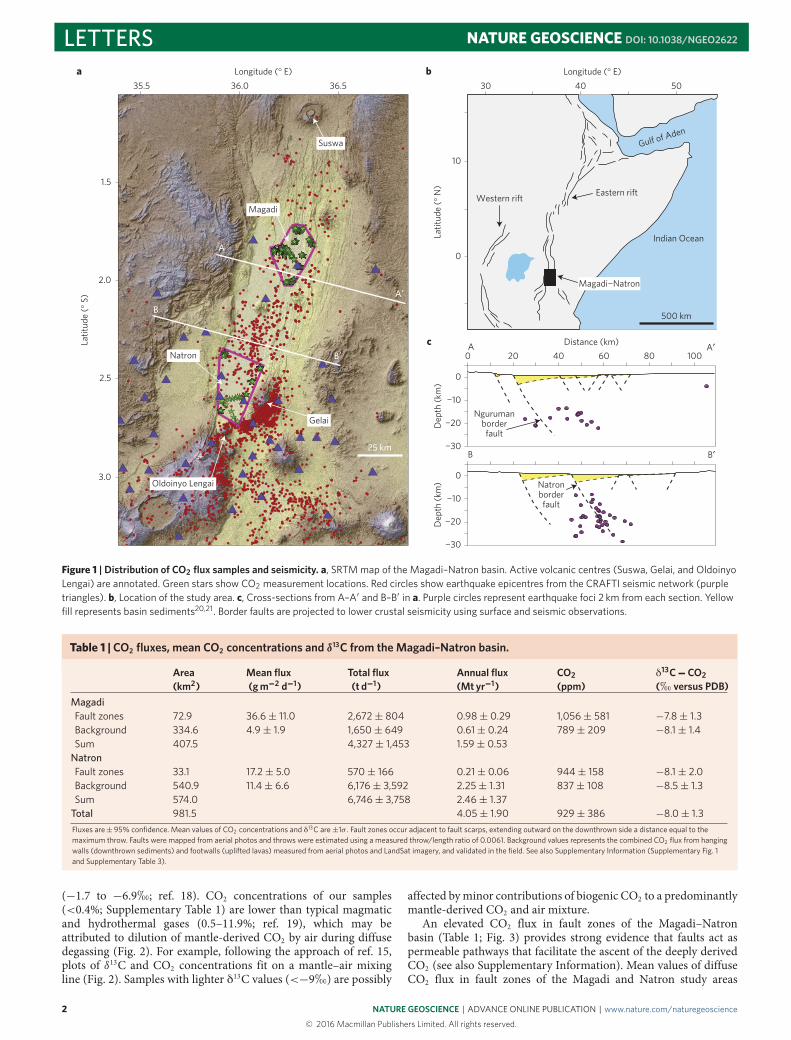
Figure 1 | Distribution of CO2 flux samples and seismicity. a, SRTM map of the Magadi–Natron basin. Active volcanic centres (Suswa, Gelai, and OldoinyoLengai) are annotated. Green stars show CO2 measurement locations. Red circles show earthquake epicentres from the CRAFTI seismic network (purpletriangles). b, Location of the study area. c, Cross-sections from A–A′ and B–B′ in a. Purple circles represent earthquake foci 2 km from each section. Yellowfill represents basin sediments20,21. Border faults are projected to lower crustal seismicity using surface and seismic observations.
Table 1 |CO2 fluxes, mean CO2 concentrations and δ13C from the Magadi–Natron basin.
Area Mean flux Total flux Annual flux CO2 δ13C−CO2(km2) (gm−2 d−1) (t d−1) (Mt yr−1) (ppm) (h versus PDB)
MagadiFault zones 72.9 36.6± 11.0 2,672± 804 0.98± 0.29 1,056± 581 −7.8± 1.3Background 334.6 4.9± 1.9 1,650± 649 0.61± 0.24 789± 209 −8.1± 1.4Sum 407.5 4,327± 1,453 1.59± 0.53
NatronFault zones 33.1 17.2± 5.0 570± 166 0.21± 0.06 944± 158 −8.1± 2.0Background 540.9 11.4± 6.6 6,176± 3,592 2.25± 1.31 837± 108 −8.5± 1.3Sum 574.0 6,746± 3,758 2.46± 1.37
Total 981.5 4.05± 1.90 929± 386 −8.0± 1.3Fluxes are±95% confidence. Mean values of CO2 concentrations and δ13C are±1σ . Fault zones occur adjacent to fault scarps, extending outward on the downthrown side a distance equal to themaximum throw. Faults were mapped from aerial photos and throws were estimated using a measured throw/length ratio of 0.0061. Background values represents the combined CO2 flux from hangingwalls (downthrown sediments) and footwalls (uplifted lavas) measured from aerial photos and LandSat imagery, and validated in the field. See also Supplementary Information (Supplementary Fig. 1and Supplementary Table 3).
(−1.7 to −6.9h; ref. 18). CO2 concentrations of our samples(<0.4%; Supplementary Table 1) are lower than typical magmaticand hydrothermal gases (0.5–11.9%; ref. 19), which may beattributed to dilution of mantle-derived CO2 by air during diffusedegassing (Fig. 2). For example, following the approach of ref. 15,plots of δ13C and CO2 concentrations fit on a mantle–air mixingline (Fig. 2). Samples with lighter δ13C values (<−9h) are possibly
affected byminor contributions of biogenic CO2 to a predominantlymantle-derived CO2 and air mixture.
An elevated CO2 flux in fault zones of the Magadi–Natronbasin (Table 1; Fig. 3) provides strong evidence that faults act aspermeable pathways that facilitate the ascent of the deeply derivedCO2 (see also Supplementary Information). Mean values of diffuseCO2 flux in fault zones of the Magadi and Natron study areas
2 NATURE GEOSCIENCE | ADVANCE ONLINE PUBLICATION | www.nature.com/naturegeoscience
© 2016 Macmillan Publishers Limited. All rights reserved.

NATURE GEOSCIENCE DOI: 10.1038/NGEO2622 LETTERS
Mantle
BiogenicCO2
Magadi
Natron
Oldoinyo Lengai
0 5 10 15 20 25 301/CO2 (×104 ppm−1)
−25
−20
−15
−10
−5
0
Air
Fumarole
(1)
(2)(3)δ13
C (%
)%
Figure 2 | Carbon isotope compositions and concentrations of di�use CO2in the Magadi–Natron basin. δ13C-CO2 versus the reciprocal of CO2concentration. Mantle δ13C values (red box) are−6.5± 2.5h (ref. 16). δ13Cvalues of fumaroles (yellow bar) are from ref. 17. Biogenic CO2 (green bar)ranges from−20 to−25h of δ13C (ref. 14). Values for air14 are representedby the black square. Arrows show mixing lines between mantle and air (1)biogenic CO2 and air (2), and mixtures of mantle/air and biogenic CO2 (3).
(36.6± 11.0 gm−2 d−1 and 17.2± 5.0 gm−2 d−1, respectively) arehigher than background values in graben sediments and upliftedrift lavas (Table 1). The highest individual CO2 flux measurements
(up to 533.5 gm−2 d−1) occur along large faults (throws >150m),which occasionally exhibit aligned hot springs along them (Fig. 3a).Some of these large faults bound the>2-km-deep rift basins20,21 andare underlain by lower crustal earthquake swarms (Fig. 1).
Diffuse CO2 flux from tectonic degassing in the Magadi andNatron basin study areas equates to estimated CO2 outputs of1.59 ± 0.53Mt yr−1 and 2.46 ± 1.37Mt yr−1, respectively (Table 1)(see Supplementary Information). These values represent tectonicdegassing of mantle-derived CO2 through fault systems away fromactive volcanic centres, and thus omit CO2 flux values fromvolcanoes at the northern (Suswa) and southern (Oldoinyo Lengai)extents of the Magadi–Natron basin. The combined study arearepresents only ∼10% of the entire 9,200 km2, pervasively faultedbasin area; therefore, our flux values represent a conservativeminimum estimate for the basin. Despite this cautious approach,the total CO2 flux from tectonic degassing along fault systems inthe Magadi–Natron basin is an order of magnitude greater thanthe mean diffuse CO2 flux of reported historically active volcanoes(0.21Mt yr−1; ref. 1; Supplementary Fig. 3). We acknowledge,however, that diffuse CO2 flux occurs passively over wide areas, andthus CO2 contributions from diffuse degassing at many volcanoesmay be underestimated as a result of sparse sampling and the largestudy areas required to accurately constrain the flux.
CO2 is extracted from the mantle by the generation and ascentof magma. It exsolves from magma during cooling, crystallizationand decompression. Where extensional fracture systems exist, as inrift zones, exsolved CO2 has a permeable network through whichit may rise to the surface1,12,22. Seismic and magnetotelluric studiesprovide evidence for volumetrically significant accumulations ofmagma trapped within the crust and upper mantle beneath theEastern rift20,23. Thesemagmabodies provide the probable source formassive CO2 emissions. Although CO2 in theMagadi–Natron basinmay in part be sourced by upper crustal dykes24, the flux of CO2 is
0
20
40
60
80
1001 10 100 1,000
Magadi soil CO2 flux (g m−2 d−1)
Cum
ulat
ive
freq
uenc
y (%
)
Cum
ulat
ive
freq
uenc
y (%
)
<0.23 1 10 100 1,000Natron soil CO2 flux (g m−2 d−1)
<0.23
Fault zone (n = 174)Hanging wall (n = 186)Footwall (n= 93)
d 0
20
40
60
80
100
Fault zone (n = 71)Hanging wall (n = 24)Footwall (n = 17)
c
250 m
Springs
a1.834
36.222Longitude (° E)
1.838
36.217
X
X’
0
40
80
120
160
0 200 400 600 800Distance (m)
CO2 fl
ux (g
m−2
d−1
)
X X′
580
620
660
700
Elevation (m)
High flux in fault zones
b
Latit
ude
(° S
)
Figure 3 | Summary of CO2 fluxes throughout the Magadi–Natron basin. a, Simplified structural map of a faulted graben in Magadi basin. Black linesrepresent faults and yellow stars the location of springs. b, Cross-section (X–X′ in a) showing the distribution of CO2 flux (red circles). c,d, Cumulativefrequency plots of di�use CO2 flux from all transects across faulted grabens in the study area. Hanging wall represents downthrown sediments, footwallsare uplifted lavas, and fault zones occur adjacent to fault scarps, extending outward on the downthrown side a distance equal to the maximum throw (referto Supplementary Information).
NATURE GEOSCIENCE | ADVANCE ONLINE PUBLICATION | www.nature.com/naturegeoscience 3© 2016 Macmillan Publishers Limited. All rights reserved.

LETTERS NATURE GEOSCIENCE DOI: 10.1038/NGEO2622
significant, and requires degassing from the large magma volumesin the crust and mantle (see also Supplementary Information).The association of mantle-derived CO2 and fault zones providescompelling evidence that CO2 released from these intrusions intorift-wide fault systems rivals degassing at rift volcanoes. Theseassertions are further supported by lower crustal earthquakes inthe region, which are shown at some rift settings to representthe transport of volatiles exsolved from upper-mantle12,22 and/orlower-crustal intrusions25. Well-located seismicity occurs at depthsof 15–27 km (Supplementary Fig. 2) and in some instances canbe projected along subsurface border faults26 (Fig. 1). Steep, rift-parallel zones of lower-crustal to near-surface earthquakes beneaththe central Magadi and Natron basins may also mark zones ofrepeated dyke intrusion within incipient magmatic segments (forexample, ref. 23; Fig. 1), providing a potential source for massiveCO2 emissions through rift-wide fault systems.
Although CO2 flux from tectonic degassing in theMagadi–Natron basin may be higher than other sectors, thegrowing evidence of CO2 degassing from even the magma-poorAlbertine system12 suggests the process may apply to other EARbasins. These considerations imply that faults in the EAR probablycontribute a significant portion of CO2 to the global budget. Weprovide first-order estimates of the total CO2 flux from tectonicdegassing in the Eastern rift using flux measurements from theMagadi–Natron basin (see also Supplementary Information).The ∼184 × 50 km Magadi–Natron basin emits a minimum of4.05±1.90Mt yr−1 of diffuse CO2 over its areal extent (Table 1),equating to a mean 4.4 × 10² t km−2 yr−1. If we applied this fluxto the 3,240 × 50 km Eastern rift7, we would obtain a value of71±33Mt yr−1 of CO2, which could potentially increase the globalflux fromnatural systems (637Mt yr−1; ref. 1) by 11% to 708Mt yr−1.Although this total CO2 flux represents only degassing along faultsystems away from volcanic centres, it is still of the same orderas the total CO2 output from mid-ocean ridges (53–97Mt yr−1;refs 2,3). The significance of these flux estimates highlights theimportant contributions of the East African Rift to the deep carboncycle, as well as the potential role of deeply derived fluids inassisting rift processes more generally (for example, lower crustalfaulting; refs 12,26). However, further diffuse CO2 surveys acrossfault systems in Tanzania, Kenya and Ethiopia are required to testwhether our flux estimates can be confidently applied to the entireEastern rift.
Understanding the causes of atmospheric CO2 variations overgeologic timescales is important for reconstructing Earth’s climate.For example, baseline greenhouse conditions of the Cretaceous toearly Palaeogene were characterized by 4–8 times higher pCO2than the Holocene, requiring a 2–2.8 times increase in globalCO2 input to the atmosphere27. The exact cause of this increaseis poorly constrained, although it has been linked previously toincreased rates in arc and/or flood basalt volcanism27,28. Our CO2emission estimates (tens of Mt yr−1) from tectonic degassing in theEAR show that long-lived (>5Myr) magma-assisted rifting couldproduce 104 GtMyr−1 of CO2, after an initial spike of ∼1Gt yr−1associated with flood basalt eruptions29,30. During the Cretaceousand Palaeogene, widespread flood basalt volcanism and continentalbreakup events occurred in association with the Greenland(60–53Ma), Deccan (65–60Ma), and Parana (138–125Ma) largeigneous provinces29. Based on our estimates, each of these riftingevents would be the equivalent of doubling current mid-ocean ridgeCO2 emissions and releasing 104 GtMyr−1 of greenhouse gases overthe lifetime of rifting. Although this may not be sufficient to achievethe required 4–8 times increase in atmospheric CO2 compared withthe Holocene, widespread continental rift formation, similar to therecently proposed ubiquitous continental arc volcanism27, providesa compelling and previously unquantified source of massive, long-term CO2 input to the atmosphere.
MethodsMethods and any associated references are available in the onlineversion of the paper.
Received 26 June 2015; accepted 26 November 2015;published online 18 January 2016
References1. Burton, M. R., Sawyer, G. M. & Granieri, D. Deep carbon emission from
volcanoes. Rev. Mineral. Geochem. 75, 323–354 (2013).2. Marty, B. & Tolstikhin, I. N. CO2 fluxes from mid-ocean ridges, arcs and
plumes. Chem. Geol. 145, 233–248 (1998).3. Kagoshima, T. et al . Sulphur geodynamic cycle. Sci. Rep. 5, 8330 (2015).4. Pérez, N. M. et al . Global CO2 emission from volcanic lakes. Geology 39,
235–238 (2011).5. Seward, T. M. & Kerrick, D. M. Hydrothermal CO2 emission from the
Taupo Volcanic Zone, New Zealand. Earth Planet. Sci. Lett. 139,105–113 (1996).
6. Chiodini, G. et al . Carbon dioxide Earth degassing and seismogenesis incentral and southern Italy. Geophys. Res. Lett. 31, L07615 (2004).
7. Ebinger, C. J. & Scholz, C. A. in Tectonics of Sedimentary Basins: RecentAdvances (eds Busby, C. & Azor, A.) Ch. 9 (John Wiley, 2012).
8. Sawyer, G. M., Carn, S. A., Tsanev, V. I., Oppenheimer, C. & Burton, M. R.Investigation into magma degassing at Nyiragongo volcano, DemocraticRepublic of the Congo. Geochem. Geophys. Geosyst. 9, Q02017 (2008).
9. Brantley, S. L. & Koepenick, K. W. Measured carbon dioxide emissions fromOldoinyo Lengai and the skewed distribution of passive volcanic fluxes.Geology 23, 933–936 (1995).
10. Pasche, N. et al . Methane sources and sinks in Lake Kivu. J. Geophys. Res. 116,G03006 (2011).
11. Hutchison, W., Mather, T. A., Pyle, D. M., Biggs, J. & Yirgu, G. Structuralcontrols on fluid pathways in an active rift system: a case study of the Alutovolcanic complex. Geosphere 11, 542–562 (2015).
12. Lindenfeld, M., Rumpker, G., Link, K., Koehn, D. & Batte, A. Fluid-triggeredearthquake swarms in the Rwenzori region, East African Rift—evidence for riftinitiation. Tectonophysics 566, 95–104 (2012).
13. Chiodini, G. et al . Carbon isotopic composition of soil CO2 efflux, a powerfulmethod to discriminate different sources feeding soil CO2 degassing involcanic hydrothermal areas. Earth Planet. Sci. Lett. 274, 372–379 (2008).
14. Lewicki, J. L. & Brantley, S. L. CO2 degassing along the San Andreas fault,Parkfield, California. Geophys. Res. Lett. 27, 5–8 (2000).
15. Parks, M. M. et al . Distinguishing contributions to diffuse CO2 emissions involcanic areas from magmatic degassing and thermal decarbonation using soilgas 222Rn–δ13C systematics: application to Santorini volcano, Greece. EarthPlanet. Sci. Lett. 377–378, 180–190 (2013).
16. Sano, Y. & Marty, B. Origin of carbon in fumarolic gas from island arcs. Chem.Geol. 119, 265–274 (1995).
17. Fischer, T. P. et al . Upper mantle volatile chemistry at Oldoinyo Lengai volcanoand the origin of carbonatites. Nature 459, 77–80 (2009).
18. Darling, W. G., Greisshaber, E., Andrews, J. N., Armannsson, H. & O’Nions, R.K. The origin of hydrothermal and other gases in the Kenya Rift Valley.Geochim. Cosmochim. Acta 59, 2501–2512 (1995).
19. Fischer, T. P. & Chiodini, G. in The Encyclopedia of Volcanoes(eds Sigurdsson, H., Houghton, B., McNutt, S., Rymer, H. & Stix, J.) Ch. 45(Academic, 2015).
20. Birt, C. S. et al . The influence of pre-existing structures on the evolution of thesouthern Kenya rift valley—evidence from seismic and gravity studies.Tectonophysics 278, 211–242 (1997).
21. Foster, A., Ebinger, C., Mbede, E. & Rex, D. Tectonic development of thenorthern Tanzanian sector of the east African rift system. J. Geol. Soc. 154,689–700 (1997).
22. Reyners, M., Eberhart-Phillips, D. & Stuart, G. The role of fluids inlower-crustal earthquakes near continental rifts. Nature 446, 1075–1079 (2007).
23. Keranen, K., Klempere, S. & Gloaguen, R. EAGLEWorking Group, Threedimensional seismic imaging of a proto-ridge axis in the Main Ethiopian Rift.Geology 39, 949–952 (2004).
24. Calais, E. et al . Aseismic strain accommodation by slow slip and dyking in ayouthful continental rift, East Africa. Nature 456, 783–787 (2008).
25. Keir, D. et al . Lower crustal earthquakes near the Ethiopian rift induced bymagmatic processes. Geochem. Geophys. Geosyst. 10, Q0AB02 (2009).
26. Albaric, J., Déverchère, J., Perrot, J., Jakovlev, A. & Deschamps, A. Deep crustalearthquakes in North Tanzania, East Africa: interplay between tectonic andmagmatic processes in an incipient rift. Geochem. Geophys. Geosyst. 15,374–394 (2014).
27. Lee, C.-T. A. et al . Continental arc–island arc fluctuations, growth of crustalcarbonates, and long-term climate change. Geosphere 9, 1–36 (2013).
4 NATURE GEOSCIENCE | ADVANCE ONLINE PUBLICATION | www.nature.com/naturegeoscience
© 2016 Macmillan Publishers Limited. All rights reserved.

NATURE GEOSCIENCE DOI: 10.1038/NGEO2622 LETTERS28. Kidder, D. L. & Worsley, T. R. Phanerozoic Large Igneous Provinces (LIPs),
HEATT (Haline Euxinic Acidic Thermal Transgression) episodes, and massextinctions. Palaeogeogr. Palaeoclimatol. Palaeoecol. 295, 162–191 (2010).
29. Courtillot, V., Jaupart, C., Manighetti, I., Tapponnier, P. & Besse, J. On causallinks between flood basalts and continental breakup. Earth Planet. Sci. Lett.166, 177–195 (1999).
30. Self, S., Widdowson, M., Thordarson, T. & Jay, A. E. Volatile fluxes during floodbasalt eruptions and potential effects on the global environment: a Deccanperspective. Earth Planet. Sci. Lett. 248, 518–532 (2006).
AcknowledgementsThis work was funded by the NSF EAR Tectonics Program, grant numbers 1113066(T.P.F.), 1113355 (C.J.E.), and 1113677 (S.A.K.). Additional support was provided byFulbright New Zealand (J.D.M.). CNRS and INSU-supported CoLIBREA project (C.J.E.).We thank the Tanzania COSTECH and the Kenyan National Council for Science andTechnology for granting research permits. We acknowledge M. Songo and the NelsonMandela African Institute of Science and Technology for support. Aerial photographswere provided by the Polar Geospatial Center, University of Minnesota. Aster GDEM is aproduct of METI and NASA. We gratefully acknowledge support from the Center forStable Isotopes, UNM. We thank N. Thomas, S. Goldstein, K. Lehnert, B. Onguso,M. Maqway, K. Kimani and the Masai people for help during fieldwork, and
A. Van Eaton for helpful comments. We also thank A. Weinstein for earthquakedepth analyses, and N. Thomas for entering the geochemical data into the IEDAEarthChem Library.
Author contributionsH.L., J.D.M., T.P.F. and S.A.K. planned the field campaign to the Magadi–Natron basin;H.L., J.D.M., T.P.F., C.J.E. and G.K. carried out the field work; H.L., J.D.M., T.P.F. and G.K.conducted CO2 flux measurement and collected gas samples; H.L. carried out gaschemistry and carbon isotope analyses; J.D.M. and S.A.K. performed fault analyses toestimate total CO2 flux; C.J.E. analysed broadband seismic data; Z.D.S. supported carbonisotope analyses at the Center for Stable Isotopes, University of NewMexico; H.L., J.D.M.,T.P.F., C.J.E. and S.A.K. collaboratively wrote the paper.
Additional informationSupplementary information is available in the online version of the paper. Reprints andpermissions information is available online at www.nature.com/reprints.Correspondence and requests for materials should be addressed to H.L.
Competing financial interestsThe authors declare no competing financial interests.
NATURE GEOSCIENCE | ADVANCE ONLINE PUBLICATION | www.nature.com/naturegeoscience 5© 2016 Macmillan Publishers Limited. All rights reserved.
LETTERS NATURE GEOSCIENCE DOI: 10.1038/NGEO2622
MethodsCO2 gas accumulation chamber method. The diffuse CO2 flux survey wasperformed using the accumulation chamber method described in detail by ref. 31.We used an EGM-4 CO2 Gas Analyzer (PP Systems), which has a cylindricalchamber with a volume of 1.18× 10⁻³ m3, and an infrared gas analyser with ameasurement range of 0–30,000 ppm and<1% error. For each field measurement,the accumulation chamber was pressed firmly into the ground (∼2 cm deep) toform a tight seal. Diffuse CO2 flux was then calculated in the field based on changesin CO2 concentration (ppm) through time over a 120 s time period.
Field sampling strategy. Owing to the large number of fault systems and eruptivecentres in the 184 km-long, 50 km-wide Magadi–Natron basin system, weemployed a modified version of the dense grid sampling approach for small sampleareas (1–20 km2; refs 13,32). In contrast to these studies, our analyses focused onunderstanding CO2 flux with respect to the location of visible faults (see alsoSupplementary Information). Where access allowed, CO2 flux measurements weretaken along 500–4,000m-long transects either parallel or perpendicular to faultstrike, with sample spacing varying between 20 and 200m depending on the lengthof the transect. In addition to targeting faults, broad transects (4,000–20,000mlong) were taken across the Magadi and Natron basins, with sample spacingbetween 400 and 4,000m. In total, 565 flux measurements were taken over the960 km2 survey area during 18 days of field work in June and July, 2014.
Laboratory analyses of gas compositions and C isotopes.We collected 115 gassamples, each with an accompanying duplicate sample, for isotope analyses in theMagadi–Natron basin and on Oldoinyo Lengai volcano (Supplementary Table 1 inSupplementary Information). CO2 concentrations and δ13C values were assessedusing the method of ref. 15. A T-shaped connector, attached to the gas analyser, wasused to divert gas into pre-evacuated Labco 12 ml Borosilicate Vials during fluxmeasurements. CO2 concentrations in the vials were determined at the Universityof New Mexico (UNM) by a Gow-Mac series G-M 816 Gas Chromatograph (GC)and a Pfeiffer Quadrupole Mass Spectrometer (QMS), which has a mass range from0 to 120 AMU. The Volcanic and Geothermal Fluid Analysis Laboratory (UNM)has a combination system of GC and QMS that enables measurement of gas speciesat the same time. Relative abundances of CO2, CH4, H2, Ar+O2, N2, and CO in thevials were measured on the GC using a He carrier gas. Gas species were separatedon the GC using a Hayes Sep pre-column and 5Å molecular sieve columns. Adischarge ionization detector was used for CO2, CH4, H2, Ar+ O2, N2 and CO,respectively33. He, Ar, O2, and N2 in the vials were also analysed for their relativeabundances on the QMS with a secondary electron multiplier detector in dynamicmode. These data were processed using the Quadstar software, which correctspossible mass interferences34. Combining the data from GC and QMS, the relativeabundances of CO2, CH4, H2, Ar, O2, N2 and CO were acquired (see SupplementaryInformation). Our δ13C-CO2 values were measured by Isotope Ratio MassSpectrometer (Finnigan Delta XL) with a gas bench and auto-sampler at the Centerfor Stable Isotopes, UNM (see Supplementary Information). The δ13C-CO2 valuesare presented as per mil (h) against the standard, Pee Dee belemnite (PDB). Onlyδ13C-CO2 values that have higher peak amplitudes of mass 44 (906–10,111mV)than blank tests (average of 805mV) were taken. Using the Oztech isotope ratioreference gas, the standard error of analyses is±0.2h (1σ ). All reported CO2 dataare presented in the main text and Supplementary Information.
Analysis of broadband seismic data. Continuous waveforms from the 38-stationCRAFTI (Continental Rifting in Africa: Fluid-Tectonic Interaction) broadbandseismic array and GEOFON stations KMBO and KIBK in Kenya were analysedusing the Seismic Handler Motif (SHM) program35 (Supplementary Fig. 1). P- andS-wave arrival times were picked manually on Butterworth filtered (1–10Hz)vertical and horizontal components. P phase arrival times were assigned qualityfactors of 0, 1, 2 or 3 according to estimated measurement errors of 0.05 s, 0.1 s,
0.15 s, and 0.3 s, respectively. S-wave quality factors of 0, 1, 2, and 3 were assignedto arrivals with estimated measurement errors of 0.1 s, 0.175 s, 0.25 s, and 0.3 s,respectively. Only events with a minimum of 6 phases, including at least 3P-arrivals, were used in the locations; most events had 20 or more phases. Theinitial locations of earthquakes were found assuming the local velocity model ofref. 36 and using a hypoinverse absolute location algorithm37. Progressive GPStiming failures at 32 sites led to changing the network in January and February2013 and then a gap between March and January 2014. Data used in this study(3,274 events) span 13 January–28 February 2013, and 15 December 2013 to1 November, 2014. Excluding a few mine blast events and earthquakes at OldoinyoLengai volcano, earthquakes are tectonic with impulsive P- and S-arrivals and peakfrequencies>5Hz. Earthquakes presented along profiles A–A′ and B–B′ representa small, representative proportion of Magadi–Natron data set, consistent withdepth histograms of all Natron and Magadi basin earthquakes, which showsignificant populations at depths between 15 and 27 km (Supplementary Fig. 2). Asubset of these earthquakes was relocated using a 3D tomography model of thestudy area38. Depth histograms for earthquakes in the Natron and Magadi basins(excluding Gelai volcano) and those relocated from the 3D tomography modelshow no systematic variations (Supplementary Fig. 2). The same earthquakes wererelocated using the double difference algorithm of ref. 39. Double differencelocations for earthquakes along A–A′ and B–B′ have formal position errors of≤1.5 km and depth errors ≤3.9 km determined by singular value decomposition(errors increase with depth), with additional but small errors associated with 3Dvelocity variations. Local magnitudes range between 1 and 4.5.
Data availability. The locations, compositions, C isotope values, and structuraldivisions of measured gas samples from the studied areas are available inSupplementary Information or URL: http://dx.doi.org/10.1594/IEDA/100561.
References31. Chiodini, G., Cioni, R., Guidi, M., Raco, B. & Marini, L. Soil CO2 flux
measurements in volcanic and geothermal areas. Appl. Geochem. 13,543–552 (1998).
32. Werner, C. & Cardellini, C. Comparison of carbon dioxide emissions with fluidupflow, chemistry, and geologic structures at the Rotorua geothermal system,New Zealand. Geothermics 35, 221–238 (2006).
33. Giggenbach, W. F. & Goguel, R. L.Methods for The Collection and Analysis ofGeothermal and Volcanic Water and Gas Samples Tech. Rep. CD2401(Department of Scientific and Industrial Research, Institute of Geological andNuclear Sciences, New Zealand, 1989).
34. de Moor, J. M. et al . Gas chemistry and nitrogen isotope compositions of coldmantle gases from Rungwe Volcanic Province, southern Tanzania. Chem. Geol.339, 30–42 (2013).
35. Stammler, K. SeismicHandler—programmable multichannel data handler forinteractive and automatic processing of seismological analysis. Comp. Geosci.19, 135–140 (1993).
36. Albaric, J. et al . Contrasted seismogenic and rheological behaviours fromshallow and deep earthquake sequences in the North Tanzanian Divergence,East Africa. J. Afr. Earth Sci. 58, 799–811 (2010).
37. Klein, F. W. Hypocenter Location Program HYPOINVERSE Tech. Rep. 78-698(US Geological Survey, 1978).
38. Roecker, S. et al . Images of the East Africa Rift System from the Joint Inversion ofBodywaves, Surfacewaves, and Gravity: Investigating the Role of Magma inEarly-stage Continental Rifting Am. Geophys. Union Fall Meeting T51G-3013107 (AGU, 2015).
39. Waldhauser, F. & Ellsworth, W. A double-difference earthquake locationalgorithm: method and application to the northern Hayward fault, California.Bull. Seismol. Soc. Am. 90, 1353–1368 (2000).
NATURE GEOSCIENCE | www.nature.com/naturegeoscience
© 2016 Macmillan Publishers Limited. All rights reserved.