Embed Size (px)
Citation preview
Massachusetts Early Warning Indicator System (EWIS) Technical Descriptions of Risk Model Development: Middle and High School Age Groupings (Grades 7-12) March 2013 Massachusetts Department of Elementary and Secondary Education & American Institutes for Research
Table of Contents Overview ....................................................................................................................................................... 1
Age Groups and Outcome Measures ........................................................................................................ 2
Risk Indicators ........................................................................................................................................... 2
Risk Levels ................................................................................................................................................. 3
Validating the Risk Models ........................................................................................................................ 3
Final Risk Model ........................................................................................................................................ 3
Middle School Age Group (Seventh through Ninth Grade) .......................................................................... 6
Potential Indicators ................................................................................................................................... 6
Analysis Methods and Strategies .............................................................................................................. 8
Seventh Grade: Analysis Results and Predicted Risk Levels ................................................................... 10
Seventh Grade: Simple Logistics – Analysis of Individual Indicators .................................................. 11
Seventh Grade: Overview of Risk Model ............................................................................................ 12
Seventh Grade: Illustration of Levels of Risk and Outcome Using the Final Model ........................... 14
Seventh Grade: Alternate Model for students without Course Performance .................................... 15
Eighth Grade: Analysis Results and Predicted Risk Levels ...................................................................... 16
Eighth Grade: Simple Logistics – Analysis of Individual Indicators ..................................................... 17
Eighth Grade: Final Risk Model ........................................................................................................... 18
Eighth Grade: Illustration of Levels of Risk and Outcome Using the Final Model .............................. 20
Eighth Grade: Alternate Model for students without Course Performance ....................................... 21
Ninth Grade: Analysis Results and Predicted Risk Levels........................................................................ 22
Ninth Grade: Simple Logistics – Analysis of Individual Indicators ...................................................... 23
Ninth Grade: Final Risk Model ............................................................................................................ 24
Ninth Grade: Illustration of Levels of Risk and Outcome Using the Final Model ............................... 26
Ninth Grade: Alternate Model for students without Course Performance ........................................ 27
High School Age Group (Grades 10 through 12) ......................................................................................... 31
Potential Indicators ................................................................................................................................. 31
Analysis Methods and Strategies ............................................................................................................ 34
Tenth Grade: Analysis Results and Predicted Risk Levels ....................................................................... 36
Tenth Grade: Simple Logistics – Analysis of Individual Indicators ...................................................... 37
Tenth Grade: Final Risk Model ............................................................................................................ 38
Tenth Grade: Illustration of Levels of Risk and Outcome Using the Final Model ............................... 40
Eleventh Grade: Analysis Results and Predicted Risk Levels .................................................................. 42
Eleventh Grade: Simple Logistics – Analysis of Individual Indicators ................................................. 43
Eleventh Grade: Final Risk Model ....................................................................................................... 44
Eleventh Grade: Illustration of Levels of Risk and Outcome Using the Final Model .......................... 46
Twelfth Grade: Analysis Results and Predicted Risk Levels .................................................................... 48
Twelfth Grade: Simple Logistics – Analysis of Individual Indicators ................................................... 49
Twelfth Grade: Final Risk Model ......................................................................................................... 50
Twelfth Grade: Illustration of Levels of Risk and Outcome Using the Final Model ............................ 52
Appendix ..................................................................................................................................................... 57
A.1 Seventh Grade: Alternate Risk Model- No Course Performance Data ......................................... 57
A.2 Eighth Grade: Alternate Risk Model – No Course Performance Data .......................................... 58
A.3 Ninth Grade: Alternate Risk Model- No Course Performance Data ............................................. 59
References .................................................................................................................................................. 60
1 | P a g e
Overview The Massachusetts Department of Elementary and Secondary Education (Department) created the grades 1-12 Early Warning Indicator System (EWIS) in response to district interest in the Early Warning Indicator Index (EWII) that the Department previously created for rising grade 9 students. Districts shared that the EWII data were helpful, but also requested early indicator data at earlier grade levels and throughout high school. The new EWIS builds on the strengths and lessons learned from the EWII to provide early indicator data for grades 1-12. The Department worked with American Institutes for Research (AIR) to develop the new risk models for the EWIS. AIR has extensive experience with developing early warning systems and supporting their use at the state and local levels. AIR conducted an extensive literature review of the research on indicators for early warning systems. AIR then identified and tested possible indicators for the risk models based on those recognized in the research and data that are collected and available from the Department’s data system. Because of limitations in the availability of data for children from birth through pre-kindergarten, the students from kindergarten through twelfth grade were the focus of EWIS statistical model testing. Massachusetts’ longitudinal data system allowed estimated probabilities of being at risk on the predefined outcome measures for students based on previous school years. The model for each grade level was tested and determined separately. While there are some common indicators across age groupings and grade levels, the models do vary by grade level. A team from ESE worked closely with AIR in determining the recommended models for each grade level and an agency-wide EWIs advisory group reviewed research findings and discussed key decisions. To develop the early elementary risk model, we used a multilevel modeling framework to control for the clustering of students within schools and obtain correct robust standard errors (Raudenbush & Bryk, 2002). To develop the late elementary, middle and high school risk models, we used a logistic regression modeling framework1. The model allows users to identify students who are at risk of missing key educational benchmarks (a.k.a. outcome variables) within the first through twelfth grade educational trajectory. The outcome variables by which students risk is tested took into consideration the degree to which the outcome variable is age and developmentally appropriate (e.g., achieving a score that is proficient or higher on the third grade English Language Arts in Massachusetts Comprehensive Assessment System). The following research questions guided the development of the EWIS statistical model that helps identify risk levels for individual students: What are the indicators (or combination of indicators) that predict whether are at risk of missing key educational benchmarks in Massachusetts that are above and beyond student demographic characteristics, based on predefined student clusters and appropriate outcome variables? Identification of at-risk students through the risk model developed for each age group served as the foundation of the EWIS, which aims to support practitioners in schools and districts to identify children/students who may be at risk. With this relevant and timely information, teachers, educators,
1 HGLM models were not able to be used in the middle school and high school age groups since development of these age groups relied on a sample of district student course data, and therefore could not estimate the statewide school random effects for prediction. The late elementary model was updated to use more recent assessment data and, due to time constraints, the logistical regression model was employed. As state data become available for the middle and high school models, ESE will consider the feasibility of HGLM for EWIS model development. ESE will also consider using HGLM for the late elementary models.
2 | P a g e
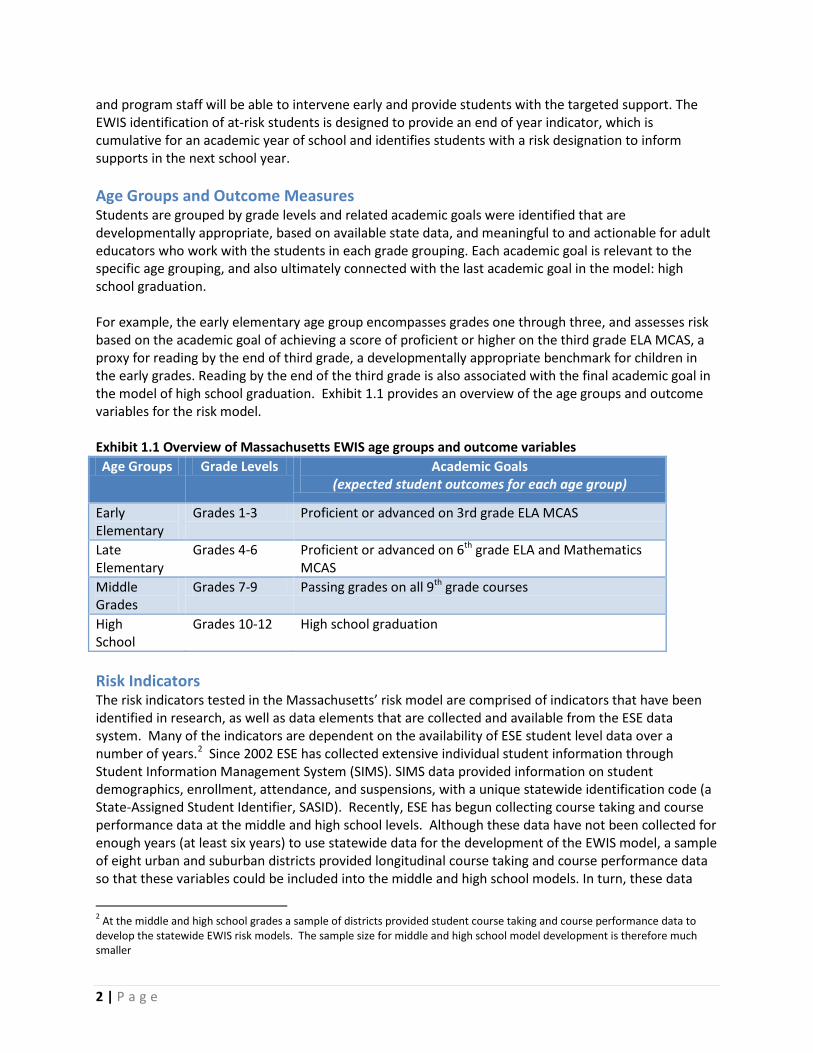
and program staff will be able to intervene early and provide students with the targeted support. The EWIS identification of at-risk students is designed to provide an end of year indicator, which is cumulative for an academic year of school and identifies students with a risk designation to inform supports in the next school year. Age Groups and Outcome Measures Students are grouped by grade levels and related academic goals were identified that are developmentally appropriate, based on available state data, and meaningful to and actionable for adult educators who work with the students in each grade grouping. Each academic goal is relevant to the specific age grouping, and also ultimately connected with the last academic goal in the model: high school graduation. For example, the early elementary age group encompasses grades one through three, and assesses risk based on the academic goal of achieving a score of proficient or higher on the third grade ELA MCAS, a proxy for reading by the end of third grade, a developmentally appropriate benchmark for children in the early grades. Reading by the end of the third grade is also associated with the final academic goal in the model of high school graduation. Exhibit 1.1 provides an overview of the age groups and outcome variables for the risk model. Exhibit 1.1 Overview of Massachusetts EWIS age groups and outcome variables Age Groups Grade Levels Academic Goals
(expected student outcomes for each age group)
Early Elementary
Grades 1-3 Proficient or advanced on 3rd grade ELA MCAS
Late Elementary
Grades 4-6 Proficient or advanced on 6th grade ELA and Mathematics MCAS
Middle Grades
Grades 7-9 Passing grades on all 9th grade courses
High School
Grades 10-12 High school graduation
Risk Indicators The risk indicators tested in the Massachusetts’ risk model are comprised of indicators that have been identified in research, as well as data elements that are collected and available from the ESE data system. Many of the indicators are dependent on the availability of ESE student level data over a number of years.2 Since 2002 ESE has collected extensive individual student information through Student Information Management System (SIMS). SIMS data provided information on student demographics, enrollment, attendance, and suspensions, with a unique statewide identification code (a State-Assigned Student Identifier, SASID). Recently, ESE has begun collecting course taking and course performance data at the middle and high school levels. Although these data have not been collected for enough years (at least six years) to use statewide data for the development of the EWIS model, a sample of eight urban and suburban districts provided longitudinal course taking and course performance data so that these variables could be included into the middle and high school models. In turn, these data
2 At the middle and high school grades a sample of districts provided student course taking and course performance data to develop the statewide EWIS risk models. The sample size for middle and high school model development is therefore much smaller
3 | P a g e
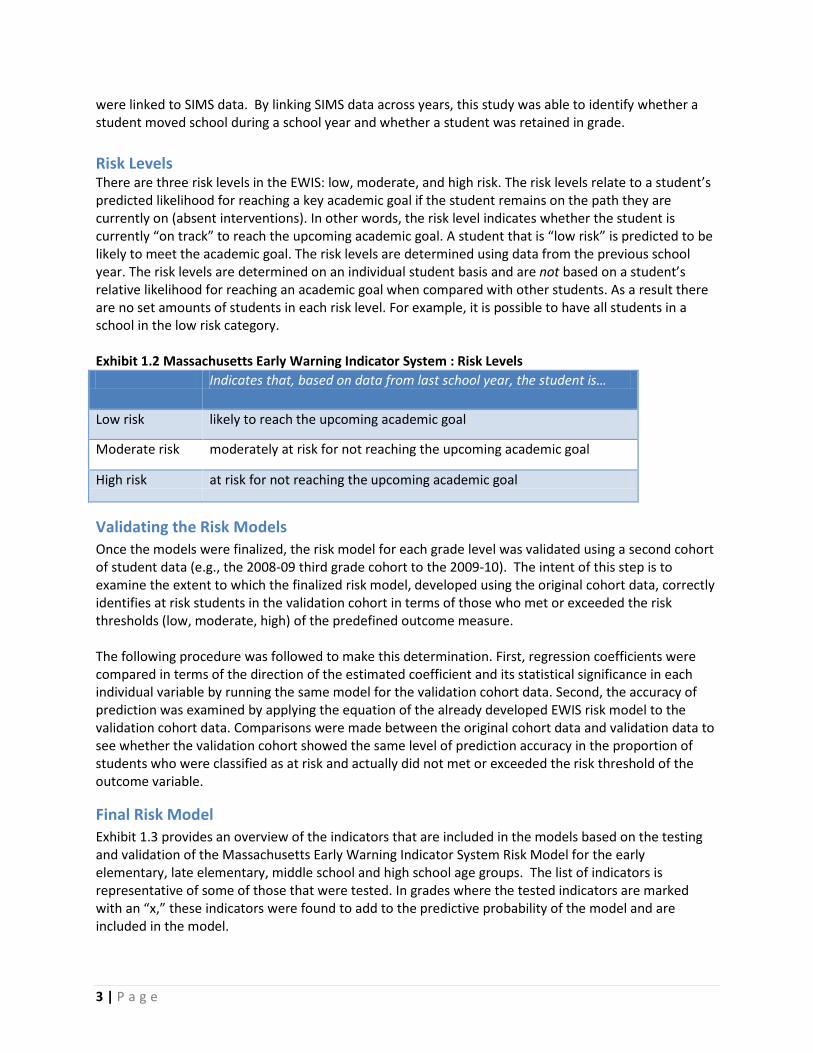
were linked to SIMS data. By linking SIMS data across years, this study was able to identify whether a student moved school during a school year and whether a student was retained in grade. Risk Levels There are three risk levels in the EWIS: low, moderate, and high risk. The risk levels relate to a student’s predicted likelihood for reaching a key academic goal if the student remains on the path they are currently on (absent interventions). In other words, the risk level indicates whether the student is currently “on track” to reach the upcoming academic goal. A student that is “low risk” is predicted to be likely to meet the academic goal. The risk levels are determined using data from the previous school year. The risk levels are determined on an individual student basis and are not based on a student’s relative likelihood for reaching an academic goal when compared with other students. As a result there are no set amounts of students in each risk level. For example, it is possible to have all students in a school in the low risk category. Exhibit 1.2 Massachusetts Early Warning Indicator System : Risk Levels Indicates that, based on data from last school year, the student is…
Low risk likely to reach the upcoming academic goal
Moderate risk moderately at risk for not reaching the upcoming academic goal
High risk at risk for not reaching the upcoming academic goal
Validating the Risk Models Once the models were finalized, the risk model for each grade level was validated using a second cohort of student data (e.g., the 2008-09 third grade cohort to the 2009-10). The intent of this step is to examine the extent to which the finalized risk model, developed using the original cohort data, correctly identifies at risk students in the validation cohort in terms of those who met or exceeded the risk thresholds (low, moderate, high) of the predefined outcome measure. The following procedure was followed to make this determination. First, regression coefficients were compared in terms of the direction of the estimated coefficient and its statistical significance in each individual variable by running the same model for the validation cohort data. Second, the accuracy of prediction was examined by applying the equation of the already developed EWIS risk model to the validation cohort data. Comparisons were made between the original cohort data and validation data to see whether the validation cohort showed the same level of prediction accuracy in the proportion of students who were classified as at risk and actually did not met or exceeded the risk threshold of the outcome variable.
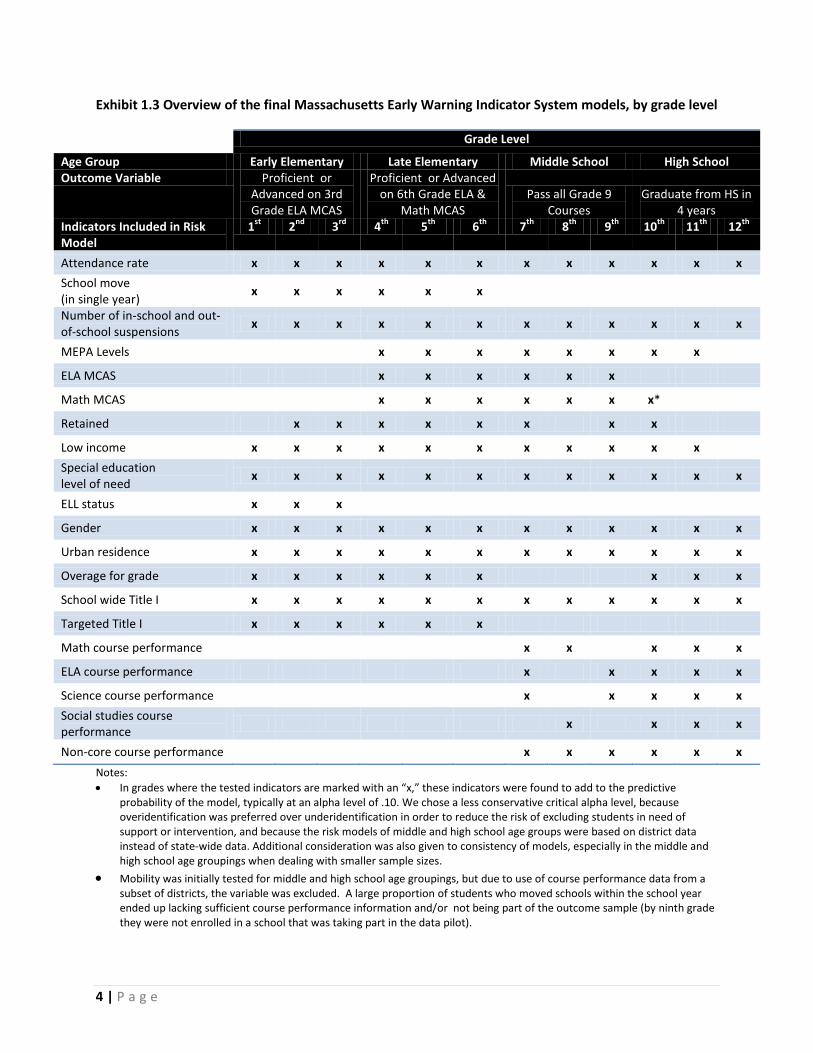
Final Risk Model Exhibit 1.3 provides an overview of the indicators that are included in the models based on the testing and validation of the Massachusetts Early Warning Indicator System Risk Model for the early elementary, late elementary, middle school and high school age groups. The list of indicators is representative of some of those that were tested. In grades where the tested indicators are marked with an “x,” these indicators were found to add to the predictive probability of the model and are included in the model.
4 | P a g e
Exhibit 1.3 Overview of the final Massachusetts Early Warning Indicator System models, by grade level
Grade Level
Age Group Early Elementary Late Elementary Middle School High School Outcome Variable Proficient or
Advanced on 3rd Grade ELA MCAS
Proficient or Advanced on 6th Grade ELA &
Math MCAS Pass all Grade 9
Courses Graduate from HS in
4 years Indicators Included in Risk Model
1st 2nd 3rd 4th 5th 6th 7th 8th 9th 10th 11th 12th
Attendance rate x x x x x x x x x x x x School move (in single year) x x x x x x
Number of in-school and out-of-school suspensions x x x x x x x x x x x x
MEPA Levels x x x x x x x x
ELA MCAS x x x x x x
Math MCAS x x x x x x x*
Retained x x x x x x x x
Low income x x x x x x x x x x x Special education level of need x x x x x x x x x x x x
ELL status x x x
Gender x x x x x x x x x x x x
Urban residence x x x x x x x x x x x x
Overage for grade x x x x x x x x x
School wide Title I x x x x x x x x x x x x
Targeted Title I x x x x x x
Math course performance x x x x x
ELA course performance x x x x x
Science course performance x x x x x Social studies course performance x x x x
Non-core course performance x x x x x x Notes: • In grades where the tested indicators are marked with an “x,” these indicators were found to add to the predictive
probability of the model, typically at an alpha level of .10. We chose a less conservative critical alpha level, because overidentification was preferred over underidentification in order to reduce the risk of excluding students in need of support or intervention, and because the risk models of middle and high school age groups were based on district data instead of state-wide data. Additional consideration was also given to consistency of models, especially in the middle and high school age groupings when dealing with smaller sample sizes.
• Mobility was initially tested for middle and high school age groupings, but due to use of course performance data from a subset of districts, the variable was excluded. A large proportion of students who moved schools within the school year ended up lacking sufficient course performance information and/or not being part of the outcome sample (by ninth grade they were not enrolled in a school that was taking part in the data pilot).
5 | P a g e
• Due to small sample in individual MEPA levels in middle and high school, final model aggregates MEPA levels beginner to intermediate as a single indicator, leaving transiting to regular classes and non-MEPA as 0 for this variable. The benefit of this strategy is that this indicator fits in the EWIS models with the current MEPA levels having 5 categories. Thus, the binary indicator of MEPA levels was used for many of the EWIS models.
• The 10th grade model (built using data from 9th grade students) uses the MCAS score from 8th grade since 9th grade is not a tested MCAS grade. ELA MCAS results were not available for use in 10th grade model due to available years of data. 8th grade ELA MCAS was first administered in 2006 and so could not be used in developing the model since data was not available for validation. This variable will be tested for inclusion in future years.
• Retention variable was not used as an indicator in high school age grouping, because the variable was directly related to the outcome benchmark in high schools, i.e., on-time graduation.
• Special education variable has 4 categories based on levels of need of special education: 1) Low- less than 2 hours, 2) Low - 2 or more hours, 3) Moderate, and 4) High. Each indicators denoting individual level of need were tested. However, due to data limitations with small sample sizes in middle and high school age grouping, the directions and magnitudes of the coefficients appeared inappropriate. Thus, we ended up using a binary indicator covering low to high levels of need (2 hours or more) in the middle and high school age group. We plan retesting individual indicators representing each level of need in special education when state-wide data are available.
• Overage for early elementary, late elementary and middle school is defined as one year older than the expected age for the grade level. For the high school, students two or more years older than expected grade level are considered overage.
• Due to data limitations with smaller sample size with middle and high school age groupings, Targeted Title I was miniminally represented, so only school wide Title I is in middle and high school age grouping models.
• Variables indicating whether a student did not enroll in or miss a certain subject (‘flagged’) were not tested in middle schools, because the numbers of students in falling in this category were too small (less than 2%).
6 | P a g e
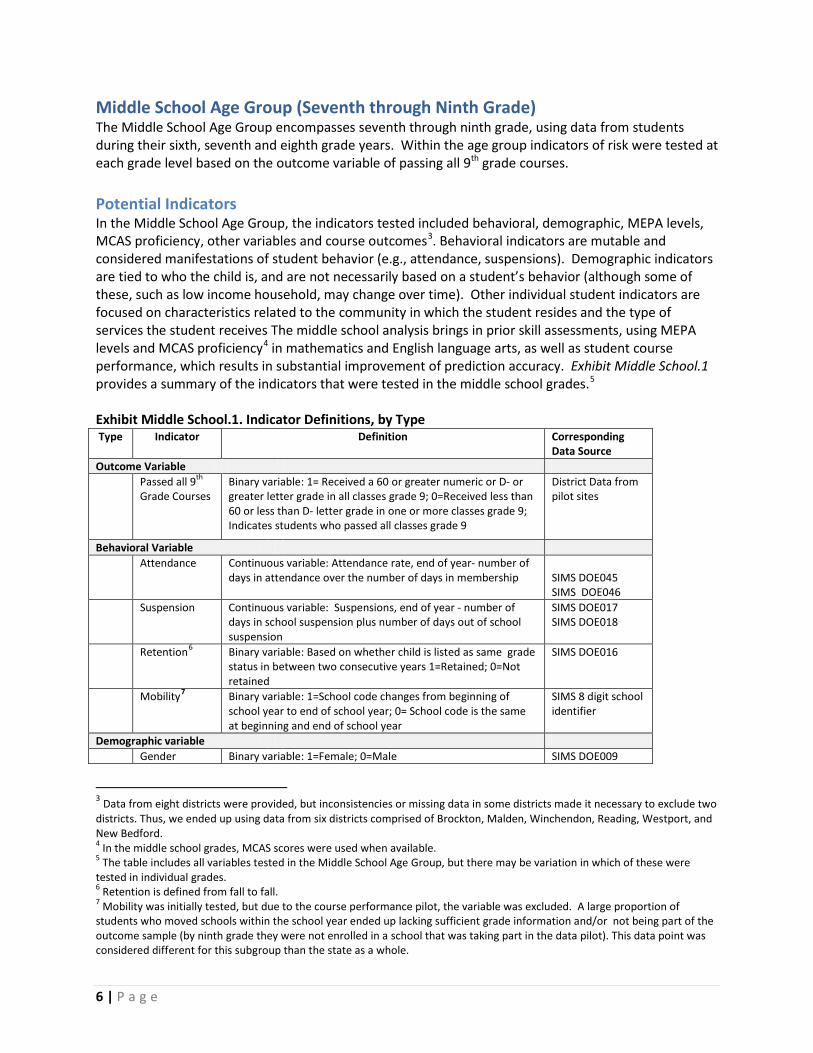
Middle School Age Group (Seventh through Ninth Grade) The Middle School Age Group encompasses seventh through ninth grade, using data from students during their sixth, seventh and eighth grade years. Within the age group indicators of risk were tested at each grade level based on the outcome variable of passing all 9th grade courses. Potential Indicators In the Middle School Age Group, the indicators tested included behavioral, demographic, MEPA levels, MCAS proficiency, other variables and course outcomes3. Behavioral indicators are mutable and considered manifestations of student behavior (e.g., attendance, suspensions). Demographic indicators are tied to who the child is, and are not necessarily based on a student’s behavior (although some of these, such as low income household, may change over time). Other individual student indicators are focused on characteristics related to the community in which the student resides and the type of services the student receives The middle school analysis brings in prior skill assessments, using MEPA levels and MCAS proficiency4 in mathematics and English language arts, as well as student course performance, which results in substantial improvement of prediction accuracy. Exhibit Middle School.1 provides a summary of the indicators that were tested in the middle school grades.5 Exhibit Middle School.1. Indicator Definitions, by Type Type Indicator Definition Corresponding
Data Source Outcome Variable Passed all 9th
Grade Courses Binary variable: 1= Received a 60 or greater numeric or D- or greater letter grade in all classes grade 9; 0=Received less than 60 or less than D- letter grade in one or more classes grade 9; Indicates students who passed all classes grade 9
District Data from pilot sites
Behavioral Variable Attendance
Continuous variable: Attendance rate, end of year- number of days in attendance over the number of days in membership
SIMS DOE045 SIMS DOE046
Suspension
Continuous variable: Suspensions, end of year - number of days in school suspension plus number of days out of school suspension
SIMS DOE017 SIMS DOE018
Retention6 Binary variable: Based on whether child is listed as same grade status in between two consecutive years 1=Retained; 0=Not retained
SIMS DOE016
Mobility7 Binary variable: 1=School code changes from beginning of school year to end of school year; 0= School code is the same at beginning and end of school year
SIMS 8 digit school identifier
Demographic variable Gender Binary variable: 1=Female; 0=Male SIMS DOE009
3 Data from eight districts were provided, but inconsistencies or missing data in some districts made it necessary to exclude two districts. Thus, we ended up using data from six districts comprised of Brockton, Malden, Winchendon, Reading, Westport, and New Bedford. 4 In the middle school grades, MCAS scores were used when available. 5 The table includes all variables tested in the Middle School Age Group, but there may be variation in which of these were tested in individual grades. 6 Retention is defined from fall to fall. 7 Mobility was initially tested, but due to the course performance pilot, the variable was excluded. A large proportion of students who moved schools within the school year ended up lacking sufficient grade information and/or not being part of the outcome sample (by ninth grade they were not enrolled in a school that was taking part in the data pilot). This data point was considered different for this subgroup than the state as a whole.
7 | P a g e
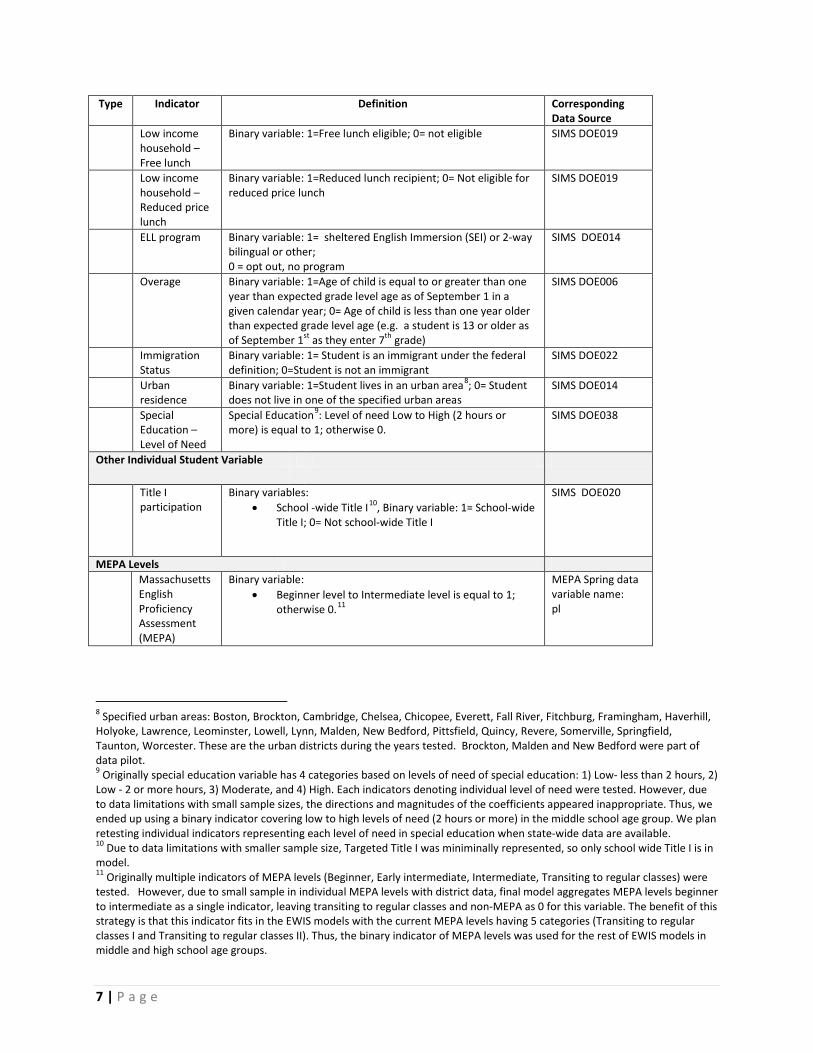
Type Indicator Definition Corresponding Data Source
Low income household – Free lunch
Binary variable: 1=Free lunch eligible; 0= not eligible SIMS DOE019
Low income household – Reduced price lunch
Binary variable: 1=Reduced lunch recipient; 0= Not eligible for reduced price lunch
SIMS DOE019
ELL program Binary variable: 1= sheltered English Immersion (SEI) or 2-way bilingual or other; 0 = opt out, no program
SIMS DOE014
Overage Binary variable: 1=Age of child is equal to or greater than one year than expected grade level age as of September 1 in a given calendar year; 0= Age of child is less than one year older than expected grade level age (e.g. a student is 13 or older as of September 1st as they enter 7th grade)
SIMS DOE006
Immigration Status
Binary variable: 1= Student is an immigrant under the federal definition; 0=Student is not an immigrant
SIMS DOE022
Urban residence
Binary variable: 1=Student lives in an urban area8; 0= Student does not live in one of the specified urban areas
SIMS DOE014
Special Education – Level of Need
Special Education9: Level of need Low to High (2 hours or more) is equal to 1; otherwise 0.
SIMS DOE038
Other Individual Student Variable
Title I participation
Binary variables: • School -wide Title I10, Binary variable: 1= School-wide
Title I; 0= Not school-wide Title I
SIMS DOE020
MEPA Levels Massachusetts
English Proficiency Assessment (MEPA)
Binary variable: • Beginner level to Intermediate level is equal to 1;
otherwise 0.11
MEPA Spring data variable name: pl
8 Specified urban areas: Boston, Brockton, Cambridge, Chelsea, Chicopee, Everett, Fall River, Fitchburg, Framingham, Haverhill, Holyoke, Lawrence, Leominster, Lowell, Lynn, Malden, New Bedford, Pittsfield, Quincy, Revere, Somerville, Springfield, Taunton, Worcester. These are the urban districts during the years tested. Brockton, Malden and New Bedford were part of data pilot. 9 Originally special education variable has 4 categories based on levels of need of special education: 1) Low- less than 2 hours, 2) Low - 2 or more hours, 3) Moderate, and 4) High. Each indicators denoting individual level of need were tested. However, due to data limitations with small sample sizes, the directions and magnitudes of the coefficients appeared inappropriate. Thus, we ended up using a binary indicator covering low to high levels of need (2 hours or more) in the middle school age group. We plan retesting individual indicators representing each level of need in special education when state-wide data are available. 10 Due to data limitations with smaller sample size, Targeted Title I was miniminally represented, so only school wide Title I is in model. 11 Originally multiple indicators of MEPA levels (Beginner, Early intermediate, Intermediate, Transiting to regular classes) were tested. However, due to small sample in individual MEPA levels with district data, final model aggregates MEPA levels beginner to intermediate as a single indicator, leaving transiting to regular classes and non-MEPA as 0 for this variable. The benefit of this strategy is that this indicator fits in the EWIS models with the current MEPA levels having 5 categories (Transiting to regular classes I and Transiting to regular classes II). Thus, the binary indicator of MEPA levels was used for the rest of EWIS models in middle and high school age groups.
8 | P a g e
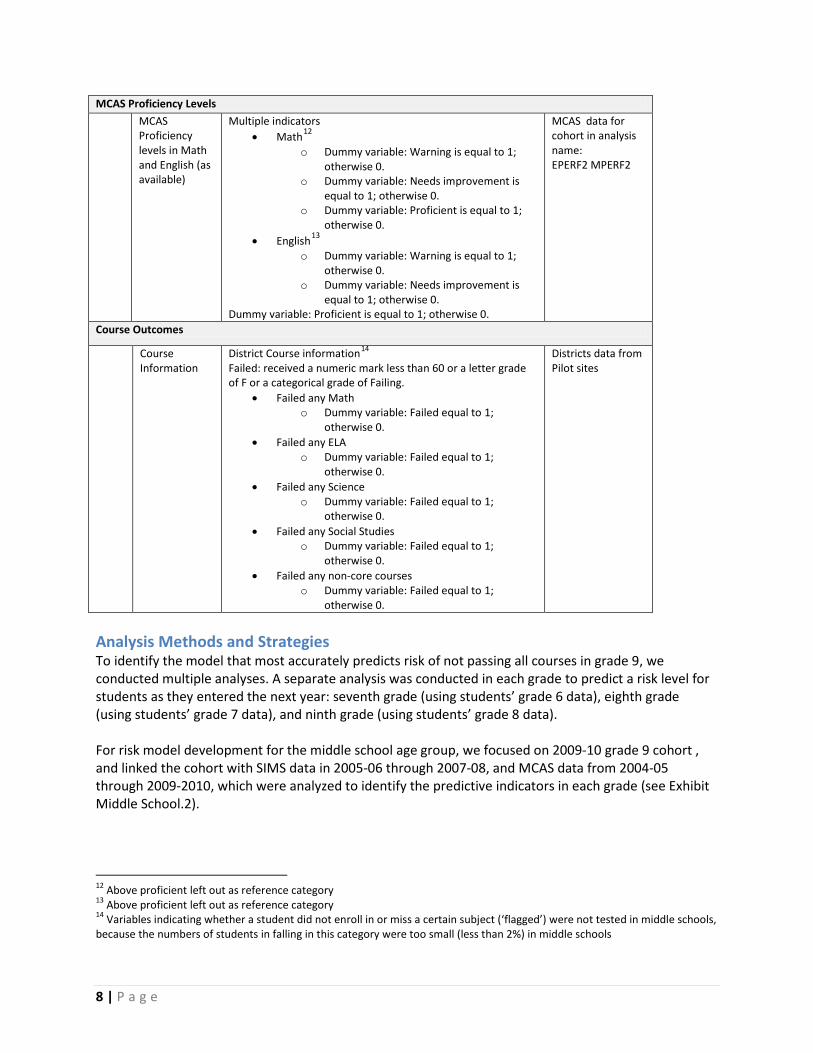
MCAS Proficiency Levels MCAS
Proficiency levels in Math and English (as available)
Multiple indicators • Math12
o Dummy variable: Warning is equal to 1; otherwise 0.
o Dummy variable: Needs improvement is equal to 1; otherwise 0.
o Dummy variable: Proficient is equal to 1; otherwise 0.
• English13 o Dummy variable: Warning is equal to 1;
otherwise 0. o Dummy variable: Needs improvement is
equal to 1; otherwise 0. Dummy variable: Proficient is equal to 1; otherwise 0.
MCAS data for cohort in analysis name: EPERF2 MPERF2
Course Outcomes
Course Information
District Course information14 Failed: received a numeric mark less than 60 or a letter grade of F or a categorical grade of Failing.
• Failed any Math o Dummy variable: Failed equal to 1;
otherwise 0. • Failed any ELA
o Dummy variable: Failed equal to 1; otherwise 0.
• Failed any Science o Dummy variable: Failed equal to 1;
otherwise 0. • Failed any Social Studies
o Dummy variable: Failed equal to 1; otherwise 0.
• Failed any non-core courses o Dummy variable: Failed equal to 1;
otherwise 0.
Districts data from Pilot sites
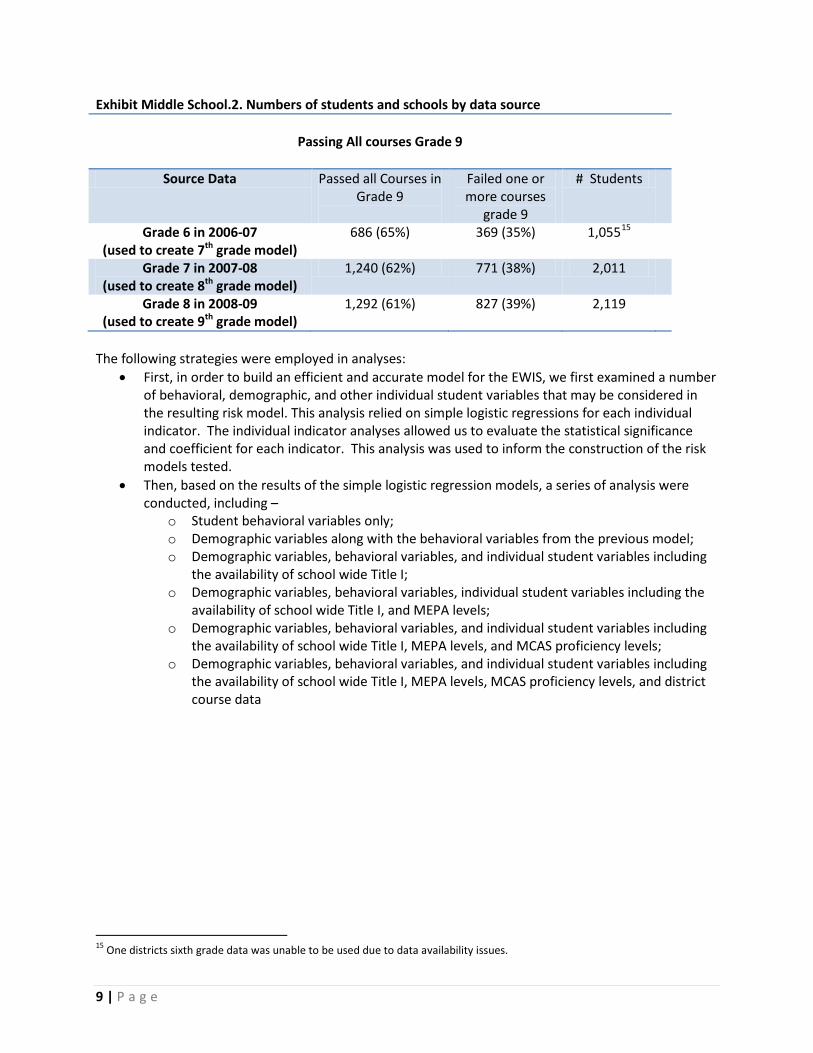
Analysis Methods and Strategies To identify the model that most accurately predicts risk of not passing all courses in grade 9, we conducted multiple analyses. A separate analysis was conducted in each grade to predict a risk level for students as they entered the next year: seventh grade (using students’ grade 6 data), eighth grade (using students’ grade 7 data), and ninth grade (using students’ grade 8 data). For risk model development for the middle school age group, we focused on 2009-10 grade 9 cohort , and linked the cohort with SIMS data in 2005-06 through 2007-08, and MCAS data from 2004-05 through 2009-2010, which were analyzed to identify the predictive indicators in each grade (see Exhibit Middle School.2).
12 Above proficient left out as reference category 13 Above proficient left out as reference category 14 Variables indicating whether a student did not enroll in or miss a certain subject (‘flagged’) were not tested in middle schools, because the numbers of students in falling in this category were too small (less than 2%) in middle schools
9 | P a g e
Exhibit Middle School.2. Numbers of students and schools by data source
Passing All courses Grade 9
Source Data Passed all Courses in Grade 9
Failed one or more courses
grade 9
# Students
Grade 6 in 2006-07 (used to create 7th grade model)
686 (65%) 369 (35%) 1,05515
Grade 7 in 2007-08 (used to create 8th grade model)
1,240 (62%) 771 (38%) 2,011
Grade 8 in 2008-09 (used to create 9th grade model)
1,292 (61%) 827 (39%) 2,119
The following strategies were employed in analyses:
• First, in order to build an efficient and accurate model for the EWIS, we first examined a number of behavioral, demographic, and other individual student variables that may be considered in the resulting risk model. This analysis relied on simple logistic regressions for each individual indicator. The individual indicator analyses allowed us to evaluate the statistical significance and coefficient for each indicator. This analysis was used to inform the construction of the risk models tested.
• Then, based on the results of the simple logistic regression models, a series of analysis were conducted, including –
o Student behavioral variables only; o Demographic variables along with the behavioral variables from the previous model; o Demographic variables, behavioral variables, and individual student variables including
the availability of school wide Title I; o Demographic variables, behavioral variables, individual student variables including the
availability of school wide Title I, and MEPA levels; o Demographic variables, behavioral variables, and individual student variables including
the availability of school wide Title I, MEPA levels, and MCAS proficiency levels; o Demographic variables, behavioral variables, and individual student variables including
the availability of school wide Title I, MEPA levels, MCAS proficiency levels, and district course data
15 One districts sixth grade data was unable to be used due to data availability issues.
10 | P a g e
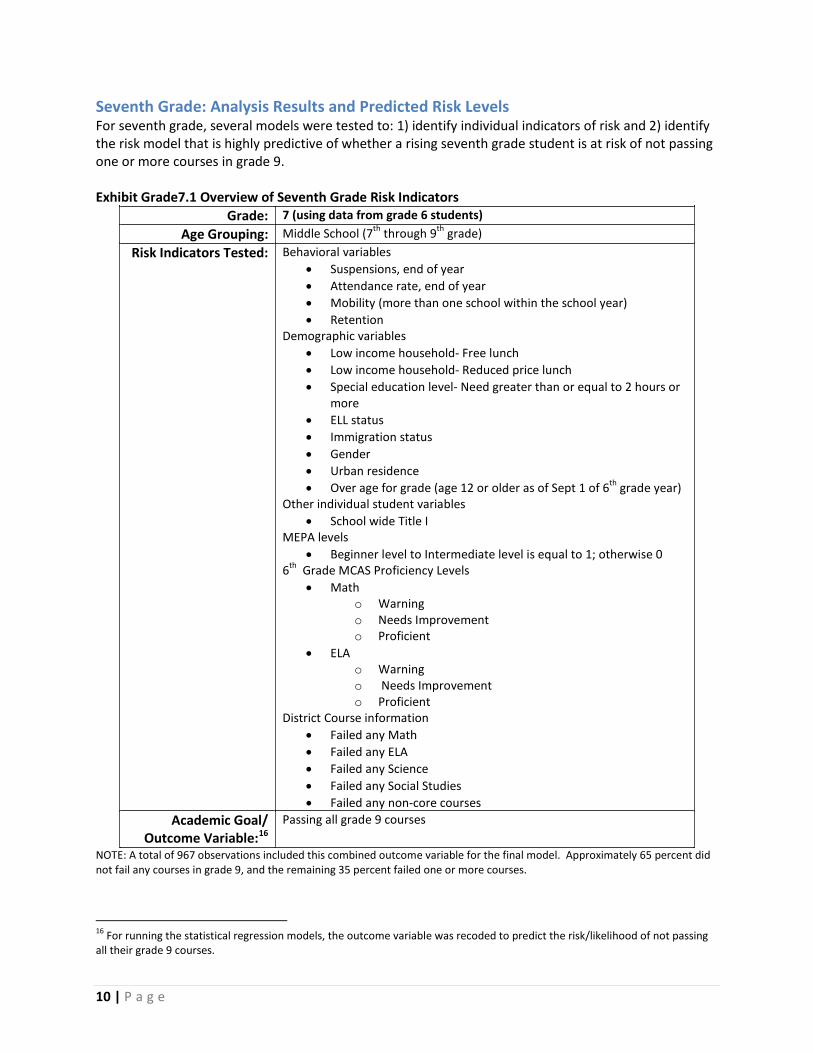
Seventh Grade: Analysis Results and Predicted Risk Levels For seventh grade, several models were tested to: 1) identify individual indicators of risk and 2) identify the risk model that is highly predictive of whether a rising seventh grade student is at risk of not passing one or more courses in grade 9. Exhibit Grade7.1 Overview of Seventh Grade Risk Indicators
Grade: 7 (using data from grade 6 students) Age Grouping: Middle School (7th through 9th grade)
Risk Indicators Tested: Behavioral variables • Suspensions, end of year • Attendance rate, end of year • Mobility (more than one school within the school year) • Retention
Demographic variables • Low income household- Free lunch • Low income household- Reduced price lunch • Special education level- Need greater than or equal to 2 hours or
more • ELL status • Immigration status • Gender • Urban residence • Over age for grade (age 12 or older as of Sept 1 of 6th grade year)
Other individual student variables • School wide Title I
MEPA levels • Beginner level to Intermediate level is equal to 1; otherwise 0
6th Grade MCAS Proficiency Levels • Math
o Warning o Needs Improvement o Proficient
• ELA o Warning o Needs Improvement o Proficient
District Course information • Failed any Math • Failed any ELA • Failed any Science • Failed any Social Studies • Failed any non-core courses
Academic Goal/ Outcome Variable:16
Passing all grade 9 courses
NOTE: A total of 967 observations included this combined outcome variable for the final model. Approximately 65 percent did not fail any courses in grade 9, and the remaining 35 percent failed one or more courses.
16 For running the statistical regression models, the outcome variable was recoded to predict the risk/likelihood of not passing all their grade 9 courses.
11 | P a g e
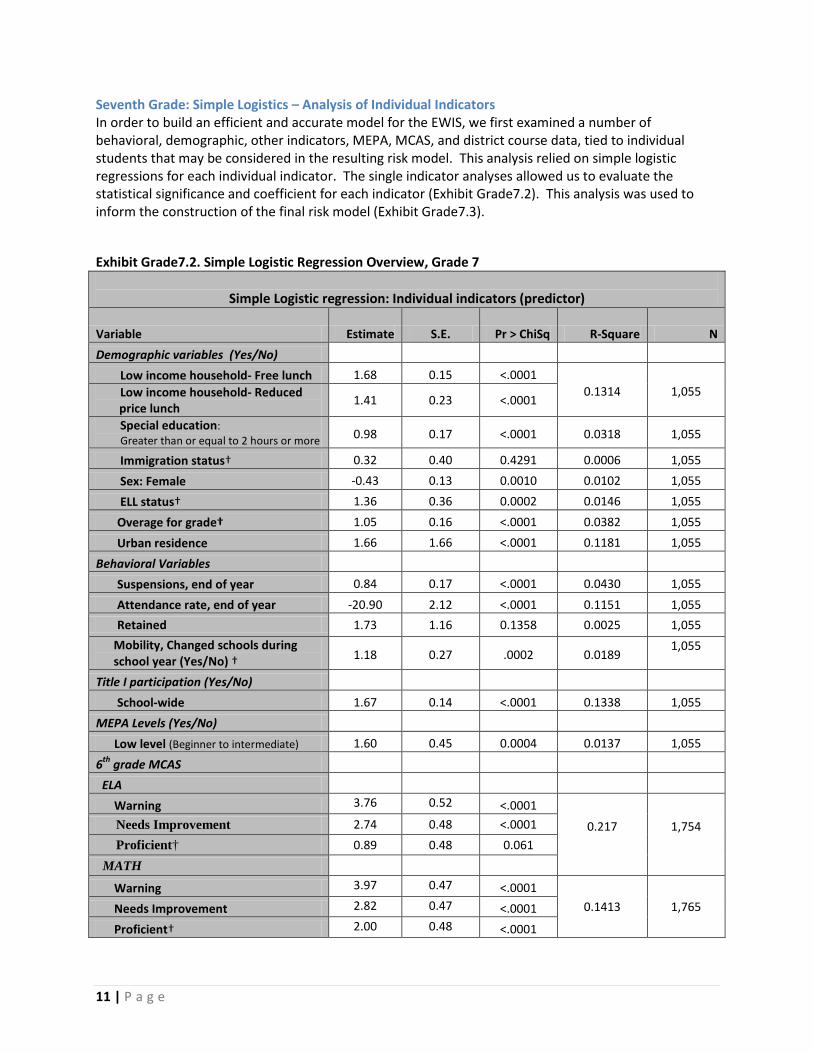
Seventh Grade: Simple Logistics – Analysis of Individual Indicators In order to build an efficient and accurate model for the EWIS, we first examined a number of behavioral, demographic, other indicators, MEPA, MCAS, and district course data, tied to individual students that may be considered in the resulting risk model. This analysis relied on simple logistic regressions for each individual indicator. The single indicator analyses allowed us to evaluate the statistical significance and coefficient for each indicator (Exhibit Grade7.2). This analysis was used to inform the construction of the final risk model (Exhibit Grade7.3). Exhibit Grade7.2. Simple Logistic Regression Overview, Grade 7
Simple Logistic regression: Individual indicators (predictor)
Variable Estimate S.E. Pr > ChiSq R-Square N Demographic variables (Yes/No) Low income household- Free lunch 1.68 0.15 <.0001
0.1314 1,055 Low income household- Reduced price lunch 1.41 0.23 <.0001
Special education: Greater than or equal to 2 hours or more 0.98 0.17 <.0001 0.0318 1,055
Immigration status† 0.32 0.40 0.4291 0.0006 1,055 Sex: Female -0.43 0.13 0.0010 0.0102 1,055 ELL status† 1.36 0.36 0.0002 0.0146 1,055 Overage for grade† 1.05 0.16 <.0001 0.0382 1,055 Urban residence 1.66 1.66 <.0001 0.1181 1,055 Behavioral Variables Suspensions, end of year 0.84 0.17 <.0001 0.0430 1,055 Attendance rate, end of year -20.90 2.12 <.0001 0.1151 1,055 Retained 1.73 1.16 0.1358 0.0025 1,055
Mobility, Changed schools during school year (Yes/No) † 1.18 0.27 .0002 0.0189
1,055
Title I participation (Yes/No) School-wide 1.67 0.14 <.0001 0.1338 1,055 MEPA Levels (Yes/No) Low level (Beginner to intermediate) 1.60 0.45 0.0004 0.0137 1,055 6th grade MCAS ELA Warning 3.76 0.52 <.0001
0.217
1,754
Needs Improvement 2.74 0.48 <.0001 Proficient† 0.89 0.48 0.061 MATH Warning 3.97 0.47 <.0001
0.1413 1,765 Needs Improvement 2.82 0.47 <.0001 Proficient† 2.00 0.48 <.0001
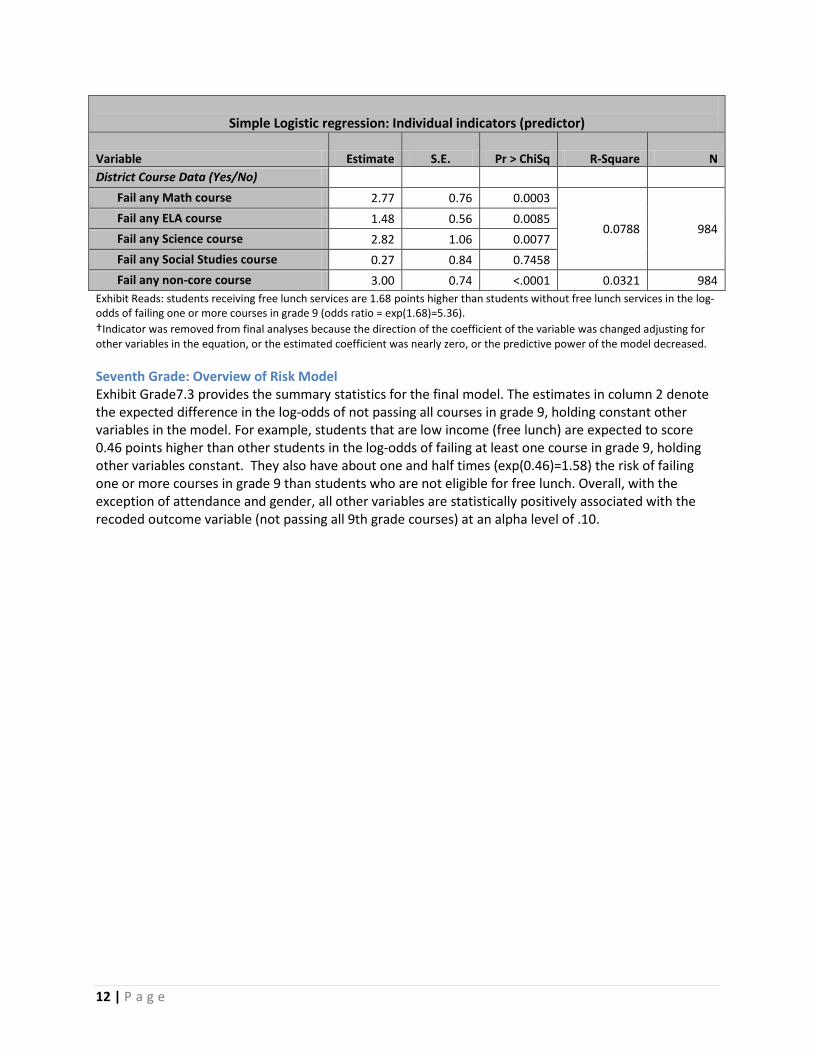
12 | P a g e
Simple Logistic regression: Individual indicators (predictor)
Variable Estimate S.E. Pr > ChiSq R-Square N District Course Data (Yes/No) Fail any Math course 2.77 0.76 0.0003
0.0788 984 Fail any ELA course 1.48 0.56 0.0085 Fail any Science course 2.82 1.06 0.0077 Fail any Social Studies course 0.27 0.84 0.7458 Fail any non-core course 3.00 0.74 <.0001 0.0321 984 Exhibit Reads: students receiving free lunch services are 1.68 points higher than students without free lunch services in the log-odds of failing one or more courses in grade 9 (odds ratio = exp(1.68)=5.36). †Indicator was removed from final analyses because the direction of the coefficient of the variable was changed adjusting for other variables in the equation, or the estimated coefficient was nearly zero, or the predictive power of the model decreased. Seventh Grade: Overview of Risk Model Exhibit Grade7.3 provides the summary statistics for the final model. The estimates in column 2 denote the expected difference in the log-odds of not passing all courses in grade 9, holding constant other variables in the model. For example, students that are low income (free lunch) are expected to score 0.46 points higher than other students in the log-odds of failing at least one course in grade 9, holding other variables constant. They also have about one and half times (exp(0.46)=1.58) the risk of failing one or more courses in grade 9 than students who are not eligible for free lunch. Overall, with the exception of attendance and gender, all other variables are statistically positively associated with the recoded outcome variable (not passing all 9th grade courses) at an alpha level of .10.
13 | P a g e
Exhibit Grade7.3. Final Model – Behavioral Variables, Demographic Variables, Other Variables, MEPA Levels, MCAS Levels and District Course Data and Middle School Outcome Variable (Failing one or more 9th grade courses), Grade 7
Variable Odds Ratio Estimate S.E. Pr > |t|
Behavioral variables Attendance rate, end of year <0.001 -14.42 2.68 <.0001 Suspensions, end of year 1.37 0.31 0.18 0.08 Retained 1.30 0.26 1.35 0.84 Demographic variables Low income household- Free lunch 1.58 0.46 0.22 0.03 Low income household- Reduced price
lunch 2.16 0.77 0.30 0.01
Special Education (greater than or equal to 2 or more hours of need) 0.94 0.06 0.05 0.09
Urban residence 1.17 0.16 0.27 0.55 Sex: Female 0.72 -0.32 0.18 0.07 Other variables School wide Title I 2.06 0.73 0.22 0.001 MEPA Levels Low level (Beginner to intermediate) 1.13 0.12 0.15 0.08 6th grade MCAS ELA Warning 3.30 1.20 0.37 0.001
Needs Improvement 2.40 0.88 0.21 <.0001
Math Warning 8.60 2.15 0.52 <.0001
Needs Improvement 5.59 1.72 0.50 0.001
Proficient 4.00 1.39 0.50 0.006
District Course Data Fail any math course 4.60 1.53 0.80 0.057 Fail any ELA course 1.15 0.14 0.61 0.814 Fail any Science course 9.02 2.20 1.15 0.055 Fail any noncore course 3.75 1.72 0.82 0.03 r2=0.354 Number of observations= 967 Note: some variables that are not statistically significantly predictive at an alpha level of .10 - retained, urban, and ‘fail any ELA course’ – were still included in the final model based on the evidence that these variables were predictive in early age groups with the state-wide data or based on discussion of course-relevant variables. These variables will be retested once statewide data are available.

14 | P a g e
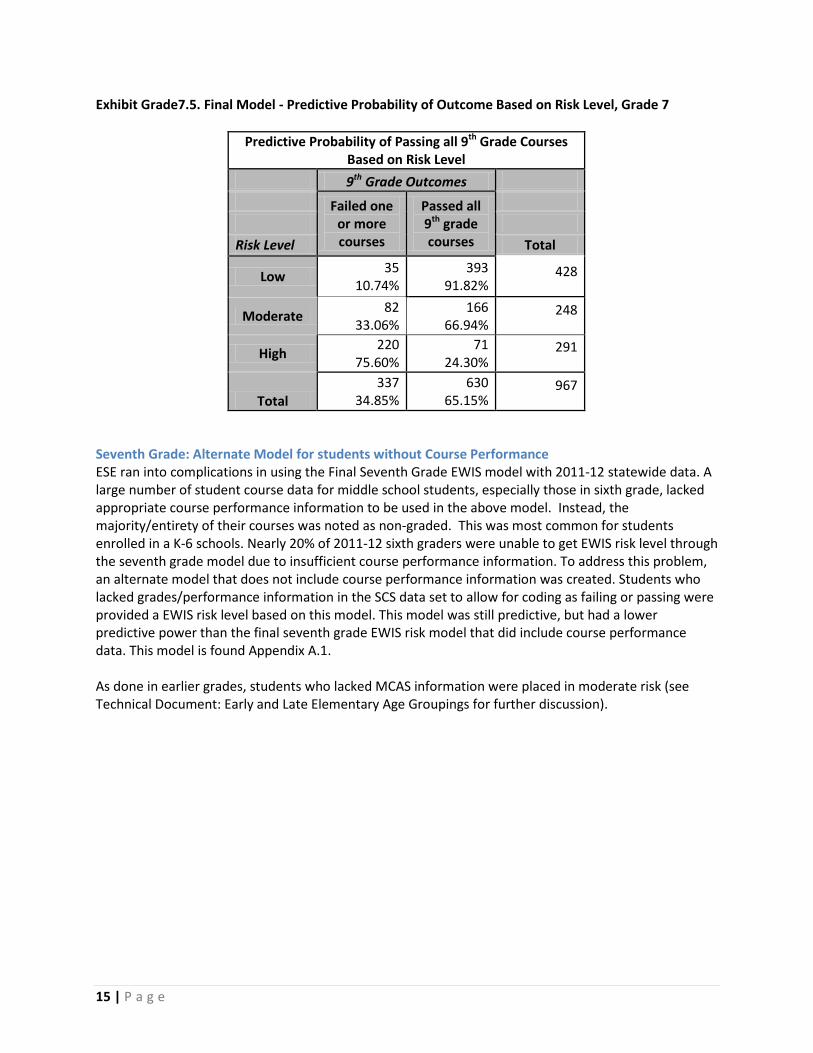
Seventh Grade: Illustration of Levels of Risk and Outcome Using the Final Model Based on the distributions of scores by increased risk in failing to pass all grade nine courses, the levels of risk are defined as follows:
• Low Risk (approximately 75% or more of students meet the outcome variable) : Intervals 1-2; • Moderate Risk (approximately half or more than half of the students meet the outcome
variable): Intervals 3-5; and • High Risk (approximately a third or less of the students meet the outcome variable): Intervals 6-
9. The statistics for the final model’s three levels of risk (low risk; moderate risk and high risk) are shown in Exhibits Grade7.4 and Grade7.5. In summary, approximately 92 percent of students who fall into the low risk category have passed all 9th grade courses. Of the students who are categorized in the moderate risk category, approximately 67 percent of the students have met the outcome. Among the high risk students only 24 percent passed all 9th grade courses and 76 percent of the students failed one or more. Exhibit Grade7.4. Final Model – Risk Level Based on Model, Grade 7
Total numbers of students in sample by risk levels
Increased risk level
Estimate For Probability of Risk Frequency No to low risk Moderate risk High risk
1 ≤ 0.1 267 267 0 0
2 >0.1 & ≤ 0.2 161 161 0 0 3 >0.2 & ≤ 0.3 104 0 104 0 4 >0.3& ≤ 0.4 75 0 75 0 5 >0.4 & ≤ 0.5 69 0 69 0 6 >0.5 & ≤ 0.6 59 0 0 59 7 >0.6 & ≤ 0.7 60 0 0 60 8 >0.7 & ≤ 0.8 63 0 0 63 9 >0.8 109 0 0 109
Total 967 428 248 291
15 | P a g e
Exhibit Grade7.5. Final Model - Predictive Probability of Outcome Based on Risk Level, Grade 7
Predictive Probability of Passing all 9th Grade Courses Based on Risk Level
9th Grade Outcomes Failed one
or more courses
Passed all 9th grade courses
Risk Level Total
Low 35 10.74%
393 91.82%
428
Moderate 82 33.06%
166 66.94%
248
High 220 75.60%
71 24.30%
291
Total 337
34.85% 630
65.15% 967
Seventh Grade: Alternate Model for students without Course Performance ESE ran into complications in using the Final Seventh Grade EWIS model with 2011-12 statewide data. A large number of student course data for middle school students, especially those in sixth grade, lacked appropriate course performance information to be used in the above model. Instead, the majority/entirety of their courses was noted as non-graded. This was most common for students enrolled in a K-6 schools. Nearly 20% of 2011-12 sixth graders were unable to get EWIS risk level through the seventh grade model due to insufficient course performance information. To address this problem, an alternate model that does not include course performance information was created. Students who lacked grades/performance information in the SCS data set to allow for coding as failing or passing were provided a EWIS risk level based on this model. This model was still predictive, but had a lower predictive power than the final seventh grade EWIS risk model that did include course performance data. This model is found Appendix A.1. As done in earlier grades, students who lacked MCAS information were placed in moderate risk (see Technical Document: Early and Late Elementary Age Groupings for further discussion).

16 | P a g e
Eighth Grade: Analysis Results and Predicted Risk Levels For eighth grade, several models were tested to: 1) identify individual indicators of risk and 2) identify the risk model that is highly predictive of whether a rising eighth grade student is at risk of not passing one or more courses in grade 9. Exhibit Grade8.1 Overview of Eighth Grade Risk Indicators
Grade: 8 (using data from grade 7 students) Age Grouping: Middle School (7th through 9th grade)
Risk Indicators Tested: Behavioral variables • Suspensions, end of year • Attendance rate, end of year • Mobility (more than one school within the school year) • Retention
Demographic variables • Low income household- Free lunch • Low income household- Reduced price lunch • Special education level- Need greater than or equal to 2 hours or
more • ELL status • Immigration status • Gender • Urban residence • Over age for grade ( age 13 or older as of Sept 1 of 7th grade year)
Other individual student variables • School wide Title I
MEPA levels Beginner to intermediate 7th Grade MCAS Proficiency Levels
• Math o Warning o Needs Improvement o Proficient
• ELA o Warning o Needs Improvement o Proficient
District Course information • Failed any Math • Failed any ELA • Failed any Science • Failed any Social Studies • Failed any non-core courses
Academic Goal/ Outcome Variable:17
Pass all 9th grade courses
NOTE: A total of 1958 observations included this combined outcome variable for the final model. Approximately 63 percent did not fail any courses in grade 9, and the remaining 37 percent failed one or more courses.
17 For running the statistical regression models, the outcome variable was recoded to predict the risk/likelihood of not passing all their grade 9 courses.
17 | P a g e
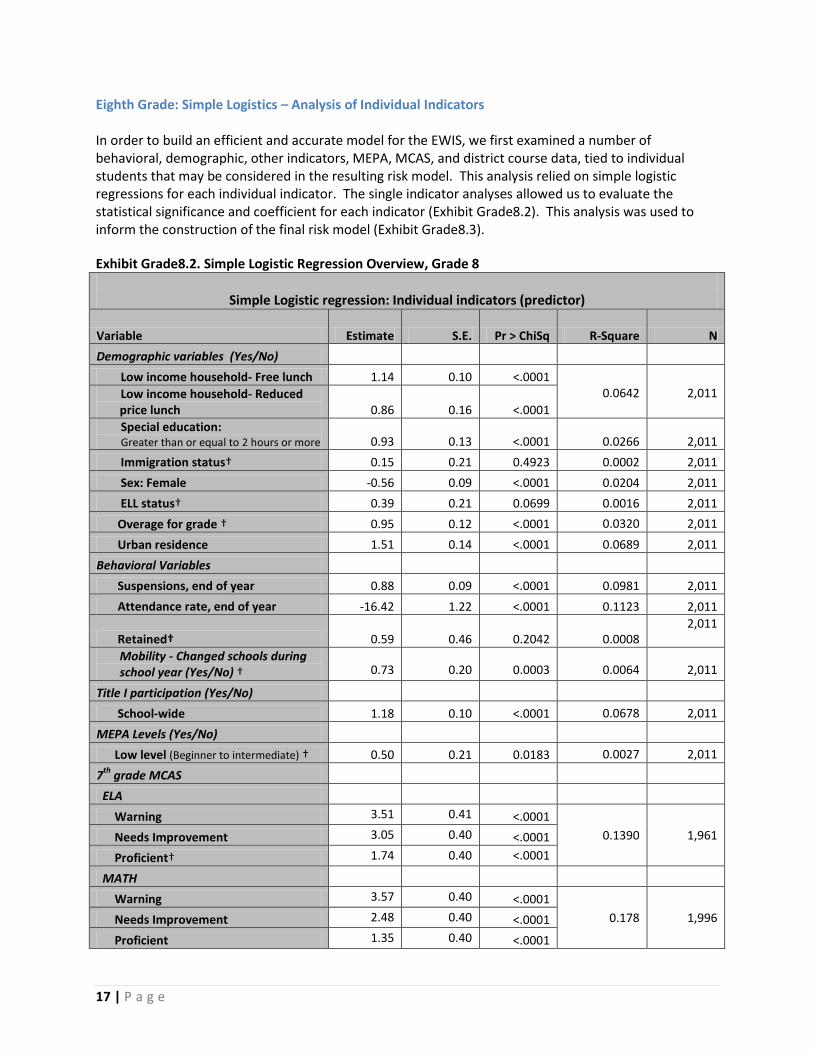
Eighth Grade: Simple Logistics – Analysis of Individual Indicators In order to build an efficient and accurate model for the EWIS, we first examined a number of behavioral, demographic, other indicators, MEPA, MCAS, and district course data, tied to individual students that may be considered in the resulting risk model. This analysis relied on simple logistic regressions for each individual indicator. The single indicator analyses allowed us to evaluate the statistical significance and coefficient for each indicator (Exhibit Grade8.2). This analysis was used to inform the construction of the final risk model (Exhibit Grade8.3). Exhibit Grade8.2. Simple Logistic Regression Overview, Grade 8
Simple Logistic regression: Individual indicators (predictor)
Variable Estimate S.E. Pr > ChiSq R-Square N Demographic variables (Yes/No)
Low income household- Free lunch 1.14 0.10 <.0001 0.0642 2,011 Low income household- Reduced
price lunch 0.86 0.16 <.0001 Special education: Greater than or equal to 2 hours or more 0.93 0.13 <.0001 0.0266 2,011 Immigration status† 0.15 0.21 0.4923 0.0002 2,011 Sex: Female -0.56 0.09 <.0001 0.0204 2,011 ELL status† 0.39 0.21 0.0699 0.0016 2,011 Overage for grade † 0.95 0.12 <.0001 0.0320 2,011
Urban residence 1.51 0.14 <.0001 0.0689 2,011 Behavioral Variables
Suspensions, end of year 0.88 0.09 <.0001 0.0981 2,011 Attendance rate, end of year -16.42 1.22 <.0001 0.1123 2,011
Retained† 0.59 0.46 0.2042 0.0008 2,011
Mobility - Changed schools during school year (Yes/No) † 0.73 0.20 0.0003 0.0064 2,011
Title I participation (Yes/No) School-wide 1.18 0.10 <.0001 0.0678 2,011
MEPA Levels (Yes/No)
Low level (Beginner to intermediate) † 0.50 0.21 0.0183 0.0027 2,011
7th grade MCAS
ELA
Warning 3.51 0.41 <.0001 0.1390 1,961 Needs Improvement 3.05 0.40 <.0001
Proficient† 1.74 0.40 <.0001
MATH
Warning 3.57 0.40 <.0001 0.178 1,996 Needs Improvement 2.48 0.40 <.0001
Proficient 1.35 0.40 <.0001
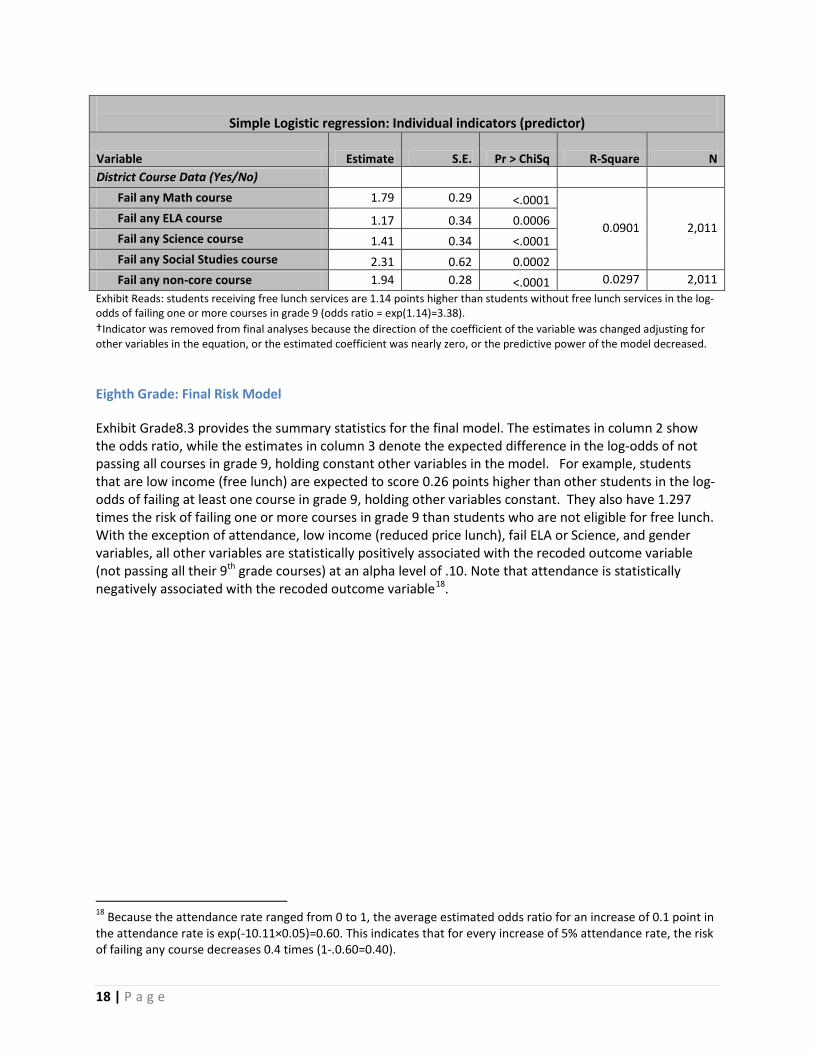
18 | P a g e
Simple Logistic regression: Individual indicators (predictor)
Variable Estimate S.E. Pr > ChiSq R-Square N District Course Data (Yes/No)
Fail any Math course 1.79 0.29 <.0001
0.0901 2,011 Fail any ELA course 1.17 0.34 0.0006 Fail any Science course 1.41 0.34 <.0001 Fail any Social Studies course 2.31 0.62 0.0002 Fail any non-core course 1.94 0.28 <.0001 0.0297 2,011 Exhibit Reads: students receiving free lunch services are 1.14 points higher than students without free lunch services in the log-odds of failing one or more courses in grade 9 (odds ratio = exp(1.14)=3.38). †Indicator was removed from final analyses because the direction of the coefficient of the variable was changed adjusting for other variables in the equation, or the estimated coefficient was nearly zero, or the predictive power of the model decreased.
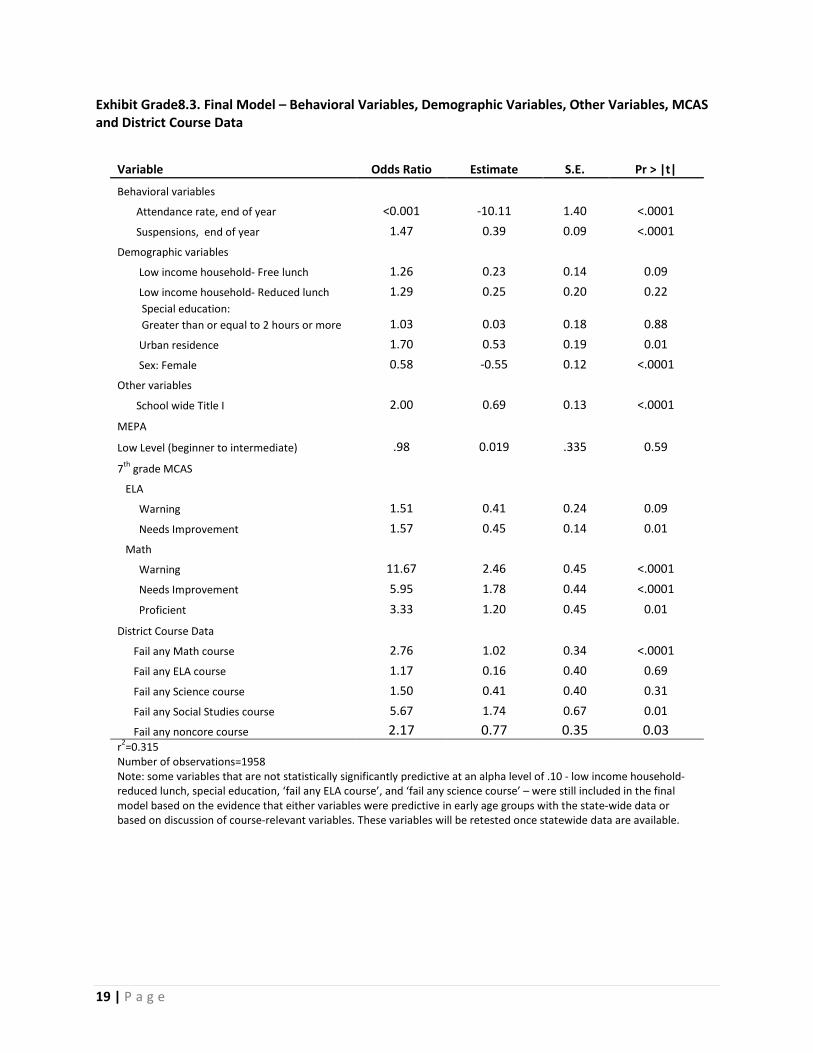
Eighth Grade: Final Risk Model Exhibit Grade8.3 provides the summary statistics for the final model. The estimates in column 2 show the odds ratio, while the estimates in column 3 denote the expected difference in the log-odds of not passing all courses in grade 9, holding constant other variables in the model. For example, students that are low income (free lunch) are expected to score 0.26 points higher than other students in the log-odds of failing at least one course in grade 9, holding other variables constant. They also have 1.297 times the risk of failing one or more courses in grade 9 than students who are not eligible for free lunch. With the exception of attendance, low income (reduced price lunch), fail ELA or Science, and gender variables, all other variables are statistically positively associated with the recoded outcome variable (not passing all their 9th grade courses) at an alpha level of .10. Note that attendance is statistically negatively associated with the recoded outcome variable18.
18 Because the attendance rate ranged from 0 to 1, the average estimated odds ratio for an increase of 0.1 point in the attendance rate is exp(-10.11×0.05)=0.60. This indicates that for every increase of 5% attendance rate, the risk of failing any course decreases 0.4 times (1-.0.60=0.40).
19 | P a g e
Exhibit Grade8.3. Final Model – Behavioral Variables, Demographic Variables, Other Variables, MCAS and District Course Data
Variable Odds Ratio Estimate S.E. Pr > |t|
Behavioral variables Attendance rate, end of year <0.001 -10.11 1.40 <.0001
Suspensions, end of year 1.47 0.39 0.09 <.0001 Demographic variables
Low income household- Free lunch 1.26 0.23 0.14 0.09 Low income household- Reduced lunch 1.29 0.25 0.20 0.22 Special education: Greater than or equal to 2 hours or more 1.03 0.03 0.18 0.88 Urban residence 1.70 0.53 0.19 0.01 Sex: Female 0.58 -0.55 0.12 <.0001 Other variables
School wide Title I 2.00 0.69 0.13 <.0001
MEPA Low Level (beginner to intermediate) .98 0.019 .335 0.59
7th grade MCAS ELA Warning 1.51 0.41 0.24 0.09
Needs Improvement 1.57 0.45 0.14 0.01 Math
Warning 11.67 2.46 0.45 <.0001 Needs Improvement 5.95 1.78 0.44 <.0001 Proficient 3.33 1.20 0.45 0.01
District Course Data Fail any Math course 2.76 1.02 0.34 <.0001
Fail any ELA course 1.17 0.16 0.40 0.69 Fail any Science course 1.50 0.41 0.40 0.31 Fail any Social Studies course 5.67 1.74 0.67 0.01 Fail any noncore course 2.17 0.77 0.35 0.03 r2=0.315 Number of observations=1958 Note: some variables that are not statistically significantly predictive at an alpha level of .10 - low income household-reduced lunch, special education, ‘fail any ELA course’, and ‘fail any science course’ – were still included in the final model based on the evidence that either variables were predictive in early age groups with the state-wide data or based on discussion of course-relevant variables. These variables will be retested once statewide data are available.
20 | P a g e
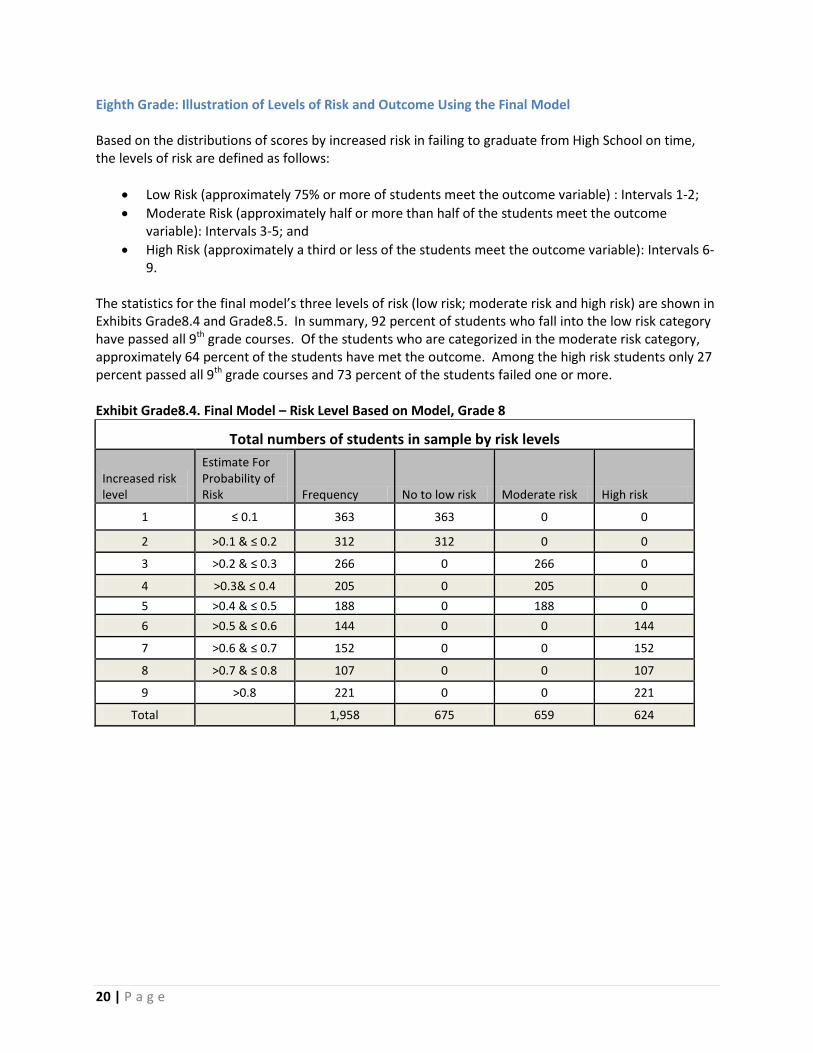
Eighth Grade: Illustration of Levels of Risk and Outcome Using the Final Model Based on the distributions of scores by increased risk in failing to graduate from High School on time, the levels of risk are defined as follows:
• Low Risk (approximately 75% or more of students meet the outcome variable) : Intervals 1-2; • Moderate Risk (approximately half or more than half of the students meet the outcome
variable): Intervals 3-5; and • High Risk (approximately a third or less of the students meet the outcome variable): Intervals 6-
9. The statistics for the final model’s three levels of risk (low risk; moderate risk and high risk) are shown in Exhibits Grade8.4 and Grade8.5. In summary, 92 percent of students who fall into the low risk category have passed all 9th grade courses. Of the students who are categorized in the moderate risk category, approximately 64 percent of the students have met the outcome. Among the high risk students only 27 percent passed all 9th grade courses and 73 percent of the students failed one or more. Exhibit Grade8.4. Final Model – Risk Level Based on Model, Grade 8
Total numbers of students in sample by risk levels
Increased risk level
Estimate For Probability of Risk Frequency No to low risk Moderate risk High risk
1 ≤ 0.1 363 363 0 0
2 >0.1 & ≤ 0.2 312 312 0 0
3 >0.2 & ≤ 0.3 266 0 266 0
4 >0.3& ≤ 0.4 205 0 205 0 5 >0.4 & ≤ 0.5 188 0 188 0 6 >0.5 & ≤ 0.6 144 0 0 144
7 >0.6 & ≤ 0.7 152 0 0 152
8 >0.7 & ≤ 0.8 107 0 0 107
9 >0.8 221 0 0 221
Total 1,958 675 659 624
21 | P a g e
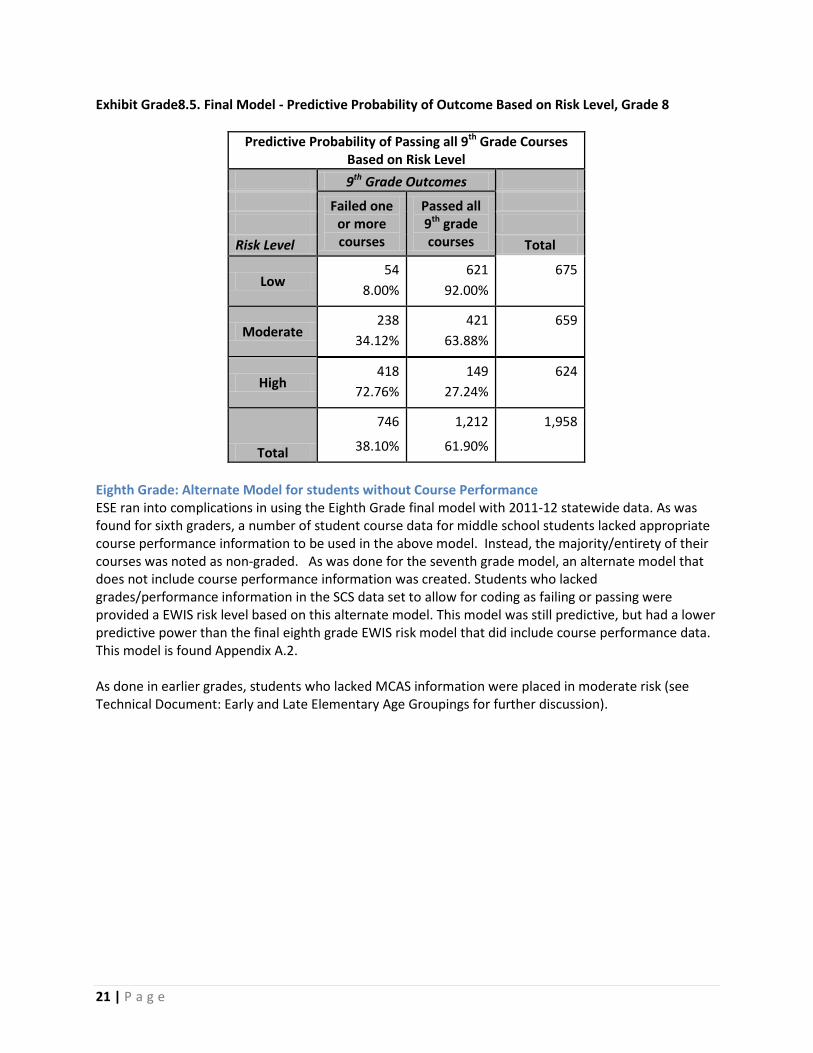
Exhibit Grade8.5. Final Model - Predictive Probability of Outcome Based on Risk Level, Grade 8
Predictive Probability of Passing all 9th Grade Courses Based on Risk Level
9th Grade Outcomes Failed one
or more courses
Passed all 9th grade courses
Risk Level Total
Low 54
8.00% 621
92.00% 675
Moderate 238
34.12% 421
63.88% 659
High 418
72.76% 149
27.24% 624
Total
746
38.10%
1,212
61.90%
1,958
Eighth Grade: Alternate Model for students without Course Performance ESE ran into complications in using the Eighth Grade final model with 2011-12 statewide data. As was found for sixth graders, a number of student course data for middle school students lacked appropriate course performance information to be used in the above model. Instead, the majority/entirety of their courses was noted as non-graded. As was done for the seventh grade model, an alternate model that does not include course performance information was created. Students who lacked grades/performance information in the SCS data set to allow for coding as failing or passing were provided a EWIS risk level based on this alternate model. This model was still predictive, but had a lower predictive power than the final eighth grade EWIS risk model that did include course performance data. This model is found Appendix A.2. As done in earlier grades, students who lacked MCAS information were placed in moderate risk (see Technical Document: Early and Late Elementary Age Groupings for further discussion).
22 | P a g e
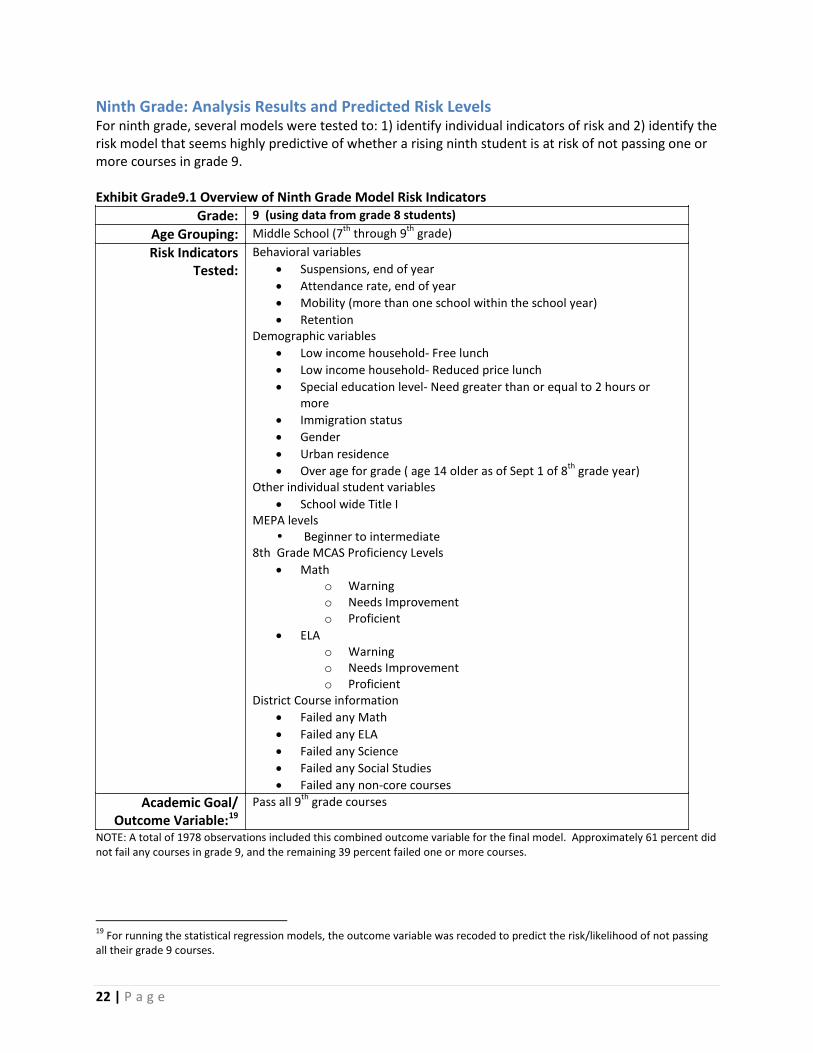
Ninth Grade: Analysis Results and Predicted Risk Levels For ninth grade, several models were tested to: 1) identify individual indicators of risk and 2) identify the risk model that seems highly predictive of whether a rising ninth student is at risk of not passing one or more courses in grade 9. Exhibit Grade9.1 Overview of Ninth Grade Model Risk Indicators
Grade: 9 (using data from grade 8 students) Age Grouping: Middle School (7th through 9th grade) Risk Indicators
Tested: Behavioral variables
• Suspensions, end of year • Attendance rate, end of year • Mobility (more than one school within the school year) • Retention
Demographic variables • Low income household- Free lunch • Low income household- Reduced price lunch • Special education level- Need greater than or equal to 2 hours or
more • Immigration status • Gender • Urban residence • Over age for grade ( age 14 older as of Sept 1 of 8th grade year)
Other individual student variables • School wide Title I
MEPA levels Beginner to intermediate 8th Grade MCAS Proficiency Levels
• Math o Warning o Needs Improvement o Proficient
• ELA o Warning o Needs Improvement o Proficient
District Course information • Failed any Math • Failed any ELA • Failed any Science • Failed any Social Studies • Failed any non-core courses
Academic Goal/ Outcome Variable:19
Pass all 9th grade courses
NOTE: A total of 1978 observations included this combined outcome variable for the final model. Approximately 61 percent did not fail any courses in grade 9, and the remaining 39 percent failed one or more courses.
19 For running the statistical regression models, the outcome variable was recoded to predict the risk/likelihood of not passing all their grade 9 courses.
23 | P a g e
Ninth Grade: Simple Logistics – Analysis of Individual Indicators In order to build an efficient and accurate model for the EWIS, we first examined a number of behavioral, demographic, other indicators, MEPA, MCAS, and district course data, tied to individual students that may be considered in the resulting risk model. This analysis relied on simple logistic regressions for each individual indicator. The single indicator analyses allowed us to evaluate the statistical significance and coefficient for each indicator (Exhibit Grade9.2). This analysis was used to inform the construction of the final risk model (Exhibit Grade9.3). Exhibit Grade9.2. Simple Logistic Regression Overview, Grade 9
Simple Logistic regression: Individual indicators (predictor)
Variable Estimate S.E. Pr > ChiSq R-Square N Demographic variables (Yes/No)
Low income household- Free lunch 1.16 0.10 <.0001 0.0661 2,119 Low income household- Reduced
price lunch 0.82 0.16 <.0001 Special education: † Greater than or equal to 2 hours or more 0.78 0.14 <.0001 0.0144 2,119 Immigration status† -0.03 0.20 0.8975 0.0000 2,119 Sex: Female -0.61 0.09 <.0001 0.0218 2,119 ELL status† 0.14 0.18 0.4150 0.0003 2,119 Overage for grade † 0.95 0.11 <.0001 0.0336 2,119
Urban residence 1.87 0.18 <.0001 0.0730 2,119 Behavioral Variables
Suspensions, end of year 0.74 0.07 <.0001 0.0925 2,119 Attendance rate, end of year -15.22 1.04 <.0001 0.1325 2,119 Retained† 2.45 0.62 <.0001 0.0129 2,005
Mobility - Changed schools during school year (Yes/No) † 1.04 0.19 <.0001 0.0153 2,119
Title I participation (Yes/No) School-wide 0.76 0.09 <.0001 0.0328 2,119
MEPA Levels (Yes/No)
Low level(Beginner to intermediate) 0.33 0.20 0.1011 0.0013 2,119
8th grade MCAS
ELA
Warning 3.53 0.38 <.0001 0.151 2,042 Needs Improvement 3.32 0.35 <.0001
Proficient† 1.90 0.35 <.0001
MATH
Warning 3.42 0.42 <.0001 0.209 2,047 Needs Improvement 2.23 0.42 <.0001
Proficient 1.09 0.44 <.0001
24 | P a g e
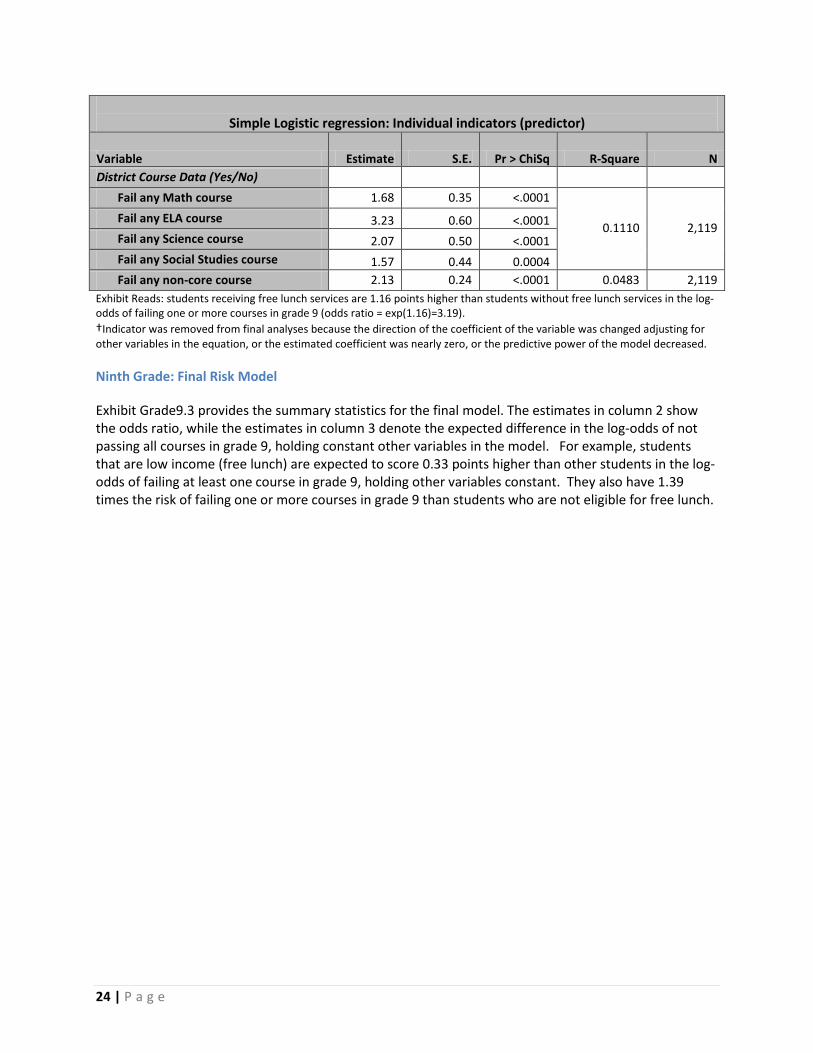
Simple Logistic regression: Individual indicators (predictor)
Variable Estimate S.E. Pr > ChiSq R-Square N District Course Data (Yes/No)
Fail any Math course 1.68 0.35 <.0001
0.1110 2,119 Fail any ELA course 3.23 0.60 <.0001 Fail any Science course 2.07 0.50 <.0001 Fail any Social Studies course 1.57 0.44 0.0004 Fail any non-core course 2.13 0.24 <.0001 0.0483 2,119 Exhibit Reads: students receiving free lunch services are 1.16 points higher than students without free lunch services in the log-odds of failing one or more courses in grade 9 (odds ratio = exp(1.16)=3.19). †Indicator was removed from final analyses because the direction of the coefficient of the variable was changed adjusting for other variables in the equation, or the estimated coefficient was nearly zero, or the predictive power of the model decreased. Ninth Grade: Final Risk Model Exhibit Grade9.3 provides the summary statistics for the final model. The estimates in column 2 show the odds ratio, while the estimates in column 3 denote the expected difference in the log-odds of not passing all courses in grade 9, holding constant other variables in the model. For example, students that are low income (free lunch) are expected to score 0.33 points higher than other students in the log-odds of failing at least one course in grade 9, holding other variables constant. They also have 1.39 times the risk of failing one or more courses in grade 9 than students who are not eligible for free lunch.
25 | P a g e
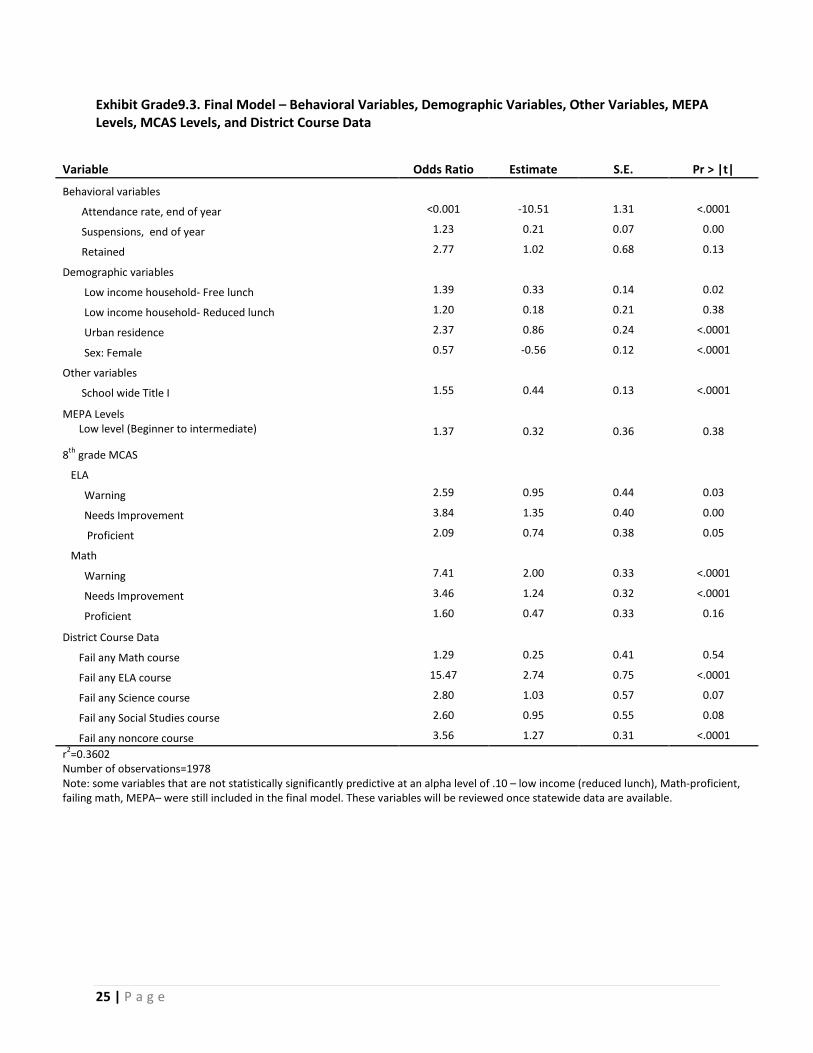
Exhibit Grade9.3. Final Model – Behavioral Variables, Demographic Variables, Other Variables, MEPA Levels, MCAS Levels, and District Course Data
Variable Odds Ratio Estimate S.E. Pr > |t|
Behavioral variables Attendance rate, end of year <0.001 -10.51 1.31 <.0001
Suspensions, end of year 1.23 0.21 0.07 0.00
Retained 2.77 1.02 0.68 0.13
Demographic variables Low income household- Free lunch 1.39 0.33 0.14 0.02
Low income household- Reduced lunch 1.20 0.18 0.21 0.38
Urban residence 2.37 0.86 0.24 <.0001
Sex: Female 0.57 -0.56 0.12 <.0001
Other variables School wide Title I 1.55 0.44 0.13 <.0001
MEPA Levels Low level (Beginner to intermediate) 1.37 0.32 0.36 0.38
8th grade MCAS ELA Warning 2.59 0.95 0.44 0.03
Needs Improvement 3.84 1.35 0.40 0.00
Proficient 2.09 0.74 0.38 0.05
Math Warning 7.41 2.00 0.33 <.0001
Needs Improvement 3.46 1.24 0.32 <.0001
Proficient 1.60 0.47 0.33 0.16
District Course Data Fail any Math course 1.29 0.25 0.41 0.54
Fail any ELA course 15.47 2.74 0.75 <.0001
Fail any Science course 2.80 1.03 0.57 0.07
Fail any Social Studies course 2.60 0.95 0.55 0.08
Fail any noncore course 3.56 1.27 0.31 <.0001 r2=0.3602 Number of observations=1978 Note: some variables that are not statistically significantly predictive at an alpha level of .10 – low income (reduced lunch), Math-proficient, failing math, MEPA– were still included in the final model. These variables will be reviewed once statewide data are available.

26 | P a g e
Ninth Grade: Illustration of Levels of Risk and Outcome Using the Final Model Based on the distributions of scores by increased risk in failing one or more 9th grade courses, the levels of risk are defined as follows:
• Low Risk (approximately 75% or more of students meet the outcome variable): Intervals 1-2; • Moderate Risk (approximately half or more than half of the students meet the outcome
variable): Intervals 3-5; and • High Risk (approximately a third or less of the students meet the outcome variable): Intervals 6-
9. The statistics for the final model’s three levels of risk (low risk; moderate risk and high risk) are shown in Exhibits Grade9.4 and Grade9.5. In summary, approximately 92 percent of students who fall into the low risk category have passed all 9th grade courses. Of the students who are categorized in the moderate risk category, approximately 65 percent of the students have met the outcome. Among the high risk students only 24 percent passed all 9th grade courses and 76 percent of the students failed one or more. Exhibit Grade9.4. Final Model – Risk Level Based on Model, Grade 9
Total numbers of students in sample by risk levels
Increased risk level
Estimate For Probability of Risk Frequency No to low risk Moderate risk High risk
1 ≤ 0.1 449 449 0 0
2 >0.1 & ≤ 0.2 302 302 0 0
3 >0.2 & ≤ 0.3 194 0 194 0
4 >0.3& ≤ 0.4 186 0 186 0 5 >0.4 & ≤ 0.5 155 0 155 0
6 >0.5 & ≤ 0.6 151 0 0 151
7 >0.6 & ≤ 0.7 158 0 0 158
8 >0.7 & ≤ 0.8 110 0 0 110
9 >0.8 273 0 0 273
Total 1,978 751 535 692

27 | P a g e
Exhibit Grade9.5. Final Model - Predictive Probability of Outcome Based on Risk Level, Grade 9
Predictive Probability of Passing all 9th Grade Courses Based on Risk Level
Risk Level
9th Grade Outcomes
Total
Failed one or more courses
Passed all 9th grade courses
Low 60
7.99% 691
92.01% 751
Moderate 184
33.39% 351
65.61% 535
High 524
75.72% 168
24.28% 692
Total
768 38.83%
1,210 61.17%
1,978
Ninth Grade: Alternate Model for students without Course Performance ESE ran into complications in using the Ninth Grade final model with 2011-12 statewide data. As was found for the earlier middle school models, student course data for a subset of students lacked appropriate course performance information to be used in the above model. Instead, the majority/entirety of their courses was noted as non-graded. To provide risk levels for these students and for consistency with the other middle school age group models, an alternate model that does not include course performance information was created. Students who lacked grades/performance information in the SCS data set to allow for coding as failing or passing were provided a EWIS risk level based on this alternate model. This model was still predictive, but had a lower predictive power than the final ninth grade EWIS risk model that did include course performance data (shown above). The alternate model without course performance data is found Appendix A.3. As done in earlier grades, students who lacked MCAS information were placed in moderate risk (see Technical Document: Early and Late Elementary Age Groupings for further discussion).
28 | P a g e
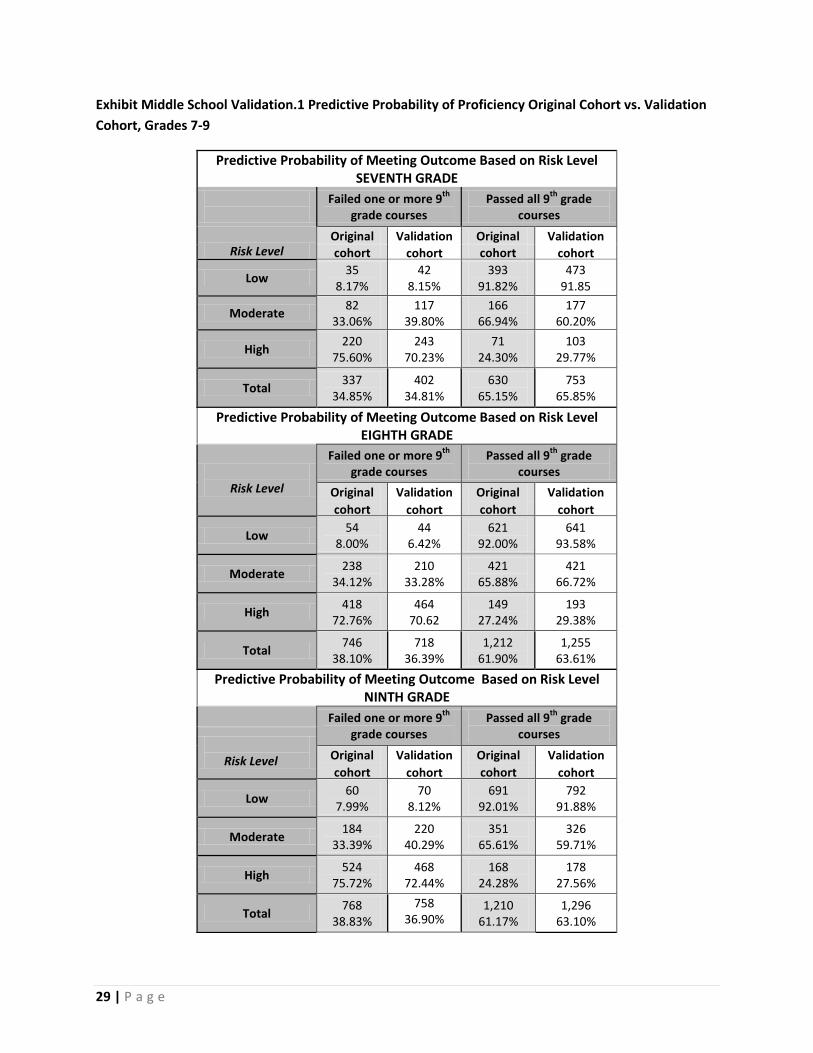
Middle School Validation: Comparison of 2008-09 and 2009-10 Cohort In order show the strength of the final model in other cohorts, the following tables examine the extent to which the developed risk model using the original cohort data correctly identified at-risk students in the validation cohort among those who actually met the predefined outcome measure (passing all 9th grade courses). As shown in Middle School Validation.1, overall the predictive probability of proficiency by risk level is very similar between the original cohort and the validation cohort for grades 7, 8 and 9 and falls within the acceptable parameters for each risk level. Exhibit Middle School Validation.2 shows the output from the logistical regression for grade 7, 8, and 9 models using the original cohort and the validation cohort. In general, the coefficients are all similar in magnitude and significance, though there are exceptions. There is some variation in low income, ELA MCAs variables and some of course performance areas across cohorts. Retention also varied significantly, and this may be a result of a small number of retained students in the validation cohort. As we use statewide data sets, we will continue to see if retention remains significant, and/or retest overage for inclusion. The directions of the coefficients are the same between the model, except special education which not changes in significance as well as direction. As we move to a state level data set we hope to make this variable more refined. Attention will continue to be paid to the magnitude of the variable in the upper grades. In sum, the validation work suggests that the final models for the middle school age grouping are generally strong across cohorts. The consistency of the coefficients between cohorts implies that the selected indicators are behaving similarly in reference to our outcome variable in different groups. We will continue to test the prediction accuracy and stability of the EWIS models for other cohorts as more recent data sets become available, especially statewide data.
29 | P a g e
Exhibit Middle School Validation.1 Predictive Probability of Proficiency Original Cohort vs. Validation Cohort, Grades 7-9
Predictive Probability of Meeting Outcome Based on Risk Level SEVENTH GRADE
Failed one or more 9th grade courses
Passed all 9th grade courses
Risk Level Original Validation Original Validation cohort cohort cohort cohort
Low 35 8.17%
42 8.15%
393 91.82%
473 91.85
Moderate 82 33.06%
117 39.80%
166 66.94%
177 60.20%
High 220 75.60%
243 70.23%
71 24.30%
103 29.77%
Total 337 34.85%
402 34.81%
630 65.15%
753 65.85%
Predictive Probability of Meeting Outcome Based on Risk Level EIGHTH GRADE
Risk Level
Failed one or more 9th grade courses
Passed all 9th grade courses
Original Validation Original Validation cohort cohort cohort cohort
Low 54 8.00%
44 6.42%
621 92.00%
641 93.58%
Moderate 238 34.12%
210 33.28%
421 65.88%
421 66.72%
High 418 72.76%
464 70.62
149 27.24%
193 29.38%
Total 746 38.10%
718 36.39%
1,212 61.90%
1,255 63.61%
Predictive Probability of Meeting Outcome Based on Risk Level NINTH GRADE
Failed one or more 9th grade courses
Passed all 9th grade courses
Risk Level Original Validation Original Validation
cohort cohort cohort cohort
Low 60 7.99%
70 8.12%
691 92.01%
792 91.88%
Moderate 184 33.39%
220 40.29%
351 65.61%
326 59.71%
High 524 75.72%
468 72.44%
168 24.28%
178 27.56%
Total 768 38.83%
758 36.90%
1,210 61.17%
1,296 63.10%

30 | P a g e
Exhibit Middle School Validation.2. Overview of Findings by Cohort Using Final Model
* Significant at 10%, **Significant at 5%, ***Significant at 1% - variable not included in model
Grade 7 Grade 8 Grade 9
Variable Original Cohort
Validation Cohort
Original Cohort
Validation Cohort
Original Cohort
Validation Cohort
Behavioral variables
Attendance rate, end of year -14.42*** -8.47*** -10.11*** 11.10*** -10.51*** -11.34***
Suspensions, end of year 0.31* 0.26* 0.39*** 0.35*** 0.21*** 0.29***
Retained 0.26 2.07 - - 1.02 0.59
Demographic variables
Low income household- Free lunch 0.46** 0.649** 0.23* 0.55*** 0.33** 0.44***
Low income household- Reduced lunch 0.77*** 0.59** 0.25 0.09 0.18 0.40*
Special education: Greater than or equal to 2 hours or more
0.06* -0.02 0.03** -0.12 - -
Urban residence 0.16 0.57** 0.53 0.25 0.86*** 0.36**
Sex: Female -0.32* -0.54*** -0.55*** -0.47*** -0.56*** -0.51***
Other variables
School wide Title I 0.73*** 0.78*** 0.69*** 0.48** 0.44** 0.14
MEPA Levels
Low level (Beginner to intermediate) 0.12* 0.33 0.02 0.09 0.32 0.09
MCAS
ELA
Warning 1.20*** 0.83** 0.41* 0.39 0.95** 1.29***
Needs Improvement 0.88*** 0.66* 0.45*** 0.45*** 1.35*** 1.64***
Proficient - - - - 0.74** 1.24***
Math
Warning 2.15*** 2.07*** 2.46*** 3.48*** 2.00*** 2.48***
Needs Improvement 1.72*** 1.75*** 1.78*** 2.89*** 1.24*** 1.99***
Proficient 1.39** 0.83** 1.20*** 1.20*** 0.47* 1.20***
District Course Data
Fail any Math course 1.53* 0.21 1.02*** 1.41*** 0.25 0.91**
Fail any ELA course 0.14 0.93 0.16 1.33*** 2.74*** 1.29***
Fail any Science course 2.20* 0.94 0.41 0.61* 1.03* 2.22***
Fail any Social Studies course - - 1.74*** 0.16 0.95* 1.22**
Fail any noncore course 1.72** 1.17* 0.77** 1.06*** 1.27* 0.45
31 | P a g e
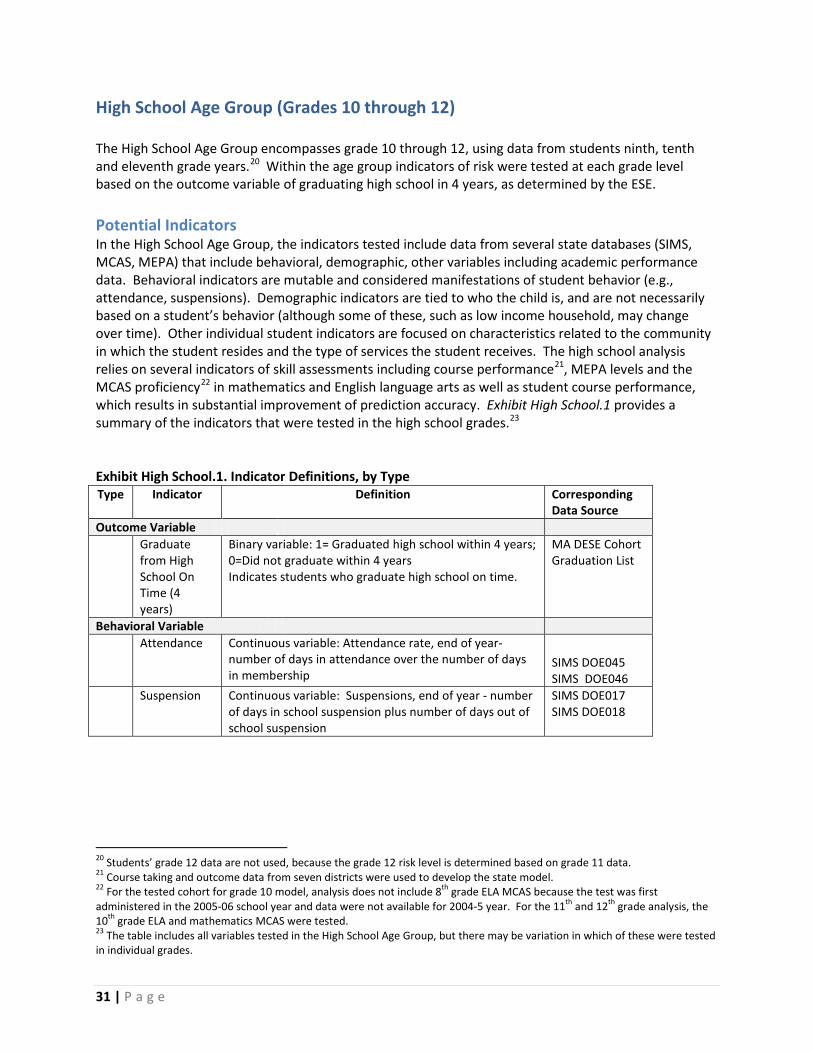
High School Age Group (Grades 10 through 12) The High School Age Group encompasses grade 10 through 12, using data from students ninth, tenth and eleventh grade years.20 Within the age group indicators of risk were tested at each grade level based on the outcome variable of graduating high school in 4 years, as determined by the ESE. Potential Indicators In the High School Age Group, the indicators tested include data from several state databases (SIMS, MCAS, MEPA) that include behavioral, demographic, other variables including academic performance data. Behavioral indicators are mutable and considered manifestations of student behavior (e.g., attendance, suspensions). Demographic indicators are tied to who the child is, and are not necessarily based on a student’s behavior (although some of these, such as low income household, may change over time). Other individual student indicators are focused on characteristics related to the community in which the student resides and the type of services the student receives. The high school analysis relies on several indicators of skill assessments including course performance21, MEPA levels and the MCAS proficiency22 in mathematics and English language arts as well as student course performance, which results in substantial improvement of prediction accuracy. Exhibit High School.1 provides a summary of the indicators that were tested in the high school grades.23 Exhibit High School.1. Indicator Definitions, by Type Type Indicator Definition Corresponding
Data Source Outcome Variable Graduate
from High School On Time (4 years)
Binary variable: 1= Graduated high school within 4 years; 0=Did not graduate within 4 years Indicates students who graduate high school on time.
MA DESE Cohort Graduation List
Behavioral Variable Attendance
Continuous variable: Attendance rate, end of year- number of days in attendance over the number of days in membership
SIMS DOE045 SIMS DOE046
Suspension
Continuous variable: Suspensions, end of year - number of days in school suspension plus number of days out of school suspension
SIMS DOE017 SIMS DOE018
20 Students’ grade 12 data are not used, because the grade 12 risk level is determined based on grade 11 data. 21 Course taking and outcome data from seven districts were used to develop the state model. 22 For the tested cohort for grade 10 model, analysis does not include 8th grade ELA MCAS because the test was first administered in the 2005-06 school year and data were not available for 2004-5 year. For the 11th and 12th grade analysis, the 10th grade ELA and mathematics MCAS were tested. 23 The table includes all variables tested in the High School Age Group, but there may be variation in which of these were tested in individual grades.
32 | P a g e
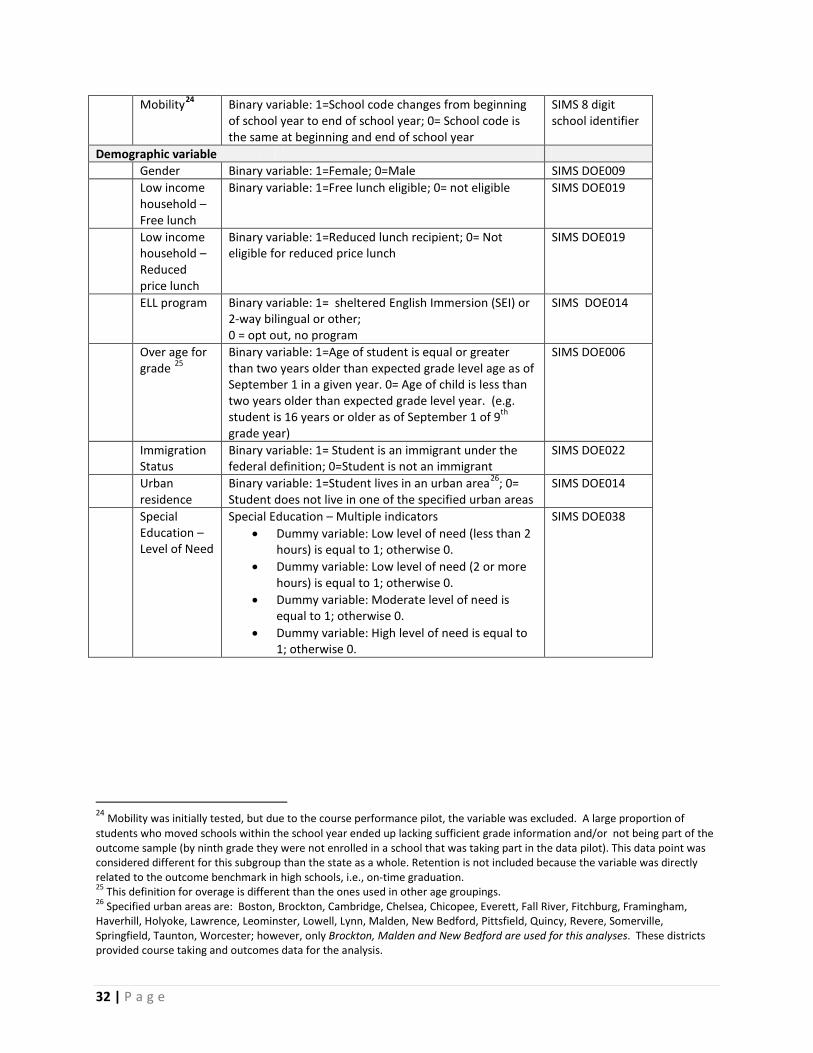
Mobility24 Binary variable: 1=School code changes from beginning of school year to end of school year; 0= School code is the same at beginning and end of school year
SIMS 8 digit school identifier
Demographic variable Gender Binary variable: 1=Female; 0=Male SIMS DOE009 Low income
household – Free lunch
Binary variable: 1=Free lunch eligible; 0= not eligible SIMS DOE019
Low income household – Reduced price lunch
Binary variable: 1=Reduced lunch recipient; 0= Not eligible for reduced price lunch
SIMS DOE019
ELL program Binary variable: 1= sheltered English Immersion (SEI) or 2-way bilingual or other; 0 = opt out, no program
SIMS DOE014
Over age for grade 25
Binary variable: 1=Age of student is equal or greater than two years older than expected grade level age as of September 1 in a given year. 0= Age of child is less than two years older than expected grade level year. (e.g. student is 16 years or older as of September 1 of 9th grade year)
SIMS DOE006
Immigration Status
Binary variable: 1= Student is an immigrant under the federal definition; 0=Student is not an immigrant
SIMS DOE022
Urban residence
Binary variable: 1=Student lives in an urban area26; 0= Student does not live in one of the specified urban areas
SIMS DOE014
Special Education – Level of Need
Special Education – Multiple indicators • Dummy variable: Low level of need (less than 2
hours) is equal to 1; otherwise 0. • Dummy variable: Low level of need (2 or more
hours) is equal to 1; otherwise 0. • Dummy variable: Moderate level of need is
equal to 1; otherwise 0. • Dummy variable: High level of need is equal to
1; otherwise 0.
SIMS DOE038
24 Mobility was initially tested, but due to the course performance pilot, the variable was excluded. A large proportion of students who moved schools within the school year ended up lacking sufficient grade information and/or not being part of the outcome sample (by ninth grade they were not enrolled in a school that was taking part in the data pilot). This data point was considered different for this subgroup than the state as a whole. Retention is not included because the variable was directly related to the outcome benchmark in high schools, i.e., on-time graduation. 25 This definition for overage is different than the ones used in other age groupings. 26 Specified urban areas are: Boston, Brockton, Cambridge, Chelsea, Chicopee, Everett, Fall River, Fitchburg, Framingham, Haverhill, Holyoke, Lawrence, Leominster, Lowell, Lynn, Malden, New Bedford, Pittsfield, Quincy, Revere, Somerville, Springfield, Taunton, Worcester; however, only Brockton, Malden and New Bedford are used for this analyses. These districts provided course taking and outcomes data for the analysis.
33 | P a g e
Other Individual Student Variable
Title I participation27
Binary variables: • School -wide Title I, Binary variable: 1= School-
wide Title I; 0= Not school-wide Title I
SIMS DOE020
MEPA Levels Massachusetts
English Proficiency Assessment (MEPA)
Binary indicator • Beginner level to Intermediate level is equal to
1; otherwise 0.
MEPA Spring data variable name: pl
MCAS Proficiency Levels MCAS
Proficiency levels in Math and English and English (as available) 28
Multiple indicators • Math29
o Dummy variable: Warning is equal to 1; otherwise 0.
o Dummy variable: Needs improvement is equal to 1; otherwise 0.
o Dummy variable: Proficient is equal to 1; otherwise 0.
• English o Dummy variable: Warning is equal to
1; otherwise 0. o Dummy variable: Needs improvement
is equal to 1; otherwise 0. o Dummy variable: Proficient is equal to
1; otherwise 0.
MCAS data for cohort in analysis name: EPERF2 MPERF2
Course Outcomes
Course Information
District Course information
• Failed any Math o Dummy variable: Failed equal to 1;
otherwise 0. • Failed any ELA
o Dummy variable: Failed equal to 1; otherwise 0.
• Failed any Science o Dummy variable: Failed equal to 1;
otherwise 0. • Failed any Social Studies
o Dummy variable: Failed equal to 1;
Data from pilot districts
27 In the Early and Late Elementary Risk Models, targeted Title I was used as a variable. However, because of the limited sample size for the high school analysis, there were not enough students with this designation to conduct the analysis. This is a variable that should be explored once there is a full set of state level data available. 28 For the tested cohort for grade 10 model, analysis does not include 8th grade ELA MCAS because the test was not administered in the 2004-05 school year (when those students would have been expected to be in 8th grade). For the 11th and 12th grade analysis, the 10th grade 29 Above proficient left out as reference category
34 | P a g e
otherwise 0. • Failed any non-core courses
o Dummy variable: Failed equal to 1; otherwise 0.
• Flag Math Course o Dummy variable: Missing math course
equal to 1; otherwise 0. • Flag ELA Course
o Dummy variable: Missing ELA course equal to 1; otherwise 0.
• Flag Science Course o Dummy variable: Missing science
course equal to 1; otherwise 0. • Flag Social Studies Course
o Dummy variable: Missing SS course equal to 1; otherwise 0.
• Flag non-core Course o Dummy variable: Missing non-core
course equal to 1; otherwise 0. Analysis Methods and Strategies To identify the model that most accurately predicts risk of not achieving proficiency on timely graduation, we conducted multiple analyses. A separate analysis was conducted in each grade to designate a risk level for students as they enter the next year: tenth grade (using students 9th grade information), eleventh grade (using students 10th grade information) and twelfth grade (using students 11th grade information). For risk model development for the high school age group, we focused on 2008-09 graduation cohort and relied on a sample of students provided by seven districts. These students were linked with SIMS data in 2005-06 through 2007-08, and MCAS data from 2004-05 through 2009-10, which were analyzed to identify the predictive indicators in each grade (see Exhibit High School.2).
35 | P a g e
Exhibit High School.2. Numbers of students and schools by data source
On-time Graduation for 2008-09 cohort
Source Data Graduated in 4
years
Did not graduate in 4
years
# Students # Districts
Grade 9 in 2005-06 (used to develop 10th grade model)
2,224(75%) 748 (25%) 2,972 7
Grade 10 in 2006-07 (used to develop 11th grade model)
2,210 (14%) 362 (14%) 2,572 7
Grade 11 in 2007-08 (used to develop 12th grade model)
2,318 (89%) 276 (11%) 2,594 7
The following strategies were employed in analyses:
• First, in order to build an efficient and accurate model for the EWIS, we first examined a number of behavioral, demographic, and other individual student variables that may be considered in the resulting risk model. This analysis relied on simple logistic regressions for each individual indicator.
• The individual indicator analyses allowed us to evaluate the statistical significance and coefficient for each indicator. This analysis was used to inform the construction of the risk models tested.
• Then, based on the results of the simple logistic regression models, a series of analysis were conducted, including –
o Student behavioral variables only; o Demographic variables along with the behavioral variables from the previous model; o Demographic variables, behavioral variables, and individual student variables including
the availability of school wide Title I; o Demographic variables, behavioral variables, individual student variables including the
availability of school wide Title I, and MEPA levels; o Demographic variables, behavioral variables, and individual student variables including
the availability of school wide Title I, MEPA levels, and MCAS proficiency levels30; o Demographic variables, behavioral variables, and individual student variables including
the availability of school wide Title I, MEPA levels, and MCAS proficiency levels; and district course data
30 Students in the high school grades are only administered MCAS in 10th grade. MCAS results are part of the grade 10 model (using 8th grade MCAS results) and grade 11 (Using 10th grade MCAS results) risk determinations. ELA 8th grade MCAS was not available for necessary years.

36 | P a g e
Tenth Grade: Analysis Results and Predicted Risk Levels For tenth grade, several models were tested to: 1) identify individual indicators of risk and 2) identify the risk model that is most predictive of whether a rising tenth grade student is at risk of not meeting the outcome variable of graduating high school on time. Exhibit Grade10.1 Overview of Tenth Grade Risk Indicators
Grade: 10 (using data from grade 9 students) Age Grouping: High School (10th through 12th grade)
Risk Indicators Tested: Behavioral variables31 • Suspensions, end of year • Attendance rate, end of year • Mobility (more than one school within the school year)
Demographic variables • Low income household- Free lunch • Low income household- Reduced price lunch • Special education level variables (4 total) • ELL status • Immigration status • Gender • Urban residence • Over age for grade (age 16 or older by Sept 1st of 9th grade year)
Other individual student variables • School wide Title I
MEPA levels • Beginner to intermediate 8th Grade MCAS Proficiency Levels32
• Math o Warning o Needs Improvement o Proficient
District Course information • Failed any Math • Failed any ELA • Failed any Science • Failed any Social Studies • Failed any non-core courses • Missing Math Course • Missing ELA Course • Missing Science Course • Missing Social Studies Course • Missing non-core course
Academic Goal/ Outcome Variable:33
On-time graduation
NOTE: A total of 2717 observations included this combined outcome variable for the final model. Approximately 76 percent graduated within 4 years, and the remaining 24 percent did not.
31 Retention was not included in the high school model because this variable is directly related to the outcome measure, 4 years graduation, in the high school age group. 32 Grade 9 is not an MCAS tested year. Available MCAS data from grade 8 was used. ELA 8th grade MCAS was not available for necessary years. 33 For running the statistical regression models, the outcome variable was recoded to predict the risk/likelihood of not graduating on time.
37 | P a g e
Tenth Grade: Simple Logistics – Analysis of Individual Indicators In order to build an efficient and accurate model for the EWIS, we first examined a number of behavioral, demographic, other indicators, previous outcomes for MEPA, and district course data, tied to individual students that may be considered in the resulting risk model. This analysis relied on simple logistic regressions for each individual indicator. The single indicator analyses allowed us to evaluate the statistical significance and coefficient for each indicator (Exhibit Grade10.2). This analysis was used to inform the construction of the final risk model (Exhibit Grade10.3). Exhibit Grade10.2. Simple Logistic Regression Overview, Grade 10
Simple Logistic regression: Individual indicators (predictor)
Variable Estimate S.E. Pr > ChiSq R-Square N Demographic variables (Yes/No)
Low income household- Free lunch 1.74 0.07 <.0001 0.0714 2,972 Low income household- Reduced
price lunch 0.55 0.17 0.0012 Special education
Low level of need (less than 2 hours)† 0.58 0.35 0.1010
0.0573 2,972 Low level of need (2 or more hours) 1.08 0.23 <.0001 Moderate level of need 1.12 0.14 <.0001
High level of need 2.89 0.33 <.0001 Immigration status† 0.33 0.19 0.0825 0.0010 2,972 Sex: Female -0.82 0.06 <.0001 0.0234 2,972 ELL status† 0.55 0.17 0.0008 0.0035 2,972 Overage for grade 1.89 0.23 <.0001 0.0233 2,972
Urban residence† 1.05 0.11 <.0001 0.0343 2,972 Suspension Suspensions, end of year 0.36 0.02 <.0001 0.1827 2,972 Attendance
Attendance rate, end of year -17.50 0.87 <.0001 0. 2609 2,972 Mobility - Changed schools during school year (Yes/No) † 1.13 0.14 <.0001 0.0205 2,972
Title I participation (Yes/No) School-wide 0.80 0.10 <.0001 0. 0229 2,972
MEPA Levels (Yes/No)
Low level 0.73 0.18 <.0001 0.0050 2,972
8th grade MCAS
MATH
Warning 2.72 0.33 <.0001 0.1446 2,718 Needs Improvement 1.31 0.34 0.0001
Proficient 0.26 0.37 0.4691
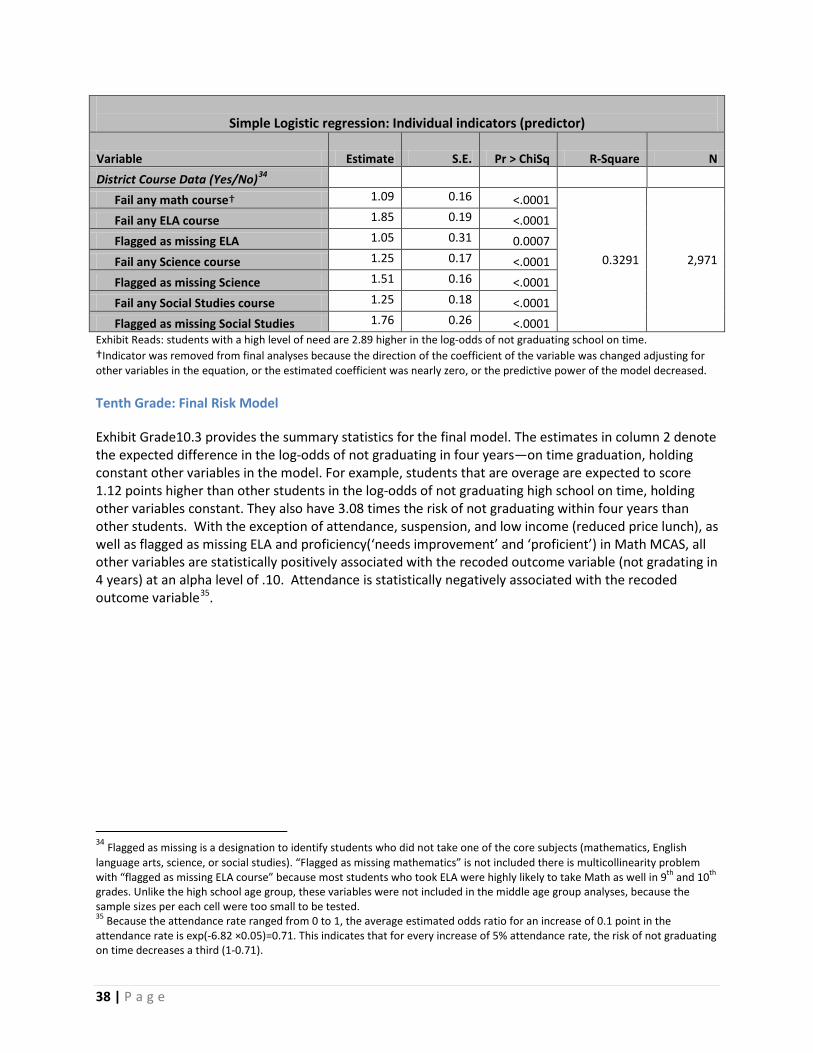
38 | P a g e
Simple Logistic regression: Individual indicators (predictor)
Variable Estimate S.E. Pr > ChiSq R-Square N District Course Data (Yes/No)34
Fail any math course† 1.09 0.16 <.0001
0.3291 2,971
Fail any ELA course 1.85 0.19 <.0001 Flagged as missing ELA 1.05 0.31 0.0007 Fail any Science course 1.25 0.17 <.0001 Flagged as missing Science 1.51 0.16 <.0001 Fail any Social Studies course 1.25 0.18 <.0001 Flagged as missing Social Studies 1.76 0.26 <.0001 Exhibit Reads: students with a high level of need are 2.89 higher in the log-odds of not graduating school on time. †Indicator was removed from final analyses because the direction of the coefficient of the variable was changed adjusting for other variables in the equation, or the estimated coefficient was nearly zero, or the predictive power of the model decreased. Tenth Grade: Final Risk Model Exhibit Grade10.3 provides the summary statistics for the final model. The estimates in column 2 denote the expected difference in the log-odds of not graduating in four years—on time graduation, holding constant other variables in the model. For example, students that are overage are expected to score 1.12 points higher than other students in the log-odds of not graduating high school on time, holding other variables constant. They also have 3.08 times the risk of not graduating within four years than other students. With the exception of attendance, suspension, and low income (reduced price lunch), as well as flagged as missing ELA and proficiency(‘needs improvement’ and ‘proficient’) in Math MCAS, all other variables are statistically positively associated with the recoded outcome variable (not gradating in 4 years) at an alpha level of .10. Attendance is statistically negatively associated with the recoded outcome variable35.
34 Flagged as missing is a designation to identify students who did not take one of the core subjects (mathematics, English language arts, science, or social studies). “Flagged as missing mathematics” is not included there is multicollinearity problem with “flagged as missing ELA course” because most students who took ELA were highly likely to take Math as well in 9th and 10th grades. Unlike the high school age group, these variables were not included in the middle age group analyses, because the sample sizes per each cell were too small to be tested. 35 Because the attendance rate ranged from 0 to 1, the average estimated odds ratio for an increase of 0.1 point in the attendance rate is exp(-6.82 ×0.05)=0.71. This indicates that for every increase of 5% attendance rate, the risk of not graduating on time decreases a third (1-0.71).
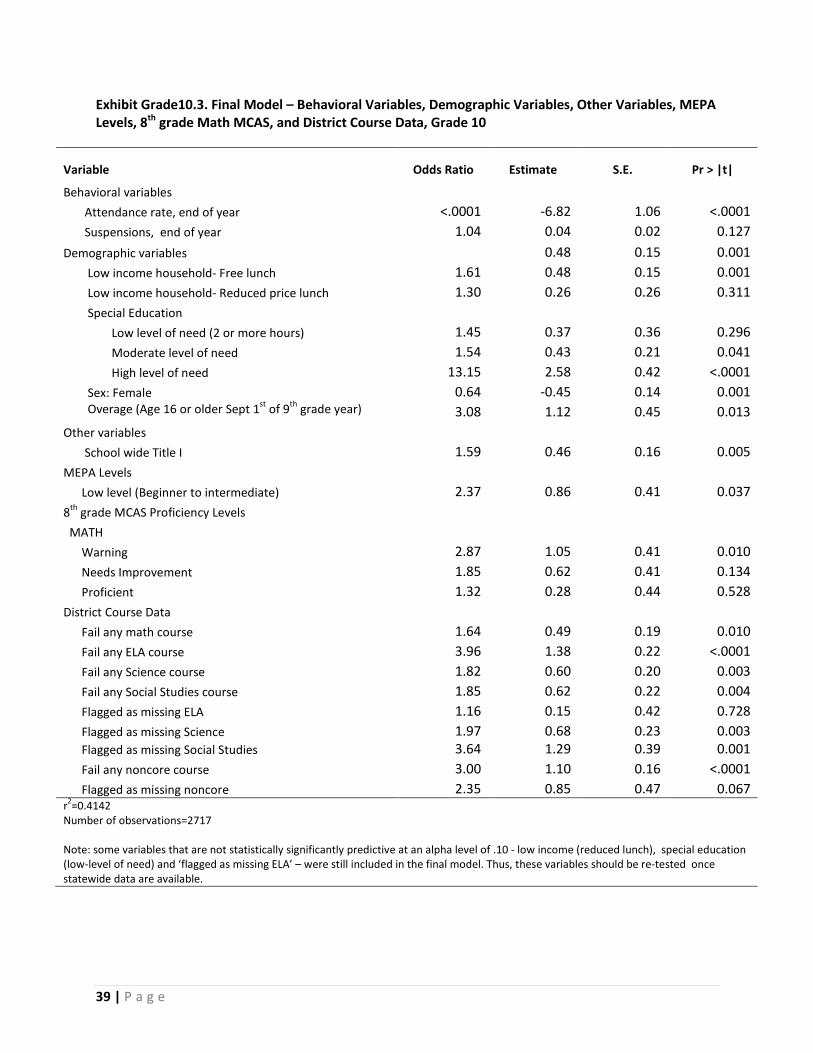
39 | P a g e
Exhibit Grade10.3. Final Model – Behavioral Variables, Demographic Variables, Other Variables, MEPA Levels, 8th grade Math MCAS, and District Course Data, Grade 10
Variable Odds Ratio Estimate S.E. Pr > |t|
Behavioral variables Attendance rate, end of year <.0001 -6.82 1.06 <.0001
Suspensions, end of year 1.04 0.04 0.02 0.127 Demographic variables 0.48 0.15 0.001 Low income household- Free lunch 1.61 0.48 0.15 0.001 Low income household- Reduced price lunch 1.30 0.26 0.26 0.311 Special Education
Low level of need (2 or more hours) 1.45 0.37 0.36 0.296 Moderate level of need 1.54 0.43 0.21 0.041 High level of need 13.15 2.58 0.42 <.0001 Sex: Female 0.64 -0.45 0.14 0.001 Overage (Age 16 or older Sept 1st of 9th grade year) 3.08 1.12 0.45 0.013 Other variables
School wide Title I 1.59 0.46 0.16 0.005 MEPA Levels
Low level (Beginner to intermediate) 2.37 0.86 0.41 0.037 8th grade MCAS Proficiency Levels
MATH Warning 2.87 1.05 0.41 0.010
Needs Improvement 1.85 0.62 0.41 0.134 Proficient 1.32 0.28 0.44 0.528 District Course Data
Fail any math course 1.64 0.49 0.19 0.010 Fail any ELA course 3.96 1.38 0.22 <.0001 Fail any Science course 1.82 0.60 0.20 0.003 Fail any Social Studies course 1.85 0.62 0.22 0.004 Flagged as missing ELA 1.16 0.15 0.42 0.728 Flagged as missing Science 1.97 0.68 0.23 0.003 Flagged as missing Social Studies 3.64 1.29 0.39 0.001 Fail any noncore course 3.00 1.10 0.16 <.0001 Flagged as missing noncore 2.35 0.85 0.47 0.067 r2=0.4142 Number of observations=2717 Note: some variables that are not statistically significantly predictive at an alpha level of .10 - low income (reduced lunch), special education (low-level of need) and ‘flagged as missing ELA’ – were still included in the final model. Thus, these variables should be re-tested once statewide data are available.
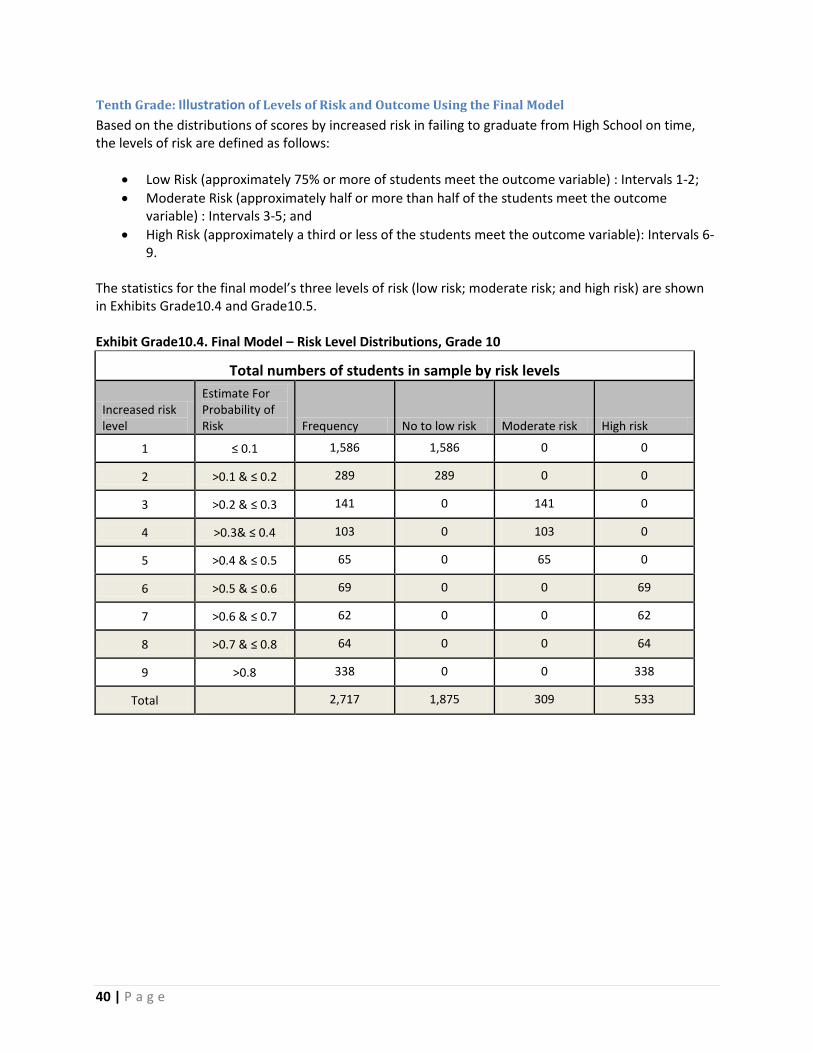
40 | P a g e
Tenth Grade: Illustration of Levels of Risk and Outcome Using the Final Model Based on the distributions of scores by increased risk in failing to graduate from High School on time, the levels of risk are defined as follows:
• Low Risk (approximately 75% or more of students meet the outcome variable) : Intervals 1-2; • Moderate Risk (approximately half or more than half of the students meet the outcome
variable) : Intervals 3-5; and • High Risk (approximately a third or less of the students meet the outcome variable): Intervals 6-
9. The statistics for the final model’s three levels of risk (low risk; moderate risk; and high risk) are shown in Exhibits Grade10.4 and Grade10.5. Exhibit Grade10.4. Final Model – Risk Level Distributions, Grade 10
Total numbers of students in sample by risk levels
Increased risk level
Estimate For Probability of Risk Frequency No to low risk Moderate risk High risk
1 ≤ 0.1 1,586 1,586 0 0
2 >0.1 & ≤ 0.2 289 289 0 0
3 >0.2 & ≤ 0.3 141 0 141 0
4 >0.3& ≤ 0.4 103 0 103 0
5 >0.4 & ≤ 0.5 65 0 65 0
6 >0.5 & ≤ 0.6 69 0 0 69
7 >0.6 & ≤ 0.7 62 0 0 62
8 >0.7 & ≤ 0.8 64 0 0 64
9 >0.8 338 0 0 338
Total 2,717 1,875 309 533
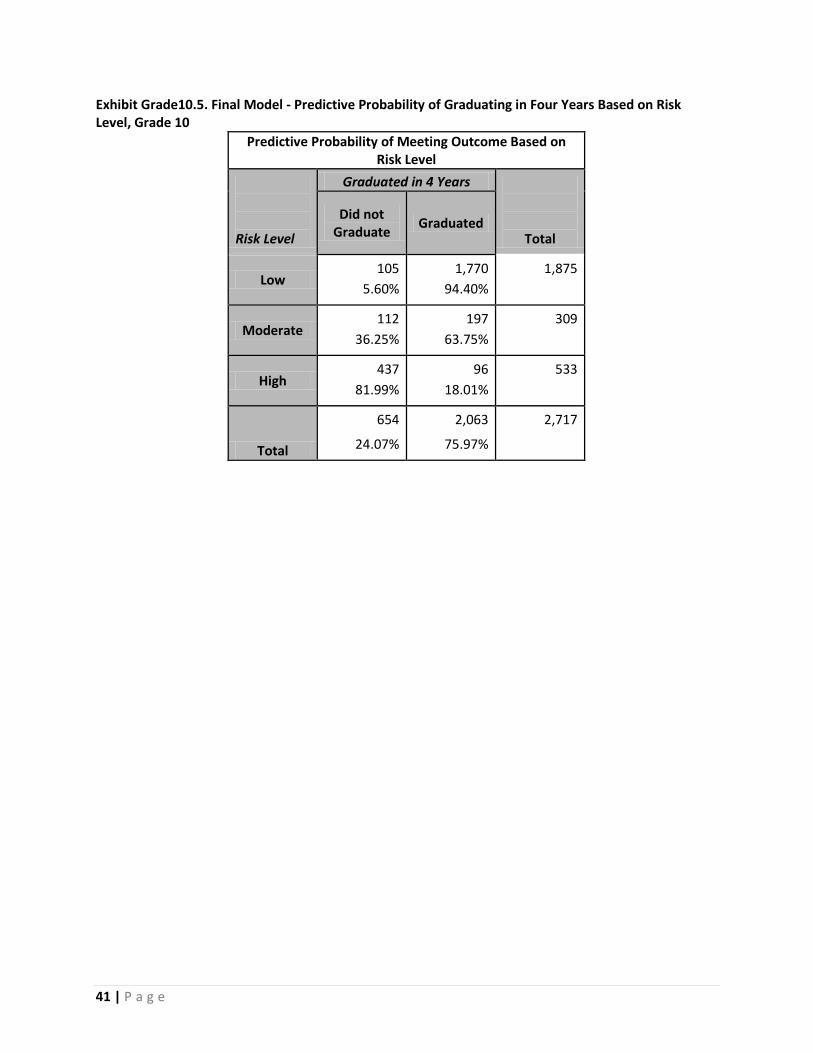
41 | P a g e
Exhibit Grade10.5. Final Model - Predictive Probability of Graduating in Four Years Based on Risk Level, Grade 10
Predictive Probability of Meeting Outcome Based on Risk Level
Risk Level
Graduated in 4 Years
Total
Did not Graduate Graduated
Low 105
5.60% 1,770
94.40% 1,875
Moderate 112
36.25% 197
63.75% 309
High 437
81.99% 96
18.01% 533
Total
654
24.07%
2,063
75.97%
2,717
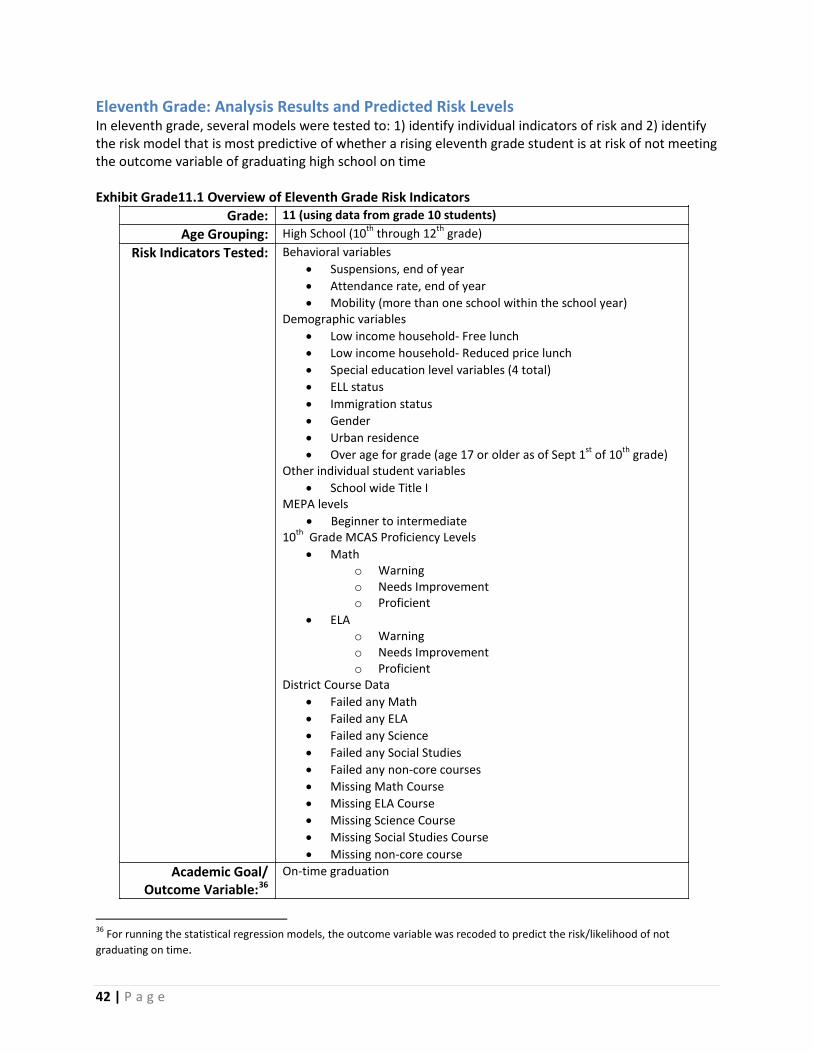
42 | P a g e
Eleventh Grade: Analysis Results and Predicted Risk Levels In eleventh grade, several models were tested to: 1) identify individual indicators of risk and 2) identify the risk model that is most predictive of whether a rising eleventh grade student is at risk of not meeting the outcome variable of graduating high school on time Exhibit Grade11.1 Overview of Eleventh Grade Risk Indicators
Grade: 11 (using data from grade 10 students) Age Grouping: High School (10th through 12th grade)
Risk Indicators Tested: Behavioral variables • Suspensions, end of year • Attendance rate, end of year • Mobility (more than one school within the school year)
Demographic variables • Low income household- Free lunch • Low income household- Reduced price lunch • Special education level variables (4 total) • ELL status • Immigration status • Gender • Urban residence • Over age for grade (age 17 or older as of Sept 1st of 10th grade)
Other individual student variables • School wide Title I
MEPA levels • Beginner to intermediate 10th Grade MCAS Proficiency Levels
• Math o Warning o Needs Improvement o Proficient
• ELA o Warning o Needs Improvement o Proficient
District Course Data • Failed any Math • Failed any ELA • Failed any Science • Failed any Social Studies • Failed any non-core courses • Missing Math Course • Missing ELA Course • Missing Science Course • Missing Social Studies Course • Missing non-core course
Academic Goal/ Outcome Variable:36
On-time graduation
36 For running the statistical regression models, the outcome variable was recoded to predict the risk/likelihood of not graduating on time.

43 | P a g e
NOTE: A total of 2593 observations included this combined outcome variable for the final model. Approximately 86 percent graduated within 4 years, and the remaining 14 percent did not. Eleventh Grade: Simple Logistics – Analysis of Individual Indicators In order to build an efficient and accurate model for the EWIS, we first examined a number of behavioral, demographic, other indicators, MEPA, MCAS, and district course data, tied to individual students that may be considered in the resulting risk model. This analysis relied on simple logistic regressions for each individual indicator. The single indicator analyses allowed us to evaluate the statistical significance and coefficient for each indicator (Exhibit Grade11.2). This analysis was used to inform the construction of the final risk model (Exhibit Grade11.3). Exhibit Grade11.2. Simple Logistic Regression Overview, Grade 11
Simple Logistic regression: Individual indicators (predictor)
Variable Estimate S.E. Pr > ChiSq R-Square N Demographic variables (Yes/No)
Low income household- Free lunch 1.20 0.12 <.0001 0.0380 2,594 Low income household- Reduced
price lunch 0.55 0.23 0.0181 Special education
Low level of need (less than 2 hours)† 0.53 0.50 0.2827
0.0594 2,594 Low level of need (2 or more hours) 0.40 0.39 0.3036 Moderate level of need 1.33 0.18 <.0001
High level of need 3.50 0.38 <.0001 Immigration status† 0.37 0.22 0.0979 0.0010 2,594 Sex: Female† -0.47 0.11 <.0001 0.0067 2,594 ELL status† 0.79 0.19 <.0001 0.0058 2,594 Overage for grade 1.85 0.24 <.0001 0.0208 2,594
Urban residence † 0.77 0.14 <.0001 0.0132 2,594 Suspension Suspensions, end of year 0.29 0.02 <.0001 0.0749 2,594 Attendance
Attendance rate, end of year -15.69 0.93 <.0001 0. 1695 2,594 Mobility - Changed schools during school year (Yes/No) † 1.46 0.22 <.0001 0.0066 2,594
Title I participation (Yes/No) School-wide 0.75 0.13 <.0001 0. 0129 2,594
MEPA Levels (Yes/No)
Low level† 0.98 0.22 <.0001 0.0066 2,594
10th grade MCAS
ELA
Warning† 4.06 0.36 <.0001
0.119 2,483 Needs Improvement† 2.48 0.33 <.0001
Proficient† 1.20 0.34 <.0001
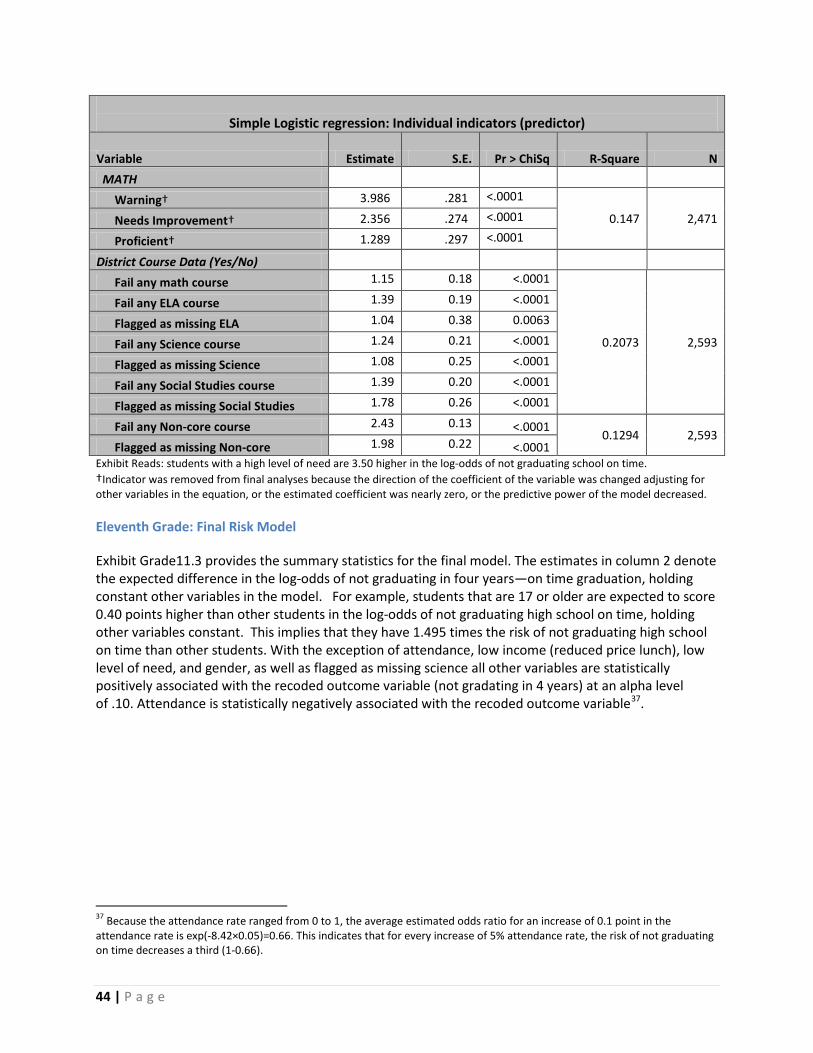
44 | P a g e
Simple Logistic regression: Individual indicators (predictor)
Variable Estimate S.E. Pr > ChiSq R-Square N MATH
Warning† 3.986 .281 <.0001
0.147 2,471 Needs Improvement† 2.356 .274 <.0001
Proficient† 1.289 .297 <.0001
District Course Data (Yes/No)
Fail any math course 1.15 0.18 <.0001
0.2073 2,593
Fail any ELA course 1.39 0.19 <.0001
Flagged as missing ELA 1.04 0.38 0.0063
Fail any Science course 1.24 0.21 <.0001
Flagged as missing Science 1.08 0.25 <.0001
Fail any Social Studies course 1.39 0.20 <.0001
Flagged as missing Social Studies 1.78 0.26 <.0001
Fail any Non-core course 2.43 0.13 <.0001 0.1294 2,593
Flagged as missing Non-core 1.98 0.22 <.0001 Exhibit Reads: students with a high level of need are 3.50 higher in the log-odds of not graduating school on time. †Indicator was removed from final analyses because the direction of the coefficient of the variable was changed adjusting for other variables in the equation, or the estimated coefficient was nearly zero, or the predictive power of the model decreased. Eleventh Grade: Final Risk Model Exhibit Grade11.3 provides the summary statistics for the final model. The estimates in column 2 denote the expected difference in the log-odds of not graduating in four years—on time graduation, holding constant other variables in the model. For example, students that are 17 or older are expected to score 0.40 points higher than other students in the log-odds of not graduating high school on time, holding other variables constant. This implies that they have 1.495 times the risk of not graduating high school on time than other students. With the exception of attendance, low income (reduced price lunch), low level of need, and gender, as well as flagged as missing science all other variables are statistically positively associated with the recoded outcome variable (not gradating in 4 years) at an alpha level of .10. Attendance is statistically negatively associated with the recoded outcome variable37.
37 Because the attendance rate ranged from 0 to 1, the average estimated odds ratio for an increase of 0.1 point in the attendance rate is exp(-8.42×0.05)=0.66. This indicates that for every increase of 5% attendance rate, the risk of not graduating on time decreases a third (1-0.66).

45 | P a g e
Exhibit Grade11.3. Final Model – Behavioral Variables, Demographic Variables, Other Variables, MEPA Levels, and District Course Data, Grade 11
Variable Odds Ratio Estimate S.E. Pr > |t|
Behavioral variables Attendance rate, end of year <0.001 -8.42 1.14 <.0001
Suspensions, end of year 1.05 0.05 0.03 0.09 Demographic variables
Low income household- Free lunch 1.49 0.40 0.17 0.02 Low income household- Reduced price lunch 1.44 0.36 0.30 0.22 Special Education
Low level of need (> 2 hours) 1.61 0.47 0.47 0.31 Moderate level of need 3.87 1.35 0.24 <.0001 High level of need 39.90 3.69 0.44 <.0001 Gender 0.86 -0.16 0.16 0.33 Overage for Grade 2.37 0.86 0.35 0.01 MEPA Levels
Low level (Beginner to intermediate) 1.44 0.36 0.36 0.31 Other variables
School wide Title I 1.49 0.40 0.19 0.03 District Course Data
Fail any math course 2.27 0.82 0.20 <.0001 Fail any ELA course 2.52 0.93 0.22 <.0001 Fail any Science course 2.02 0.70 0.23 0.00 Fail any Social Studies course 2.38 0.87 0.23 <.0001 Flagged as missing ELA 2.56 0.94 0.47 0.05 Flagged as missing Science 1.25 0.22 0.30 0.47 Flagged as missing Social Studies 2.06 0.72 0.34 0.03 Fail any noncore course 2.28 0.83 0.20 <.0001 Flagged as missing noncore 3.13 1.14 0.34 0.00 r2=0.2917 Number of observations=2570 Note: some variables that are not statistically significantly predictive at an alpha level of .10 - low income (reduced lunch), gender, special education (low-level of need) and ‘flagged as missing science’ – were still included in the final model. Thus, these variables should be re-tested once statewide data are available. Urban indicator and ‘flagged as missing Math’ were not included because the coefficient was changed negatively on not graduating on time adjusting for other variables in the model.
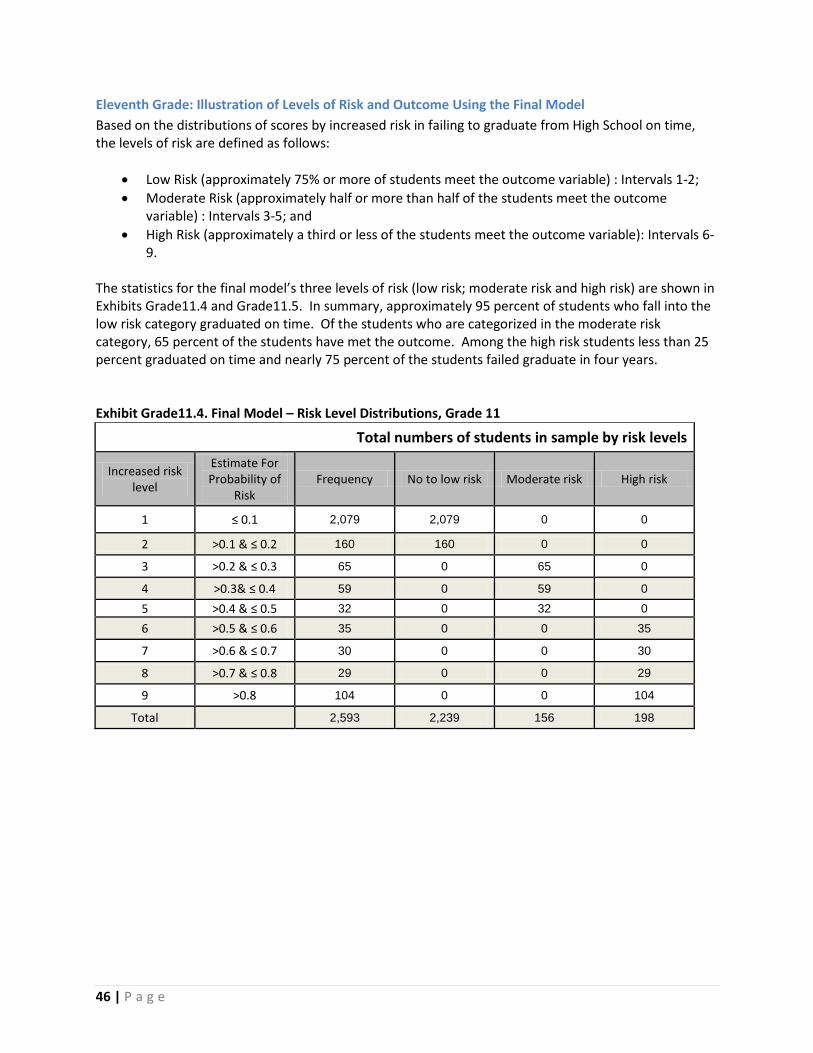
46 | P a g e
Eleventh Grade: Illustration of Levels of Risk and Outcome Using the Final Model Based on the distributions of scores by increased risk in failing to graduate from High School on time, the levels of risk are defined as follows:
• Low Risk (approximately 75% or more of students meet the outcome variable) : Intervals 1-2; • Moderate Risk (approximately half or more than half of the students meet the outcome
variable) : Intervals 3-5; and • High Risk (approximately a third or less of the students meet the outcome variable): Intervals 6-
9. The statistics for the final model’s three levels of risk (low risk; moderate risk and high risk) are shown in Exhibits Grade11.4 and Grade11.5. In summary, approximately 95 percent of students who fall into the low risk category graduated on time. Of the students who are categorized in the moderate risk category, 65 percent of the students have met the outcome. Among the high risk students less than 25 percent graduated on time and nearly 75 percent of the students failed graduate in four years. Exhibit Grade11.4. Final Model – Risk Level Distributions, Grade 11
Total numbers of students in sample by risk levels
Increased risk level
Estimate For Probability of
Risk Frequency No to low risk Moderate risk High risk
1 ≤ 0.1 2,079 2,079 0 0
2 >0.1 & ≤ 0.2 160 160 0 0
3 >0.2 & ≤ 0.3 65 0 65 0
4 >0.3& ≤ 0.4 59 0 59 0
5 >0.4 & ≤ 0.5 32 0 32 0
6 >0.5 & ≤ 0.6 35 0 0 35
7 >0.6 & ≤ 0.7 30 0 0 30
8 >0.7 & ≤ 0.8 29 0 0 29
9 >0.8 104 0 0 104
Total 2,593 2,239 156 198

47 | P a g e
Exhibit Grade11.5 Final Model - Predictive Probability of Graduating in Four Years Based on Risk Level, Grade 11
Predictive Probability of Graduating in Four Years Based on Risk Level
Risk Level
Graduated in 4 Years
Total
Did not Graduate Graduated
Low 99 4.68%
2018 95.32% 2239
Moderate 70 35.00%
130 65.00% 156
High 191 75.49%
62 24.51% 198
Total 360
14.01% 2210
85.99% 2593

48 | P a g e
Twelfth Grade: Analysis Results and Predicted Risk Levels For twelfth grade, several models were tested to: 1) identify individual indicators of risk and 2) identify the risk model that is most predictive of whether a rising twelfth grade student is at risk of not meeting the combined outcome variable of graduating high school on time. Exhibit Grade12.1 Overview of Twelfth Grade Risk Indicators
Grade: 12 (using data from grade 11 students) Age Grouping: High School (10th through 12th grade)
Risk Indicators Tested: Behavioral variables • Suspensions, end of year • Attendance rate, end of year • Mobility (more than one school within the school year)
Demographic variables • Low income household- Free lunch • Low income household- Reduced price lunch • Special education level variables (4 total) • ELL status • Immigration status • Gender • Urban residence • Over age for grade (age 18 or older as of Sept 1st in 11th grade)
Other individual student variables • School wide Title I
MEPA levels • Beginner to intermediate 10th Grade MCAS Proficiency Levels
• Math o Warning o Needs Improvement o Proficient
• ELA o Warning o Needs Improvement o Proficient
District Course information • Failed any Math • Failed any ELA • Failed any Science • Failed any Social Studies • Failed any non-core courses • Missing Math Course • Missing ELA Course • Missing Science Course • Missing Social Studies Course
Academic Goal/ Outcome Variable:38
On-time graduation
38 For running the statistical regression models, the outcome variable was recoded to predict the risk/likelihood of not graduating on time.
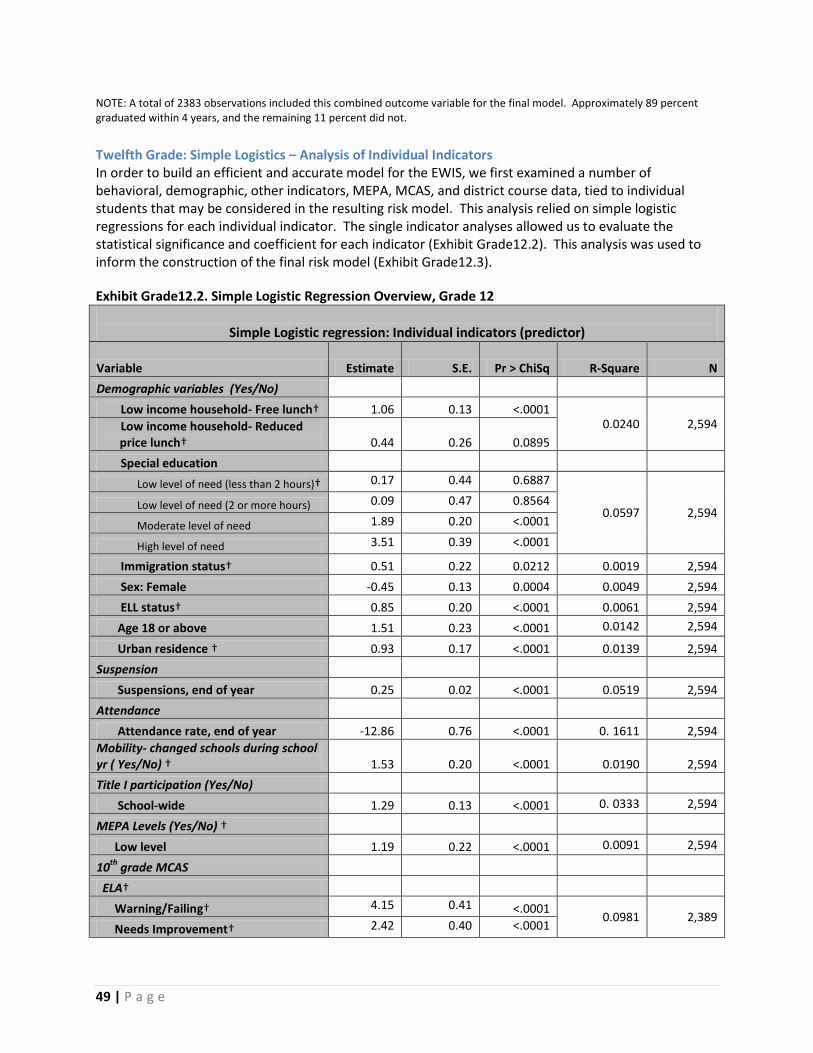
49 | P a g e
NOTE: A total of 2383 observations included this combined outcome variable for the final model. Approximately 89 percent graduated within 4 years, and the remaining 11 percent did not.
Twelfth Grade: Simple Logistics – Analysis of Individual Indicators In order to build an efficient and accurate model for the EWIS, we first examined a number of behavioral, demographic, other indicators, MEPA, MCAS, and district course data, tied to individual students that may be considered in the resulting risk model. This analysis relied on simple logistic regressions for each individual indicator. The single indicator analyses allowed us to evaluate the statistical significance and coefficient for each indicator (Exhibit Grade12.2). This analysis was used to inform the construction of the final risk model (Exhibit Grade12.3). Exhibit Grade12.2. Simple Logistic Regression Overview, Grade 12
Simple Logistic regression: Individual indicators (predictor)
Variable Estimate S.E. Pr > ChiSq R-Square N Demographic variables (Yes/No)
Low income household- Free lunch† 1.06 0.13 <.0001 0.0240 2,594 Low income household- Reduced
price lunch† 0.44 0.26 0.0895 Special education
Low level of need (less than 2 hours)† 0.17 0.44 0.6887
0.0597 2,594 Low level of need (2 or more hours) 0.09 0.47 0.8564
Moderate level of need 1.89 0.20 <.0001
High level of need 3.51 0.39 <.0001
Immigration status† 0.51 0.22 0.0212 0.0019 2,594 Sex: Female -0.45 0.13 0.0004 0.0049 2,594 ELL status† 0.85 0.20 <.0001 0.0061 2,594 Age 18 or above 1.51 0.23 <.0001 0.0142 2,594
Urban residence † 0.93 0.17 <.0001 0.0139 2,594 Suspension Suspensions, end of year 0.25 0.02 <.0001 0.0519 2,594 Attendance
Attendance rate, end of year -12.86 0.76 <.0001 0. 1611 2,594 Mobility- changed schools during school yr ( Yes/No) † 1.53 0.20 <.0001 0.0190 2,594 Title I participation (Yes/No) School-wide 1.29 0.13 <.0001 0. 0333 2,594
MEPA Levels (Yes/No) †
Low level 1.19 0.22 <.0001 0.0091 2,594
10th grade MCAS
ELA†
Warning/Failing† 4.15 0.41 <.0001 0.0981 2,389
Needs Improvement† 2.42 0.40 <.0001
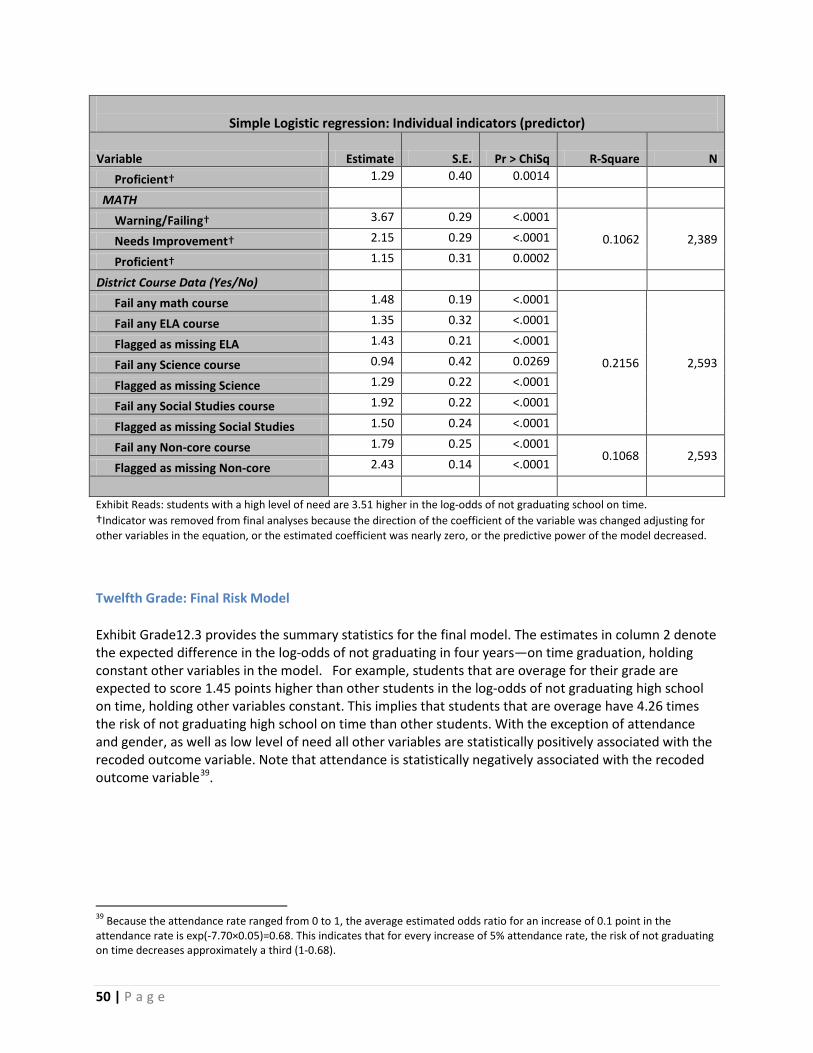
50 | P a g e
Simple Logistic regression: Individual indicators (predictor)
Variable Estimate S.E. Pr > ChiSq R-Square N Proficient† 1.29 0.40 0.0014
MATH
Warning/Failing† 3.67 0.29 <.0001
0.1062 2,389 Needs Improvement† 2.15 0.29 <.0001
Proficient† 1.15 0.31 0.0002
District Course Data (Yes/No)
Fail any math course 1.48 0.19 <.0001
0.2156 2,593
Fail any ELA course 1.35 0.32 <.0001
Flagged as missing ELA 1.43 0.21 <.0001
Fail any Science course 0.94 0.42 0.0269
Flagged as missing Science 1.29 0.22 <.0001
Fail any Social Studies course 1.92 0.22 <.0001
Flagged as missing Social Studies 1.50 0.24 <.0001
Fail any Non-core course 1.79 0.25 <.0001 0.1068 2,593
Flagged as missing Non-core 2.43 0.14 <.0001
Exhibit Reads: students with a high level of need are 3.51 higher in the log-odds of not graduating school on time. †Indicator was removed from final analyses because the direction of the coefficient of the variable was changed adjusting for other variables in the equation, or the estimated coefficient was nearly zero, or the predictive power of the model decreased.
Twelfth Grade: Final Risk Model Exhibit Grade12.3 provides the summary statistics for the final model. The estimates in column 2 denote the expected difference in the log-odds of not graduating in four years—on time graduation, holding constant other variables in the model. For example, students that are overage for their grade are expected to score 1.45 points higher than other students in the log-odds of not graduating high school on time, holding other variables constant. This implies that students that are overage have 4.26 times the risk of not graduating high school on time than other students. With the exception of attendance and gender, as well as low level of need all other variables are statistically positively associated with the recoded outcome variable. Note that attendance is statistically negatively associated with the recoded outcome variable39.
39 Because the attendance rate ranged from 0 to 1, the average estimated odds ratio for an increase of 0.1 point in the attendance rate is exp(-7.70×0.05)=0.68. This indicates that for every increase of 5% attendance rate, the risk of not graduating on time decreases approximately a third (1-0.68).
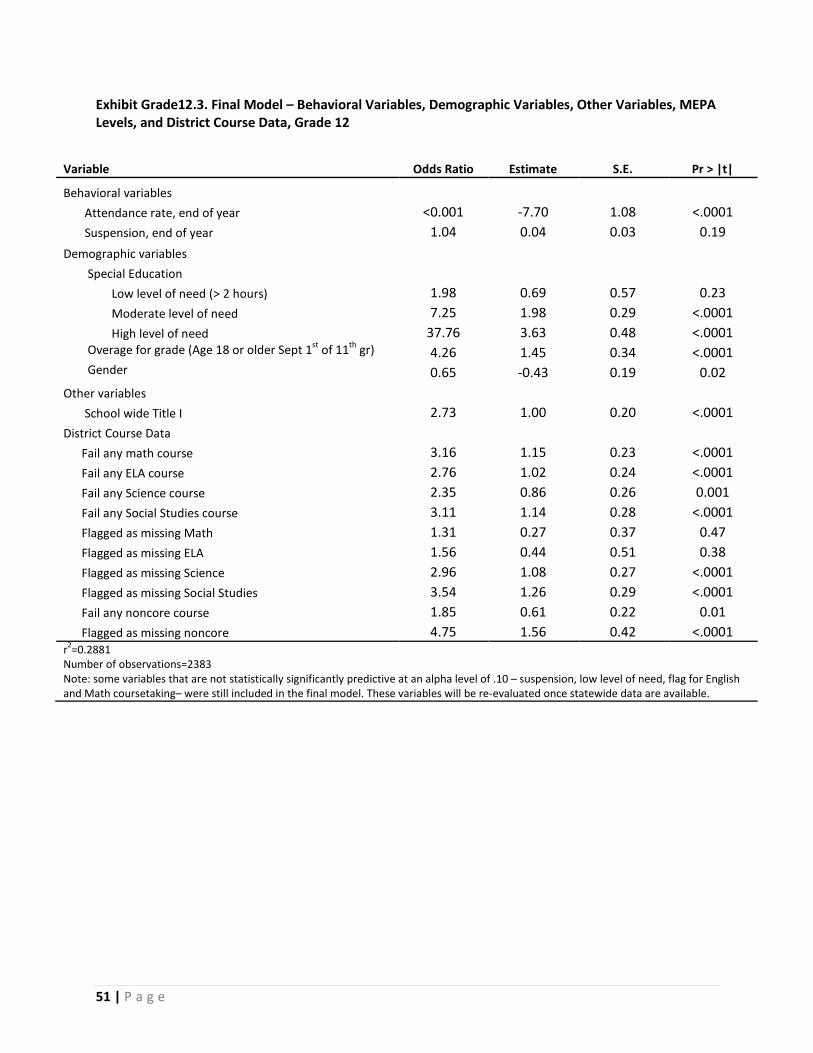
51 | P a g e
Exhibit Grade12.3. Final Model – Behavioral Variables, Demographic Variables, Other Variables, MEPA Levels, and District Course Data, Grade 12
Variable Odds Ratio Estimate S.E. Pr > |t|
Behavioral variables Attendance rate, end of year <0.001 -7.70 1.08 <.0001
Suspension, end of year 1.04 0.04 0.03 0.19 Demographic variables
Special Education Low level of need (> 2 hours) 1.98 0.69 0.57 0.23
Moderate level of need 7.25 1.98 0.29 <.0001 High level of need 37.76 3.63 0.48 <.0001 Overage for grade (Age 18 or older Sept 1st of 11th gr) 4.26 1.45 0.34 <.0001 Gender 0.65 -0.43 0.19 0.02 Other variables
School wide Title I 2.73 1.00 0.20 <.0001 District Course Data
Fail any math course 3.16 1.15 0.23 <.0001 Fail any ELA course 2.76 1.02 0.24 <.0001 Fail any Science course 2.35 0.86 0.26 0.001 Fail any Social Studies course 3.11 1.14 0.28 <.0001 Flagged as missing Math 1.31 0.27 0.37 0.47 Flagged as missing ELA 1.56 0.44 0.51 0.38 Flagged as missing Science 2.96 1.08 0.27 <.0001 Flagged as missing Social Studies 3.54 1.26 0.29 <.0001 Fail any noncore course 1.85 0.61 0.22 0.01 Flagged as missing noncore 4.75 1.56 0.42 <.0001 r2=0.2881 Number of observations=2383 Note: some variables that are not statistically significantly predictive at an alpha level of .10 – suspension, low level of need, flag for English and Math coursetaking– were still included in the final model. These variables will be re-evaluated once statewide data are available.
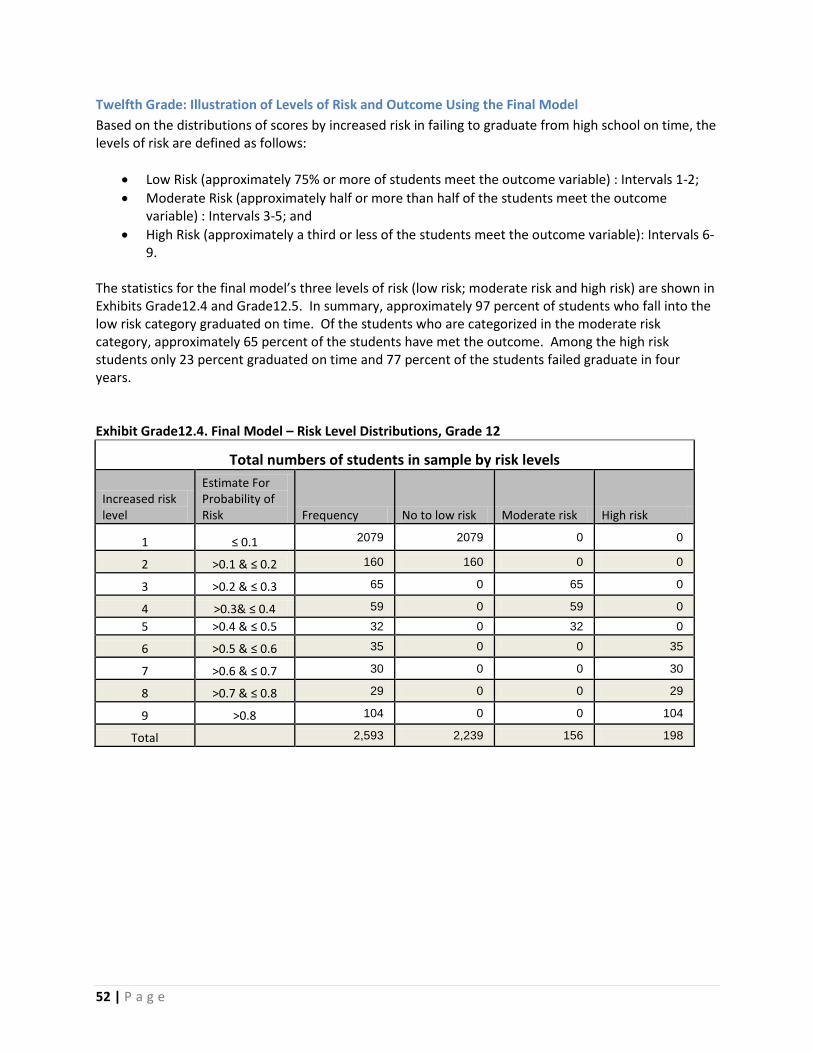
52 | P a g e
Twelfth Grade: Illustration of Levels of Risk and Outcome Using the Final Model Based on the distributions of scores by increased risk in failing to graduate from high school on time, the levels of risk are defined as follows:
• Low Risk (approximately 75% or more of students meet the outcome variable) : Intervals 1-2; • Moderate Risk (approximately half or more than half of the students meet the outcome
variable) : Intervals 3-5; and • High Risk (approximately a third or less of the students meet the outcome variable): Intervals 6-
9. The statistics for the final model’s three levels of risk (low risk; moderate risk and high risk) are shown in Exhibits Grade12.4 and Grade12.5. In summary, approximately 97 percent of students who fall into the low risk category graduated on time. Of the students who are categorized in the moderate risk category, approximately 65 percent of the students have met the outcome. Among the high risk students only 23 percent graduated on time and 77 percent of the students failed graduate in four years. Exhibit Grade12.4. Final Model – Risk Level Distributions, Grade 12
Total numbers of students in sample by risk levels
Increased risk level
Estimate For Probability of Risk Frequency No to low risk Moderate risk High risk
1 ≤ 0.1 2079 2079 0 0
2 >0.1 & ≤ 0.2 160 160 0 0
3 >0.2 & ≤ 0.3 65 0 65 0
4 >0.3& ≤ 0.4 59 0 59 0
5 >0.4 & ≤ 0.5 32 0 32 0
6 >0.5 & ≤ 0.6 35 0 0 35
7 >0.6 & ≤ 0.7 30 0 0 30
8 >0.7 & ≤ 0.8 29 0 0 29
9 >0.8 104 0 0 104
Total
2,593 2,239 156 198
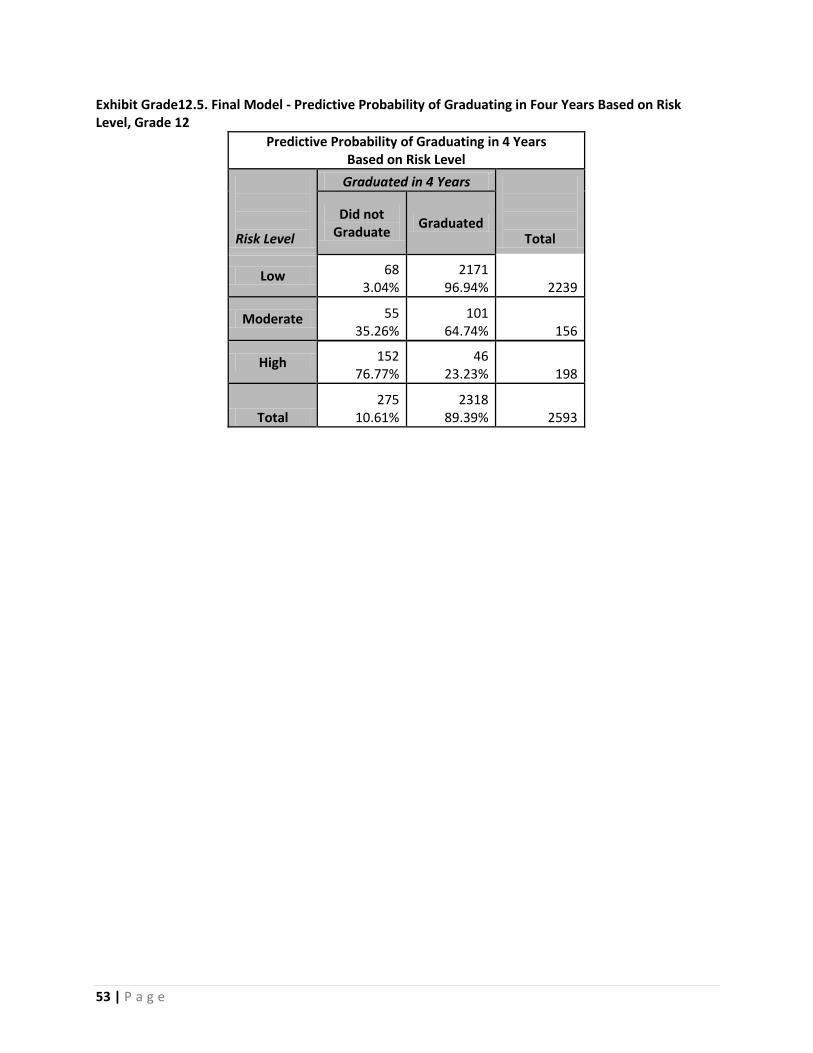
53 | P a g e
Exhibit Grade12.5. Final Model - Predictive Probability of Graduating in Four Years Based on Risk Level, Grade 12
Predictive Probability of Graduating in 4 Years Based on Risk Level
Risk Level
Graduated in 4 Years
Total
Did not Graduate Graduated
Low 68 3.04%
2171 96.94% 2239
Moderate 55 35.26%
101 64.74% 156
High 152 76.77%
46 23.23% 198
Total 275
10.61% 2318
89.39% 2593
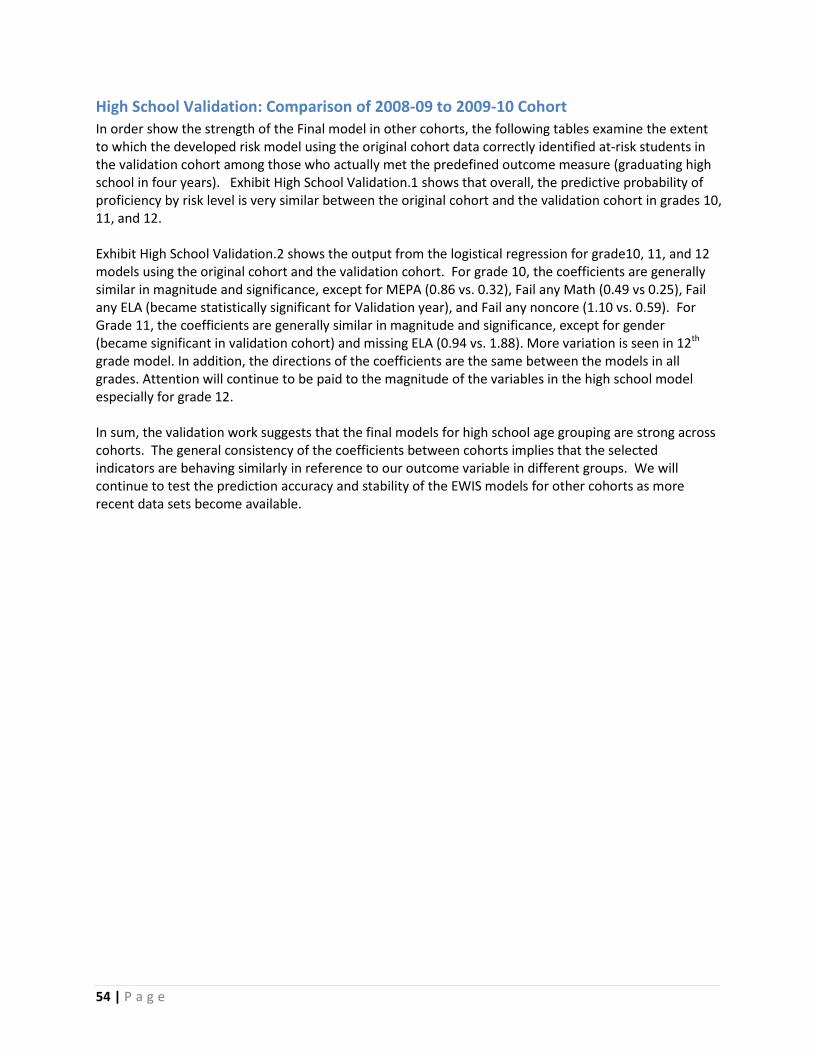
54 | P a g e
High School Validation: Comparison of 2008-09 to 2009-10 Cohort In order show the strength of the Final model in other cohorts, the following tables examine the extent to which the developed risk model using the original cohort data correctly identified at-risk students in the validation cohort among those who actually met the predefined outcome measure (graduating high school in four years). Exhibit High School Validation.1 shows that overall, the predictive probability of proficiency by risk level is very similar between the original cohort and the validation cohort in grades 10, 11, and 12. Exhibit High School Validation.2 shows the output from the logistical regression for grade10, 11, and 12 models using the original cohort and the validation cohort. For grade 10, the coefficients are generally similar in magnitude and significance, except for MEPA (0.86 vs. 0.32), Fail any Math (0.49 vs 0.25), Fail any ELA (became statistically significant for Validation year), and Fail any noncore (1.10 vs. 0.59). For Grade 11, the coefficients are generally similar in magnitude and significance, except for gender (became significant in validation cohort) and missing ELA (0.94 vs. 1.88). More variation is seen in 12th grade model. In addition, the directions of the coefficients are the same between the models in all grades. Attention will continue to be paid to the magnitude of the variables in the high school model especially for grade 12. In sum, the validation work suggests that the final models for high school age grouping are strong across cohorts. The general consistency of the coefficients between cohorts implies that the selected indicators are behaving similarly in reference to our outcome variable in different groups. We will continue to test the prediction accuracy and stability of the EWIS models for other cohorts as more recent data sets become available.
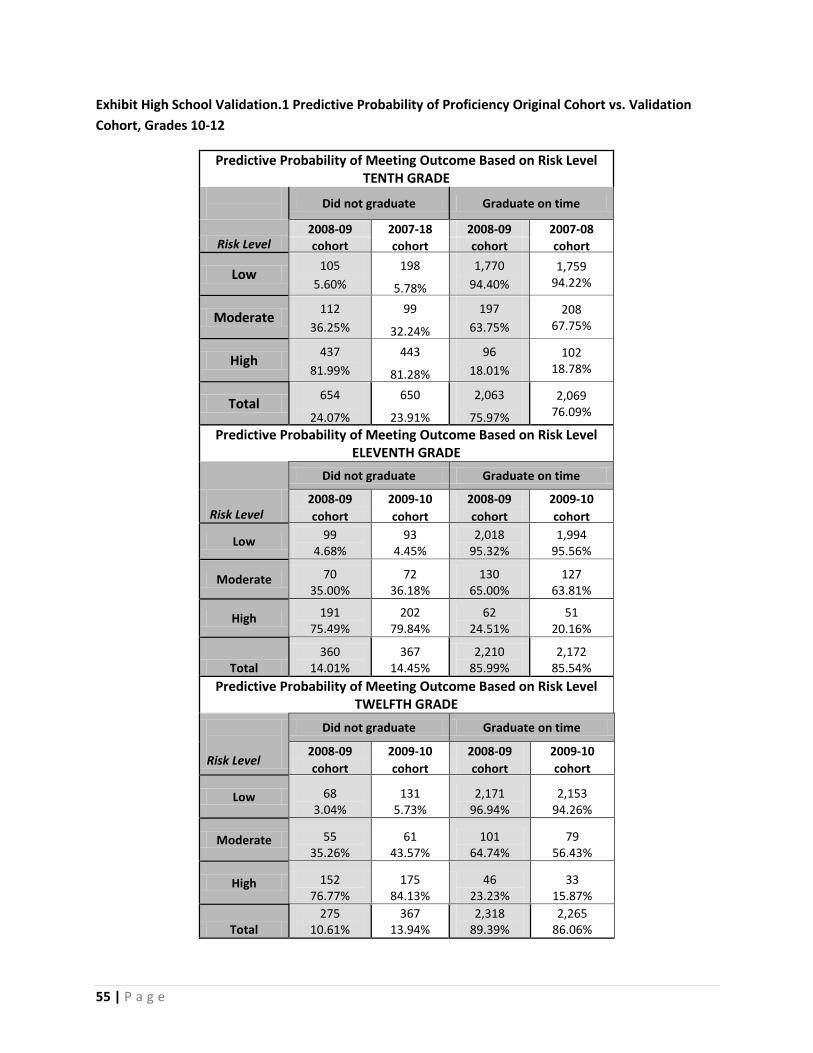
55 | P a g e
Exhibit High School Validation.1 Predictive Probability of Proficiency Original Cohort vs. Validation Cohort, Grades 10-12
Predictive Probability of Meeting Outcome Based on Risk Level TENTH GRADE
Did not graduate Graduate on time
Risk Level 2008-09 2007-18 2008-09 2007-08 cohort cohort cohort cohort
Low 105 5.60%
198
5.78%
1,770 94.40%
1,759 94.22%
Moderate 112 36.25%
99
32.24%
197 63.75%
208 67.75%
High 437 81.99%
443
81.28%
96 18.01%
102 18.78%
Total 654
24.07%
650
23.91%
2,063
75.97%
2,069 76.09%
Predictive Probability of Meeting Outcome Based on Risk Level ELEVENTH GRADE
Risk Level
Did not graduate Graduate on time
2008-09 2009-10 2008-09 2009-10 cohort cohort cohort cohort
Low 99 4.68%
93 4.45%
2,018 95.32%
1,994 95.56%
Moderate 70 35.00%
72 36.18%
130 65.00%
127 63.81%
High 191 75.49%
202 79.84%
62 24.51%
51 20.16%
Total 360
14.01% 367
14.45% 2,210
85.99% 2,172
85.54% Predictive Probability of Meeting Outcome Based on Risk Level
TWELFTH GRADE
Risk Level
Did not graduate Graduate on time
2008-09 2009-10 2008-09 2009-10 cohort cohort cohort cohort
Low 68 3.04%
131 5.73%
2,171 96.94%
2,153 94.26%
Moderate 55 35.26%
61 43.57%
101 64.74%
79 56.43%
High 152 76.77%
175 84.13%
46 23.23%
33 15.87%
Total 275
10.61% 367
13.94% 2,318
89.39% 2,265
86.06%
56 | P a g e
Exhibit High School Validation.2. Overview of Findings by Cohort Using Final Model
* Significant at 10%, **Significant at 5%, ***Significant at 1 - variable not included in model
Grade 10 Grade 11 Grade 12
Variable
Original Cohort
(2008-09)
Validation Cohort
(2007-08)
Original Cohort
(2008-09)
Validation Cohort
(2007-08)
Original Cohort
(2008-09)
Validation Cohort
(2007-08) Behavioral variables
Attendance rate, end of year -6.82*** -7.82*** -8.42*** -5.44*** -7.70*** -5.77***
Suspensions, end of year 0.04 0.05 0.05** 0.06** 0.04 0.60**
Demographic variables
Low income household- Free lunch 0.48*** 0.60*** 0.40*** 0.50*** - -
Low income household- Reduced price 0.26 0.20 0.36 0.25 - -
Special Education
Low level of need (2 or more hours) 0.37 -0.20 0.47 0.52 0.69 0.52
Moderate level of need 0.43** 0.43* 1.35*** 0.71*** 1.98*** 0.69***
High level of need 2.58*** 1.14*** 3.69*** 2.35*** 3.63*** 2.77***
Sex: Female -0.45*** -0.42*** -0.16 -0.25*** -0.43** -0.22
Overage for grade 1.12*** 1.51*** 0.86*** 1.12*** 1.45*** 1.22***
Other variables
School wide Title I 0.46*** 0.72*** 0.36*** 0.89*** 1.00*** 0.89***
MEPA Levels
Low level (Beginner to intermediate) 0.86** 0.32 0.40 0.55 - -
8th grade MCAS- Math
Warning 1.05*** 1.28*** - - - -
Needs Improvement 0.62* 0.79* - - - -
Proficient 0.28 0.25 - - - -
District Course Data
Fail any math course 0.49*** 0.25* 0.82*** 1.28*** 1.15*** 1.30***
Fail any ELA course 1.38 1.19*** 0.93*** 1.09*** 1.02*** 1.14***
Fail any Science course 0.60 0.76*** 0.70*** 0.72*** 0.86*** 0.75***
Fail any Social Studies course 0.60* 0.90*** 0.87** 1.29*** 1.14*** 1.31***
Flagged as missing Math 0.27 1.30** Flagged as missing ELA 0.15*** 0.68** 0.94 1.88*** 0.44 1.15** Flagged as missing Science 0.68*** 0.76*** 0.22*** 1.1*** 1.08*** 1.21***
Flagged as missing Social Studies 1.29*** 1.18*** 0.72*** 0.86** 1.26*** 0.95*
Fail any noncore course 1.10*** 0.59 0.83*** 0.94*** 0.61* 0.95***
Flagged as missing noncore 0.85*** 0.82** 1.14*** 0.70 1.56*** 0.72*

57 | P a g e
Appendix A.1 Seventh Grade: Alternate Risk Model- No Course Performance Data Behavioral Variables, Demographic Variables, Other Variables, MEPA Levels, MCAS Levels
Variable Estimate S.E. Pr > |t|
Behavioral variables Attendance rate, end of year -13.85 2.48 <.0001 Suspensions, end of year 0.35 0.18 0.05 Retained 0.14 0.36 0.92 Demographic variables
Low income household- Free lunch 0.54 0.21 0.01 Low income household- Reduced price lunch 0.68 0.29 0.02 Special Education (greater than or equal to 2 or more hours of need) 0.08 0.02 0.09 Urban residence 0.26 0.25 0.29 Sex: Female -0.44 0.17 0.01 Other variables
School wide Title I 0.73 0.22 0.001 MEPA Levels
Low level (Beginner to intermediate) 0.18 0.65 0.849 Grade 6 MCAS
ELA
Warning 1.38 0.35 <.0001
Needs Improvement 0.86 0.20 <.0001 Math
<.0001
Warning 2.34 0.51 <.0001 Needs Improvement 1.84 0.49 <.0001 Proficient 1.48 0.50 <.0001 r2=0.30 Number of observations: 1,035
58 | P a g e
A.2 Eighth Grade: Alternate Risk Model – No Course Performance Data Behavioral Variables, Demographic Variables, Other Variables, MCAS Levels.
Variable Estimate S.E. Pr > |t|
Behavioral variables Attendance rate, end of year -10.87 1.36 <.0001
Suspensions, end of year 0.47 0.09 <.0001 Demographic variables
Low income household- Free lunch 0.24 0.14 0.07 Low income household- Reduced lunch 0.25 0.20 0.20 Special education: Greater than or equal to 2 hours or more 0.08 0.08 0.64 Urban residence 0.49 0.19 0.01 Sex: Female -0.62 0.12 <.0001 Other variables
School wide Title I 0.65 0.13 <.0001
MCAS Prior Year ELA Warning 0.54 0.24 0.02
Needs Improvement 2.60 0.45 0.001 Math
Warning 2.60 0.45 <.0001
Needs Improvement 1.86 0.44 <.0001
Proficient 1.23 0.45 <.0001 r2=0.30 Number of observations: 1,958
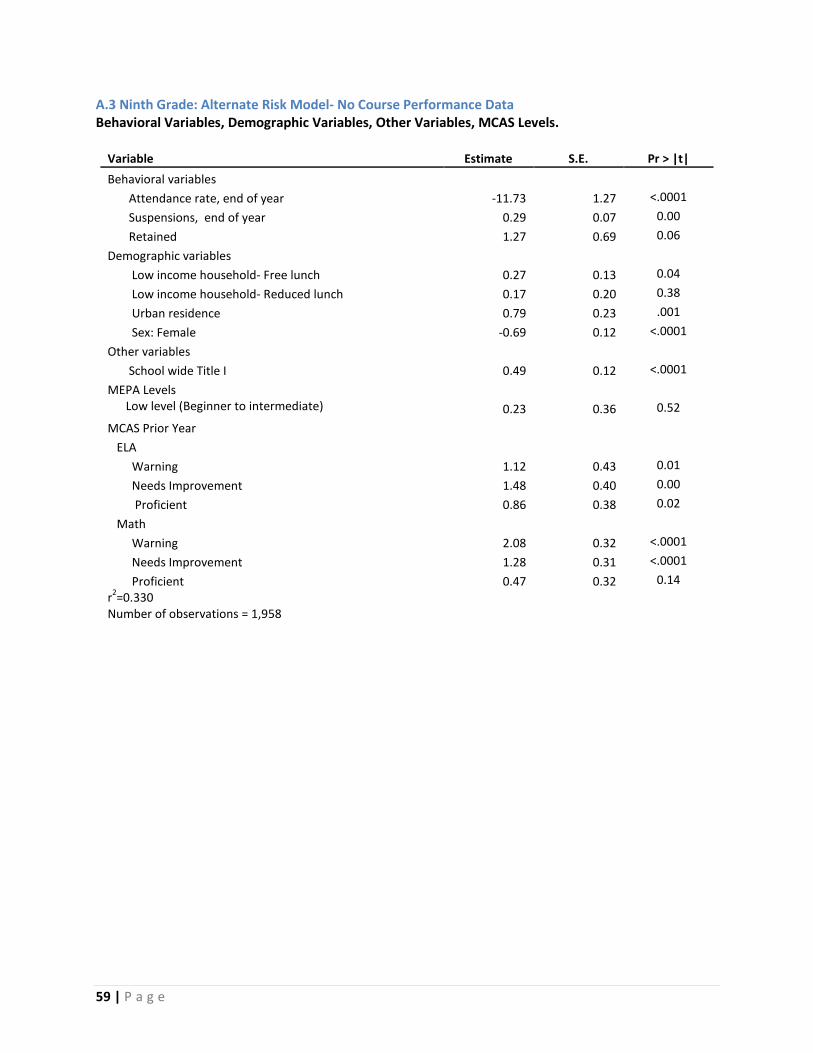
59 | P a g e
A.3 Ninth Grade: Alternate Risk Model- No Course Performance Data Behavioral Variables, Demographic Variables, Other Variables, MCAS Levels.
Variable Estimate S.E. Pr > |t| Behavioral variables
Attendance rate, end of year -11.73 1.27 <.0001 Suspensions, end of year 0.29 0.07 0.00 Retained 1.27 0.69 0.06 Demographic variables Low income household- Free lunch 0.27 0.13 0.04 Low income household- Reduced lunch 0.17 0.20 0.38 Urban residence 0.79 0.23 .001 Sex: Female -0.69 0.12 <.0001 Other variables School wide Title I 0.49 0.12 <.0001 MEPA Levels Low level (Beginner to intermediate) 0.23 0.36 0.52 MCAS Prior Year ELA Warning 1.12 0.43 0.01 Needs Improvement 1.48 0.40 0.00 Proficient 0.86 0.38 0.02 Math Warning 2.08 0.32 <.0001 Needs Improvement 1.28 0.31 <.0001 Proficient 0.47 0.32 0.14 r2=0.330 Number of observations = 1,958
60 | P a g e
References Jung, H., Therriault, S., and Prencipe, L. (2012). Massachusetts Early Warning Indicator System Risk
Model Documentation: Early and Late Elementary. Boston, MA: MA Executive Office of Education, Department of Early Education and Care, Elementary and Secondary Education, and Department of Higher Education.
Raudenbush, S. W., & Bryk, A. S. (2002). Hierarchical linear models: Applications and data analysis
methods (2nd ed.). Newbury Park, CA: Sage. Schabenberger, O. (2005). Introducing the GLIMMIX procedure for generalized linear mixed models.
Cary, NC: SAS Institute. Therriault, S.; Burke, M. & Milligan, D. (2011). A Review of Birth through Twelfth Grade Early Warning
Indicators for Consideration in the Massachusetts Early Warning Indicator System. Boston, MA: MA Executive Office of Education, Department of Early Education and Care, Elementary and Secondary Education, and Department of Higher Education.