Embed Size (px)
Citation preview

RESEARCH
Mass transfer efficiency of a tall and low plate free area liquidpulsed sieve-plate extraction column
Shahzad Y. Khawaja1 • Muhammad R. Usman1,2 • Muhammad Nasif1 •
Muhammad S. Akram3• Waheed Afzal1,4 • Niaz A. Akhtar1
Received: 23 January 2016 / Accepted: 24 August 2017 / Published online: 4 September 2017
� The Author(s) 2017. This article is an open access publication
Abstract Mass transfer performance is studied in a tall,
thin, and low plate free area liquid pulsed sieve-plate
extraction column. The 5.0 cm internal diameter column
consists of eighty sieve plates with percent free area of only
13.5. The effects of pulsation intensity (product of ampli-
tude and frequency) and dispersed phase velocity are
studied on the extraction efficiency of the column for the
acetic acid–kerosene–water system. A mass transfer cor-
relation for the measurement of overall mass transfer
coefficient is developed that best-fits the experimental data
obtained in the present study. Mathematical analysis of the
column is carried out that shows the insignificance of axial
diffusivities in the column.
Keywords Pulsed column � Pulsation intensity � Mass
transfer coefficient � Height of transfer unit � Axialdiffusivity
Abbreviations
a Interfacial area per unit volume of the
contactor, m2/m3
A Pulsation amplitude, m
do Diameter of sieve hole, m
Ex Axial diffusivity in aqueous phase, m2/s
Ey Axial diffusivity in organic phase, m2/s
f Pulsation frequency, s-1
H Height of column, m
(HTU)oc Overall height of transfer unit based on
continuous phase, m
(HTU)ocp Overall apparent height of transfer unit based
on continuous phase, m
Koca Overall mass transfer coefficient based on
continuous phase, s-1
Kocpa Overall apparent mass transfer coefficient
based on continuous phase, s-1
(Kocpa)mod Model or calculated overall apparent mass
transfer coefficient based on continuous
phase, s-1
(Kocpa)obs Observed or experimental overall apparent
mass transfer coefficient based on continuous
phase, s-1
l Plate spacing, m
m Equilibrium constant
N Number of data points
Np Number of plates
(NTU)oc Overall number of transfer units based on
continuous phase
(NTU)ocp Overall apparent number of transfer based on
continuous phase
p Plate spacing, m
uc Superficial continuous phase velocity, m/s
ud Superficial dispersed phase velocity, m/s
& Muhammad R. Usman
Waheed Afzal
1 Institute of Chemical Engineering and Technology,
University of the Punjab, Lahore 54590, Pakistan
2 Department of Petroleum and Chemical Engineering, Sultan
Qaboos University, Muscat 123, Sultanate of Oman
3 COMSATS Institute of Information Technology,
Lahore 54000, Pakistan
4 School of Engineering, University of Aberdeen,
AB24 3UI Aberdeen, Scotland, UK
123
Int J Ind Chem (2017) 8:397–410
https://doi.org/10.1007/s40090-017-0129-9
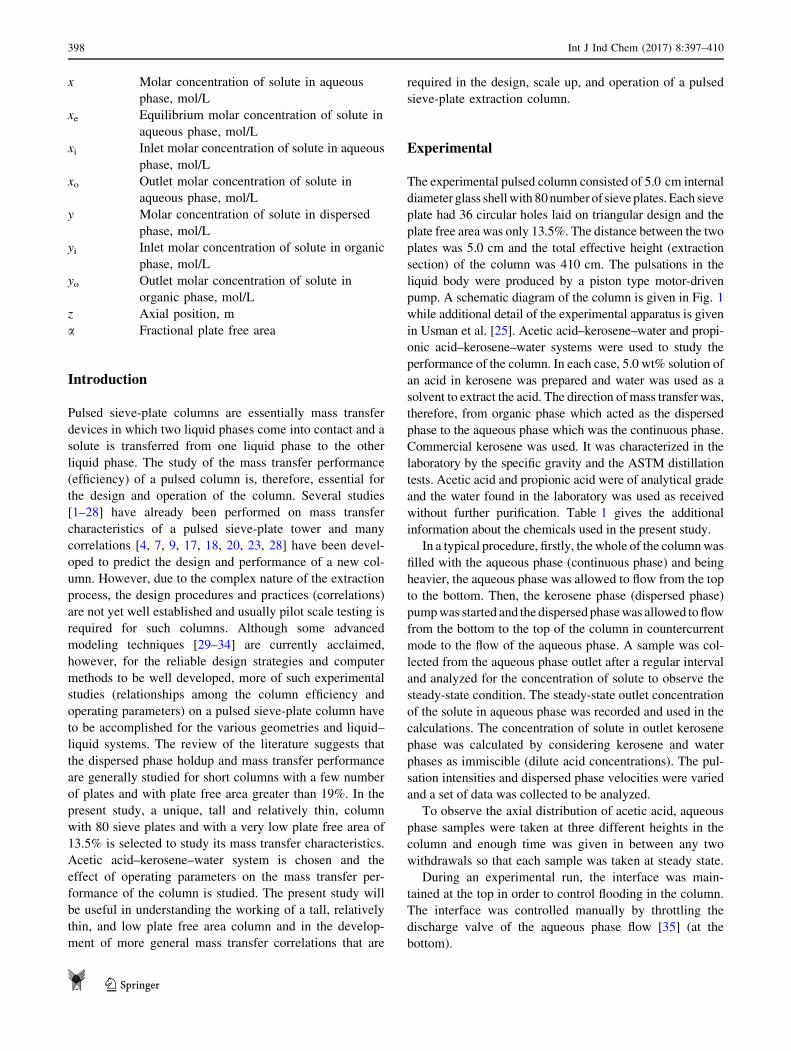
x Molar concentration of solute in aqueous
phase, mol/L
xe Equilibrium molar concentration of solute in
aqueous phase, mol/L
xi Inlet molar concentration of solute in aqueous
phase, mol/L
xo Outlet molar concentration of solute in
aqueous phase, mol/L
y Molar concentration of solute in dispersed
phase, mol/L
yi Inlet molar concentration of solute in organic
phase, mol/L
yo Outlet molar concentration of solute in
organic phase, mol/L
z Axial position, m
a Fractional plate free area
Introduction
Pulsed sieve-plate columns are essentially mass transfer
devices in which two liquid phases come into contact and a
solute is transferred from one liquid phase to the other
liquid phase. The study of the mass transfer performance
(efficiency) of a pulsed column is, therefore, essential for
the design and operation of the column. Several studies
[1–28] have already been performed on mass transfer
characteristics of a pulsed sieve-plate tower and many
correlations [4, 7, 9, 17, 18, 20, 23, 28] have been devel-
oped to predict the design and performance of a new col-
umn. However, due to the complex nature of the extraction
process, the design procedures and practices (correlations)
are not yet well established and usually pilot scale testing is
required for such columns. Although some advanced
modeling techniques [29–34] are currently acclaimed,
however, for the reliable design strategies and computer
methods to be well developed, more of such experimental
studies (relationships among the column efficiency and
operating parameters) on a pulsed sieve-plate column have
to be accomplished for the various geometries and liquid–
liquid systems. The review of the literature suggests that
the dispersed phase holdup and mass transfer performance
are generally studied for short columns with a few number
of plates and with plate free area greater than 19%. In the
present study, a unique, tall and relatively thin, column
with 80 sieve plates and with a very low plate free area of
13.5% is selected to study its mass transfer characteristics.
Acetic acid–kerosene–water system is chosen and the
effect of operating parameters on the mass transfer per-
formance of the column is studied. The present study will
be useful in understanding the working of a tall, relatively
thin, and low plate free area column and in the develop-
ment of more general mass transfer correlations that are
required in the design, scale up, and operation of a pulsed
sieve-plate extraction column.
Experimental
The experimental pulsed column consisted of 5.0 cm internal
diameter glass shellwith 80number of sieve plates. Each sieve
plate had 36 circular holes laid on triangular design and the
plate free area was only 13.5%. The distance between the two
plates was 5.0 cm and the total effective height (extraction
section) of the column was 410 cm. The pulsations in the
liquid body were produced by a piston type motor-driven
pump. A schematic diagram of the column is given in Fig. 1
while additional detail of the experimental apparatus is given
in Usman et al. [25]. Acetic acid–kerosene–water and propi-
onic acid–kerosene–water systems were used to study the
performance of the column. In each case, 5.0 wt% solution of
an acid in kerosene was prepared and water was used as a
solvent to extract the acid. The direction of mass transfer was,
therefore, from organic phase which acted as the dispersed
phase to the aqueous phase which was the continuous phase.
Commercial kerosene was used. It was characterized in the
laboratory by the specific gravity and the ASTM distillation
tests. Acetic acid and propionic acid were of analytical grade
and the water found in the laboratory was used as received
without further purification. Table 1 gives the additional
information about the chemicals used in the present study.
In a typical procedure, firstly, thewhole of the columnwas
filled with the aqueous phase (continuous phase) and being
heavier, the aqueous phase was allowed to flow from the top
to the bottom. Then, the kerosene phase (dispersed phase)
pumpwas started and the dispersed phasewas allowed toflow
from the bottom to the top of the column in countercurrent
mode to the flow of the aqueous phase. A sample was col-
lected from the aqueous phase outlet after a regular interval
and analyzed for the concentration of solute to observe the
steady-state condition. The steady-state outlet concentration
of the solute in aqueous phase was recorded and used in the
calculations. The concentration of solute in outlet kerosene
phase was calculated by considering kerosene and water
phases as immiscible (dilute acid concentrations). The pul-
sation intensities and dispersed phase velocities were varied
and a set of data was collected to be analyzed.
To observe the axial distribution of acetic acid, aqueous
phase samples were taken at three different heights in the
column and enough time was given in between any two
withdrawals so that each sample was taken at steady state.
During an experimental run, the interface was main-
tained at the top in order to control flooding in the column.
The interface was controlled manually by throttling the
discharge valve of the aqueous phase flow [35] (at the
bottom).
398 Int J Ind Chem (2017) 8:397–410
123

Results and discussion
Effect of operating parameters on mass transfer
efficiency
For a pulsed sieve-plate column which is a type of differ-
ential contactor, the analysis of the mass transfer efficiency
can be conveniently carried out using the concept of overall
height of transfer unit or overall mass transfer coefficient.
In the present study, the overall height of transfer unit and
overall mass transfer coefficient are based on continuous
phase and related to number of transfer units and height of
the column as given in the following expression:
ðHTU)oc ¼uc
Koca¼ H
ðNTU)oc; ð1Þ
where ðNTU)oc, i.e., overall number of transfer units based
on continuous phase is calculated using the experimental
Fig. 1 Experimental setup:
a main extraction column with
auxiliaries, b design of a single
plate
Table 1 Information regarding
the chemicals usedChemical Analysis Supplier
Acetic acid Glacial Fischer Scientific�
Propionic acid C98% Fischer Scientific�
Kerosene Sp. gravity @ 15.6 �C 0.7879a g/cm3 Commercial market
ASTM distillation
Vol% Temperature �CIBP 62
5% 132
10% 146
30% 173
50% 181
70% 194
90% 215
95% 226
End pointb 243
Water *100% Laboratory
a Calculated by vibrating tube Rudolf Research Analytical DDM 2910 densitometerb 97%
Int J Ind Chem (2017) 8:397–410 399
123

observations, i.e., using the inlet and exit molar concen-
trations of the phases involved. Assuming plug flow of the
phases (negligible axial diffusivities in the phases) and
considering both equilibrium and operating lines to be
straight (dilute solutions), overall number of transfer units
may be defined as apparent number of transfer units as
given by the following expression [9, 25]:
ðNTU)ocp ¼1
ðyi�yoÞm�ðxo�xiÞ
� �� 1
lnyi � m � xo
yo � m � xi
� �; ð2Þ
where m is the equilibrium constant in the expression
y ¼ m � x. The value of m was calculated experimentally by
taking various concentrations of solute in virtually equal
amounts of kerosene and water. The experimental value of
m was obtained as 0.0708 for the acetic acid–water–kero-
sene system and 0.2801 for the propionic acid–water–ker-
osene system.
The overall apparent mass transfer coefficient based on
continuous phase was calculated using the following
equation [25, 36]:
Kocpa ¼ðNTUÞocp � uc
H: ð3Þ
Effect of pulsation intensity
Figure 2a, b shows the effect of pulsation intensity (the
product of pulsation frequency and pulsation amplitude) on
the height of transfer unit (HTUocp) and mass transfer
coefficient (Kocpa), respectively, for acetic acid–water–
kerosene system. As mentioned before, the acetic acid was
taken as a solute in the kerosene phase and the direction of
mass transfer was from kerosene (dispersed) phase to
aqueous (continuous) phase. No phase inversion was
observed during the operation. It is observed that increas-
ing pulsation intensity continuously decreases the height of
transfer unit and consequently increases the mass transfer
coefficient for constant values of superficial velocities of
the continuous and dispersed phases. It can be seen from
Fig. 2 that the rate of decrease of HTUocp is initially higher
and steadily decreases with an increase in pulsation
intensity and may reach a steady minimum value. It is
observed that in the first half of the range of Af studied, the
height of transfer unit decreases from 4.14 to 3.57 m
(13.7% decrease) and in the lower half it decreases from
3.57 to 3.30 m (7.61% decrease). This suggests that with an
increase in pulsation intensity, initially height of transfer
unit decreases more rapidly and then decreases at a rela-
tively lower rate. Cohen and Beyer [1] for boric acid–
water–isoamyl alcohol system, Smoot and Babb [9] for
both acetone–water-1,1,2-trichloroethane system and acetic
acid–water–methyl isobutyl ketone (MIBK) system,
Gourdon and Casamatta [15] for acetone–water–toluene
system, Venkatanarasaiah and Varma [17] for both n-bu-
tyric acid–kerosene–water system and benzoic acid–water–
kerosene system, Li et al. [22] for nitric acid–30% TBP (in
kerosene)–water system, He et al. [23] for caprolactam–
water–benzene system, Jahya et al. [24] for acetone–water–
toluene system, Usman et al. [25] for acetic acid–water–
ethyl acetate system, and Torab-Mostaedi et al. [27] for
both acetone–water–toluene system and acetone–water–
butylacetate system have observed a continuous and gen-
erally a similar increase in mass transfer performance with
an increase in pulsation intensity.
The height of transfer unit and, therefore, mass transfer
performance may depend on drop size and dispersed phase
holdup. Increase in pulsation intensity increases the energy
supply to the column and, therefore, decreases the diameter
of the dispersed phase drops which in effect increases the
mass transfer surface area and, therefore, mass transfer
efficiency [37, 38]. The increase in dispersed phase holdup
may increase the residence time [37] and, therefore, may aid
in increasing the mass transfer performance. However, a
higher value of the dispersed phase holdup such as in the
Fig. 2 Effect of pulsation intensity on mass transfer performance:
a height of transfer unit, b mass transfer coefficient. Solid lines are
just to show the trends
400 Int J Ind Chem (2017) 8:397–410
123

mixer-settler regime not necessarily means a decrease in
height of transfer unit and, therefore, increase in dispersed
phase holdup not always an indication of an increase in mass
transfer efficiency. Figure 2 suggests that height of transfer
unit continuously decreases and corresponding mass transfer
coefficient continuously increases with an increase in pul-
sation intensity. In our previous work [39] on the dispersed
phase holdup in the same column as studied in the present
contribution and for the system kerosene–water (no solute
addition) under virtually the same operating conditions, the
mixer-settler regime was observed in the range of Af equal to
3.01 9 10-3 to *17.0 9 10-3 m/s. Comparing these find-
ings to Fig. 2, for the mixer-settler regime, therefore, one
may say that though dispersed phase holdup decreases with
an increase in Af but mass transfer efficiency, i.e., Kocpa
increases (HTUocp decreases) with an increase in Af. It is,
therefore, concluded that as the diameter of the dispersed
phase drop decreases more rapidly than the holdup and
contributes more towards mass transfer, the overall effect is
the increase in mass transfer efficiency [17]. In support of
that, it is important to mention here that unlike dispersed
phase holdup, the average drop size of the dispersed phase
always decreases with an increase in pulsation intensity
[26, 40–44]. Further, it may be deduced from Fig. 2 that the
effect of pulsation intensity on mass transfer efficiency is
more pronounced in the mixer-settler region compared to the
effect for the region beyond the mixer-settler region (dis-
persion region).
Effect of dispersed phase velocity
Figure 3 shows the effect of dispersed phase velocity on
the height of transfer unit for acetic acid–water–kerosene
system under various values of pulsation intensities. Again,
the acetic acid was taken as a solute in the kerosene phase
and the direction of mass transfer was from kerosene
(dispersed) phase to aqueous (continuous) phase. In each
case, clearly, the dispersed phase (kerosene) velocity has a
profound effect on the mass transfer performance of the
column. Increasing the dispersed phase velocity markedly
decreases the height of transfer unit. Again, it is observed
that the rate of decrease of height of transfer unit also
decreases with increase in dispersed phase velocity. It can
be seen from Fig. 3 that increasing four times the dispersed
phase velocity decreases virtually four times the height of
transfer unit. In the literature, Smoot and Babb [9] for both
acetone–water-1,1,2-trichloroethane system and acetic
acid–water–methyl isobutyl ketone (MIBK) system,
Gourdon and Casamatta [15] for acetone–water–toluene
system (uc ? ud), Venkatanarasaiah and Varma [17] for
both n-butyric acid–kerosene–water system and benzoic
acid–water–kerosene system, He et al. [23] for caprolac-
tam–water–benzene system, Jahya et al. [24] for acetone–
water–toluene system, Usman et al. [25] for acetic acid–
water–ethyl acetate system, and Torab-Mostaedi et al. [27]
for both acetone–water–toluene system and acetone–wa-
ter–butylacetate system have observed a continuous
increase in mass transfer performance with increase in
dispersed phase velocity. Similar to a change in pulsation
intensity, a change in dispersed phase velocity also affects
both the dispersed phase drop diameter and the dispersed
phase holdup. However, unlike increase in pulsation
intensity an increase in dispersed phase velocity continu-
ously decreases the dispersed phase holdup.
Variation of acetic acid concentration in the axial
direction
Figure 4a, b shows the variation of acetic acid concentra-
tion in aqueous phase along the height of column at two
different pulsation intensities as a function of dispersed
phase velocities. Axial concentration was measured at three
points in the column in addition to the exit and inlet points.
As expected, the concentration of acetic acid increases
continuously in the aqueous phase along the axial position
from the inlet of the solvent (water) at the top to the exit at
the bottom. It is observed that an increase in pulsation
intensity does not affect the shape of the concentration
profile; however, the average slope becomes less steep with
a decrease in dispersed phase velocity.
Effect of solute type
One experimental run was also performed with 5.0 wt%
propionic acid as a solute in kerosene and extraction was
carried out using water as the solvent. The results were
compared with 5.0 wt% acetic acid in kerosene with water
as the solvent. Table 2 shows that a higher value of massFig. 3 Effect of dispersed phase velocity on height of transfer unit
Solid lines are just to show the trends
Int J Ind Chem (2017) 8:397–410 401
123

transfer coefficient was obtained with propionic acid as the
solute compared to when acetic acid was the solute. This
may be due to decreased diameter of the dispersed phase
and increased dispersed phase holdup with propionic acid
in the solution. Owing to the greater affinity of propionic
acid with kerosene than acetic acid with kerosene, a
decreased value of interfacial tension is expected for the
propionic acid–water–kerosene system than acetic acid–
water–kerosene system. This may suggest a decreased drop
size and, therefore, a greater interfacial area which gives
rise to increased value of the mass transfer coefficient.
Table 3 shows a comparison of the present study with two
other kerosene-carboxylic acid–water systems studied by
Venkatanarasaiah and Varma [17] carboxylic acids with
slight different conditions and column geometry.
Correlation development for mass transfer
coefficient
Yadav and Patwardhan [45] have reviewed the published
correlations for mass transfer coefficient. Using a large
number of experimental data (from literature), they tested
the validity of the available correlations for predicting mass
transfer coefficients. They have concluded that none of the
available mass transfer correlations can satisfactorily rep-
resent the experimental data and, therefore, the design of a
pulsed sieve-plate column should be based on pilot scale
testing of the new system. However, for the experimental
data generated in the present study, the correlation of
Venkatanarasaiah and Varma [17] was tested. The equation
was chosen because of its simplicity having a few variables
and with a few parameters to be fitted. Moreover, as both for
the dispersed phase holdup and slip velocity, the equations
of Venkatanarasaiah and Varma [17] were found in rela-
tively better agreement to the experimental data obtained on
the same column in our previous study [39]. It is important
to mention here that the equation of Venkatanarasaiah and
Varma [17] has been developed for overall apparent mass
transfer coefficient, i.e., it is based only on the measurable
values of the inlet and exit concentrations and the equilib-
rium relationship for the system and without considering any
axial mixing in the system. The mass transfer coefficients
obtained in Sect. 3.1 are also apparent values and not cor-
rected for the axial mixing. Based on the results obtained, a
new mass transfer correlation is also developed.
All the experimental data were arranged in Microsoft
Excel spreadsheet and subjected to regression in Solver�
program. The following objective function was minimized:
SSE ¼Xi¼N
i¼1
ððKocpaÞobs � ðKocpaÞmodÞ2; ð4Þ
where SSE stands for the sum of squares of the errors,
ðKocpaÞobs is the observed or experimental value of the
mass transfer coefficient, ðKocpaÞmod is the model value of
Fig. 4 Effect of axial position on the molar concentration of acetic
acid in aqueous phase: a Af = 19.33 9 10-3 m/s, b Af = 26.0 9
10-3 m/s. Solid lines are just to show the trends
Table 2 Effect of solute on the
HTUocp and KocpaSolute Yi (mol/L) Yo (mol/L) Xi (mol/L) Xo (mol/L) M HTUocp (m) Kocpa (s-1)
Acetic acid 0.6661 0.1106 0 0.24 0.0708 7.342 5.18 9 10-5
Propionic acid 0.54 0.0322 0 0.22 0.2801 1.097 3.47 9 10-3
Af = 19.33 mm/s, uc = 3.803 9 10-3 m/s, ud = 1.647 9 10-3 m/s
402 Int J Ind Chem (2017) 8:397–410
123

the mass transfer coefficient, i represents the ith value, and
N is the total number of data points.
Testing of Venkatanarasaiah and Varma’s equation [17]
The following correlation is developed by Venkatanarasa-
iah and Varma [17] for the prediction of overall apparent
mass transfer coefficient based on the continuous phase:
Kocpa ¼ K � ðAf Þ0:84 � d�0:21o � a�0:44 � p�0:41 � u0:91
d : ð5Þ
The authors suggested that the constant K is dependent on
the solute-liquid–liquid systemused. Therefore, the equation
was fitted against the experimental data and K was taken as
the only parameter to be fitted. The value of K was found to
be 0.0170. Figure 5 shows the validity of Venkatanarasaiah
and Varma’s equation [17] for the experimental data of the
present study, whereas Table 4 shows the values of the sta-
tistical parameters to show the goodness of the fit. Clearly,
the equation is found not appropriate to fit the experimental
data and quite a low value of R2 is obtained.
Development of the correlation for the mass transfer
coefficient
In the first attempt, only three parameters were taken in
consideration to develop the correlation suitable to the
system studied in the present work and the following
equation was used to fit the experimental data:
Kocp a ¼ K � ðAf Þa � ubd � uc
c: ð6Þ
The equation was fitted with the experimental data and
in contrast to the use of the equation of Venkatanarasaiah
and Varma [17] a much better fit was obtained. The SSE
was reduced from 2.38 to 0.446 and the corresponding R2
was improved from 0.504 to 0.795. However, a low value
of the exponent of uc suggested to remove the variable uc
and to modify the equation. In the next attempt, the
variable uc was eliminated from the equation and the
modified equation was subjected against the experimental
data. Virtually the same values of SSE and R2 were
obtained and, therefore, suggested the equation to be
retained as the final best-fit equation. The final equation
with its parameters that described the experimental data
was obtained as:
Kocp a ¼ 0:1145 � ðAf Þ0:2578 � u1:062d ð7Þ
SSE and R2 values of Eq. 7 are given in Table 4 and
Fig. 6 shows the scatter diagram between the measured
Table 3 Comparison of mass transfer efficiencies for different pulsed column systems
System Dc 9 103
(m)
a L 9 103
(m)
H (m) Np Af 9 103
(m/s)
Uc 9 103
(m/s)
Ud 9 103
(m/s)
HTUoca (m) References
Kerosene-acetic acid–
water
50.0 13.5 50 4.1 80 19.33 3.803 1.647 7.342 This work
Kerosene-propionic
acid–water
50.0 13.5 50 4.1 80 19.33 3.803 1.647 1.097 This work
Kerosene-n-butyric
acid–water
43 28.0 100 2.0 - 22.0 3.15 3.15 2.478a 17
Kerosene-benzoic acid–
water
43 46.0 100 2.0 - 22.0 3.15 3.15 0.701a 17]
In each case, the mass transfer direction is from dispersed phase to continuous phase
The values of HTUoca here are calculated using Eq. 1a The author reported Koa
Fig. 5 Scatter diagram between measured mass transfer coefficient
and that calculated from the equation of Venkatnarasaiah and Varma
[17], Eq. 5
Table 4 Comparative fitting behavior of the correlations of mass
transfer coefficient
Equations R2 SSE
Venkatanarasaiah and Varma [17], Eq. 5 0.5042 2.3800
Development correlation, Eq. 7 0.7954 0.4462
Int J Ind Chem (2017) 8:397–410 403
123

Kocpa and the Kocpa values calculated from Eq. 7. The
average percentage error as obtained from Eq. 8 was only
10.76%.
%Error ¼ðKocpaÞobs � ðKocpaÞmod
�� ��ðKocpaÞobs
� �� 100: ð8Þ
Mathematical modeling of the pulsed column
A differential element of thickness Dz was selected in the
body of the pulsed sieve-plate column, as shown in Fig. 7,
and a mass balance was applied across the differential
element.
The following equations (for the dispersed phase and the
continuous phase) were obtained in terms of overall mass
transfer coefficient based on the continuous phase:
For continuous phase:
Ex
d2x
dz2þ uc
dx
dzþ Kocaðxe � xÞ ¼ 0: ð9Þ
For dispersed phase:
Ey
d2y
dz2� ud
dy
dz� Kocaðxe � xÞ ¼ 0: ð10Þ
As the system studied did not involve any heat effects,
therefore, energy balance was not required in modeling the
column.
Mass transfer in the absence of axial diffusivities
As for a tall column with a small diameter such as that
studied here, mass transfer process due to axial diffusivities
was expected to be negligible in comparison to the mass
transfer by convection (bulk liquid flows); therefore, the
first term of both Eqs. 9 and 10 was neglected and the
following equations were obtained as desired.
For continuous phase:
uc
dx
dzþ Kocaðxe � xÞ ¼ 0: ð11Þ
For dispersed phase:
ud
dy
dzþ Kocaðxe � xÞ ¼ 0: ð12Þ
Rearranging Eqs. 11 and 12 and writing Koca as Kocpa,
i.e., in terms of overall apparent mass transfer coefficient, it
may be shown that
For continuous phase:
dx
dz¼ Kocpaðx � xeÞ
uc
: ð13Þ
For dispersed phase:
dy
dz¼ Kocpaðx � xeÞ
ud
: ð14Þ
Equations 13 and 14 are the first-order ordinary differ-
ential equations and can be simultaneously solved using the
appropriate boundary conditions as given in Eqs. 15 and 16
to obtain the concentration profiles for both the continuous
and dispersed phases.
At z ¼ 0; y ¼ yi and x ¼ xo ð15ÞAt z ¼ H; y ¼ yo and x ¼ xi: ð16Þ
The solution requires the values of uc, ud, Kocpa, and an
equilibrium relationship between molar concentration of
solute in each of the continuous and dispersed phases.
In Sect. 3.4.2, the experimental data obtained in the
present study were used to obtain a relationship (Eq. 7) of
mass transfer coefficient in terms of pulsation intensity and
dispersed phase velocity which was used to obtain the
Fig. 6 Scatter diagram between measured mass transfer coefficient
and that calculated from Eq. 7
Fig. 7 The control element for mathematical modeling of the pulsed
sieve-plate extraction column
404 Int J Ind Chem (2017) 8:397–410
123

value of Kocpa in solving Eqs. 13 and 14. The values of uc
and ud were obtained from the experimental data. The
expression y ¼ 0:0708x was used for the equilibrium value,
where 0.0708 is the equilibrium constant for acetic acid–
kerosene–water system.
The differential equations along with the auxiliary
equations and boundary conditions were solved in
POLYMATH (an established mathematical software) using
RKF-45 (Runge–Kutta-Fehlberg-45) routine and concen-
tration values of acetic acid in both the continuous (water)
and dispersed (kerosene) phases were obtained at five
different points in the column. It is important to mention
here that the given problem was a countercurrent problem,
so the initial values of outlet concentration of acetic acid in
aqueous phase were found by trial and error. Initially, the
experimental value of the outlet concentration of acetic
acid in aqueous solution was used as a guess value and then
the inlet concentration of acetic acid in water was com-
pared with the experimental value (which was zero). If the
predicted inlet aqueous phase concentration was different
than zero, then a new initial value was used. The procedure
was carried on till the predicted and actual values were
numerically equal.
Figures 8 and 9 show the concentration profiles for
various pulsation intensities and dispersed phase velocities,
respectively. Increasing pulsation intensities, the slope of
the concentration profile somehow decreases and shows a
greater change in concentration of the acetic acid. This is
also the case with the effect of dispersed phase velocity as
shown in Fig. 9.
In Fig. 9, for ud = 7.173 9 10-3 m/s, the two profiles
actually crosses between 0.5 and 0.6 fractional height
(axial position in the column to the total height of the
column). This concentration cross in profiles does not mean
the mass was not transferred at or after this point or the
direction of mass transfer was reversed after this point.
Concentration difference in two different liquid phases is
not like temperature difference for heat transfer where no
temperature difference means no transfer of heat. It is the
effective concentration difference which is important and
Fig. 8 Model concentration profiles at various indicated pulsation intensities. uc = 3.803 9 10-3 m/s, ud = 3.642 9 10-3 m/s
Int J Ind Chem (2017) 8:397–410 405
123

which may be calculated by the equilibrium relationship.
The effective concentration difference is, therefore, not y –
x, but y – ye, where ye is mxe. Now as m is quite a small
fractional value (m = 0.0708) the effective concentration
difference is positive throughout the column length.
Figure 10 shows the concentration profiles at a constant
pulsation intensity of Af = 19.333 9 10-3 m/s and for
varying dispersed phase velocities and compares the model
concentration profiles to the experimental concentration
profiles obtained in the present study. Though not perfect,
but the model profiles give virtually the same trend and
show rather good representation of the axial
concentrations.
Mass transfer in the presence of axial diffusivities
The model equations, Eqs. 9 and 10, involve axial diffu-
sivities. The equations were rearranged to obtain the fol-
lowing expressions:
For continuous phase:
d2x
dz2þ uc
Ex
dx
dzþ Kocaðxe � xÞ
Ex
¼ 0: ð17Þ
For dispersed phase:
d2y
dz2� ud
Ey
dy
dz� Kocaðxe � xÞ
Ey
¼ 0: ð18Þ
Unlike Eqs. 13, 14, 17, and 18 are second-order ordi-
nary differential equations and can be solved by writing
each second-order differential equation into two first-order
ordinary differential equations. This way four ordinary
differential equations were solved simultaneously using the
appropriate boundary conditions as given in Eq. 19 through
Eq. 22. For Eqs. 21 and 22, y is taken as yi and x is taken as
xi, respectively.
At z ¼ 0;dx
dz¼ 0 ð19Þ
At z ¼ H;dy
dz¼ 0 ð20Þ
Fig. 9 Model concentration profiles at various indicated dispersed phase velocities. uc = 3.803 9 10-3 m/s, Af = 19.333 9 10-3 m/s
406 Int J Ind Chem (2017) 8:397–410
123

At z ¼ 0;dy
dz¼ ud
Ey
ðy � yiÞ ð21Þ
At z ¼ H;dx
dz¼ uc
Ex
ðxi � xÞ ð22Þ
Equations 17 and 18 together with boundary conditions
were solved to fit the experimental axial concentrations.
The fitting was obtained so that the SSE between the
experimental and predicted axial concentrations was min-
imized. In each case, the %error between the experimental
Fig. 10 Comparison of concentration profiles at various indicated dispersed phase velocities. uc = 3.803 9 10-3 m/s, Af = 19.333 9 10-3 m/s
Int J Ind Chem (2017) 8:397–410 407
123

and model outlet concentrations in the dispersed phase was
kept less than 5% and the inlet concentration of acetic acid
in water was required to have a value of virtually equal to
zero.
Table 5 shows the values of the axial diffusivities and
mass transfer coefficients obtained by solving Eqs. 17 and
18. These mass transfer coefficients are not the overall
apparent mass transfer coefficients but that are based on
including the effect of axial dispersions and here called
simply as overall mass transfer coefficients. The table also
shows a comparison between the overall apparent mass
transfer coefficients (obtained without using axial diffu-
sivities in the column) and overall mass transfer coeffi-
cients (based on axial diffusivities) and describes that the
two types of mass transfer coefficients are virtually the
same. Figure 11 shows a typical comparison between an
experimental concentration profile and the concentration
profiles based on the model results with and without the use
of axial diffusivities. The results show that virtually the
same outcomes are obtained with and without using axial
dispersions in the model and may suggest insignificance of
model axial diffusivities in the column. The higher value of
the outlet molar concentration without using axial diffu-
sions in the model may be due to the reason that the cor-
relation (Eq. 7) used to find Kocpa has already *11% error
as discussed earlier.
Conclusions
The mass transfer performance in a liquid phase pulsed
sieve tray column of 50 mm diameter and 4 m height, with
80 trays with a plate free area of 13.5% was investigated.
The mass transfer performance appears to be a strong
function of both the pulsation intensity and dispersed phase
velocity. The number of transfer units (NTUocp), the height
of transfer unit (HTUocp), and the apparent mass transfer
coefficient based on continuous phase (Kocpa) is calculated.
Mass transfer coefficient increases with an increase in
pulsation intensity and dispersed phase velocity. Variation
of the concentration of acetic acid in aqueous phase along
the length of the column is discussed as a function of
dispersed phase velocity and pulsation intensity. Mass
transfer coefficient of propionic acid as the solute in the
kerosene phase is observed to be greater than when acetic
acid is the solute in the kerosene phase.
For the experimental data of mass transfer coefficient,
the equation of Venkatnarasaiah and Varma [17] for mass
transfer coefficient is tried which, however, is found not
successful. Venkatnarasaiah and Varma [17] worked on a
column with plate free area ranging between 23 and 46%.
This may be the reason that the data in the present study are
not fitted well by their equation.
A new correlation that is, at least, applicable for the
liquid–liquid system and the column studied in the present
work is developed. The new equation gives a %error of
only 10.8 as calculated from Eq. 8.
Mathematical modeling of the pulsed column is carried
out with and without using the axial diffusivities. Based on
the model without incorporating axial diffusivities, the
concentration profiles for acetic acid in continuous (aque-
ous) phase and dispersed phase for various operating
conditions are shown and in some cases compared with the
Table 5 Diffusivities and mass
transfer coefficients obtained
with and without the use of axial
diffusivities
Af 9 103
(m/s)
Ud 9 103
(m/s)
Ex 9 103
(m2/s)
Ey 9 103
(m2/s)
Koca 9 103
(s-1)
Kocpa 9 103
(s-1)
19.33 1.647 0.110 0.046 0.0519 0.0518
19.33 4.524 0.105 0.012 0.111 0.1109
19.33 7.173 0.099 0.022 0.256 0.2593
26.00 1.647 0.140 0.05 0.0519 0.0516
26.00 4.524 0.180 0.12 0.135 0.1346
26.00 7.173 0.800 0.992 0.222 0.2224
uc = 3.803 9 10-3 m/s
Fig. 11 Comparison of experimental axial concentration profile with
model axial concentrations obtained with and without the use of axial
diffusivities. uc = 3.803 9 10-3 m/s, ud = 4.524 9 10-3 m/s,
Af = 19.333 9 10-3 m/s
408 Int J Ind Chem (2017) 8:397–410
123

experimental data. Based on the model considering axial
diffusivities, model axial diffusivities and mass transfer
coefficients are calculated. Virtually, similar mass transfer
coefficients with and without the use of axial diffusivities
in a model are obtained and virtually the similar concen-
tration profiles are obtained that may show the insignifi-
cance of axial diffusivities in the column. The results may
support the assumption of negligible axial diffusivities in
the model as applied in the determination of mass transfer
coefficients and in developing the corresponding mass
transfer correlation (Eq. 7).
Acknowledgements The authors would like to acknowledge Chak-
wal group of industries for funding the project. Ms. Madiha, Ms.
Zona, Mr. Sohaib, Mr. Abdullah, Mr. Mudassar, and Mr. Salahuddin
also deserve our acknowledgements for their assistance in different
ways.
Open Access This article is distributed under the terms of the
Creative Commons Attribution 4.0 International License (http://crea
tivecommons.org/licenses/by/4.0/), which permits unrestricted use,
distribution, and reproduction in any medium, provided you give
appropriate credit to the original author(s) and the source, provide a
link to the Creative Commons license, and indicate if changes were
made.
Publisher’s Note Springer Nature remains neutral with regard to
jurisdictional claims in published maps and institutional affiliations.
References
1. Cohen RM, Beyer GH (1952) Performance of a pulse extraction
column. Technical Information Service, Oak Ridge
2. Sege G, Woodfield FW (1954) Pulse column variables. Solvent
extraction of uranyl nitrate with tributyl phosphate in a 3-in dia.
pulse column. Chem Eng Prog 50:396–402
3. Chantry WA, Berg RLV, Wiegandt HF (1955) Application of
pulsation to liquid–liquid extraction. Ind Eng Chem 47:1153–1159
4. Thornton JD (1957) Liquid–liquid Extraction. Part XIII. The
effect of pulse wave-form and plate geometry on the performance
and throughput of a pulsed column. Tran Inst Chem Eng
35:316–330
5. Logsdail DH, Thornton JD, Pratt HRC (1957) Liquid–liquid
extraction. Part XII. Flooding rates and performance data for a
rotary disc contactor. Tran Inst Chem Eng 35:301
6. Li WH, Newton WM (1957) Liquid–liquid extraction in a pulsed
perforated-plate column. AIChE J 3:56–62
7. Smoot LD, Mar BW, Babb AL (1959) Flooding characteristics
and separation efficiencies of pulsed sieve-plate extraction col-
umns. Ind Eng Chem 51:1005–1010
8. Sobotik RH, Himmelblau DM (1960) The effect of plate wetting
characteristics on pulse column extraction efficiency. AIChE J
6:619–624
9. Smoot LD, Babb AL (1962) Mass transfer studies in a pulsed
extraction column. Ind Eng Chem Fundam 1:93–103
10. Khemongkorn V, Molinier J, Angelino H (1978) Influence of
mass transfer direction on efficiency of a pulse perforated plate
column. Chem Eng Sci 33:501–508
11. Berger R, Leuckel W, Wolf D (1978) Investigations into the
operating characteristics of pulsed sieve plate columns. Chem Ind
19:760–764
12. Tung LS, Luecke RH (1986) Mass transfer and drop sizes in
pulsed-plate extraction columns. Ind Eng Chem Proc Des Dev
25:664–673
13. Yu Q, Weiyang F, Jiading W (1989) A study on mass transfer in
pulsed sieve-plate extraction column. J Chem Ind Eng 4:218–228
14. Christophe G, Casamatta G (1991) Influence of mass transfer
direction on the operation of a pulsed sieve-plate pilot column.
Chem Eng Sci 46:2799–2808
15. Gourdon C, Casamatta G (1991) Influence of mass transfer
direction on the operation of a pulsed sieve-plate pilot column.
Chem Eng Sci 46:2799–2808
16. Slater MJ (1995) A combined model of mass transfer coefficients
for contaminated drop liquid–liquid systems. Can J Chem Eng
73:462–469
17. Venkatanarasaiah D, Varma YBG (1998) Dispersed phase holdup
and mass transfer in liquid pulsed column. Bioprocess Eng
18:119–126
18. Luo G, Li H, Fei W, Wang J (1998) A simplified correlation of
mass transfer in a pulsed sieve plate extraction column. Chem
Eng Tech 21:823–827
19. Kumar A, Hartland S (1999) Correlations for prediction of mass
transfer coefficients in single drop systems and liquid–liquid
extraction columns. Chem Eng Res Des 77:372–384
20. Vatanatham T, Terasukaporn P, Lorpongpaiboon P (1999) HTU
of acetone-toluene-water extraction in a pulsed column. Prince of
Songkhla University, Thailand, Proc Reg Sym Chem Eng
21. Gottliebsen K, Grinbaum B, Chen D, Stevens GW (2000) The use
of pulsed perforated plate extraction column for recoveryofsul-
phuric acid from copper tank house electrolyte bleeds.
Hydrometallurgy 58:203–213
22. Li HB, Lou GS, Fei WY, Wang JD (2000) Mass transfer per-
formance in a coalescence-dispersion pulsed sieve plate extrac-
tion column. Chem Eng J 78:225–229
23. He CH, Gao YH, Yang SH, Edwards DW (2004) Optimization of
the process for recovering caprolactam from wastewater in a
pulsed-sieve-plate column using green design methodologies.
J Loss Prevent Proc 17:195–204
24. Jahya AB, Pratt HRC, Stevens GW (2005) Comparison of the
performance of a pulsed disc and doughnut column with a pulsed
sieve plate liquid extraction column. Solvent Extr Ion Exch
23:307–317
25. Usman MR, Hussain SN, Rehman L, Bashir M, Butt MA (2006)
Mass transfer performance in a pulsed sieve-plate extraction
column. Proc Pak Acad Sci 43:173–179
26. Usman MR, Sattar H, Hussain SN, Asghar HMA, Afzal W (2009)
Drop size in a liquid pulsed sieve-plate extraction column. Braz J
Chem Eng 26:677–683
27. Torab-Mostaedi M, Safdari J, Ghaemi A (2010) Mass transfer
coefficient in pulsed perforated-plate extraction columns. Braz J
Chem Eng 27:243–251
28. Caishan J, Shuai M, Qiong S (2013) Mass transfer characteristics
in a standard pulsed sieve-plate extraction column. Energy Pro-
cedia 39:348–357
29. Steiner L, Kumar A, Hartland S (1988) Determination and cor-
relation of axial-mixing parameters in an agitated liquid–liquid
extraction column. Can J Chem Eng 66:241–247
30. Kumar A, Hartland S (1999) Computational strategies for sizing
liquid–liquid extractors. Ind Eng Chem Res 38:1040–1056
31. Jaradat M, Attarakih M, Bart HJ (2010) Effect of phase disper-
sion and mass transfer direction on steady state RDC performance
using population balance modelling. Chem Eng J 165:379–387
32. Kalem M, Buchbender F, Pfennig A (2011) Simulation of
hydrodynamics in RDC extraction columns using the simulation
tool ‘‘ReDrop’’. Chem Eng Res Des 89:1–9
33. Jaradat M, Attarakih M, Bart HJ (2011) Population balance
modeling of pulsed (packed and sieve-plate) extraction columns:
Int J Ind Chem (2017) 8:397–410 409
123

coupled hydrodynamic and mass transfer. Ind Eng Chem Res
50:14121–14135
34. Kopriwa N, Buchbender F, Ayesterana J, Kalem M, Pfennig A
(2012) A critical review of the application of drop-population
balances for the design of solvent extraction columns: I. Concept
of solving drop-population balances and modelling breakage and
coalescence. Solvent Extr Ion Exch 30:683–723
35. Khajenoori M, Haghighi-Asl A, Safdari J, Mallah MH (2015)
Prediction of drop size distribution in a horizontal pulsed plate
extraction column. Chem Eng Process 92:25–32
36. Chilton TH, Colburn AP (1935) Distillation and absorption in
packed columns. Ind Eng Chem 27:255–260
37. Lade VG, Rathod VK, Bhattacharyya S, Manohar S, Wattal PK
(2013) Comparison of normal phase operation and phase reversal
studies in a pulsed sieve plate extraction column. Chem Eng Res
Des 91:1133–1144
38. Rathilal S, Carsky M, Heyberger A, Rouskova M (2013) Dif-
ference of hydrodynamics for a VPE with and without mass
transfer and effect of agitation level on extent of mass transfer
and effect of agitation level on extent of mass transfer. S Afr J
Chem Eng 18:29–39
39. Khawaja SY, Usman MR, Khan S, Afzal W, Akhtar NA (2013)
Dispersed phase holdup in a tall low plate free area liquid pulsed
sieve-plate extraction column. Sep Sci Technol 48:175–182
40. Lorenz M, Haverland H, Vogelpohl A (1990) Fluid dynamics of
pulsed sieve plate extraction columns. Chem Eng Technol
13:411–422
41. Yaparpalvi R, Das PK, Mukherjee AK, Kumar R (1986) Drop
formation under pulsed conditions. Chem Eng Sci
41:2547–2553
42. Pietzsch W, Blass B (1987) A new method for the prediction of
liquid pulsed sieve-tray extractors. Chem Eng Technol 10:73–86
43. Sreenivasulu K, Venkatanarasaiah D, Varma YBG (1997) Drop
size distributions in liquid pulsed columns. Bioprocess Eng
17:189–195
44. Usman MR, Rehman L, Bashir M (2008) Drop size and drop size
distribution in a pulsed sieve-plate extraction column. Proc Pak
Acad Sci 45:41–46
45. Yadav RL, Patwardhan AW (2008) Design aspects of pulsed
sieve plate columns. Chem Eng J 138:389–415
410 Int J Ind Chem (2017) 8:397–410
123