Embed Size (px)
Citation preview
Mass and Volume
Density

a
b c
d
e.
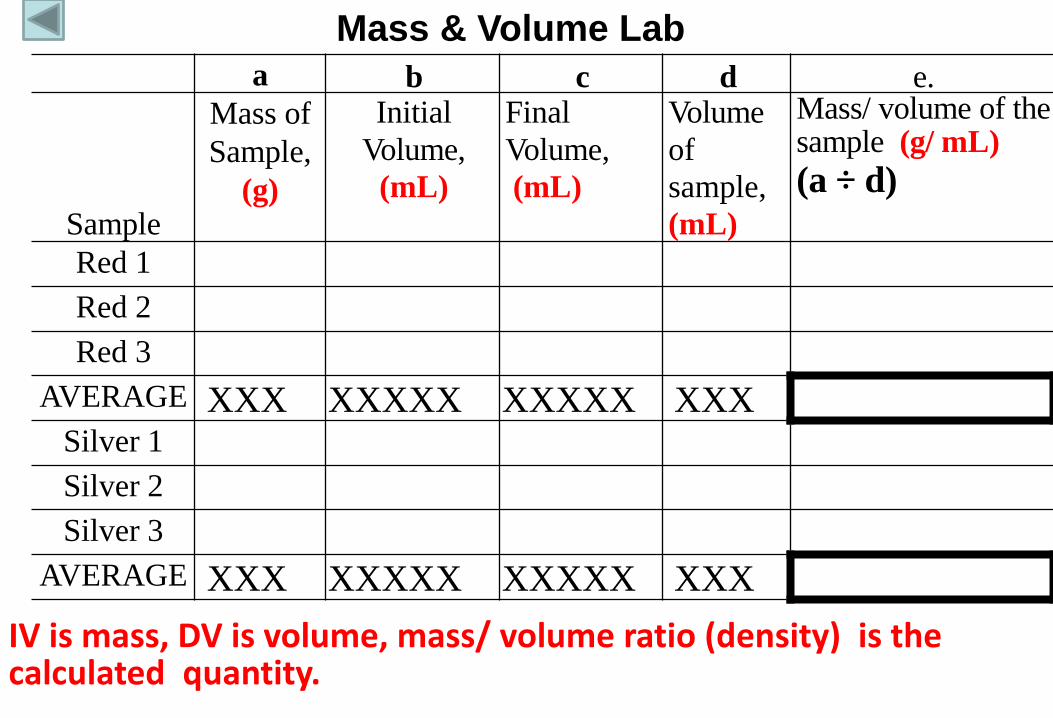
Sample
Mass of
Sample,
(g)
Initial
Volume,
(mL)
Final
Volume,
(mL)
Volume
of
sample,
(mL)
Mass/ volume of the sample (g/ mL) (a ÷ d)
Red 1 Red 2 Red 3
AVERAGE XXX XXXXX XXXXX XXX Silver 1 Silver 2 Silver 3
AVERAGE XXX XXXXX XXXXX XXX
Mass & Volume Lab
IV is mass, DV is volume, mass/ volume ratio (density) is the calculated quantity.
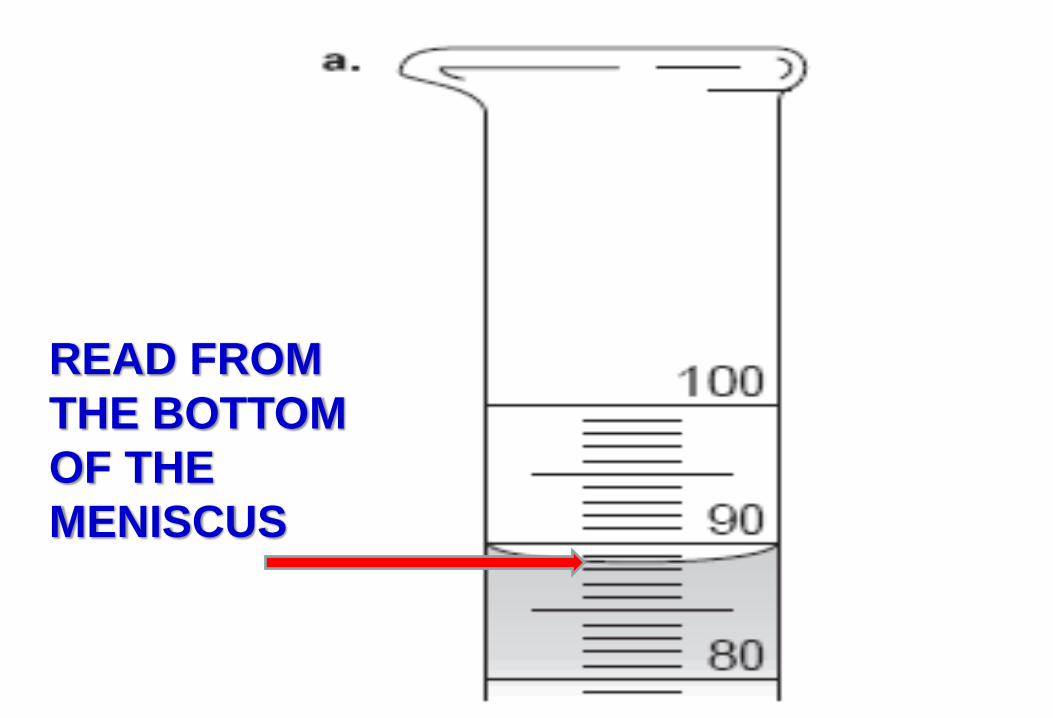
READ FROM
THE BOTTOM
OF THE
MENISCUS
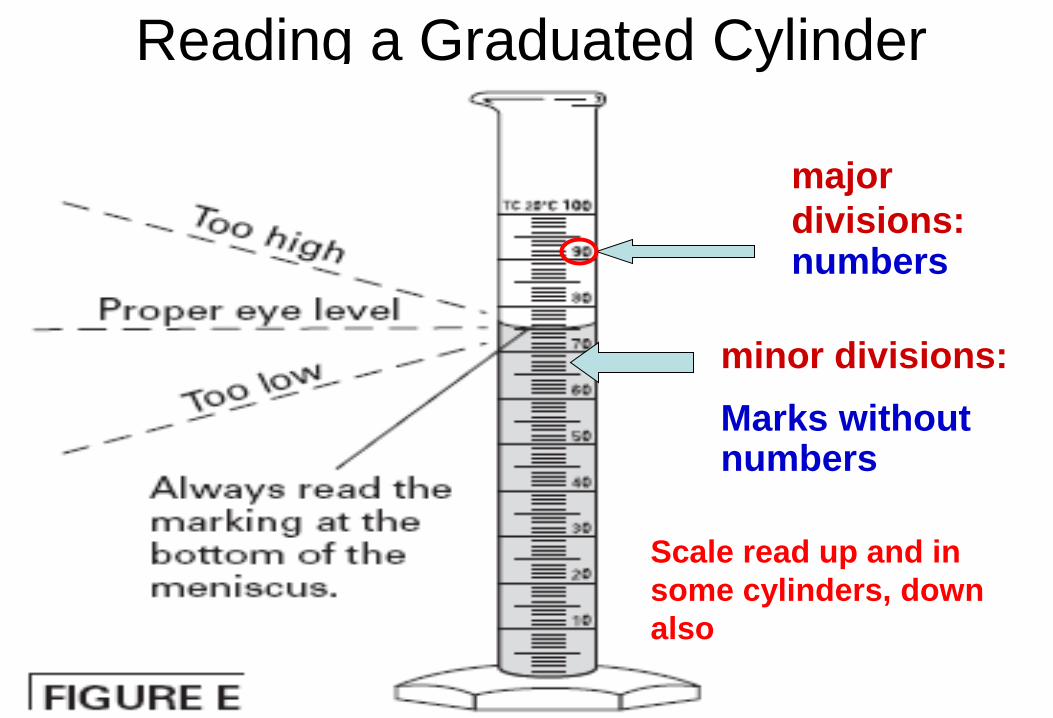
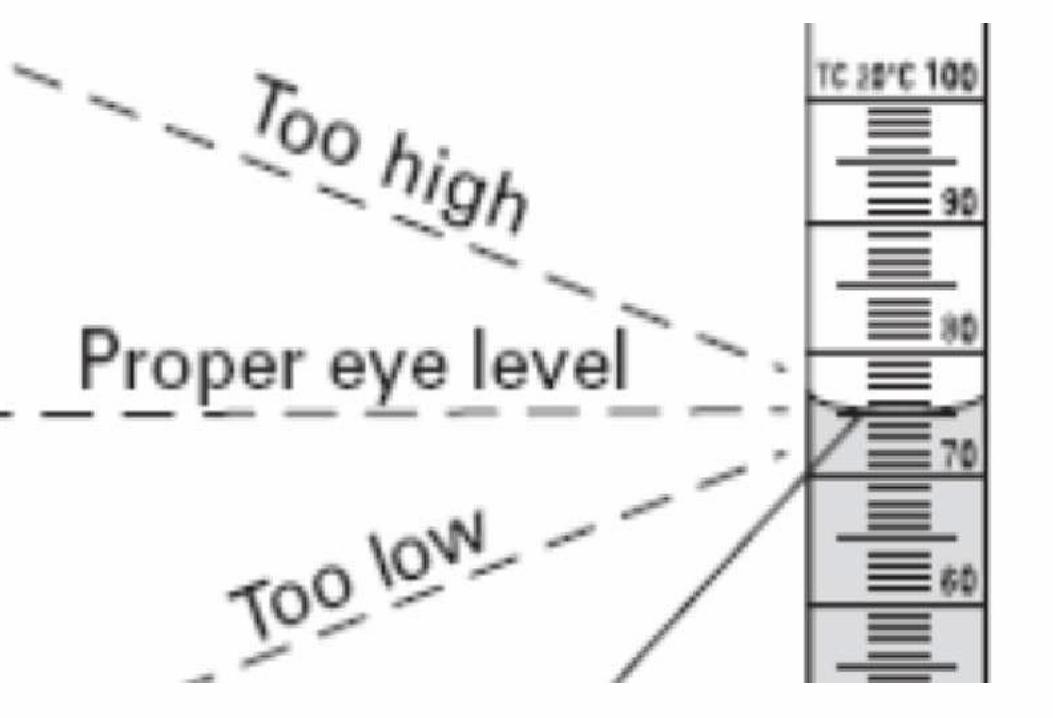
Reading a Graduated Cylinder
major
divisions: numbers
minor divisions:
Marks without numbers
Scale read up and in
some cylinders, down
also

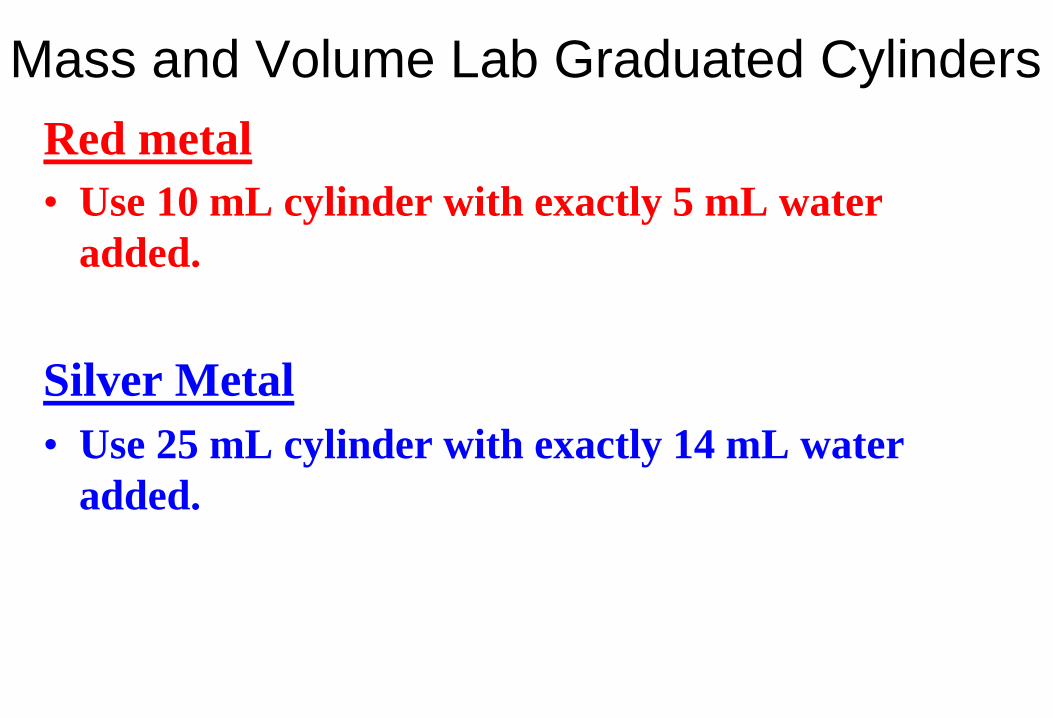
Mass and Volume Lab Graduated Cylinders
Red metal
• Use 10 mL cylinder with exactly 5 mL water
added.
Silver Metal
• Use 25 mL cylinder with exactly 14 mL water
added.
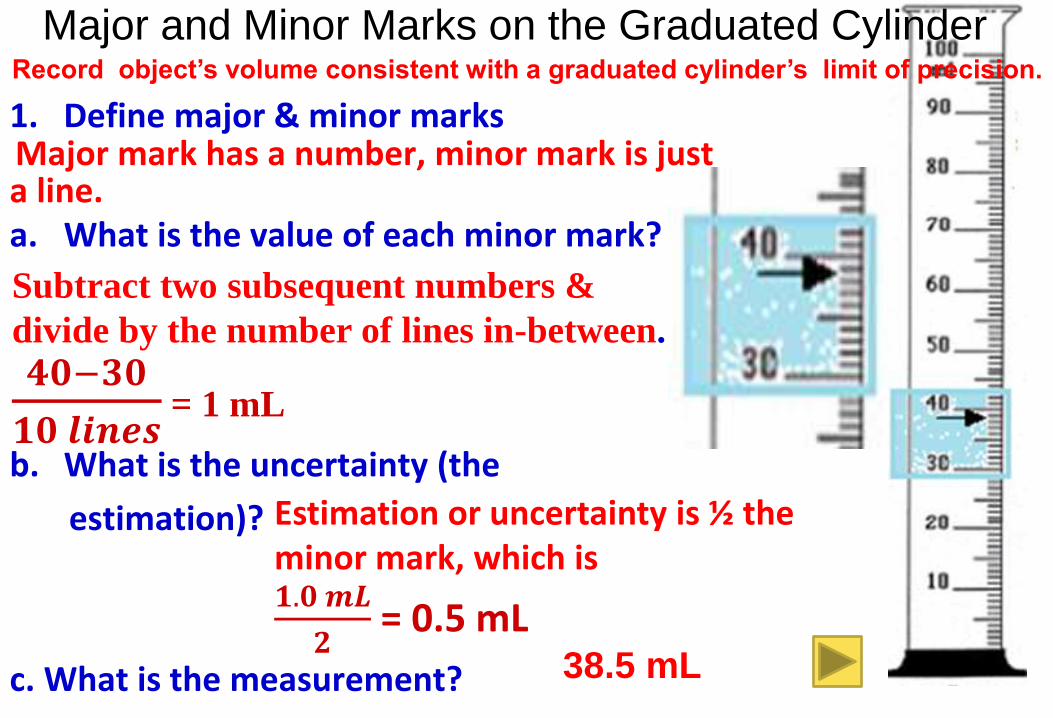
Major and Minor Marks on the Graduated Cylinder
1. Define major & minor marks Major mark has a number, minor mark is just a line.
a. What is the value of each minor mark?
b. What is the uncertainty (the
estimation)?
c. What is the measurement?
Subtract two subsequent numbers &
divide by the number of lines in-between.
𝟒𝟎−𝟑𝟎
𝟏𝟎 𝒍𝒊𝒏𝒆𝒔 = 1 mL
Estimation or uncertainty is ½ the minor mark, which is 𝟏.𝟎 𝒎𝑳
𝟐 = 0.5 mL
38.5 mL
Record object’s volume consistent with a graduated cylinder’s limit of precision.
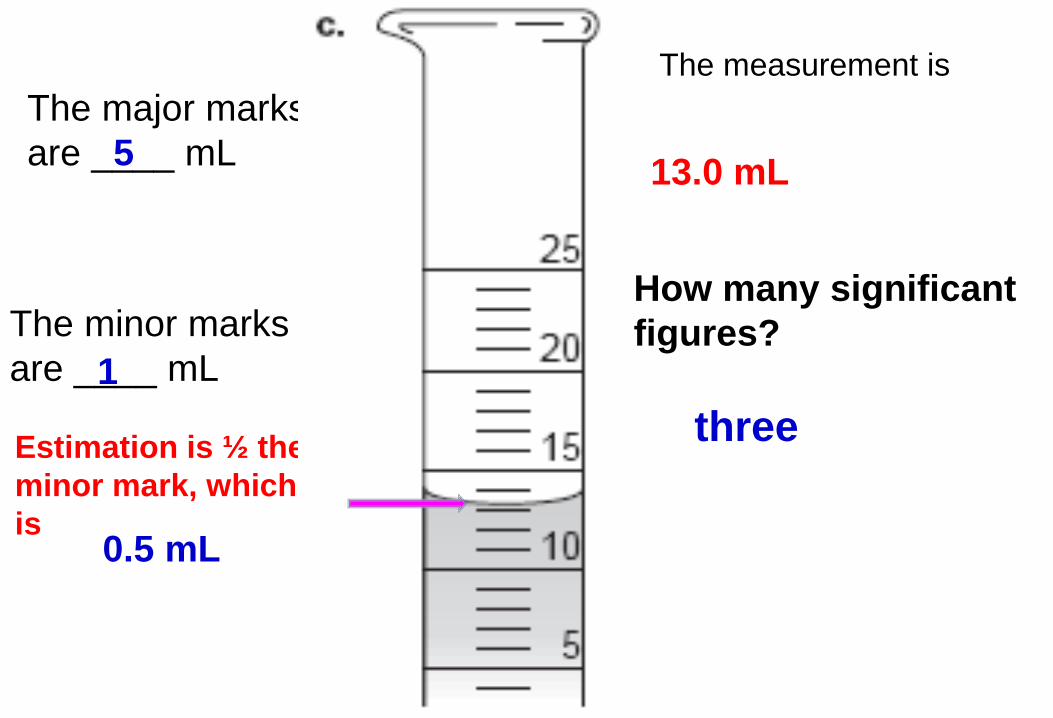
13.0 mL
How many significant
figures?
three
The major marks
are ____ mL 5
The minor marks
are ____ mL 1
Estimation is ½ the
minor mark, which
is 0.5 mL
The measurement is
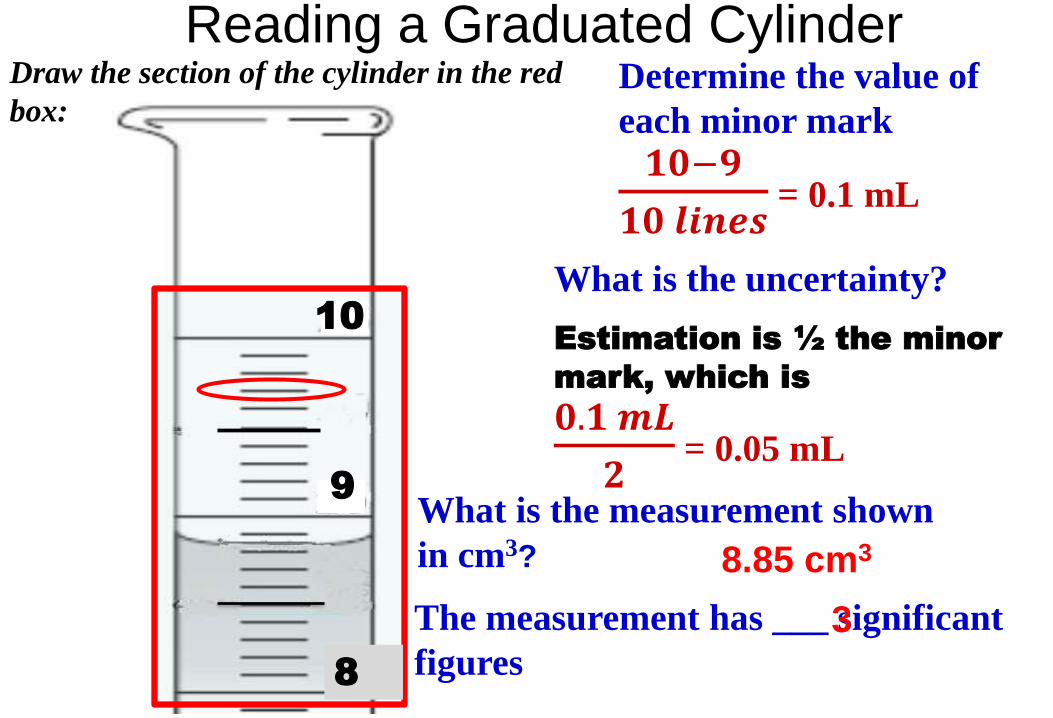
What is the measurement shown
in cm3?
Reading a Graduated Cylinder Determine the value of
each minor mark
𝟏𝟎−𝟗
𝟏𝟎 𝒍𝒊𝒏𝒆𝒔 = 0.1 mL
What is the uncertainty?
Estimation is ½ the minor
mark, which is
𝟎.𝟏 𝒎𝑳
𝟐 = 0.05 mL
8.85 cm3
The measurement has ___ significant
figures 3
10
9
8
Draw the section of the cylinder in the red
box:
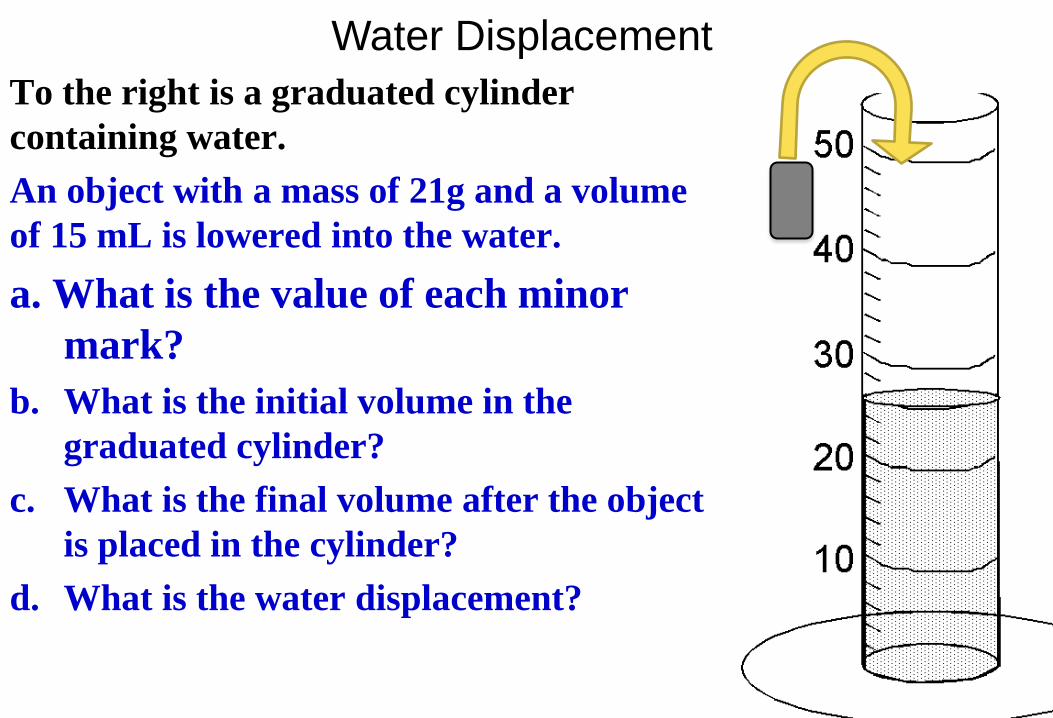
Water Displacement
To the right is a graduated cylinder
containing water.
An object with a mass of 21g and a volume
of 15 mL is lowered into the water.
a. What is the value of each minor
mark?
b. What is the initial volume in the
graduated cylinder?
c. What is the final volume after the object
is placed in the cylinder?
d. What is the water displacement?
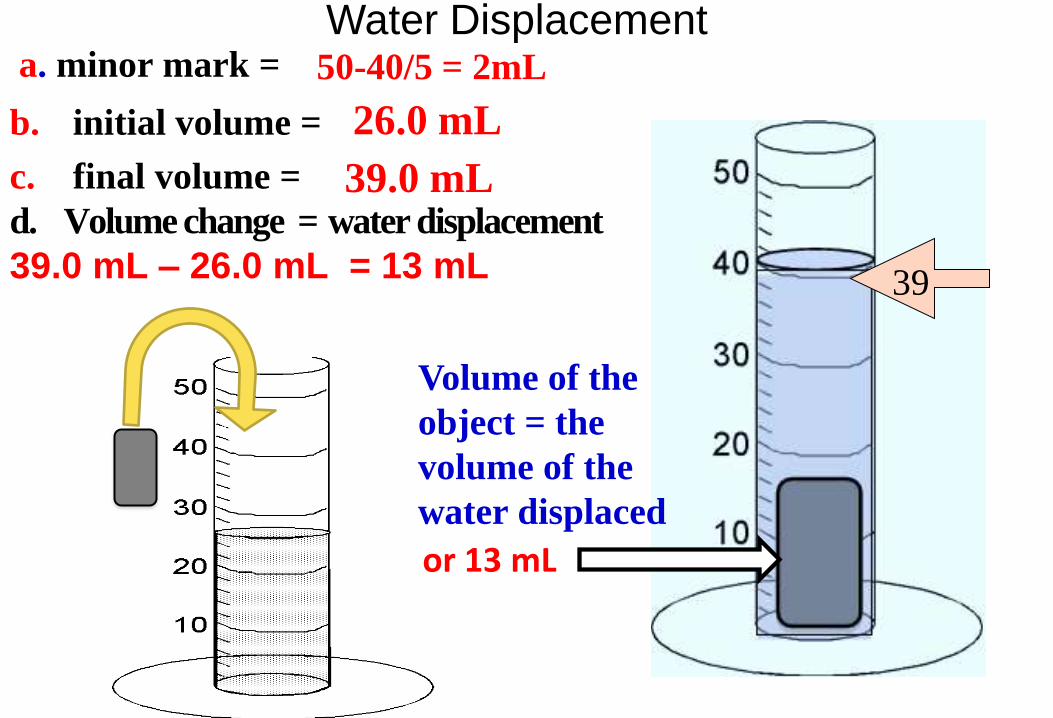
Water Displacement a. minor mark =
b. initial volume =
c. final volume =
d. Volume change = water displacement
39.0 mL – 26.0 mL = 13 mL 39
or 13 mL
26.0 mL
50-40/5 = 2mL
39.0 mL
Volume of the
object = the
volume of the
water displaced
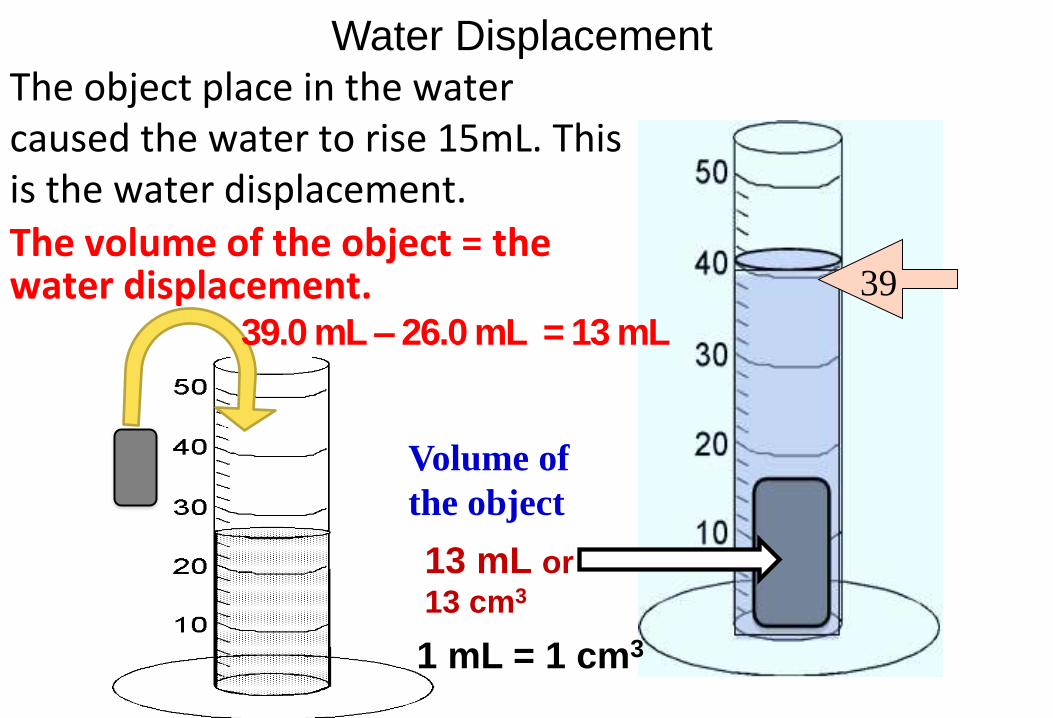
Water Displacement
The object place in the water caused the water to rise 15mL. This is the water displacement.
The volume of the object = the water displacement. 39
13 mL or
13 cm3
Volume of
the object
39.0 mL – 26.0 mL = 13 mL
1 mL = 1 cm3
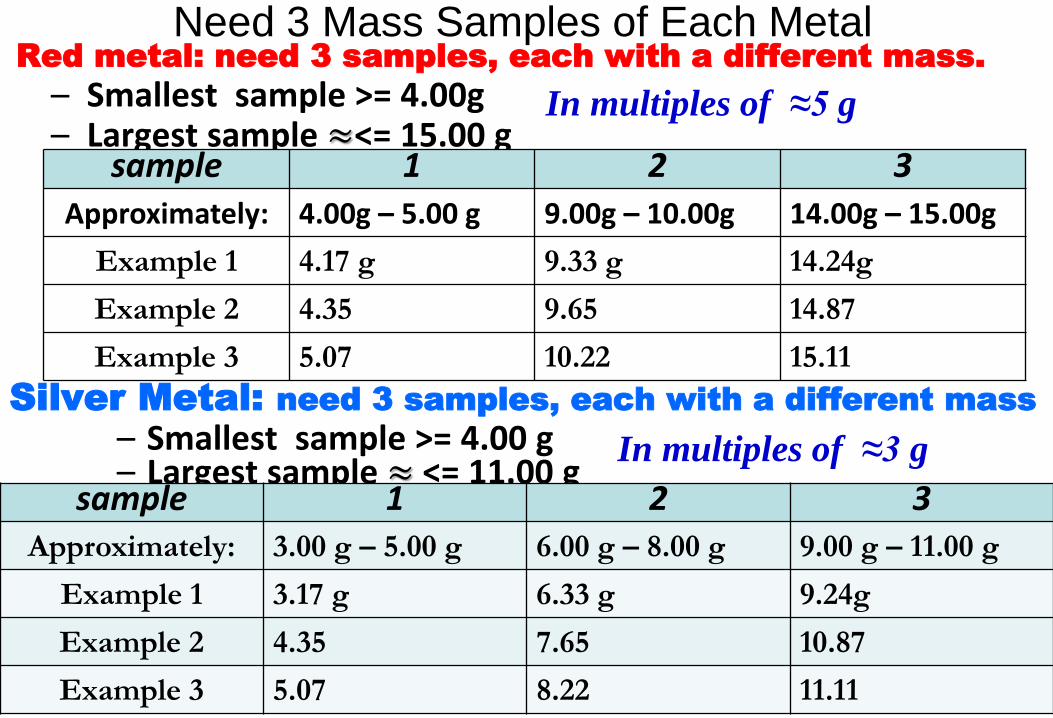
Need 3 Mass Samples of Each Metal Red metal: need 3 samples, each with a different mass.
– Smallest sample >= 4.00g – Largest sample ≈<= 15.00 g
Silver Metal: need 3 samples, each with a different mass
– Smallest sample >= 4.00 g – Largest sample ≈ <= 11.00 g
In multiples of ≈5 g
sample 1 2 3
Approximately: 4.00g – 5.00 g 9.00g – 10.00g 14.00g – 15.00g
Example 1 4.17 g 9.33 g 14.24g
Example 2 4.35 9.65 14.87
Example 3 5.07 10.22 15.11
In multiples of ≈3 g
sample 1 2 3 Approximately: 3.00 g – 5.00 g 6.00 g – 8.00 g 9.00 g – 11.00 g
Example 1 3.17 g 6.33 g 9.24g
Example 2 4.35 7.65 10.87
Example 3 5.07 8.22 11.11
Mass and Volume Lab Graduated Cylinders
Red metal
• Use 10 mL cylinder with exactly 5 mL water
added.
Silver Metal
• Use 25 mL cylinder with exactly 14 mL water
added.
a
b c
d
e.
Sample
Mass of
Sample,
(g)
Initial
Volume,
(mL)
Final
Volume,
(mL)
Volume
of
sample,
(mL)
Mass/ volume of the sample (g/ mL) (a ÷ d)
Red 1 Red 2 Red 3
AVERAGE XXX XXXXX XXXXX XXX Silver 1 Silver 2 Silver 3
AVERAGE XXX XXXXX XXXXX XXX
Mass & Volume Lab
IV is mass, DV is volume, mass/ volume ratio (density) is the calculated quantity.
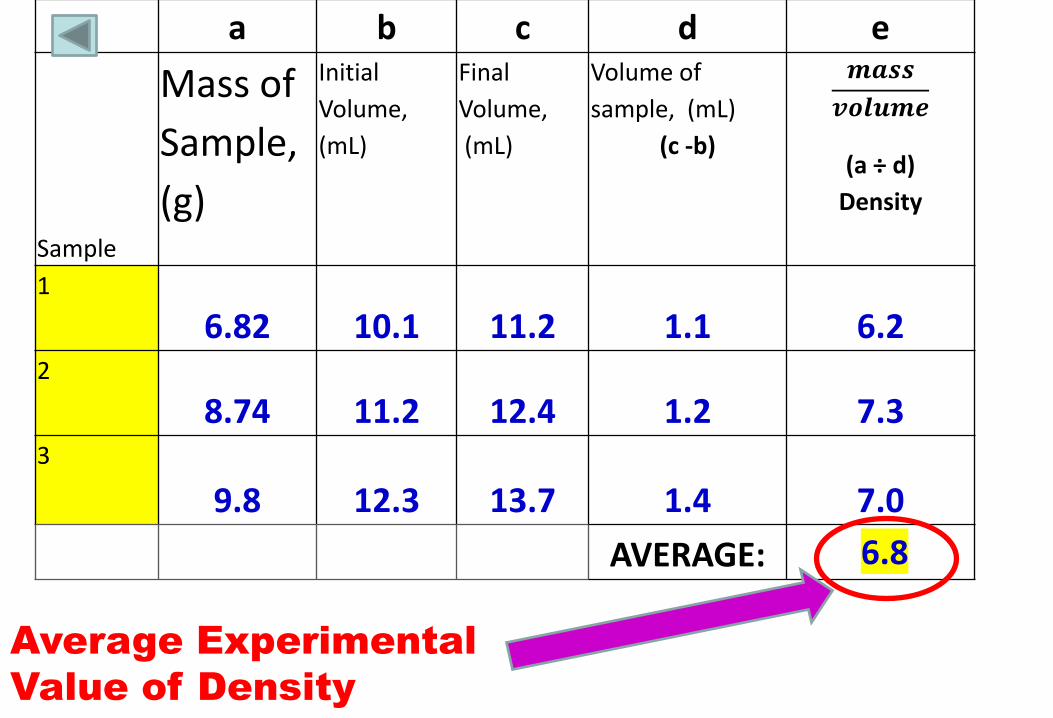
a b c d e
Sample
Mass of
Sample,
(g)
Initial
Volume,
(mL)
Final
Volume,
(mL)
Volume of
sample, (mL)
(c -b)
𝒎𝒂𝒔𝒔
𝒗𝒐𝒍𝒖𝒎𝒆
(a ÷ d)
Density
1
6.82 10.1 11.2 1.1 6.2 2
8.74 11.2 12.4 1.2 7.3 3
9.8 12.3 13.7 1.4 7.0
AVERAGE: 6.8
Average Experimental
Value of Density
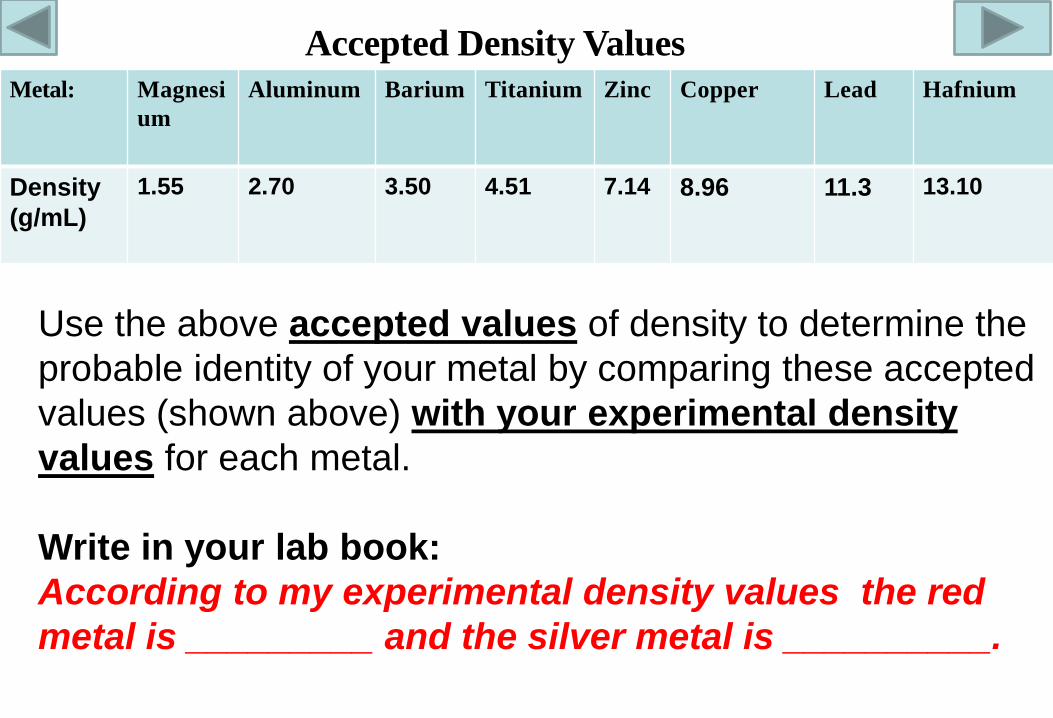
Metal: Magnesi
um
Aluminum Barium Titanium Zinc Copper Lead Hafnium
Density
(g/mL)
1.55 2.70 3.50 4.51 7.14 8.96 11.3 13.10
Accepted Density Values
Use the above accepted values of density to determine the
probable identity of your metal by comparing these accepted
values (shown above) with your experimental density
values for each metal.
Write in your lab book:
According to my experimental density values the red
metal is _________ and the silver metal is __________.
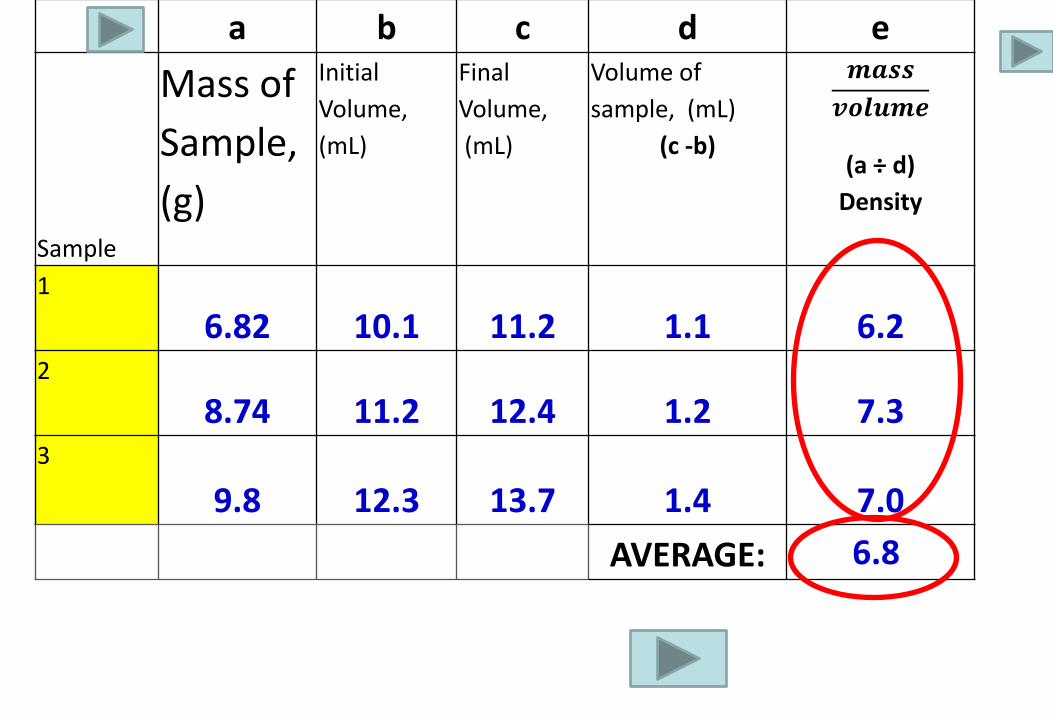
a b c d e
Sample
Mass of
Sample,
(g)
Initial
Volume,
(mL)
Final
Volume,
(mL)
Volume of
sample, (mL)
(c -b)
𝒎𝒂𝒔𝒔
𝒗𝒐𝒍𝒖𝒎𝒆
(a ÷ d)
Density
1
6.82 10.1 11.2 1.1 6.2 2
8.74 11.2 12.4 1.2 7.3 3
9.8 12.3 13.7 1.4 7.0
AVERAGE: 6.8
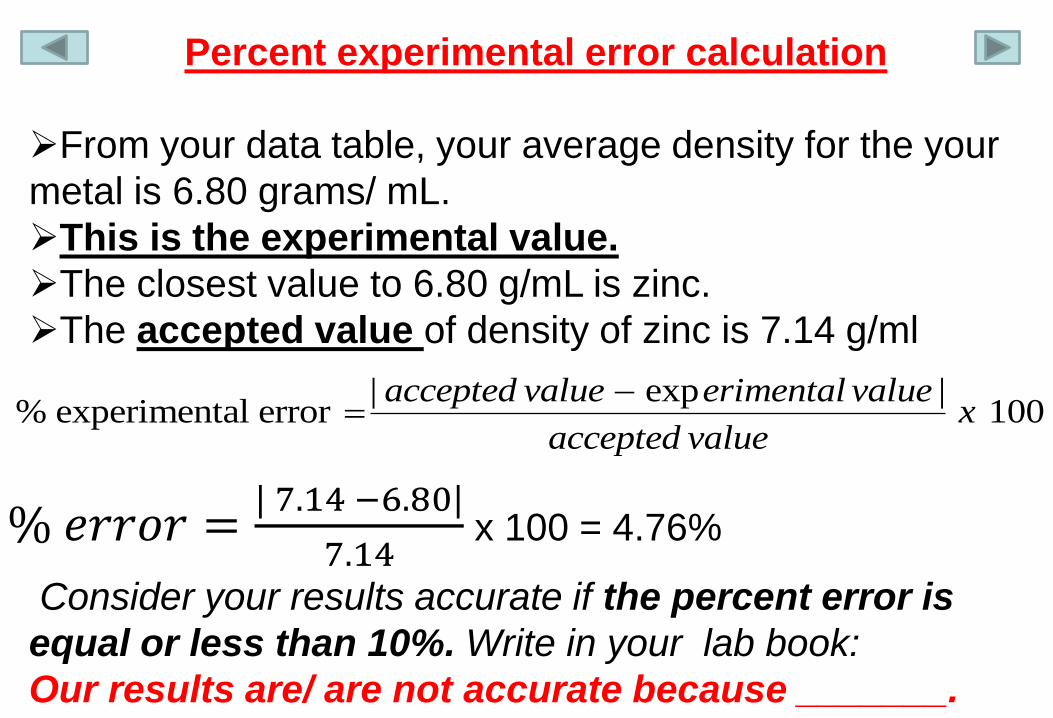
| exp |% experimental error 100
accepted value erimental valuex
accepted value
Percent experimental error calculation
From your data table, your average density for the your
metal is 6.80 grams/ mL.
This is the experimental value.
The closest value to 6.80 g/mL is zinc.
The accepted value of density of zinc is 7.14 g/ml
% 𝑒𝑟𝑟𝑜𝑟 =| 7.14 −6.80|
7.14 x 100 = 4.76%
Consider your results accurate if the percent error is
equal or less than 10%. Write in your lab book:
Our results are/ are not accurate because _______.
Are Your Results Accurate? • Write one of the following in your lab book
depending on the outcome of your % error
calculation: • Our results are accurate because our % error is
= < 10%.
• Our results are not accurate because our
% error is > 10%.
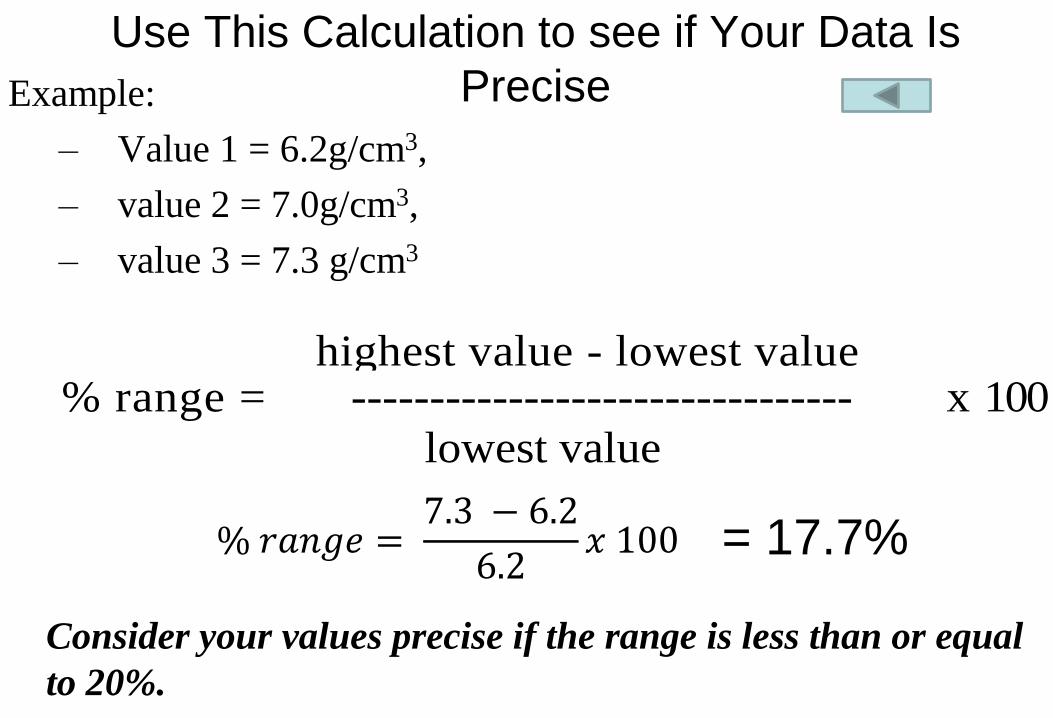
Use This Calculation to see if Your Data Is
Precise Example:
– Value 1 = 6.2g/cm3,
– value 2 = 7.0g/cm3,
– value 3 = 7.3 g/cm3
highest value - lowest value
% range = -------------------------------- x 100
lowest value
Consider your values precise if the range is less than or equal
to 20%.
% 𝑟𝑎𝑛𝑔𝑒 = 7.3 − 6.2
6.2𝑥 100 = 17.7%
Is Your Data Precise? • Write one of the following in your lab book
depending on the outcome of your % range
calculation: • Our data is precise because our % range is = <
10 %.
• Our data is not precise because our %
range is > 10%.