Embed Size (px)
Citation preview
Chemical Physics Letters 390 (2004) 65–70
www.elsevier.com/locate/cplett
Mass analyzed threshold ionization spectroscopy ofp-fluorophenol cation and the p-fluoro substitution effect
Bing Zhang a,b, Changyong Li a,c, Huawei Su a, Jung Lee Lin a, Wen Bih Tzeng a,*
a Molecular Sciences, Academia Sinica, P.O. Box 23-166, 1 Section 4, Roosevelt Road, Taipei 106, Taiwan, ROCb Wuhan Institute of Physics and Mathematics, The Chinese Academy of Sciences, P.O. Box 71010, Wuhan 430071, PR China
c Department of Electronics, Shanxi University, Taiyuan 030006, Shanxi, PR China
Received 4 February 2004; in final form 6 April 2004
Available online 27 April 2004
Abstract
The origin of the S1 S0 electronic transition and the adiabatic ionization energy of p-fluorophenol are determined to be
35 117� 2 and 68 577� 5 cm�1, which are lower than those of phenol by 1232 and 48 cm�1, respectively. Most of the active vi-
brations in the electronic excited S1 and cationic ground D0 states are related to the in-plane ring modes. The p-fluoro substitution
not only causes red shifts in the transition energies but also leads to a decrease in the frequencies of the observed vibrations. The
present experimental findings are well supported by our ab initio and density functional calculations.
� 2004 Elsevier B.V. All rights reserved.
1. Introduction
Phenol is the base molecule of tyrosine which is an
important amino acid related to UV absorption [1,2].
Detailed investigations on phenol and its derivatives can
allow deeper insights into the photochemical and
photophysical properties of tyrosine. The phenol cation
has been studied extensively by many methods including
zero-kinetic energy (ZEKE) photoelectron spectroscopy
and mass analyzed threshold ionization (MATI) spec-troscopy [3,4]. When a fluorine atom with high electro-
negativity replaces the hydrogen atom at the para
position, it can influence the electron distribution nearby
the aromatic ring. It follows that some properties, such
as molecular geometry, ionization energy (IE), and fre-
quencies of the active vibrations of the p-fluorophenolcation, are expected to deviate from those of phenol.
Because the differences of the measured quantities of thetwo species may range from a few to a few hundreds of
wavenumbers, the investigations of the p-fluoro substi-
tution effect require a high-resolution spectroscopic
technique, such as ZEKE or MATI spectroscopy.
* Corresponding author. Fax: +88623620020.
E-mail address: [email protected] (W. B. Tzeng).
0009-2614/$ - see front matter � 2004 Elsevier B.V. All rights reserved.
doi:10.1016/j.cplett.2004.04.013
m-Fluorophenol and its aqueous complex cations have
been studied by Fujii and M€uller-Dethlefs and theircoworkers using ZEKE spectroscopy [5]. The vibra-
tional frequencies of the normal modes of p-fluorophe-nol in the ground S0 state measured with IR and Raman
spectroscopy are available in the literature [6]. The
S1 S0 electronic transition of p-fluorophenol has beenstudied by one-color resonant two-photon ionization
(1C-R2PI) and rotationally resolved laser induced fluo-
rescence (LIF) [7–9]. Concerning the ionic properties,the vertical IE of p-fluorophenol is reported to be
8.79� 0.02 eV on the basis of photoelectron spectros-
copy [10]. The OH stretching vibration of p-fluorophe-nol in the cationic D0 state has been investigated by
autoionization-detected infrared spectroscopy [8]. To
the best of our knowledge, studies concerning the ring
vibrations of the p-fluorophenol cation are still not
available.In this Letter, we report the vibrationally resolved
MATI spectra of p-fluorophenol. Detailed analyses on
the spectral features yield information of the precise
adiabatic IE and the vibrations of p-fluorophenol in the
cationic ground D0 state. Comparison of the present
results of p-fluorophenol with those of phenol allows us
to gain knowledge about the p-fluoro substitution effect
10
135117 cm-1
00
0
tens
ity
66 B. Zhang et al. / Chemical Physics Letters 390 (2004) 65–70
on the electronic transition energy and molecular vi-
bration. We have also performed Hartree–Fock (HF)
and density functional theory (DFT) calculations to
provide possible interpretation for our experimental
findings.
0 200 400 600 800 1000
9b0
2
γ OH0
2
6b0
1
6a0
1
9b0
1
150
1
Ion
In
Relative Wavenumber / cm-1
Fig. 1. C-R2PI spectrum of p-fluorophenol.
2. Experimental and computational methods
The experiments were performed with a time-of-flight
mass spectrometer described elsewhere [11]. p-Fluor-ophenol (99% purity) was purchased from Sigma–
Aldrich and used without further purification. The solidsample was heated to about 60 �C to acquire sufficient
vapor pressure. The vapor was seeded into 2–3 bar of
helium and expanded into the vacuum through a pulsed
valve with a 0.15 mm diameter orifice. The two-color
resonant two-photon excitation process was initiated by
utilizing two independent tunable UV laser systems
controlled by a delay/pulse generator. A Fizeau-type
wavemeter (New Focus 7711) was used to calibrate thewavelengths of both lasers. These two counter-propa-
gating laser beams were focused and intersected per-
pendicularly with the molecular beam at 50 mm
downstream from the nozzle orifice. The pump laser was
used to excite jet-cooled p-fluorophenol to a specific
vibronic level in the S1 state. The probe laser was
scanned to bring the electronically excited molecule to
high n Rydberg states lying just below ionizationthreshold.
In the MATI experiments, about 70 ns after the oc-
currence of the laser pulses, a pulsed electric field of
)1.0 V/cm was switched on to reject the prompt ions.
About 8.20 ls later, a second pulsed electric field of
400 V/cm was applied to field-ionize the Rydberg neu-
trals. These threshold ions were then accelerated and
passed a field-free region before being detected by adual-stacked microchannel plate detector.
All calculations were performed by using the GAUS-AUS-
SIANSIAN 03W program package [12]. The labeling of the
carbon atoms of p-fluorophenol is 1–6 around the ring
and the substitution positions are numbered as C1–O
and C4–F.
3. Results
3.1. 1C-R2PI spectrum
Fig. 1 displays the 1C-R2PI spectrum of p-fluor-ophenol in the energy range near its S1 S0 electronic
transition. The general spectral features with the band
origin at 35 117� 2 cm�1 are in excellent agreement withthose reported in the literature [7–9]. Most of the pro-
nounced vibronic bands of p-fluorophenol are similar to
those observed for p-methylphenol [13]. The F and OH
are generally regarded as the electron-withdrawing and
electron-donating groups, respectively. The present re-
sults indicate that the nature of the substituents on the
para position has little effect on the ring vibrations of
phenol in the S1 state. The spectral assignment was done
by comparing the observed frequencies with those ofphenol and p-methylphenol as well as the calculated
values from the configuration interaction singles (CIS)
calculations with the 6-311++G** basis set, as shown in
Table 1. It is worth noting that the normal vibrations of
the calculated results can be viewed by using the GAUSSAUSS
VIEWIEW program which is a complementary program for
being used with GAUSSIANAUSSIAN 03W package [12].
The intense bands at 422 and 823 cm�1 are assignedto the 6a10, and 110 transitions, respectively, which mainly
involve in-plane ring deformation vibrations. Mode 1 is
usually referred to as the breathing motion. The bands
at 410 and 813 cm�1 result from the 9b10 and its overtone
9b20 transitions. Mode 9b is related to distinct in-plane
C1–OH and C4–F bending vibrations in addition to the
ring motion. In this mode, both the C1–OH and C4–F
bonds bend toward the opposite sides with respect to theimaginary axis containing the C1 and C4 atoms. Fur-
thermore, the magnitude of the C1–OH bending vibra-
tion is slightly greater than that of the C4–F. The weak
band at 340 cm�1 corresponds to the 151 transition,
which also exhibits in-plane C4–F and C1–OH bending
vibrations besides the ring motion. In contrast to pat-
tern 9b, mode 15 involves the C–F and C–OH bending
toward the same side with respect to the imaginary axiscontaining the C1 and C4 atoms. Moreover, the degree
of the C4–F bending vibration is slightly greater than
that of the C1–OH. The weak bands at 494, 562, 718,
and 728 cm�1 are assigned to the 16b10, 6b10, 12
10, and 510
transitions, as listed in Table 1. Modes 6b and 12 mainly
involve in-plane ring deformation, whereas modes 16b
and 5 are related to the out-of-plane ring CCC and CH
bending motions, respectively. The weak band at 736cm�1 is assigned to the 2� 0� transition of the out-
of-plane O–H bending vibration.
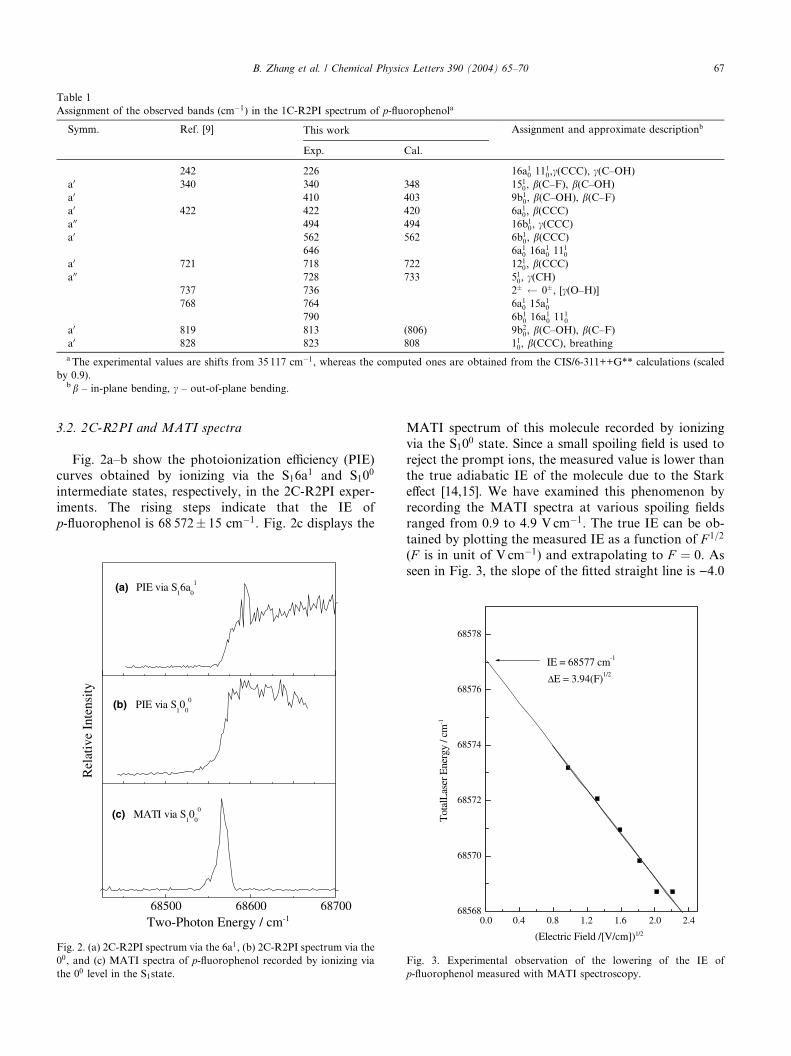
Table 1
Assignment of the observed bands (cm�1) in the 1C-R2PI spectrum of p-fluorophenola
Symm. Ref. [9] This work Assignment and approximate descriptionb
Exp. Cal.
242 226 16a10 1110,c(CCC), c(C–OH)
a0 340 340 348 1510, b(C–F), b(C–OH)
a0 410 403 9b10, b(C–OH), b(C–F)
a0 422 422 420 6a10, b(CCC)a00 494 494 16b1
0, c(CCC)a0 562 562 6b1
0, b(CCC)646 6a10 16a10 1110
a0 721 718 722 1210, b(CCC)a00 728 733 510, c(CH)
737 736 2� 0�, [c(O–H)]
768 764 6a10 15a10790 6b1
0 16a10 1110a0 819 813 (806) 9b2
0, b(C–OH), b(C–F)a0 828 823 808 110, b(CCC), breathinga The experimental values are shifts from 35 117 cm�1, whereas the computed ones are obtained from the CIS/6-311++G** calculations (scaled
by 0.9).bb – in-plane bending, c – out-of-plane bending.
B. Zhang et al. / Chemical Physics Letters 390 (2004) 65–70 67
3.2. 2C-R2PI and MATI spectra
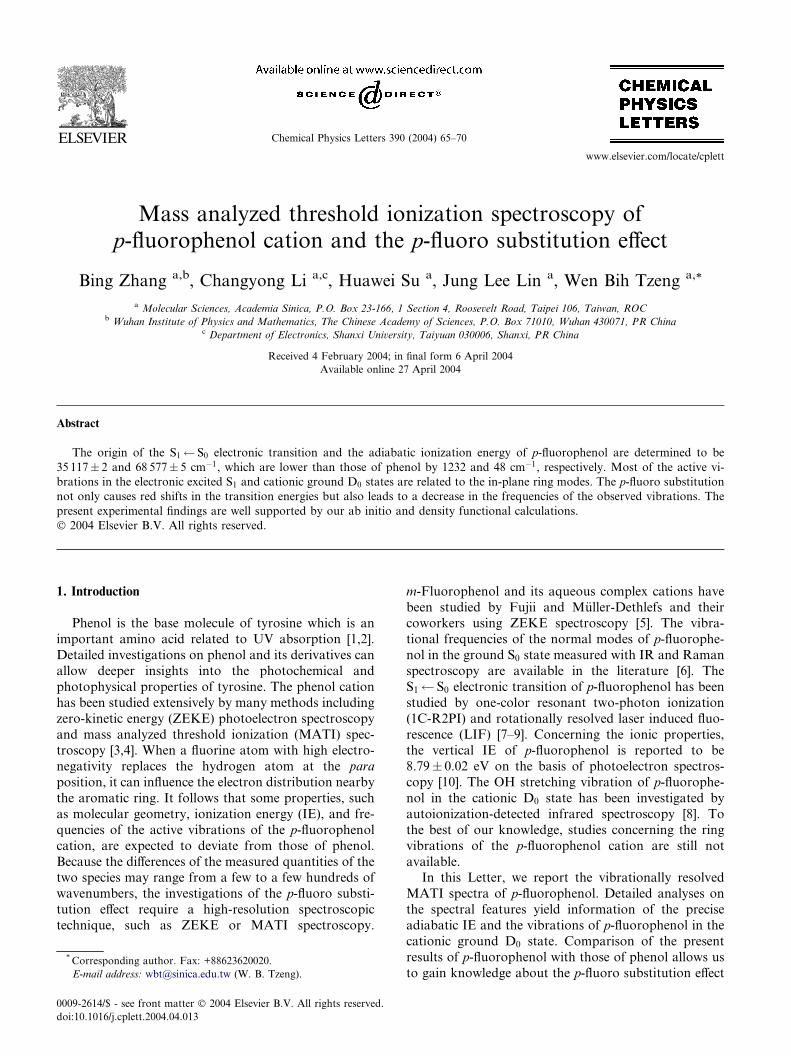
Fig. 2a–b show the photoionization efficiency (PIE)
curves obtained by ionizing via the S16a1 and S10
0
intermediate states, respectively, in the 2C-R2PI exper-
iments. The rising steps indicate that the IE of
p-fluorophenol is 68 572� 15 cm�1. Fig. 2c displays the
68500 68600 68700
(c) MATI via S10
0
0
Two-Photon Energy / cm-1
Rel
ativ
e In
tens
ity
(b) PIE via S10
0
0
(a) PIE via S16a
0
1
Fig. 2. (a) 2C-R2PI spectrum via the 6a1, (b) 2C-R2PI spectrum via the
00, and (c) MATI spectra of p-fluorophenol recorded by ionizing via
the 00 level in the S1state.
MATI spectrum of this molecule recorded by ionizing
via the S100 state. Since a small spoiling field is used to
reject the prompt ions, the measured value is lower than
the true adiabatic IE of the molecule due to the Stark
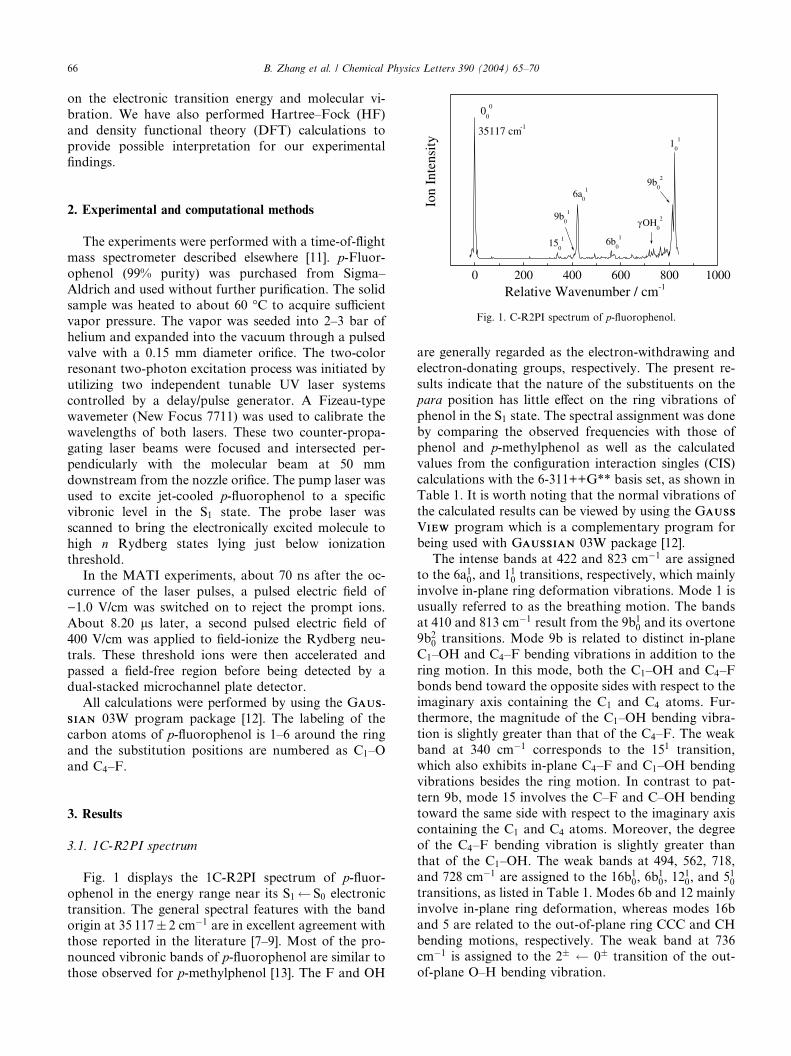
effect [14,15]. We have examined this phenomenon by
recording the MATI spectra at various spoiling fields
ranged from 0.9 to 4.9 V cm�1. The true IE can be ob-
tained by plotting the measured IE as a function of F 1=2
(F is in unit of V cm�1) and extrapolating to F ¼ 0. As
seen in Fig. 3, the slope of the fitted straight line is )4.0
0.0 0.4 0.8 1.2 1.6 2.0 2.468568
68570
68572
68574
68576
68578
IE = 68577 cm-1
∆E = 3.94(F)1/2
Tot
alL
aser
Ene
rgy
/ cm
-1
(Electric Field /[V/cm])1/2
Fig. 3. Experimental observation of the lowering of the IE of
p-fluorophenol measured with MATI spectroscopy.
68 B. Zhang et al. / Chemical Physics Letters 390 (2004) 65–70
and the intercept of is 68 577 cm�1. This shows that theenergy lowering in the IE due to the Stark effect may be
approximated to be 4.0 F 1=2 and the IE is 68 577� 5
cm�1 (8.5025� 0.0006 eV). The adiabatic IE of p-flu-orophenol determined by MATI spectroscopy is slightlyless than the reported vertical IE of 8.79� 0.02 eV
measured by photoelectron spectroscopy.
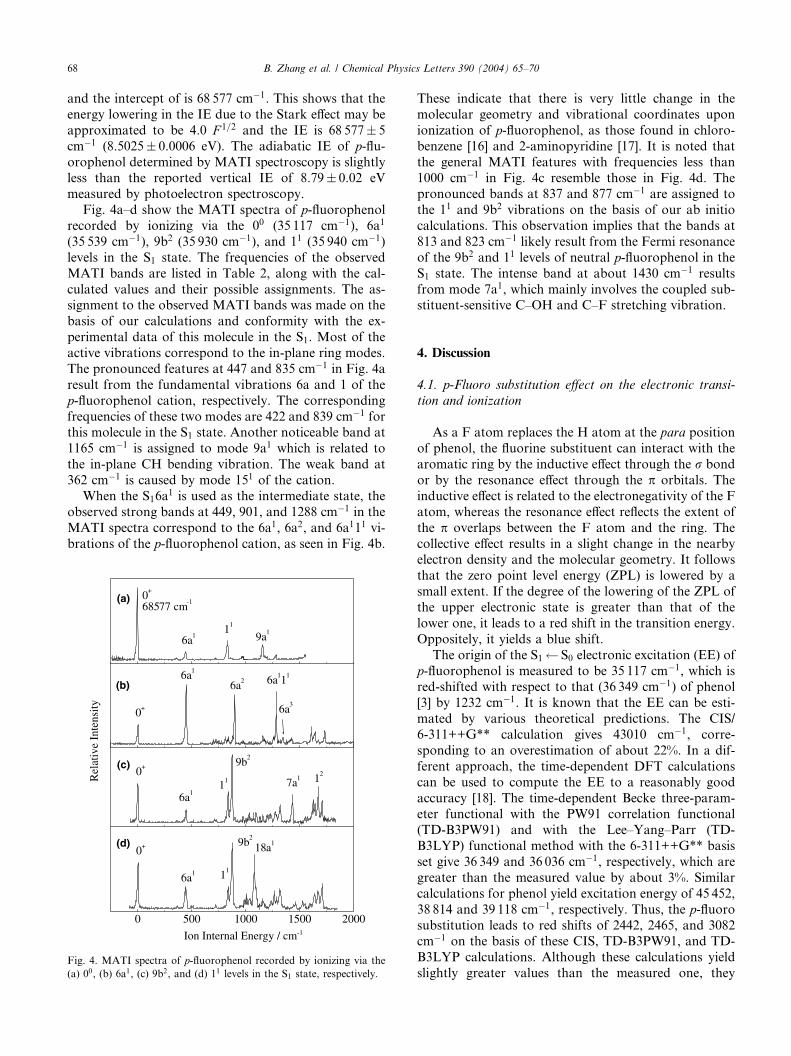
Fig. 4a–d show the MATI spectra of p-fluorophenolrecorded by ionizing via the 00 (35 117 cm�1), 6a1
(35 539 cm�1), 9b2 (35 930 cm�1), and 11 (35 940 cm�1)levels in the S1 state. The frequencies of the observed
MATI bands are listed in Table 2, along with the cal-
culated values and their possible assignments. The as-signment to the observed MATI bands was made on the
basis of our calculations and conformity with the ex-
perimental data of this molecule in the S1. Most of the
active vibrations correspond to the in-plane ring modes.
The pronounced features at 447 and 835 cm�1 in Fig. 4a
result from the fundamental vibrations 6a and 1 of the
p-fluorophenol cation, respectively. The corresponding
frequencies of these two modes are 422 and 839 cm�1 forthis molecule in the S1 state. Another noticeable band at
1165 cm�1 is assigned to mode 9a1 which is related to
the in-plane CH bending vibration. The weak band at
362 cm�1 is caused by mode 151 of the cation.
When the S16a1 is used as the intermediate state, the
observed strong bands at 449, 901, and 1288 cm�1 in the
MATI spectra correspond to the 6a1, 6a2, and 6a111 vi-
brations of the p-fluorophenol cation, as seen in Fig. 4b.
0 500 1000 1500 2000
18a1
11
9b2
6a1
0+(d)
Rel
ativ
e In
tens
ity
Ion Internal Energy / cm-1
12
7a111
9b2
6a1
0+(c)
6a3
6a111
6a26a1
0+
(b)
9a111
6a1
68577 cm-10+
(a)
Fig. 4. MATI spectra of p-fluorophenol recorded by ionizing via the
(a) 00, (b) 6a1, (c) 9b2, and (d) 11 levels in the S1 state, respectively.
These indicate that there is very little change in the
molecular geometry and vibrational coordinates upon
ionization of p-fluorophenol, as those found in chloro-
benzene [16] and 2-aminopyridine [17]. It is noted that
the general MATI features with frequencies less than1000 cm�1 in Fig. 4c resemble those in Fig. 4d. The
pronounced bands at 837 and 877 cm�1 are assigned to
the 11 and 9b2 vibrations on the basis of our ab initio
calculations. This observation implies that the bands at
813 and 823 cm�1 likely result from the Fermi resonance
of the 9b2 and 11 levels of neutral p-fluorophenol in the
S1 state. The intense band at about 1430 cm�1 results
from mode 7a1, which mainly involves the coupled sub-stituent-sensitive C–OH and C–F stretching vibration.
4. Discussion
4.1. p-Fluoro substitution effect on the electronic transi-
tion and ionization
As a F atom replaces the H atom at the para position
of phenol, the fluorine substituent can interact with the
aromatic ring by the inductive effect through the r bond
or by the resonance effect through the p orbitals. The
inductive effect is related to the electronegativity of the F
atom, whereas the resonance effect reflects the extent of
the p overlaps between the F atom and the ring. The
collective effect results in a slight change in the nearbyelectron density and the molecular geometry. It follows
that the zero point level energy (ZPL) is lowered by a
small extent. If the degree of the lowering of the ZPL of
the upper electronic state is greater than that of the
lower one, it leads to a red shift in the transition energy.
Oppositely, it yields a blue shift.
The origin of the S1 S0 electronic excitation (EE) of
p-fluorophenol is measured to be 35 117 cm�1, which isred-shifted with respect to that (36 349 cm�1) of phenol[3] by 1232 cm�1. It is known that the EE can be esti-
mated by various theoretical predictions. The CIS/
6-311++G** calculation gives 43010 cm�1, corre-
sponding to an overestimation of about 22%. In a dif-
ferent approach, the time-dependent DFT calculations
can be used to compute the EE to a reasonably good
accuracy [18]. The time-dependent Becke three-param-eter functional with the PW91 correlation functional
(TD-B3PW91) and with the Lee–Yang–Parr (TD-
B3LYP) functional method with the 6-311++G** basis
set give 36 349 and 36 036 cm�1, respectively, which are
greater than the measured value by about 3%. Similar
calculations for phenol yield excitation energy of 45 452,
38 814 and 39 118 cm�1, respectively. Thus, the p-fluorosubstitution leads to red shifts of 2442, 2465, and 3082cm�1 on the basis of these CIS, TD-B3PW91, and TD-
B3LYP calculations. Although these calculations yield
slightly greater values than the measured one, they
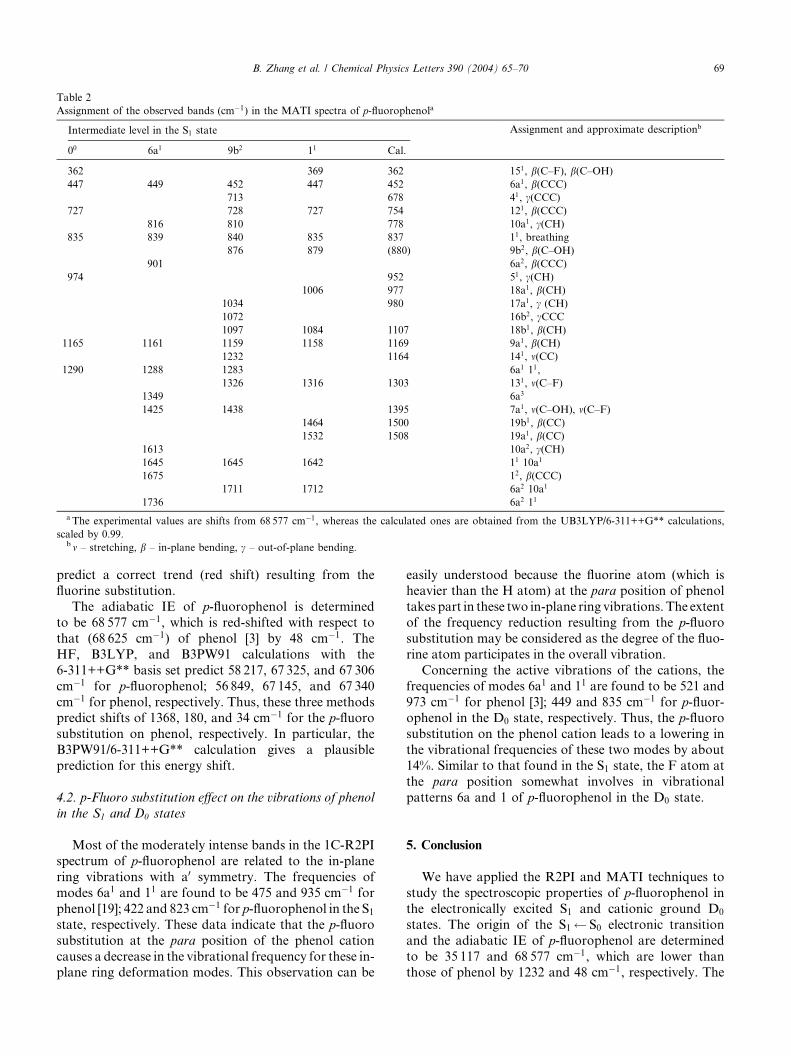
Table 2
Assignment of the observed bands (cm�1) in the MATI spectra of p-fluorophenola
Intermediate level in the S1 state Assignment and approximate descriptionb
00 6a1 9b2 11 Cal.
362 369 362 151, b(C–F), b(C–OH)
447 449 452 447 452 6a1, b(CCC)713 678 41, c(CCC)
727 728 727 754 121, b(CCC)816 810 778 10a1, c(CH)
835 839 840 835 837 11, breathing
876 879 (880) 9b2, b(C–OH)
901 6a2, b(CCC)974 952 51, c(CH)
1006 977 18a1, b(CH)
1034 980 17a1, c (CH)
1072 16b2, cCCC1097 1084 1107 18b1, b(CH)
1165 1161 1159 1158 1169 9a1, b(CH)
1232 1164 141, m(CC)1290 1288 1283 6a1 11,
1326 1316 1303 131, m(C–F)1349 6a3
1425 1438 1395 7a1, m(C–OH), m(C–F)1464 1500 19b1, b(CC)1532 1508 19a1, b(CC)
1613 10a2, c(CH)
1645 1645 1642 11 10a1
1675 12, b(CCC)1711 1712 6a2 10a1
1736 6a2 11
a The experimental values are shifts from 68 577 cm�1, whereas the calculated ones are obtained from the UB3LYP/6-311++G** calculations,
scaled by 0.99.b m – stretching, b – in-plane bending, c – out-of-plane bending.
B. Zhang et al. / Chemical Physics Letters 390 (2004) 65–70 69
predict a correct trend (red shift) resulting from thefluorine substitution.
The adiabatic IE of p-fluorophenol is determined
to be 68 577 cm�1, which is red-shifted with respect to
that (68 625 cm�1) of phenol [3] by 48 cm�1. The
HF, B3LYP, and B3PW91 calculations with the
6-311++G** basis set predict 58 217, 67 325, and 67 306
cm�1 for p-fluorophenol; 56 849, 67 145, and 67 340
cm�1 for phenol, respectively. Thus, these three methodspredict shifts of 1368, 180, and 34 cm�1 for the p-fluorosubstitution on phenol, respectively. In particular, the
B3PW91/6-311++G** calculation gives a plausible
prediction for this energy shift.
4.2. p-Fluoro substitution effect on the vibrations of phenol
in the S1 and D0 states
Most of the moderately intense bands in the 1C-R2PI
spectrum of p-fluorophenol are related to the in-plane
ring vibrations with a0 symmetry. The frequencies of
modes 6a1 and 11 are found to be 475 and 935 cm�1 forphenol [19]; 422 and 823 cm�1 for p-fluorophenol in the S1state, respectively. These data indicate that the p-fluorosubstitution at the para position of the phenol cation
causes a decrease in the vibrational frequency for these in-plane ring deformation modes. This observation can be
easily understood because the fluorine atom (which isheavier than the H atom) at the para position of phenol
takes part in these two in-plane ring vibrations. The extent
of the frequency reduction resulting from the p-fluorosubstitution may be considered as the degree of the fluo-
rine atom participates in the overall vibration.
Concerning the active vibrations of the cations, the
frequencies of modes 6a1 and 11 are found to be 521 and
973 cm�1 for phenol [3]; 449 and 835 cm�1 for p-fluor-ophenol in the D0 state, respectively. Thus, the p-fluorosubstitution on the phenol cation leads to a lowering in
the vibrational frequencies of these two modes by about
14%. Similar to that found in the S1 state, the F atom at
the para position somewhat involves in vibrational
patterns 6a and 1 of p-fluorophenol in the D0 state.
5. Conclusion
We have applied the R2PI and MATI techniques to
study the spectroscopic properties of p-fluorophenol inthe electronically excited S1 and cationic ground D0
states. The origin of the S1 S0 electronic transition
and the adiabatic IE of p-fluorophenol are determined
to be 35 117 and 68 577 cm�1, which are lower thanthose of phenol by 1232 and 48 cm�1, respectively. The
70 B. Zhang et al. / Chemical Physics Letters 390 (2004) 65–70
observed red shifts resulting from the p-fluoro substi-
tution indicate that the extent of the lowering of the ZPL
in the upper state is greater than that in the lower state.
These experimental findings are in good agreement with
the results of our ab initio and DFT calculations.Most of the active vibrations of the p-fluorophenol
cation are related to the in-plane ring modes. In par-
ticular, the intense bands at 449 and 835 cm�1 corre-
spond to vibrations of 6a and 1, respectively. The
frequencies of these two modes of the p-fluorophenolcation are found to be less than those of the phenol
cation by about 14%. The present findings indicate that
the p-fluoro substitution causes a frequency reductionfor these two in-plane ring vibrations which include the
atom at the para position of the ring.
Acknowledgements
We gratefully thank the National Science Council of
the Republic of China for financial support of this workunder Grant No. NSC-92-2113-M-001-053.
References
[1] K. Song, J.M. Hayes, J. Mol. Spectrosc. 134 (1989) 82.
[2] S.J. Martinez III, J.C. Alfano, D.H. Levy, J. Mol. Spectrosc. 152
(1992) 80.
[3] O. Dopfer, K. M€uller-Dethlefs, J. Chem. Phys. 101 (1994)
8508.
[4] S.R. Haines, W.D. Geppert, D.M. Chapman, M.J. Watkins,
C.E.H. Dessent, M.C.R. Cockett, K. M€uller-Dethlefs, J. Chem.
Phys. 109 (1998) 9244.
[5] K. Yosida, K. Suzuki, S. Ishiuchi, M. Sakai, M. Fujii, C.E.H.
Dessent, K. M€uller-Dethlefs, Phys. Chem. Chem. Phys. 4 (2002)
2534.
[6] G. Varsanyi, Assignments of Vibrational Spectra of Seven
Hundred Benzene Derivatives, Wiley, New York,
1974.
[7] R. Tembreull, T.M. Dunn, D.M. Lubman, Spectrochim. Acta
42A (1986) 899.
[8] E. Fujimaki, A. Fujii, T. Ebata, N. Mikami, J. Chem. Phys. 4238
(1999) 4238.
[9] C. Ratzer, M. Nispel, M. Schmitt, Phys. Chem. Chem. Phys. 5
(2003) 812.
[10] The NIST Chemistry Webbook, <http://webbook.nist.gov/>.
[11] W.B. Tzeng, J.L. Lin, J. Phys. Chem. A 103 (1999)
8612.
[12] M.J. Frisch et al., GAUSSIANAUSSIAN 03, Revision B.01, Gaussian, Inc.,
Pittsburgh, PA, 2003.
[13] T. Ebata, M. Ito, J. Phys. Chem. 96 (1992) 3224.
[14] W.A. Chupka, J. Chem. Phys. 98 (1993) 4520.
[15] E.W. Schlag, ZEKE Spectroscopy, Cambridge University Press,
Cambridge, 1998.
[16] G. Lembach, B. Brutschy, Chem. Phys. Lett. 273 (1997)
421.
[17] J.L. Lin, R.H. Wu, W.B. Tzeng, Chem. Phys. Lett. 353 (2002)
55.
[18] M.E. Casida, C. Jamorski, K.C. Casida, D.R. Salahub, J. Chem.
Phys. 108 (1998) 4439.
[19] H.D. Bist, J.C.D. Brand, D.R. Williams, J. Mol. Spectrosc. 24
(1967) 413.