Embed Size (px)
Citation preview
Mass Accuracy and Mass
Resolution in TOF MS
October 2011
What will we discuss?
• What is mass resolution and mass accuracy
• Why and when they are important
• How to use resolution and mass accuracy for practical
analysis
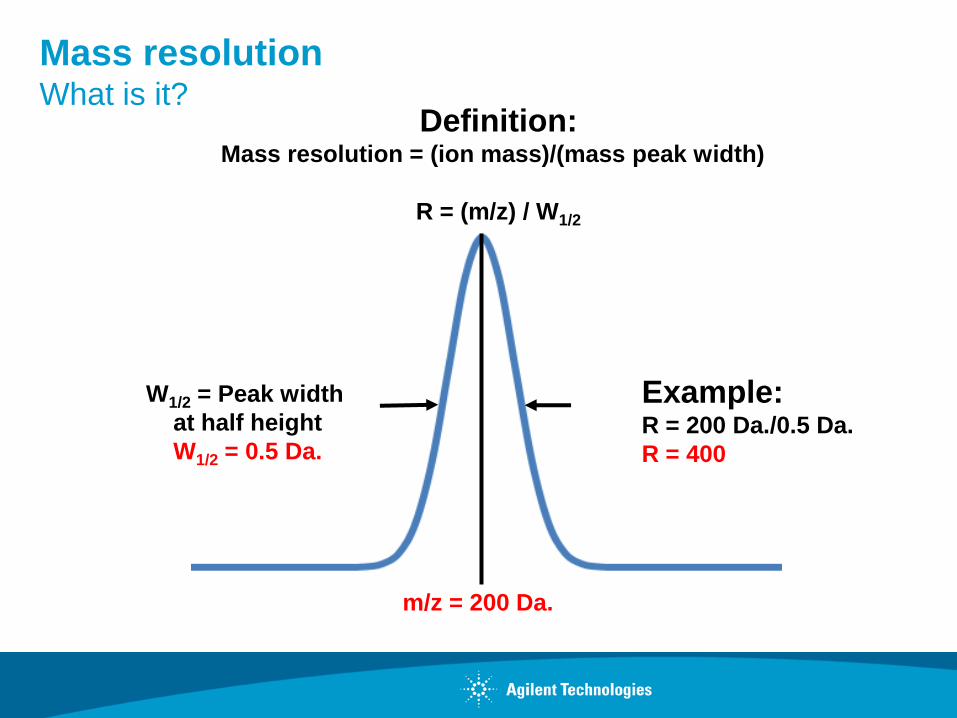
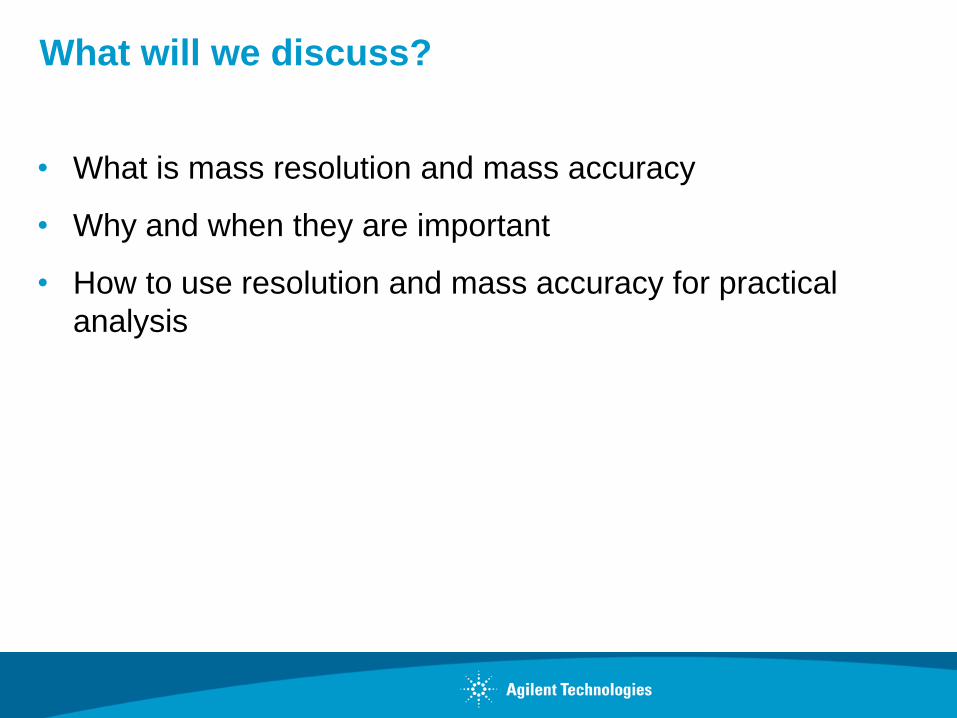
W1/2 = Peak width
at half height
W1/2 = 0.5 Da.
Mass resolution What is it?
Definition: Mass resolution = (ion mass)/(mass peak width)
R = (m/z) / W1/2
m/z = 200 Da.
Example: R = 200 Da./0.5 Da.
R = 400
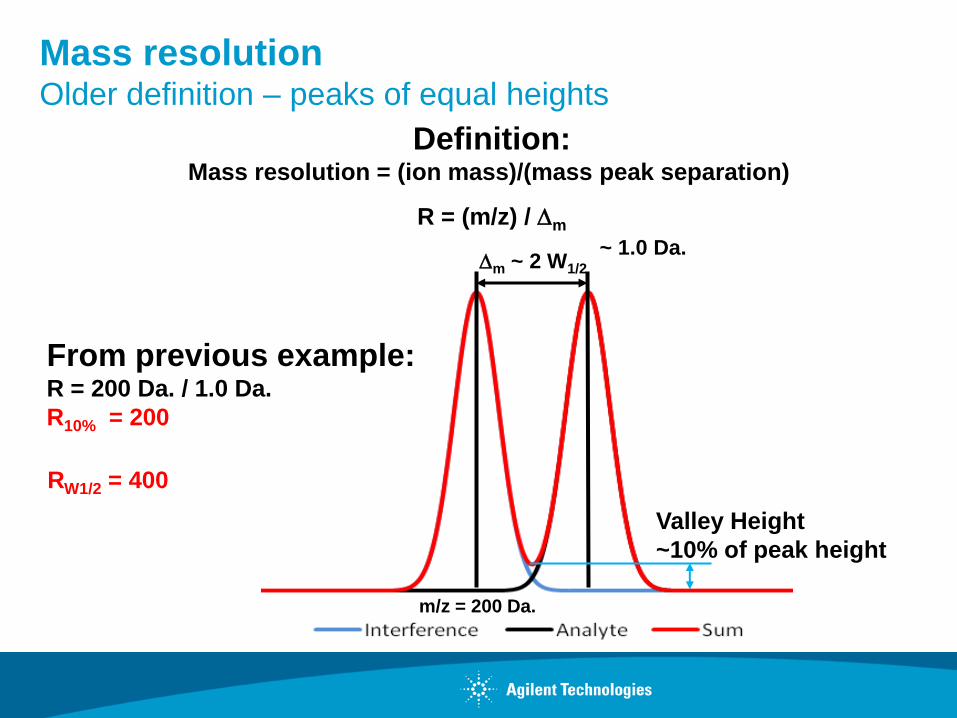
Mass resolution Older definition – peaks of equal heights
Definition: Mass resolution = (ion mass)/(mass peak separation)
R = (m/z) / Dm
Dm ~ 2 W1/2
Valley Height
~10% of peak height
m/z = 200 Da.
From previous example: R = 200 Da. / 1.0 Da.
R10% = 200
~ 1.0 Da.
RW1/2 = 400
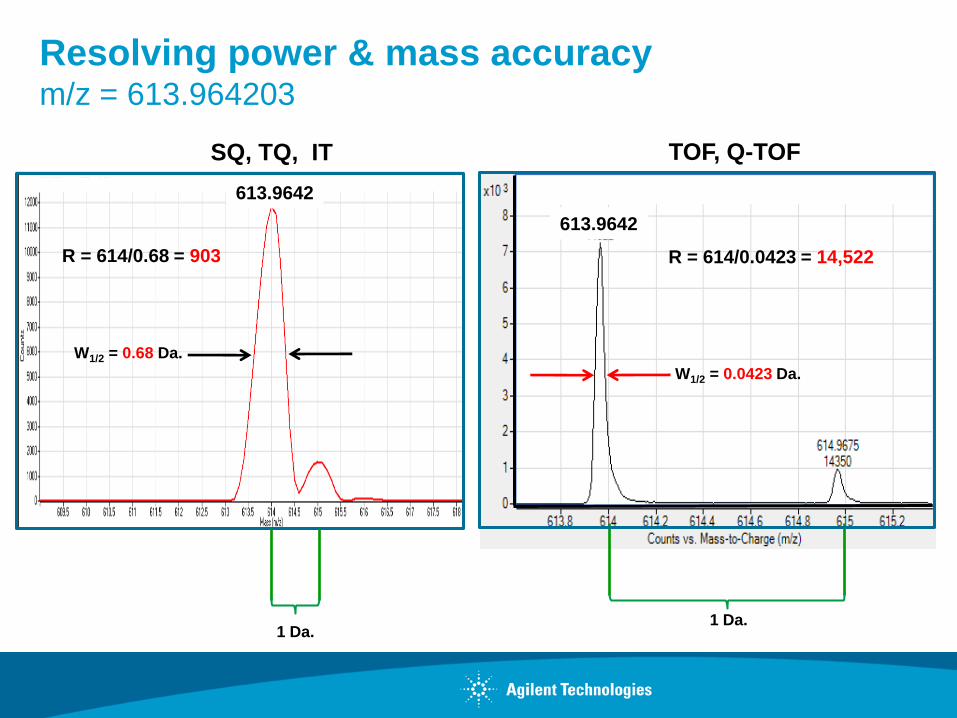
Resolving power & mass accuracy m/z = 613.964203
R = 614/0.68 = 903
W1/2 = 0.68 Da.
SQ, TQ, IT
1 Da.
613.9642
TOF, Q-TOF
R = 614/0.0423 = 14,522
1 Da.
W1/2 = 0.0423 Da.
613.9642
6
0
20
40
60
80
100
200 250 300 350 400 450 500 550 600
334.3
320.2 348.3
306.2 362.3 294.2
376.3 280.2
390.3
274.2
404.3 264.2 250.2
256.1
416.3
432.4 236.1
446.4
460.4
474.4 222.1
488.4 502.4
518.5 228.2 528.5 208.1
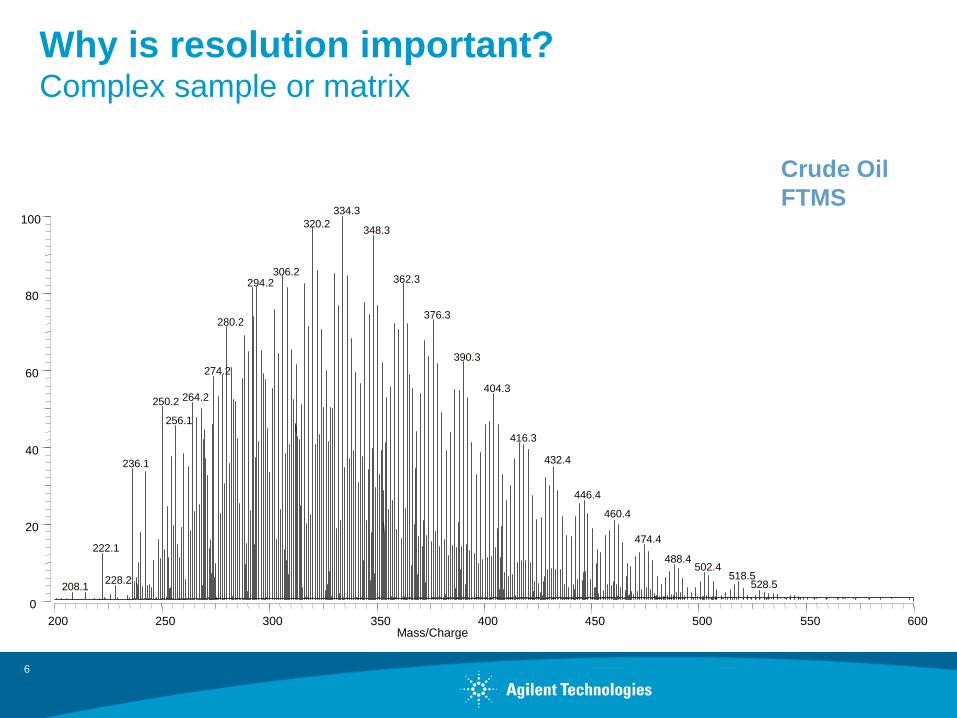
Why is resolution important? Complex sample or matrix
Mass/Charge
Crude Oil
FTMS
7
0
20
40
60
80
100
200 250 300 350 400 450 500 550 600
334.3
320.2 348.3
306.2 362.3 294.2
376.3 280.2
390.3
274.2
404.3 264.2 250.2
256.1
416.3
432.4 236.1
446.4
460.4
474.4 222.1
488.4 502.4
518.5 228.2 528.5 208.1
Mass/Charge
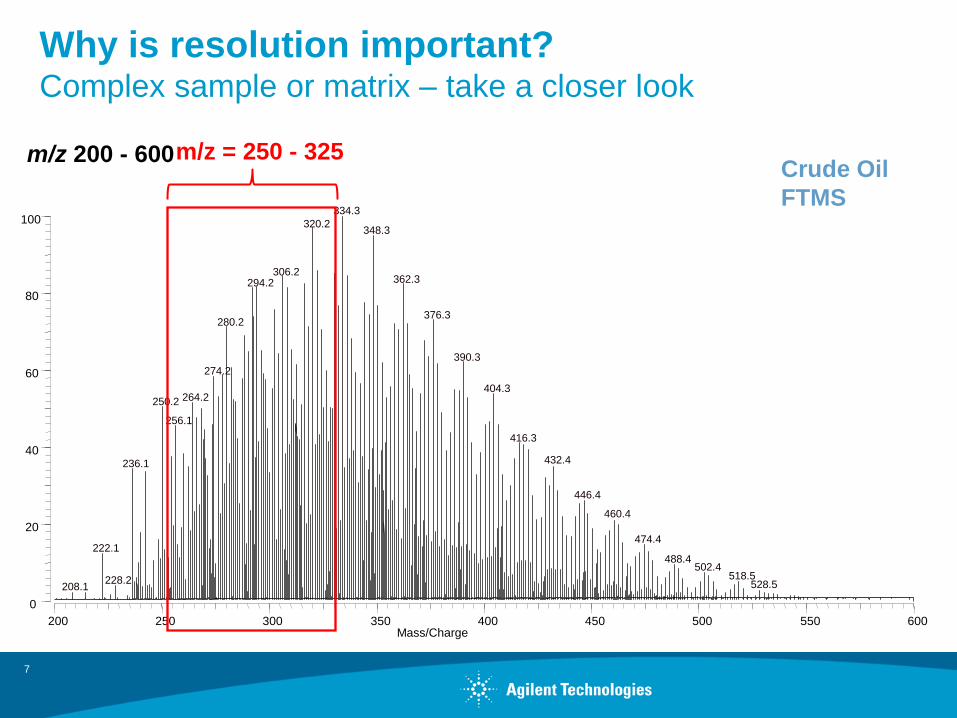
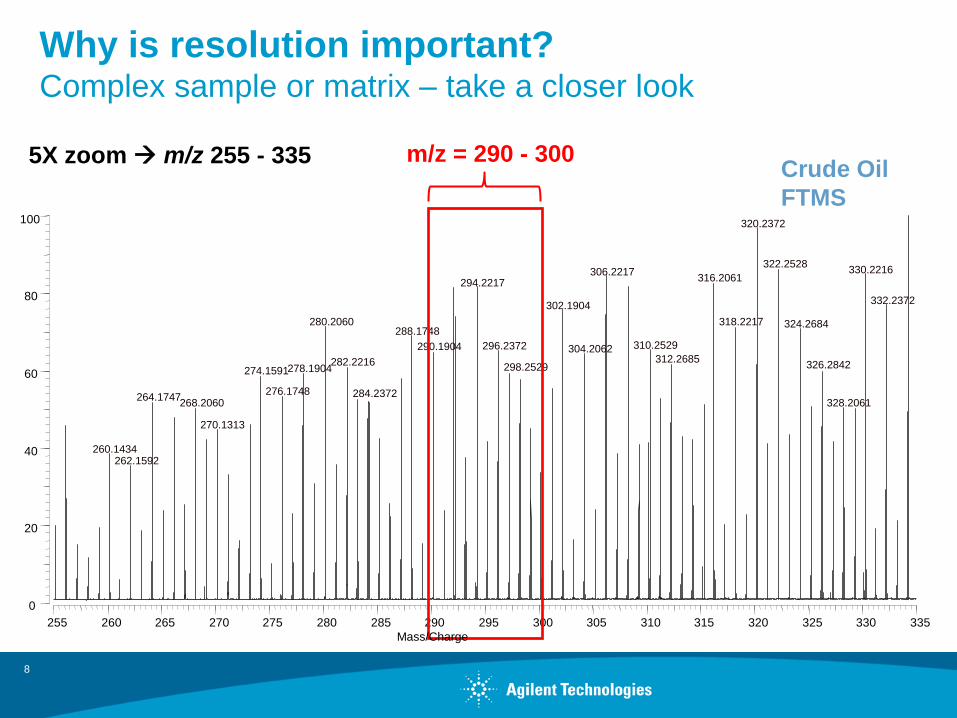
Why is resolution important? Complex sample or matrix – take a closer look
m/z = 250 - 325 m/z 200 - 600
Crude Oil
FTMS
8
0
20
40
60
80
100
255 260 265 270 275 280 285 290 295 300 305 310 315 320 325 330 335
320.2372
322.2528 330.2216 306.2217
316.2061 294.2217
332.2372 302.1904
318.2217 280.2060 324.2684 288.1748
310.2529 296.2372 290.1904 304.2062 312.2685 282.2216 326.2842 278.1904 274.1591 298.2529
276.1748 284.2372 264.1747 268.2060 328.2061
270.1313
260.1434 262.1592
Mass/Charge
5X zoom m/z 255 - 335
Why is resolution important? Complex sample or matrix – take a closer look
m/z = 290 - 300 Crude Oil
FTMS
9
Mass/Charge
0
20
40
60
80
100
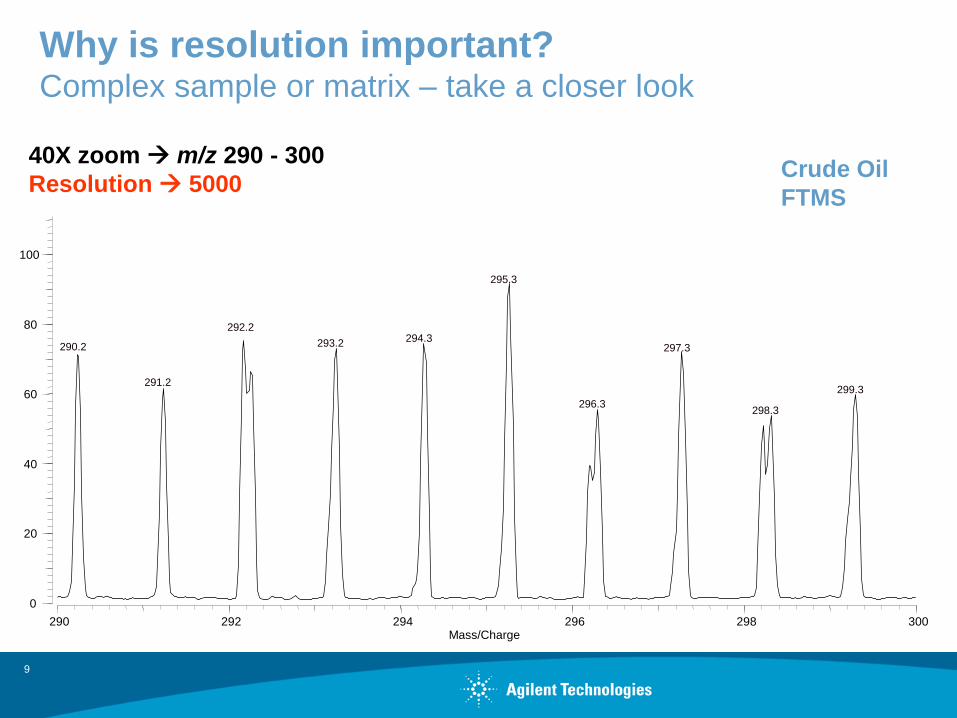
290 292 294 296 298 300
295.3
294.3 293.2 290.2 297.3
291.2 299.3
296.3 298.3
292.2
Why is resolution important? Complex sample or matrix – take a closer look
Crude Oil
FTMS
40X zoom m/z 290 - 300
Resolution 5000
10
0
20
40
60
80
100
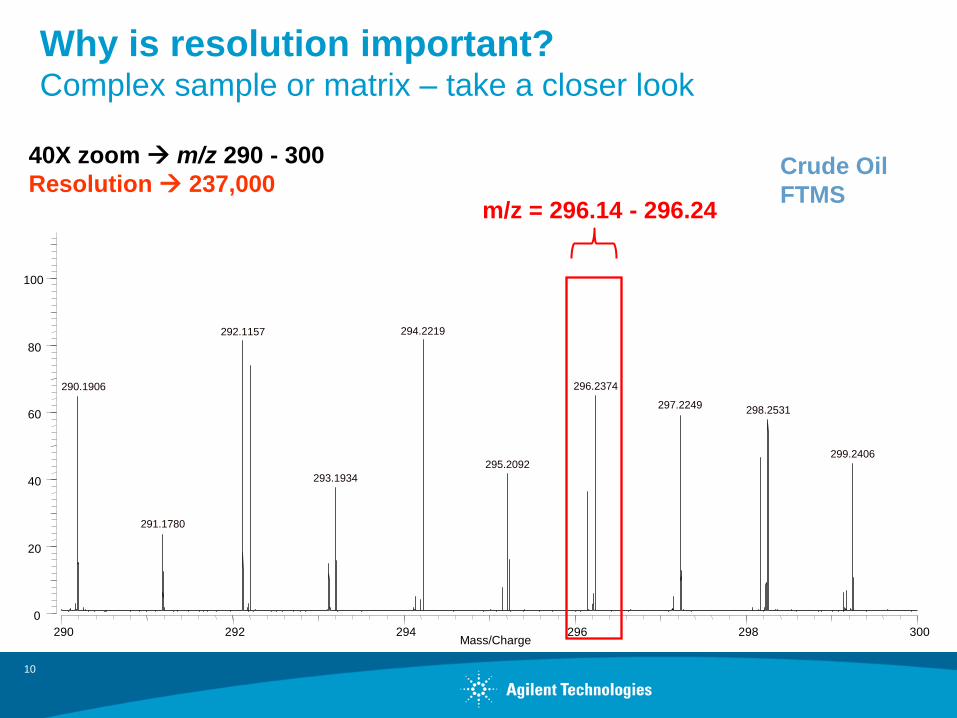
290 292 294 296 298 300 Mass/Charge
294.2219 292.1157
296.2374 290.1906
297.2249 298.2531
299.2406 295.2092
293.1934
291.1780
Why is resolution important? Complex sample or matrix – take a closer look
Crude Oil
FTMS
40X zoom m/z 290 - 300
Resolution 237,000
m/z = 296.14 - 296.24
11
0
5
10
15
20
25
30
35
40
45
50
55
60
65
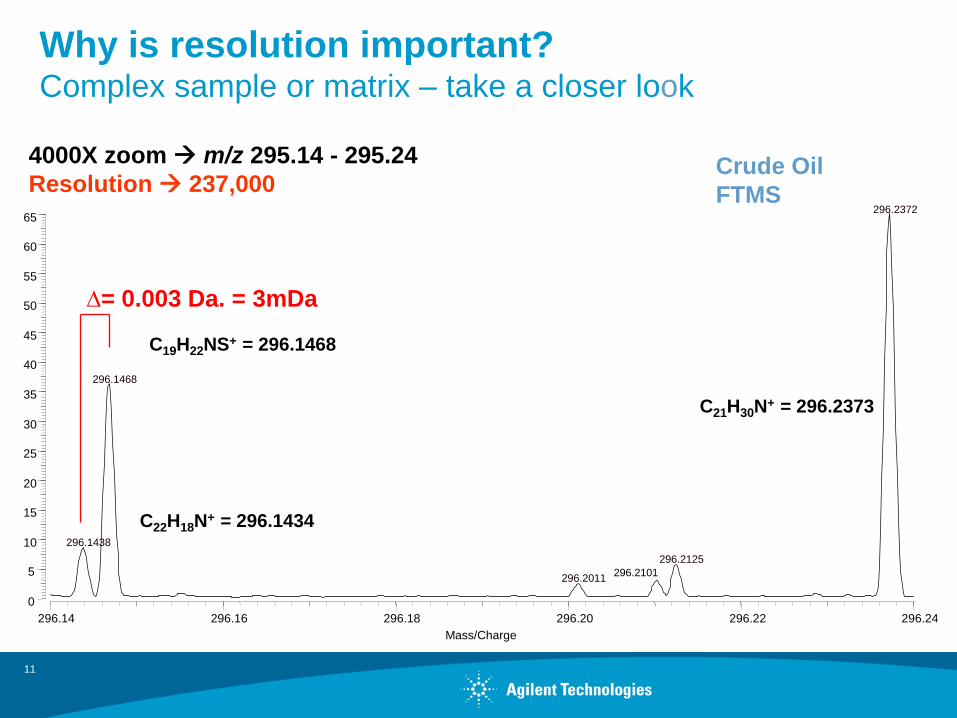
296.14 296.16 296.18 296.20 296.22 296.24
296.2372
296.1468
296.1438
296.2125
296.2011
C21H30N+ = 296.2373
C19H22NS+ = 296.1468
C22H18N+ = 296.1434
∆= 0.003 Da. = 3mDa
296.2101
Mass/Charge
Why is resolution important? Complex sample or matrix – take a closer look
4000X zoom m/z 295.14 - 295.24
Resolution 237,000
Crude Oil
FTMS
How much resolution is required?
• The resolution required to solve a given analytical problem
depends on the sample and matrix
• Sample preparation reduces potential chemical
interferences and therefore the resolution requirements
• Most applications require a resolution of 10,000
• For some sample/matrix combinations however, there may
never be enough resolution
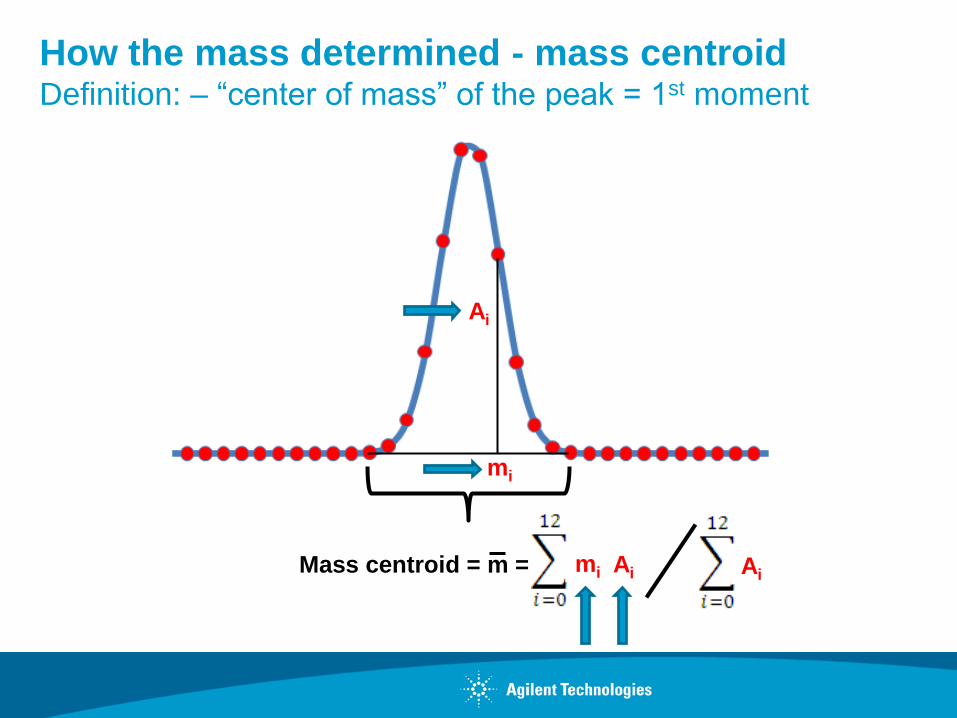
How the mass determined - mass centroid Definition: – “center of mass” of the peak = 1st moment
Ai
mi
Mass centroid = m = mi Ai
mi
mi
Ai
Ai Ai
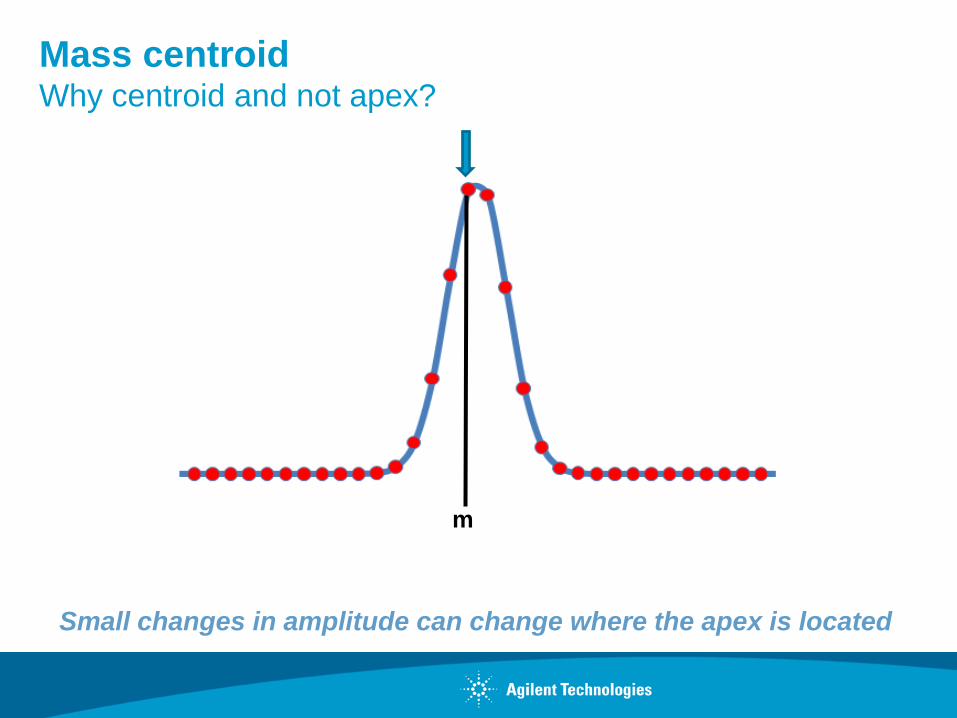
Mass centroid Why centroid and not apex?
m
Small changes in amplitude can change where the apex is located
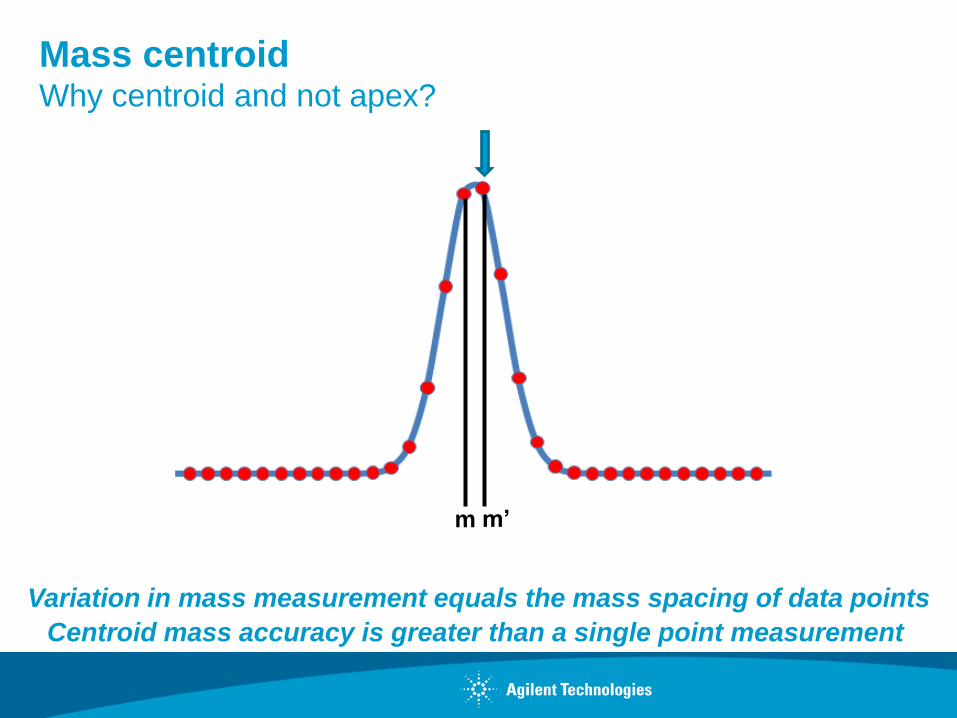
Mass centroid Why centroid and not apex?
m m’
Variation in mass measurement equals the mass spacing of data points
Centroid mass accuracy is greater than a single point measurement
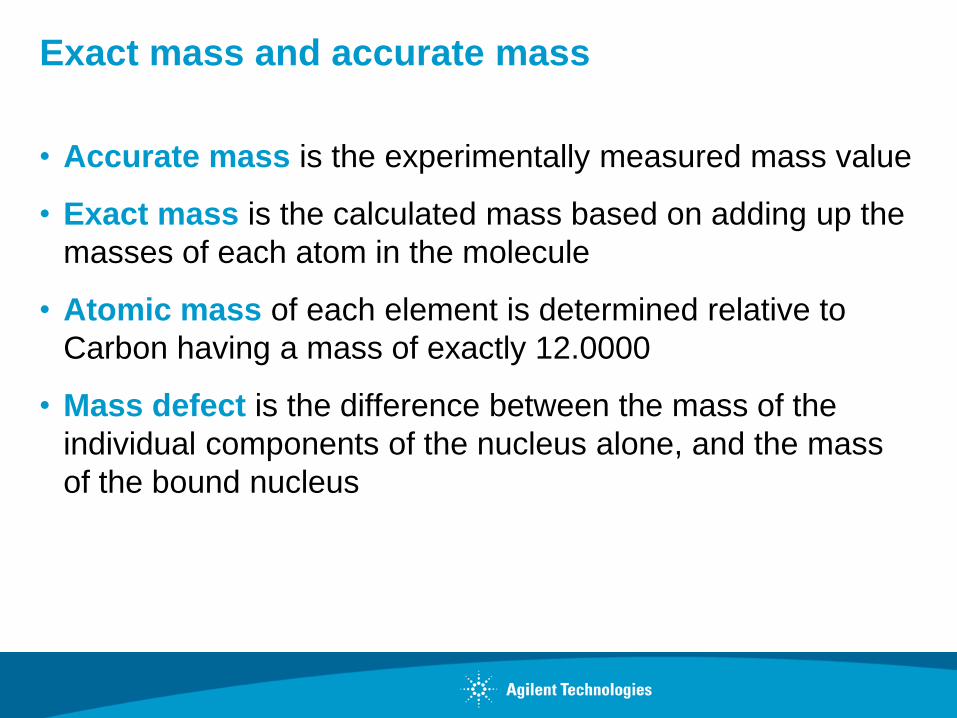
Exact mass and accurate mass
• Accurate mass is the experimentally measured mass value
• Exact mass is the calculated mass based on adding up the
masses of each atom in the molecule
• Atomic mass of each element is determined relative to
Carbon having a mass of exactly 12.0000
• Mass defect is the difference between the mass of the
individual components of the nucleus alone, and the mass
of the bound nucleus
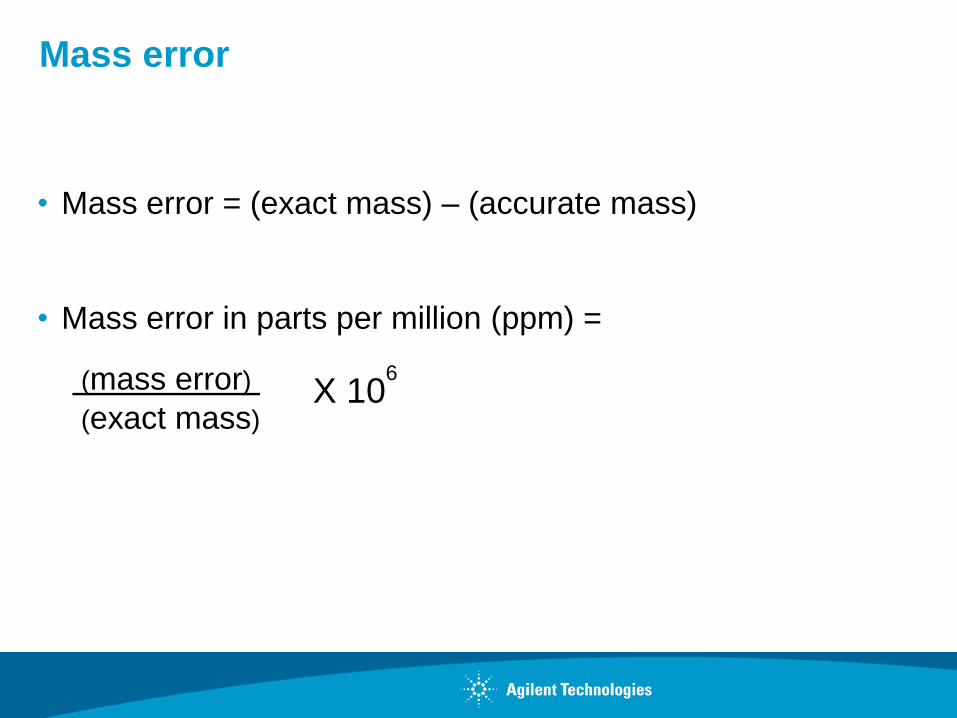
Mass error
• Mass error = (exact mass) – (accurate mass)
• Mass error in parts per million (ppm) =
(mass error) X 106
(exact mass)
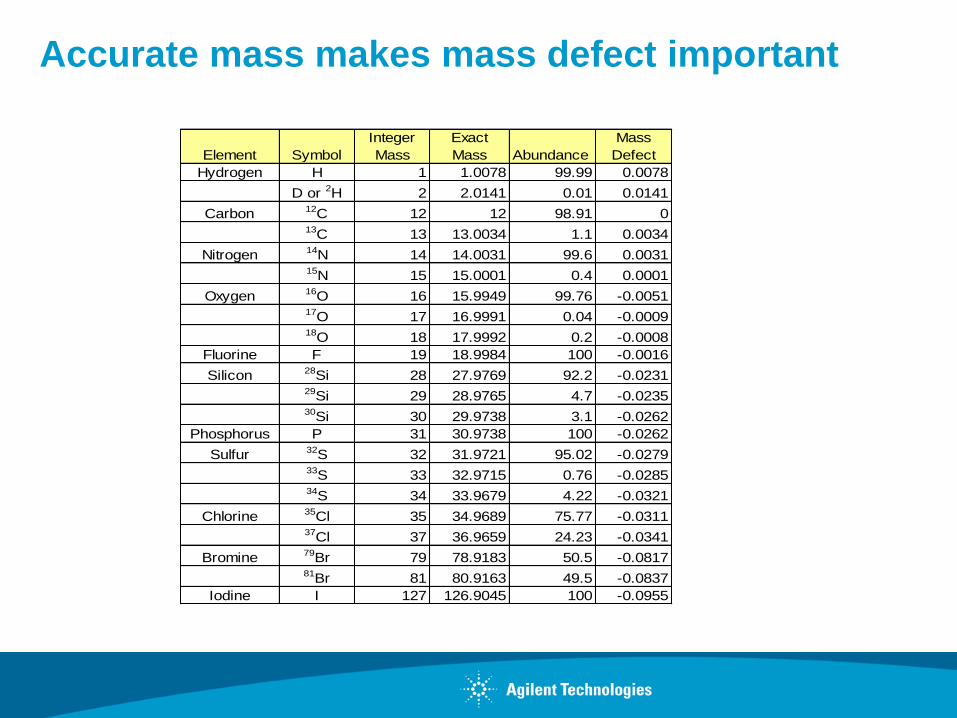
Accurate mass makes mass defect important
Hydrogen H 1 1.0078 99.99 0.0078
D or 2H 2 2.0141 0.01 0.0141
Carbon12
C 12 12 98.91 013
C 13 13.0034 1.1 0.0034
Nitrogen14
N 14 14.0031 99.6 0.003115
N 15 15.0001 0.4 0.0001
Oxygen16
O 16 15.9949 99.76 -0.005117
O 17 16.9991 0.04 -0.000918
O 18 17.9992 0.2 -0.0008
Fluorine F 19 18.9984 100 -0.0016
Silicon28
Si 28 27.9769 92.2 -0.023129
Si 29 28.9765 4.7 -0.023530
Si 30 29.9738 3.1 -0.0262
Phosphorus P 31 30.9738 100 -0.0262
Sulfur32
S 32 31.9721 95.02 -0.027933
S 33 32.9715 0.76 -0.028534
S 34 33.9679 4.22 -0.0321
Chlorine35
Cl 35 34.9689 75.77 -0.031137
Cl 37 36.9659 24.23 -0.0341
Bromine79
Br 79 78.9183 50.5 -0.081781
Br 81 80.9163 49.5 -0.0837
Iodine I 127 126.9045 100 -0.0955
Mass
DefectElement Symbol Abundance
Integer
Mass
Exact
Mass
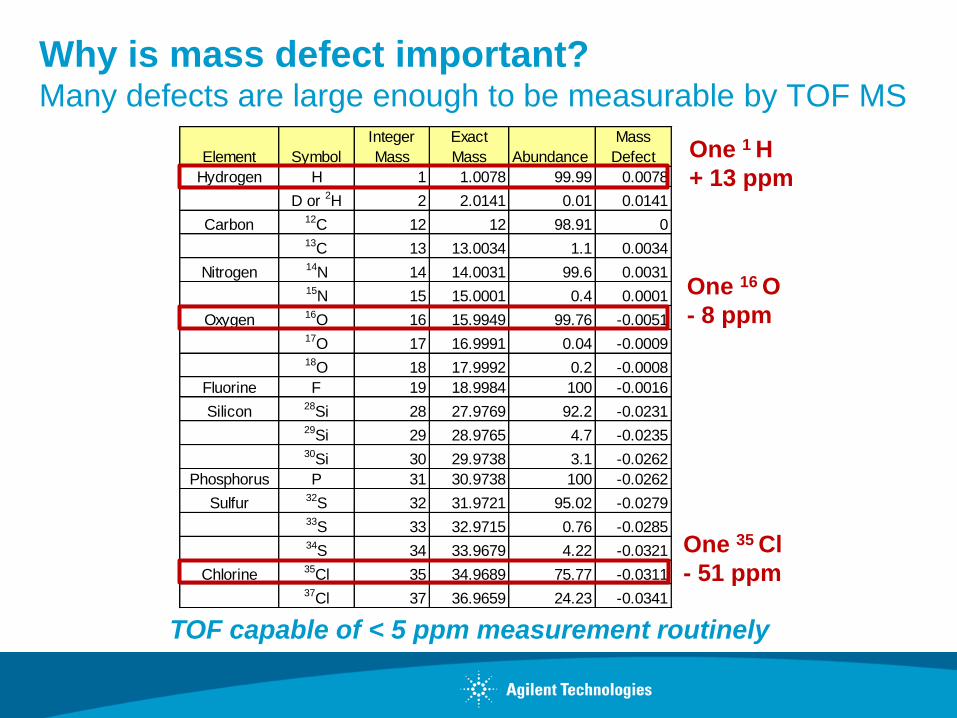
Why is mass defect important? Many defects are large enough to be measurable by TOF MS
One 16 O
- 8 ppm
One 35 Cl
- 51 ppm
One 1 H
+ 13 ppm Hydrogen H 1 1.0078 99.99 0.0078
D or 2H 2 2.0141 0.01 0.0141
Carbon12
C 12 12 98.91 013
C 13 13.0034 1.1 0.0034
Nitrogen14
N 14 14.0031 99.6 0.003115
N 15 15.0001 0.4 0.0001
Oxygen16
O 16 15.9949 99.76 -0.005117
O 17 16.9991 0.04 -0.000918
O 18 17.9992 0.2 -0.0008
Fluorine F 19 18.9984 100 -0.0016
Silicon28
Si 28 27.9769 92.2 -0.023129
Si 29 28.9765 4.7 -0.023530
Si 30 29.9738 3.1 -0.0262
Phosphorus P 31 30.9738 100 -0.0262
Sulfur32
S 32 31.9721 95.02 -0.027933
S 33 32.9715 0.76 -0.028534
S 34 33.9679 4.22 -0.0321
Chlorine35
Cl 35 34.9689 75.77 -0.031137
Cl 37 36.9659 24.23 -0.0341
Mass
DefectElement Symbol Abundance
Integer
Mass
Exact
Mass
TOF capable of < 5 ppm measurement routinely
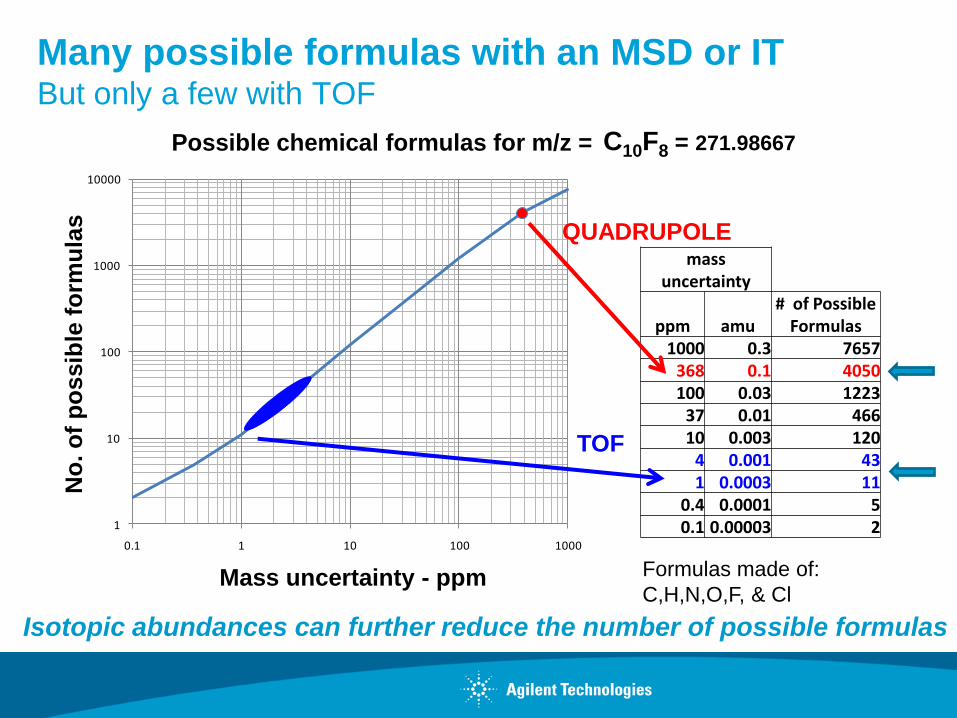
Many possible formulas with an MSD or IT But only a few with TOF
1
10
100
1000
10000
0.1 1 10 100 1000
# P
oss
ible
Ch
emic
al F
orm
ula
s
mass uncertainty, ppm
Possible Number of Chemical Formulas at m/z 272
Formulas made of:
C,H,N,O,F, & Cl
mass uncertainty
ppm amu # of Possible
Formulas 1000 0.3 7657
368 0.1 4050 100 0.03 1223
37 0.01 466 10 0.003 120
4 0.001 43 1 0.0003 11
0.4 0.0001 5 0.1 0.00003 2
C10F8 = 271.98667 Possible chemical formulas for m/z =
Mass uncertainty - ppm
No
. o
f p
os
sib
le f
orm
ula
s
Isotopic abundances can further reduce the number of possible formulas
QUADRUPOLE
TOF
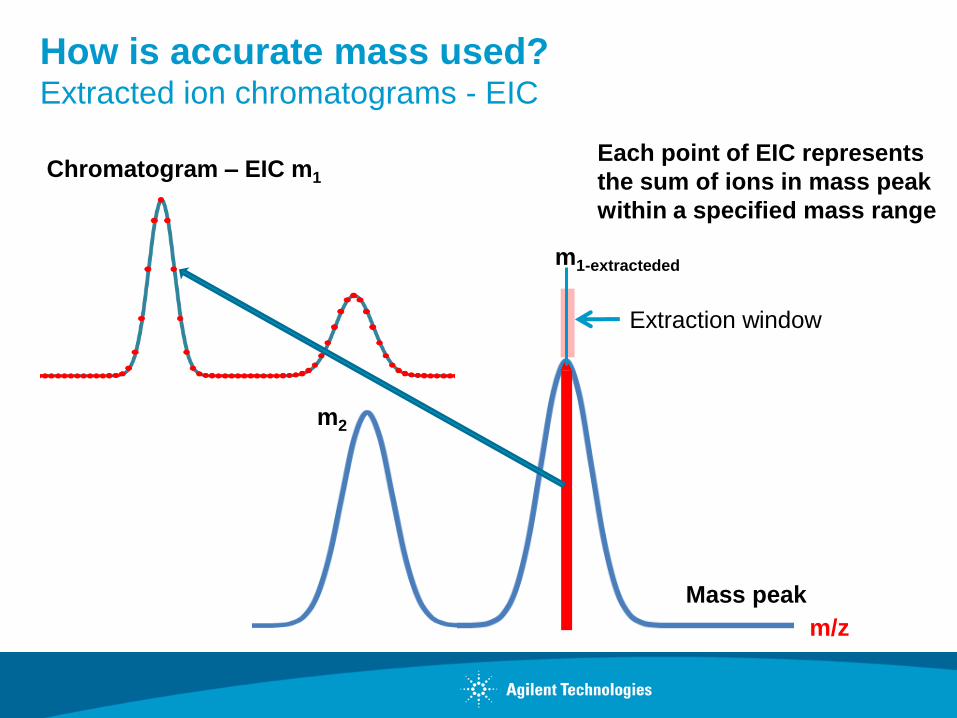
How is accurate mass used? Extracted ion chromatograms - EIC
Each point of EIC represents
the sum of ions in mass peak
within a specified mass range
Mass peak
m/z
m2
Chromatogram – EIC m1
m1-extracteded
Extraction window
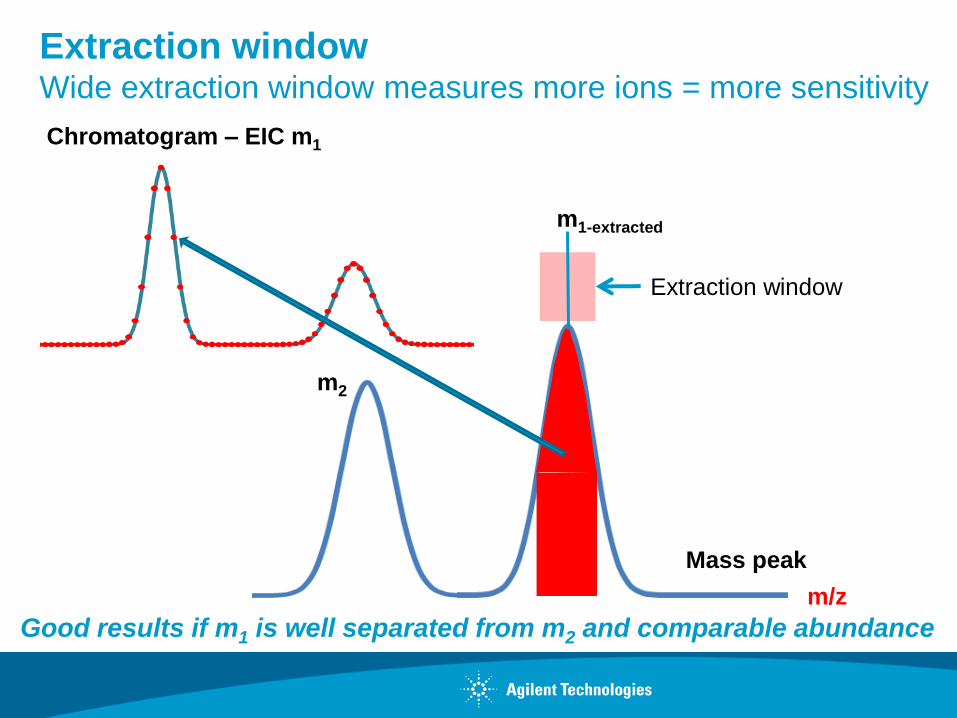
Extraction window Wide extraction window measures more ions = more sensitivity
Mass peak
Chromatogram – EIC m1
m/z
m2
Good results if m1 is well separated from m2 and comparable abundance
m1-extracted
Extraction window
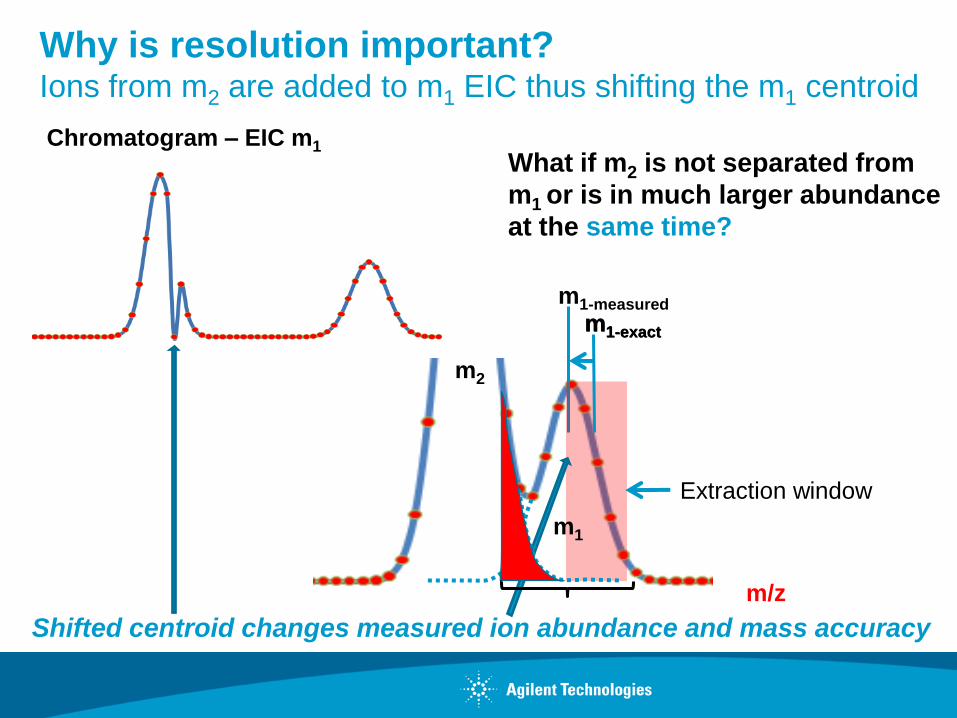
Why is resolution important? Ions from m2 are added to m1 EIC thus shifting the m1 centroid
m1-measured
m/z
m2
What if m2 is not separated from
m1 or is in much larger abundance
at the same time?
Shifted centroid changes measured ion abundance and mass accuracy
Extraction window
m1-exact
Chromatogram – EIC m1
m1-exact
m1
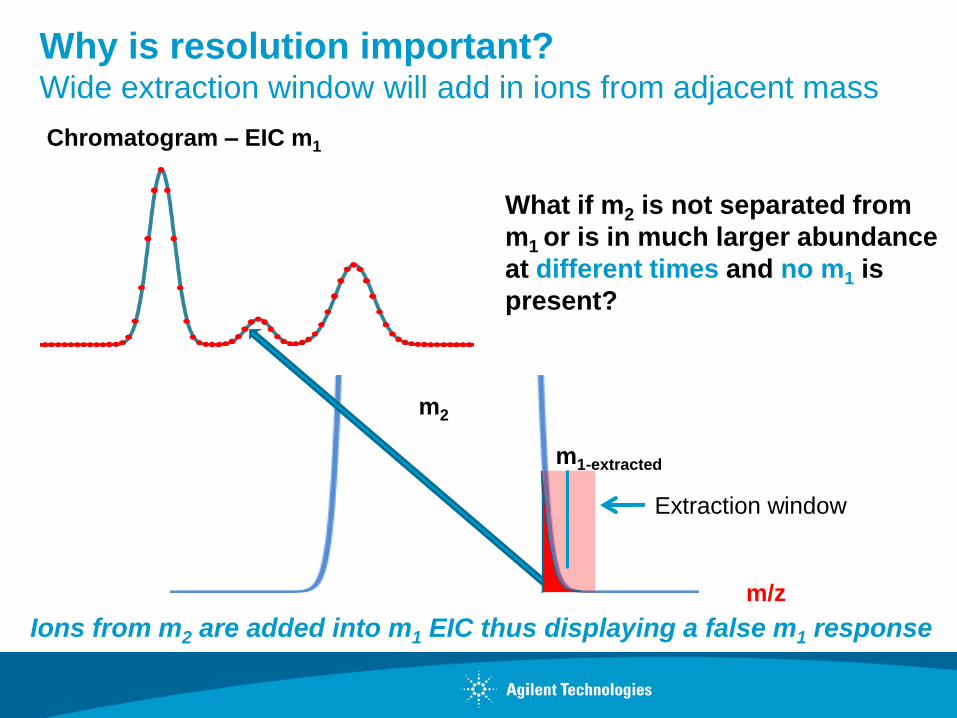
Why is resolution important? Wide extraction window will add in ions from adjacent mass
m/z
m2
What if m2 is not separated from
m1 or is in much larger abundance
at different times and no m1 is
present?
Ions from m2 are added into m1 EIC thus displaying a false m1 response
Chromatogram – EIC m1
Extraction window
m1-extracted
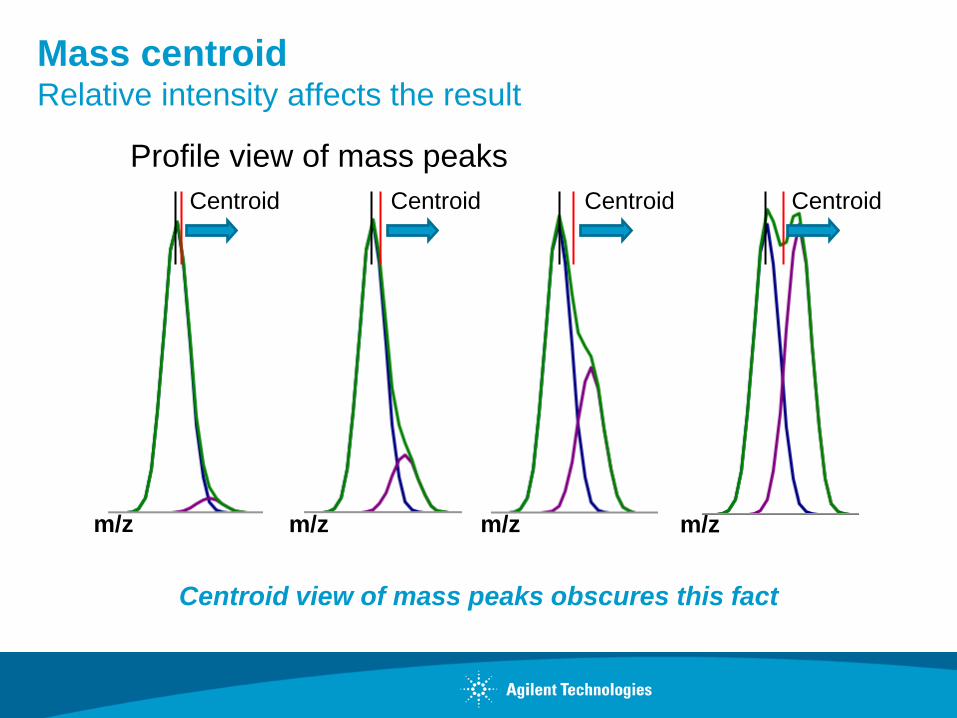
Mass centroid Relative intensity affects the result
Centroid view of mass peaks obscures this fact
m/z m/z m/z m/z
Profile view of mass peaks
Centroid Centroid Centroid Centroid
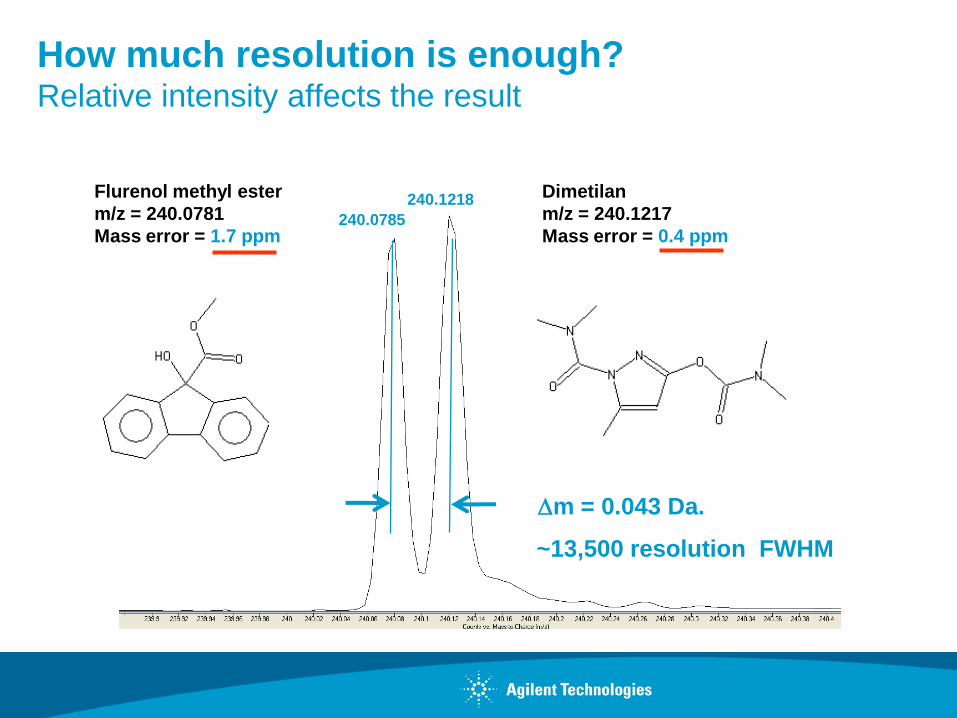
240.1218
240.0785
Flurenol methyl ester
m/z = 240.0781
Mass error = 1.7 ppm
Dimetilan
m/z = 240.1217
Mass error = 0.4 ppm
~13,500 resolution FWHM
How much resolution is enough? Relative intensity affects the result
Dm = 0.043 Da.
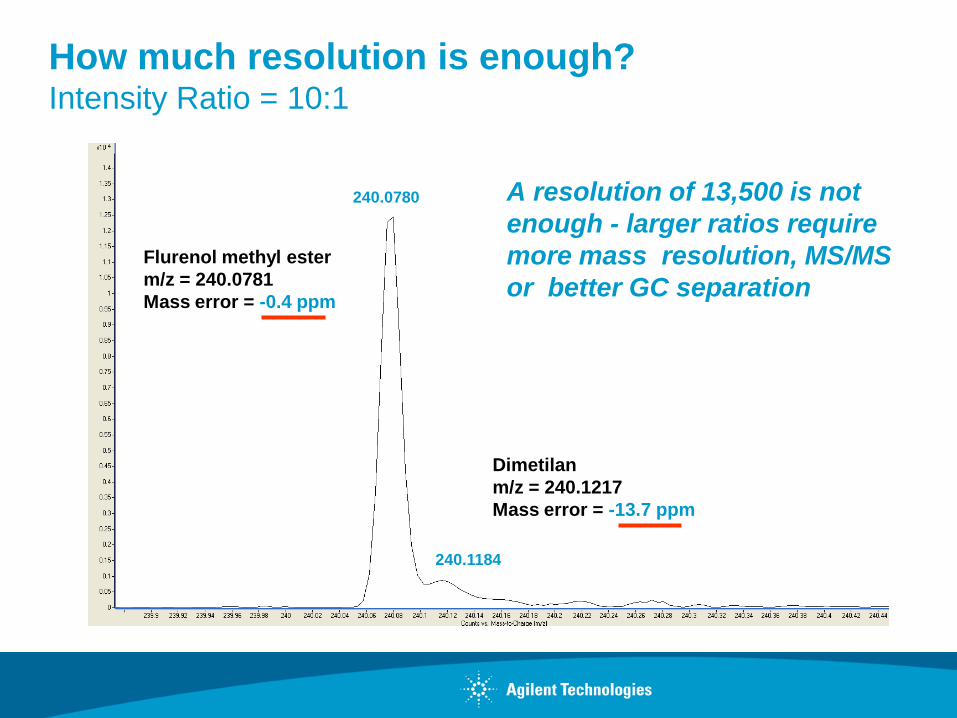
240.1184
240.0780
Flurenol methyl ester
m/z = 240.0781
Mass error = -0.4 ppm
Dimetilan
m/z = 240.1217
Mass error = -13.7 ppm
A resolution of 13,500 is not
enough - larger ratios require
more mass resolution, MS/MS
or better GC separation
How much resolution is enough? Intensity Ratio = 10:1
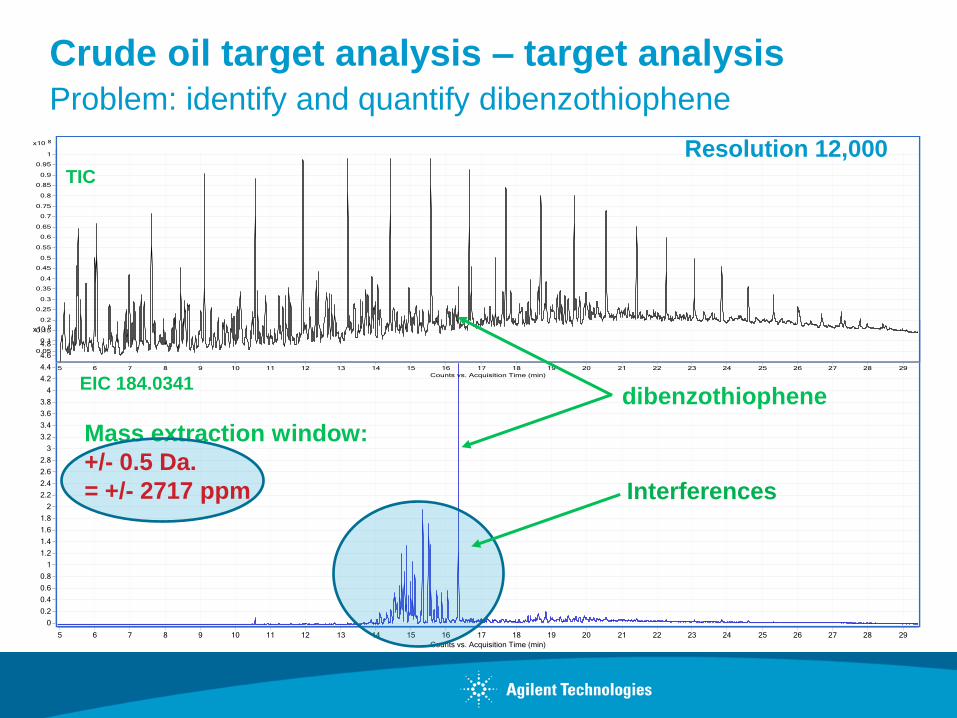
Crude oil target analysis – target analysis
Problem: identify and quantify dibenzothiophene
Interferences
TIC
Mass extraction window:
+/- 0.5 Da.
= +/- 2717 ppm
EIC 184.0341 dibenzothiophene
Resolution 12,000
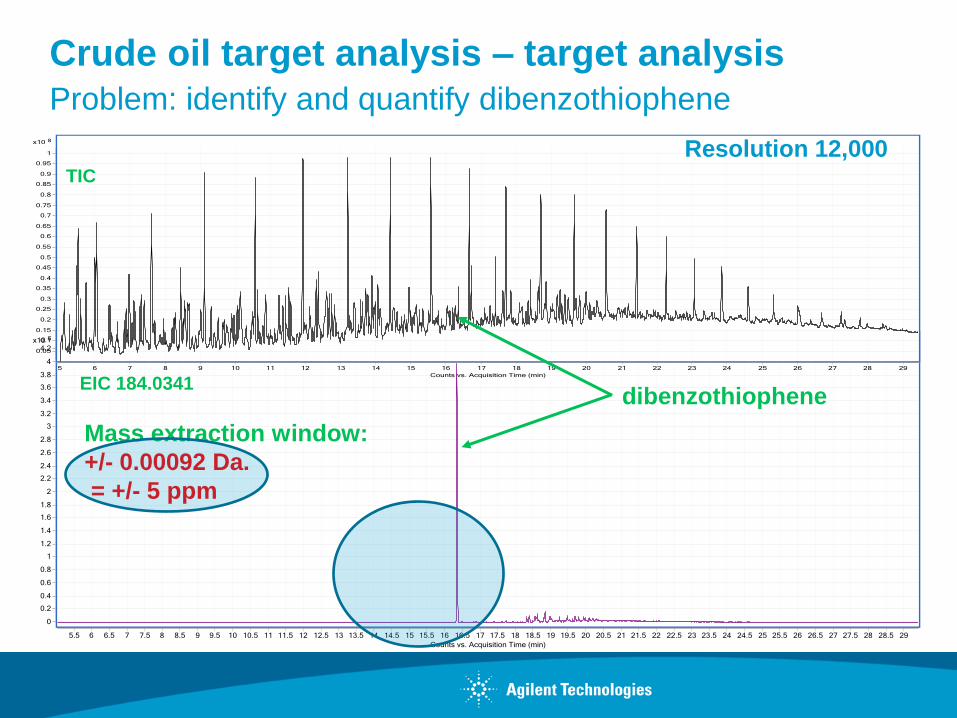
Mass extraction window:
+/- 0.00092 Da.
= +/- 5 ppm
EIC 184.0341 dibenzothiophene
TIC
Crude oil target analysis – target analysis
Problem: identify and quantify dibenzothiophene
Resolution 12,000
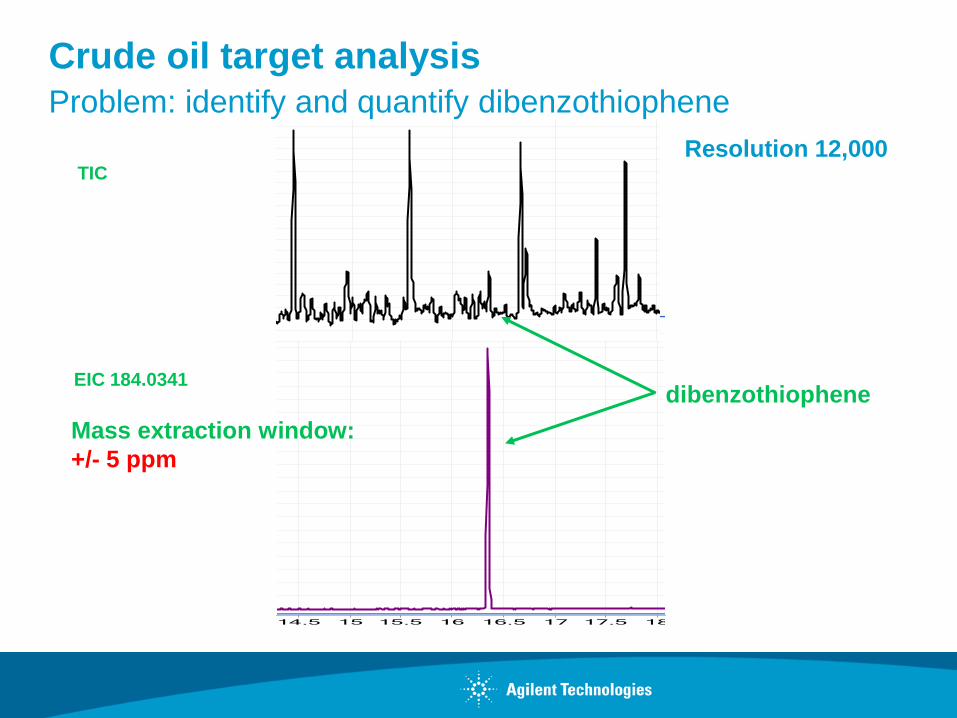
dibenzothiophene
Mass extraction window:
+/- 5 ppm
EIC 184.0341
TIC
Crude oil target analysis
Problem: identify and quantify dibenzothiophene
Resolution 12,000
Summary
• Mass accuracy (MA) is a valuable tool for target
quantification and confirmation
• High resolution (HR) ensures mass accuracy over sample
range – good test for adequate mass resolution
• How much resolution is required depends on sample,
matrix, and their relative abundance
• TOF mass accuracy & high resolution is an important tool
for solving complex analytical problems
Thank you for your attention