Embed Size (px)
Citation preview
New MALDI-TOF MS with very high resolving power and mass accuracy
Presented at ASMSJune 3,2008
Marvin Vestal and Kevin Hayden Virgin Instruments Corp.
Sudbury, MA

Objectives
• Determine optimum design parameters for a high-performance bench-top MALDI-TOF– Resolving power and mass accuracy– Sensitivity and dynamic range– High throughput– Efficient sample utilization– Simple and reliable– Low cost
• Build prototype instrument and compare experimental results with theoretical predictions

Common Features of Virgin MALDI TOF
• Simplified sample loading with super microplate format (102x108 mm)
• Benchtop cabinet – 1.75m high x 0.5 m wide x 0.7 m deep– 100 kg max weight
• 5 kHz laser, up to 100 spectra/sec• Fully automated, no operator expertise
required– No joystick, no camera
• 24/7 operation with minimal preventative maintenance
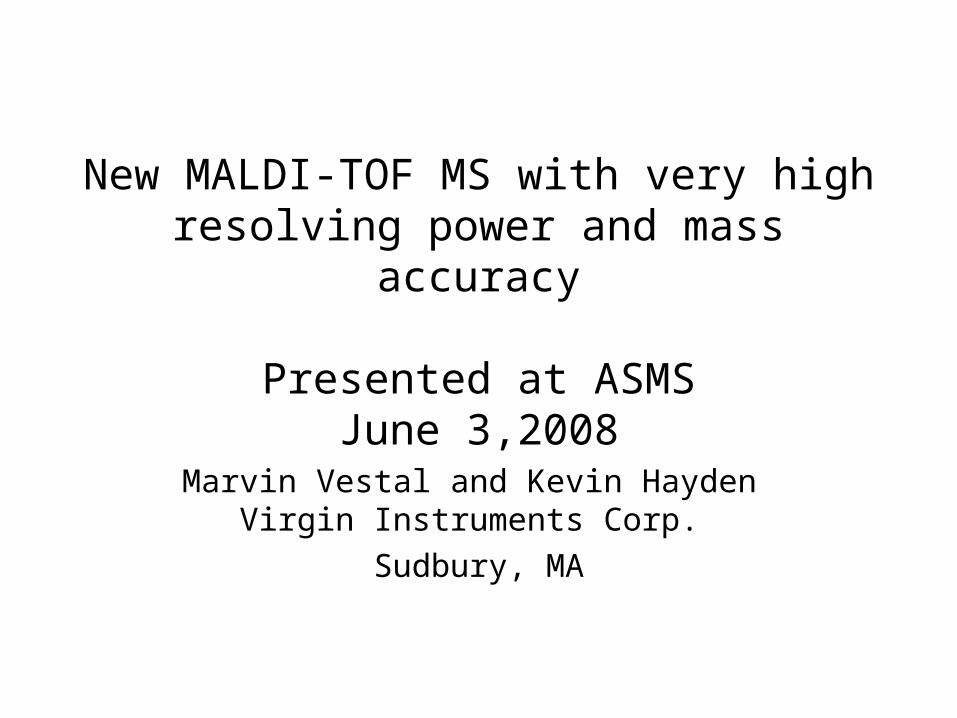
V
d0
Sample plate
Extractionelectrode
0
V1
V2
d3
d40
d4
Drift tube
velocityfocus
Dm
2-stage reflector
D
Potential diagram for high-resolution TOF with single-field source and two-field reflector. The field-free distance D is the distance from the source to the mirror plus the distance from the mirror to the detector (not shown).
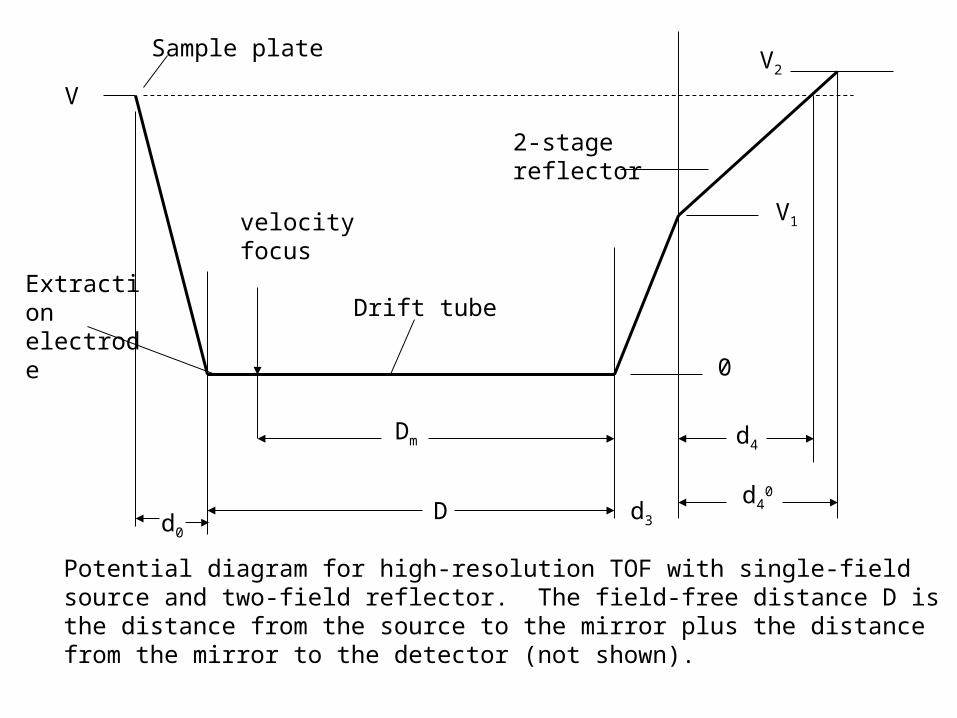
Instrument Parameters for Reflecting Analyzer(single-field source and two-field mirror)
De=3200, d0=6, D=2264, d3=114.2, d40=127.7 all in mm
V=8.56, V1=6.31, V2=9.23 all in kVt=1.5 nsec (0.5 nsec bins, 1 nsec single ion pulse width) Focus mass m*= 3 kDaDv=6d0 = 36 mm, vn (for m*)=0.0235 mm/nsecTime lag t=d0/vn = 250 nsecK=2d0/(Dv-Ds)=0.5
Initial Conditions for MALDI (typical)v0=400 m/sec, x=0.01 mm
Trajectory error and voltage error assumed to be small
References• M. L. Vestal and P. Juhasz, “Resolution and Mass Accuracy in
Matrix-Assisted Laser Desorption Time-of-Flight Mass Spectrometry”, J. Am. Soc. Mass Spectrom. 9, 892-911 (1998).
• M. L. Vestal and K. Hayden, “High-performance MALDI-TOF mass spectrometry for proteomics”, Int. J. Mass Spectrometry 268, 83-92 (2007).
• M. L. Vestal and K. Hayden, “High-performance MALDI-TOF Mass Spectrometry”, paper TOFam08:15 presented at 55th ASMS Conference on Mass Spectrometry and Allied Topics, Indianapolis, June 3-7, 2007.
• S. J. Hattan and M. L. Vestal, “Novel 3-D sample plate using monolithic capture media in collimated-hole structures for interfacing high capacity separations with MALDI-TOF”, poster TBP-060 presented at 56th ASMS Conference on Mass Spectrometry and Allied Topics, Indianapolis, June 3, 2008.
•
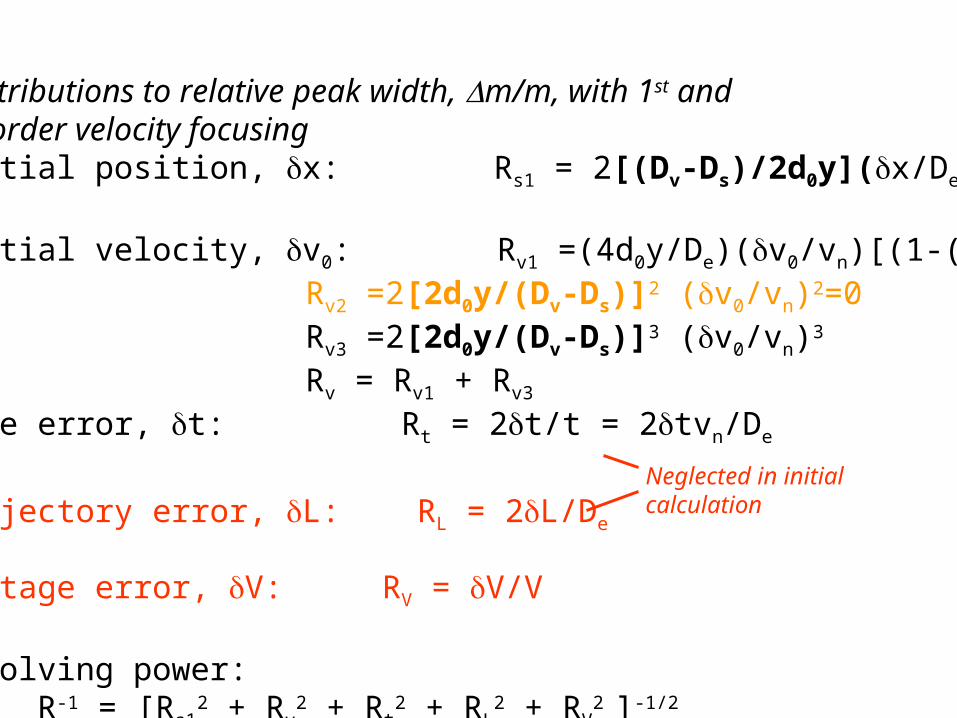
Contributions to relative peak width, m/m, with 1st and2nd order velocity focusingInitial position, x: Rs1 = 2[(Dv-Ds)/2d0y](x/De)
Initial velocity, v0: Rv1 =(4d0y/De)(v0/vn)[(1-(m/m*)1/2] Rv2 =2[2d0y/(Dv-Ds)]2 (v0/vn)2=0 Rv3 =2[2d0y/(Dv-Ds)]3 (v0/vn)3 Rv = Rv1 + Rv3
Time error, t: Rt = 2t/t = 2tvn/De
Trajectory error, L: RL = 2L/De
Voltage error, V: RV = V/V
Resolving power:R-1 = [Rs1
2 + Rv2 + Rt
2 + RL2 + RV
2 ]-1/2
Neglected in initialcalculation

0
20000
40000
60000
80000
100000
120000
0 1 2 3 4 5 6
0 0.5 1 1.5 2
m/z (kDa) V=9 kV
m/z (kDa) V=3 kV
4 3
2 1
ResolvingPower
4 GS/s 2 GS/s
2 GS/s
4 GS/s
Calculated resolving power as function of m/z, curve 1 corresponds to experimental instrument
3.2 m
6.4 m

\\Domainserver\public\Shared Spectra\minitof\MiniTof_AutoSave-2007_05_22_16_21\MiniTof_AutoSave-000000001-0105-2007_05_22_16_21_56.427-(3687.025,8.098)-@31077,14847.dataXML
496.2443
508.2488
545.3450
565.2775
572.2940
573.3050
592.1041
658.3223
686.3764
689.3639
712.3753
733.4203
746.3996
927.4999
928.4904
929.5121
984.5116
985.5207
1121.4562
1149.4662
1163.6183
1284.7146
1306.6880
1479.7937
1480.8139
1536.8329
1537.8164
1567.7525
1881.9388
60.0000 80.0000 100.0000 120.0000
0.20
0.40
0.60
\\Domainserver\public\Shared Spectra\minitof\MiniTof_AutoSave-2007_05_22_16_21\MiniTof_AutoSave-000000001-0105-2007_05_22_16_21_56.427-(3687.025,8.098)-@31077,14847.dataXML
1479.7937
102.4000 102.5000 102.6000
0.10
0.20
0.30\\Domainserver\public\Shared Spectra\minitof\MiniTof_AutoSave-2007_05_22_16_21\MiniTof_AutoSave-000000001-0105-2007_05_22_16_21_56.427-(3687.025,8.098)-@31077,14847.dataXML
689.3639
69.9000 70.0000
0.10
0.20
0.30
0.40
11,60013,000BSA digest
Resolution is 40% ofcalculated
Spectrum from original version
10000
11000
12000
13000
14000
15000
16000
17000
400 800 1200 1600 2000
m/z (Da)
Res
olvi
ng P
ower
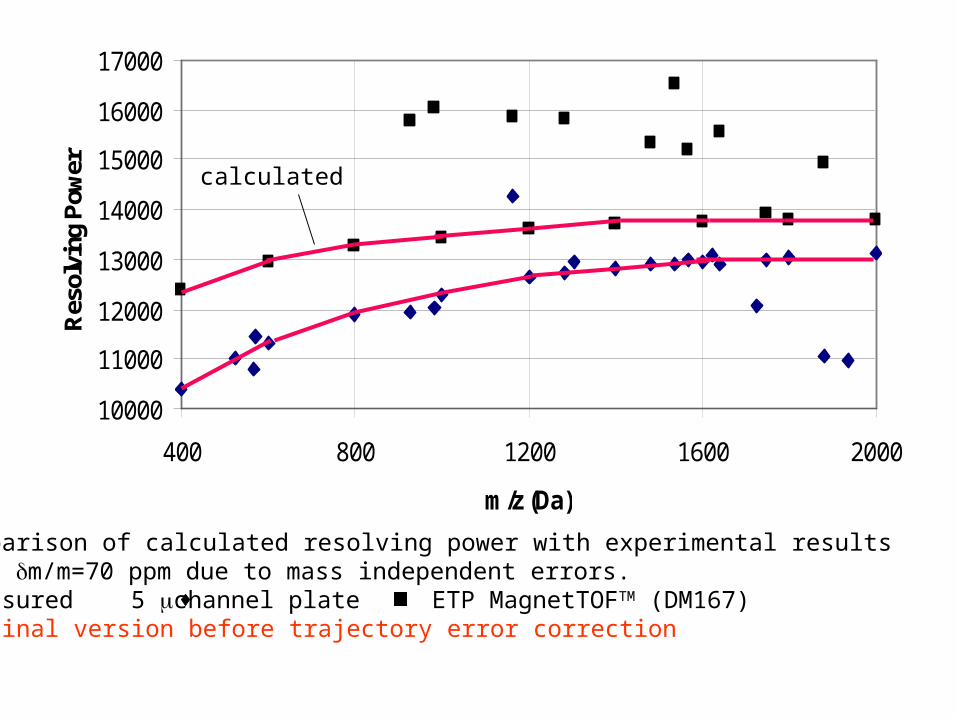
Comparison of calculated resolving power with experimental resultsWith m/m=70 ppm due to mass independent errors. Measured 5 channel plate ETP MagnetTOFTM (DM167)Original version before trajectory error correction
calculated

Changes to correct mass independent errors
• Add voltage regulator at input to mirror HV supplies (removes low frequency noise)
• Correct trajectory error due to ion deflector
• Use faster detector (0.5 ns) – ETP DM167 in place of 5 m dual channel plate
• Use faster digitizer – 0.5 ns bins>0.25 ns bins

11
2
+ _
Dd
mirror
detector
Ion source
d
2
2 2
2
Dd
mirror
detector
Ion source
d
Ray diagrams indicating source of trajectory error
1 = 2
+ -
1
2
1+2
1+2
2
Dd
Ion source
detector
mirror
1 = 2
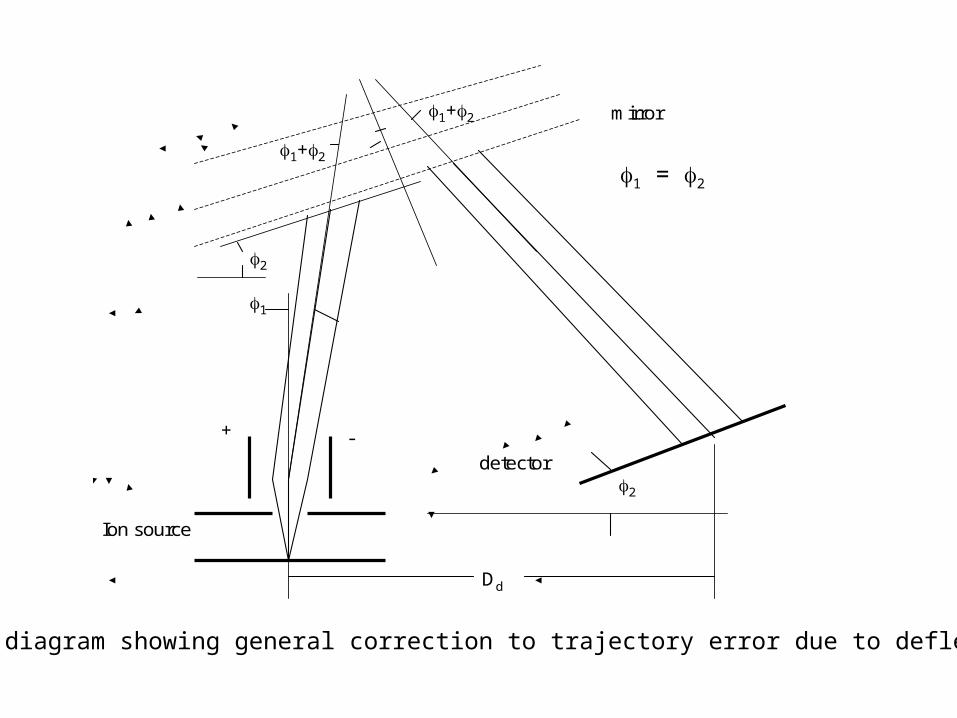
Ray diagram showing general correction to trajectory error due to deflection

Low mass gate
Laser beam
4.60
0.40 0.40
0.80
0.80
Laser mirrorIon mirror
detector
Ray diagram of final version employed in the corrected version of theexperimental analyzer
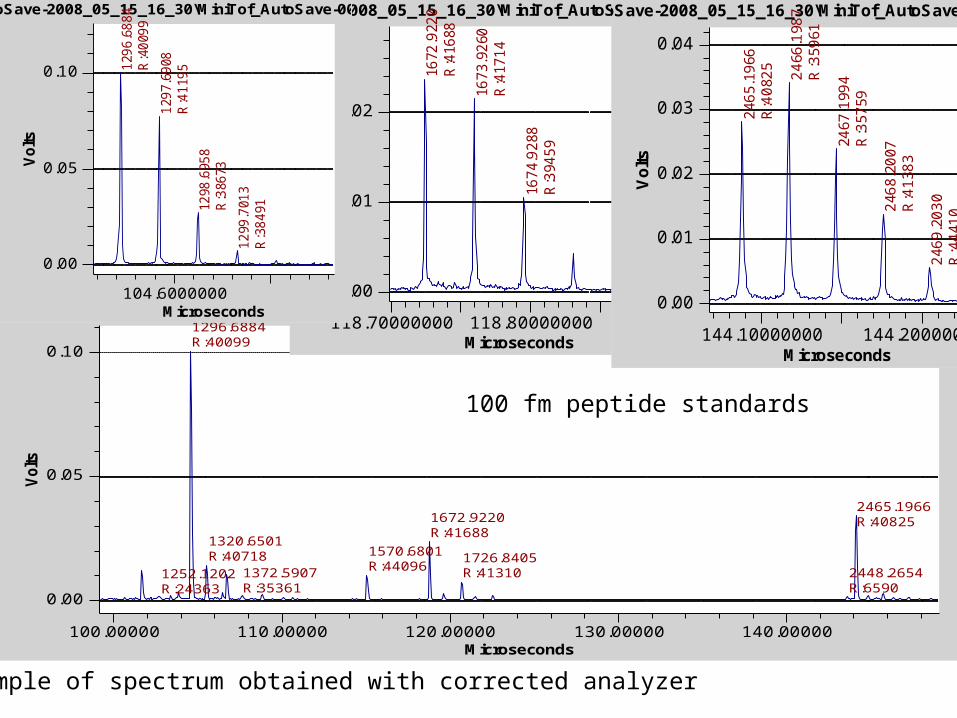
\\domainserver\public\Shared Spectra\stevenew\MiniTof_AutoSave-2008_05_15_16_30\MiniTof_AutoSave-000007219-0360-2008_05_15_16_31_49.921-100 femto.mzml#0
1252.1202R:24363
1296.6884R:40099
1320.6501R:40718
1372.5907R:35361
1570.6801R:44096
1672.9220R:41688
1726.8405R:41310 2448.2654
R:6590
2465.1966R:40825
100.00000 110.00000 120.00000 130.00000 140.00000
0.00
0.05
0.10
Microseconds
Volts
\\domainserver\public\Shared Spectra\stevenew\MiniTof_AutoSave-2008_05_15_16_30\MiniTof_AutoSave-000007219-0360-2008_05_15_16_31_49.921-100 femto.mzml#0
1672.9220
R:41688
1673.9260
R:41714
1674.9288
R:39459
118.70000000 118.80000000
0.00
0.01
0.02
MicrosecondsVolts
\\domainserver\public\Shared Spectra\stevenew\MiniTof_AutoSave-2008_05_15_16_30\MiniTof_AutoSave-000007219-0360-2008_05_15_16_31_49.921-100 femto.mzml#0
2465.1966
R:40825
2466.1987
R:35961
2467.1994
R:35759
2468.2007
R:41383
2469.2030
R:44410
144.10000000 144.20000000
0.00
0.01
0.02
0.03
0.04
Microseconds
Volts
\\domainserver\public\Shared Spectra\stevenew\MiniTof_AutoSave-2008_05_15_16_30\MiniTof_AutoSave-000007219-0360-2008_05_15_16_31_49.921-100 femto.mzml#0
1296.6884
R:40099
1297.6908
R:41195
1298.6958
R:38673
1299.7013
R:38491
104.6000000
0.00
0.05
0.10
Microseconds
Volts
100 fm peptide standards
Example of spectrum obtained with corrected analyzer

\\domainserver\public\Shared Spectra\stevenew\MiniTof_AutoSave-2008_04_09_18_06\MiniTof_AutoSave-000005332-0093-2008_04_09_18_07_00.631-.mzml#35
733.4155
R:34222
835.0562
R:24141
918.9307
R:29707
927.4924
R:28012
1034.4701
R:35004
1121.4735
R:34571
1167.4780
R:36461
1283.7135
R:37578
1305.7020
R:34480
1419.6942
R:29470
1479.7953
R:35719
1511.8443
R:39338
1633.8930
R:18207
1639.9416
R:42237
1749.6712
R:37912
1880.9256
R:51427
2465.1983
R:57252
80.00000 100.00000 120.00000 140.00000
0.00
0.05
0.10
Microseconds
Volts
\\domainserver\public\Shared Spectra\stevenew\MiniTof_AutoSave-2008_04_09_18_06\MiniTof_AutoSave-000005332-0093-2008_04_09_18_07_00.631-.mzml#35
246
5.1
983
R:5
7252 24
66.2
026
R:4
5350
246
7.2
050
R:3
924
1
2468
.212
1R:5
8763
2469
.213
8R
:49685
144.05069677 144.10069677 144.15069677
0.00
0.01
0.02
0.03
Microseconds
Vo
lts
\\domainserver\public\Shared Spectra\stevenew\MiniTof_AutoSave-2008_04_09_18_06\MiniTof_AutoSave-000005332-0093-2008_04_09_18_07_00.631-.mzml#35
188
0.92
56R:5
142
7
1881
.928
4R:5
2904
188
2.92
59
R:4
839
3
125.85000000 125.90000000 125.95000000
0.000
0.005
0.010
Microseconds
Vo
lts
\\domainserver\public\Shared Spectra\stevenew\MiniTof_AutoSave-2008_04_09_18_06\MiniTof_AutoSave-000005332-0093-2008_04_09_18_07_00.631-.mzml#35
1639
.941
6R:42237
1640
.942
0R:453
25
1641
.943
3R:33861
1642.94
15R:420
72
117.50805559 117.60805559
0.00
0.02
0.04
0.06
Microseconds
Volts
Example of spectrum obtained with corrected analyzer
BSA digest
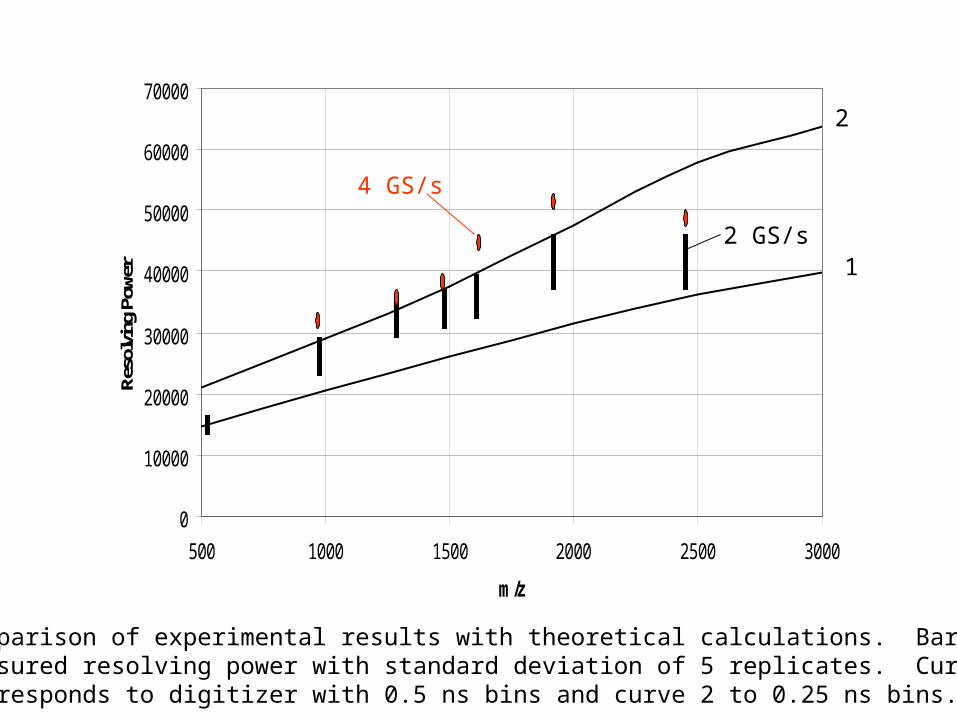
0
10000
20000
30000
40000
50000
60000
70000
500 1000 1500 2000 2500 3000
m/z
Reso
lvin
g Po
wer 1
2
Comparison of experimental results with theoretical calculations. Bars aremeasured resolving power with standard deviation of 5 replicates. Curve 1 corresponds to digitizer with 0.5 ns bins and curve 2 to 0.25 ns bins.
4 GS/s
2 GS/s
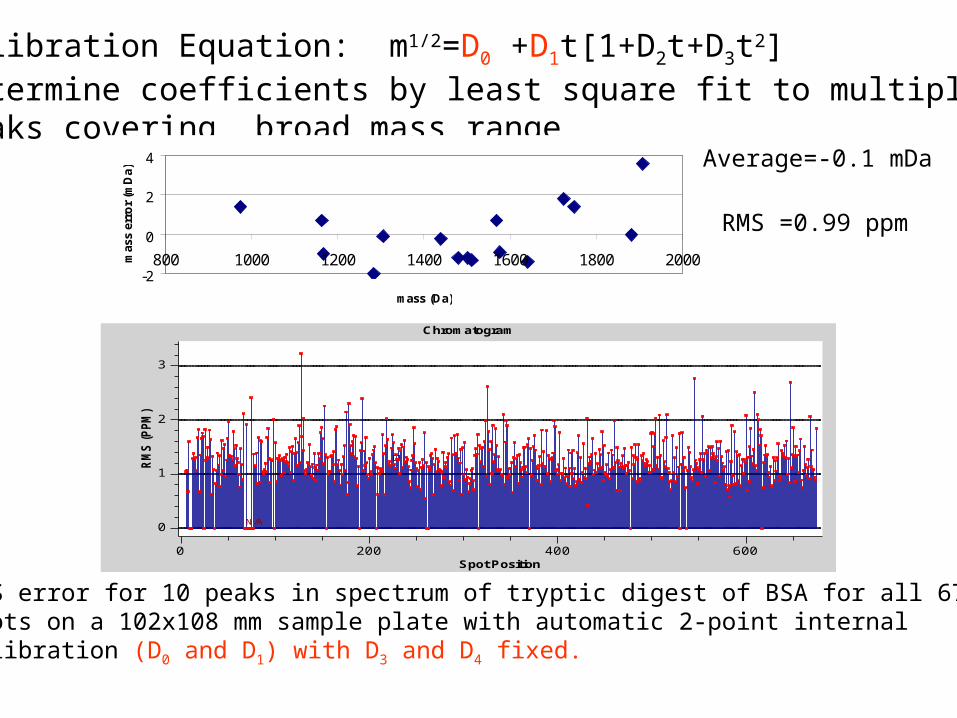
Chromatogram
N/A
0 200 400 600
0
1
2
3
Spot Position
RMS (PPM
)
RMS error for 10 peaks in spectrum of tryptic digest of BSA for all 675spots on a 102x108 mm sample plate with automatic 2-point internal Calibration (D0 and D1) with D3 and D4 fixed.
Calibration Equation: m1/2=D0 +D1t[1+D2t+D3t2]Determine coefficients by least square fit to multiplePeaks covering broad mass range
-2
0
2
4
800 1000 1200 1400 1600 1800 2000
mass (Da)
mas
s er
ror
(mD
a)
Average=-0.1 mDa
RMS =0.99 ppm

Serial Dilution Experiment
Peptide Standards
Equimolar mixture diluted in 4-hydroxy--cyanocinnamic acid from 1 picomole/L to 1 attomole/L
Automated acquisition and calibration averaging 2000 laser shots/spectrum at 1 kHz
No data processing
MH+ No.Angiotensin Fragment 1-7 899.47 1 des-Pro2 Bradykinin 963.51 2Angiotensin II Acetate 1046.54 3Angiotensin I 1296.69 4Neurotensin 1672.92 5ACTH (18-39) 2465.20 6Glu-1 Fibrinopeptide B 1570.68 7(<10% pure)
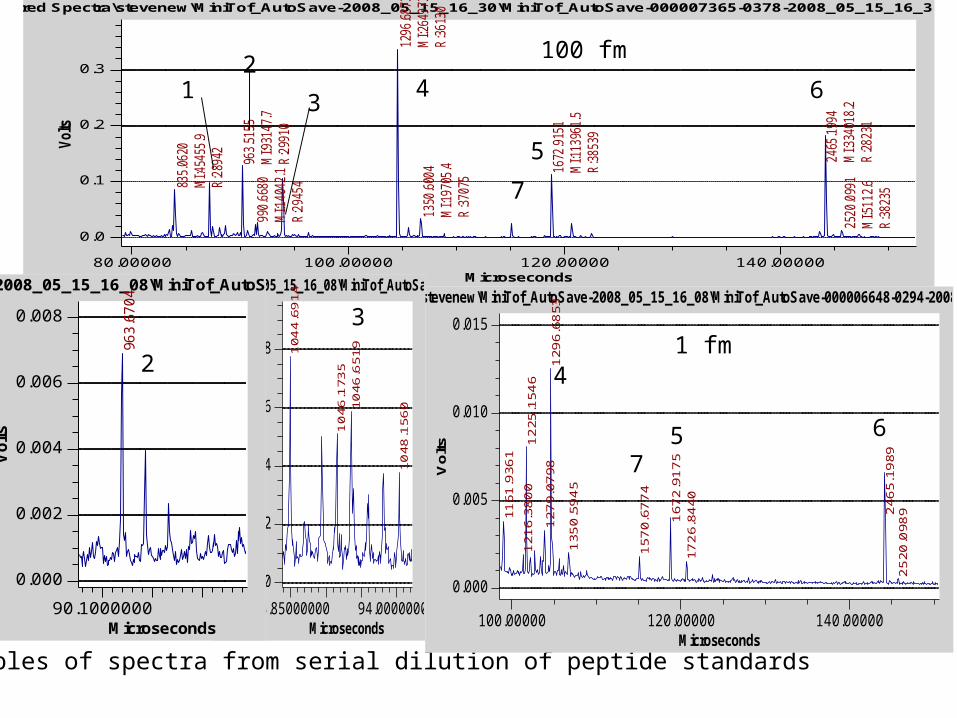
\\domainserver\public\Shared Spectra\stevenew\MiniTof_AutoSave-2008_05_15_16_30\MiniTof_AutoSave-000007365-0378-2008_05_15_16_36_38.620-100 femto.mzml#3
835.0620
MI:45455.9
R:28942 963.5155
MI:93147.7
R:29910
990.6680
MI:14042.1
R:29454
1296.6873
MI:264973.9
R:36130
1350.6004
MI:19705.4
R:37075
1672.9151
MI:113961.5
R:38539
2465.1994
MI:334018.2
R:28231
2520.0991
MI:5112.6
R:38235
80.00000 100.00000 120.00000 140.00000
0.0
0.1
0.2
0.3
Microseconds
Volts
100 fm
1 fm
Examples of spectra from serial dilution of peptide standards
12
3
5
4 6
\\domainserver\public\Shared Spectra\stevenew\MiniTof_AutoSave-2008_05_15_16_08\MiniTof_AutoSave-000006648-0294-2008_05_15_16_12_59.074-1 femto.mzml#1
1161
.936
1121
6.38
00
1225
.154
6127
9.07
98129
6.68
53135
0.5945
157
0.67
74
167
2.9175
1726.84
40
246
5.19
892520
.098
9
100.00000 120.00000 140.00000
0.000
0.005
0.010
0.015
Microseconds
Vo
lts
\\domainserver\public\Shared Spectra\stevenew\MiniTof_AutoSave-2008_05_15_16_08\MiniTof_AutoSave-000006648-0294-2008_05_15_16_12_59.074-1 femto.mzml#1104
4.6914
1046
.173
510
46.651
9
1048
.156
0
93.85000000 94.00000000
0.000
0.002
0.004
0.006
0.008
Microseconds
Vo
lts
\\domainserver\public\Shared Spectra\stevenew\MiniTof_AutoSave-2008_05_15_16_08\MiniTof_AutoSave-000006648-0294-2008_05_15_16_12_59.074-1 femto.mzml#1
963.6704
90.1000000
0.000
0.002
0.004
0.006
0.008
Microseconds
Volts
1 fm4
5 6
3
2
7
7
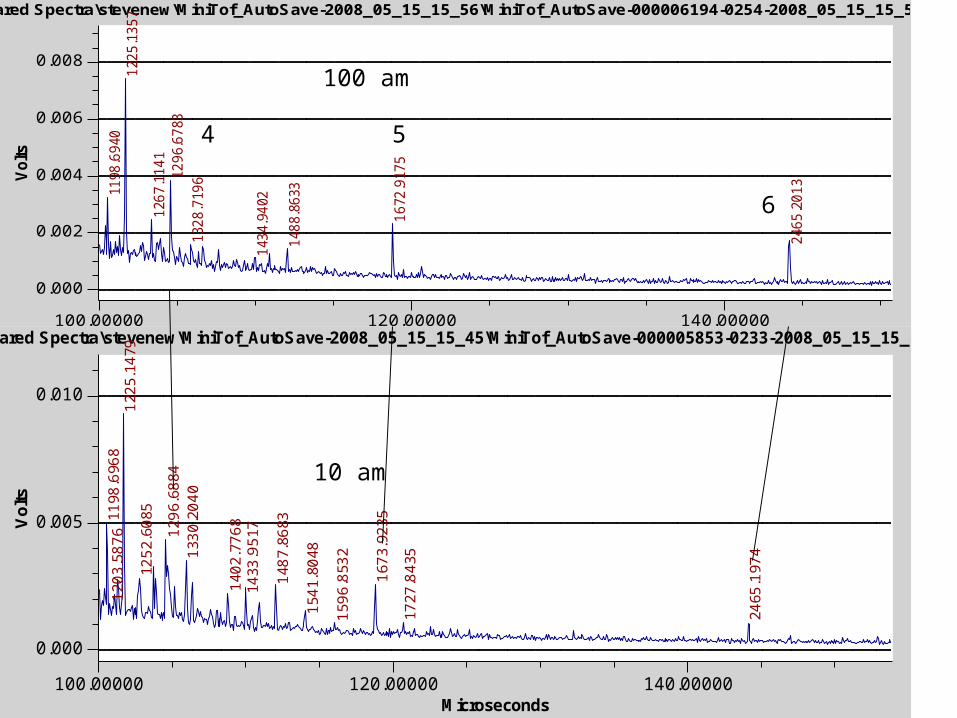
\\domainserver\public\Shared Spectra\stevenew\MiniTof_AutoSave-2008_05_15_15_56\MiniTof_AutoSave-000006194-0254-2008_05_15_15_58_01.268-100 atto.mzml#0
1198.6940
1225.1357
1267.1141
1296.6783
1328.7196
1434.9402
1488.8633
1672.9175
2465.2013
100.00000 120.00000 140.00000
0.000
0.002
0.004
0.006
0.008
Microseconds
Volts
100 am
\\domainserver\public\Shared Spectra\stevenew\MiniTof_AutoSave-2008_05_15_15_45\MiniTof_AutoSave-000005853-0233-2008_05_15_15_46_46.919-10 atto.mzml#1
1198.6968
1203.5876
1225.1479
1252.6085
1296.6884
1330.2040
1402.7768
1433.9517
1487.8683
1541.8048
1596.8532
1673.9235
1727.8435
2465.1974
100.00000 120.00000 140.00000
0.000
0.005
0.010
Microseconds
Volts
10 am
4 5
6

\\domainserver\public\Shared Spectra\stevenew\MiniTof_AutoSave-2008_05_15_15_34\MiniTof_AutoSave-000005714-0218-2008_05_15_15_42_12.030-1 atto.mzml#2
1250.1104
1297.6997
1301.0323
1351.9429
1456.1489
1534.9803
1613.8237
1672.9035
2465.2050
110.00000 120.00000 130.00000 140.00000
0.000
0.002
0.004
0.006
Microseconds
Volts
\\domainserver\public\Shared Spectra\stevenew\MiniTof_AutoSave-2008_05_15_15_34\MiniTof_AutoSave-000005714-0218-2008_05_15_15_42_12.030-1 atto.mzml#2
1292.02
38
129
6.69
32129
8.04
19
130
1.032
3
1304
.022
5
104.4000000 104.8000000
0.000
0.002
0.004
0.006
Microseconds
Volts
\\domainserver\public\Shared Spectra\stevenew\MiniTof_AutoSave-2008_05_15_15_34\MiniTof_AutoSave-000005714-0218-2008_05_15_15_42_12.030-1 atto.mzml#2
1672.9035
1673.9124
118.7000000 118.9000000
0.0000
0.0005
0.0010
MicrosecondsV
olts
\\domainserver\public\Shared Spectra\stevenew\MiniTof_AutoSave-2008_05_15_15_34\MiniTof_AutoSave-000005714-0218-2008_05_15_15_42_12.030-1 atto.mzml#2
246
5.20
50246
6.17
94
144.1000000 144.3000000
0.0000
0.0002
0.0004
0.0006
Microseconds
Volts
4
65
1 attomole
Threshold 100 ions/peak
5 6
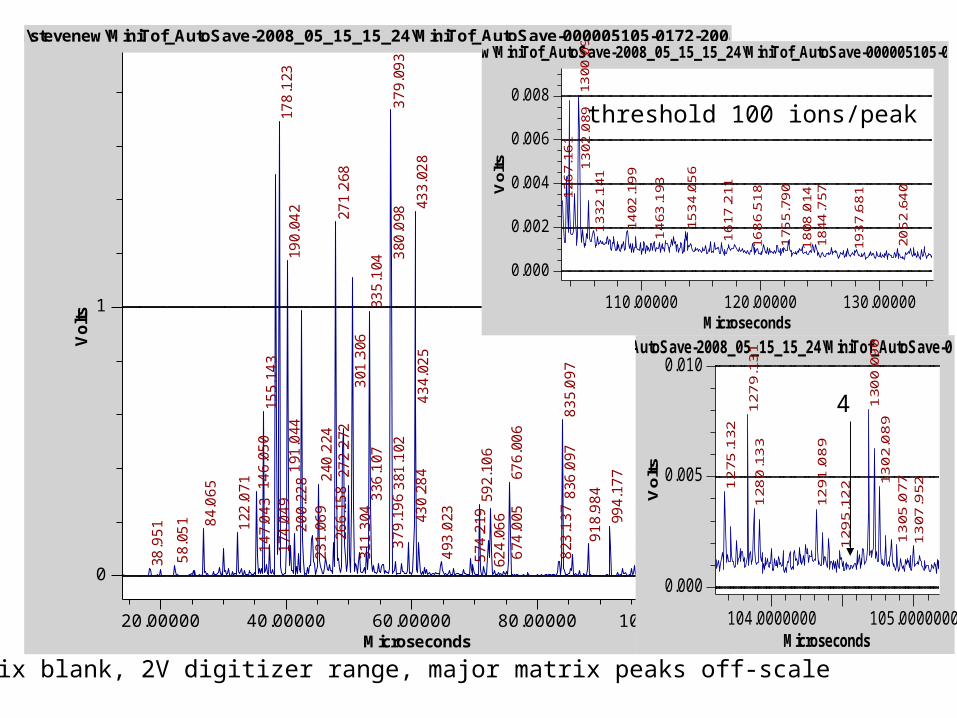
\\Domainserver\public\Shared Spectra\stevenew\MiniTof_AutoSave-2008_05_15_15_24\MiniTof_AutoSave-000005105-0172-2008_05_15_15_27_41.156-matrix.mzml#0
38.951
58.051 84.065
122.071 146.050
147.043
155.143
174.049
178.123
190.042
191.044
200.228
231.069
240.224
266.158
271.268
272.272
301.306
311.304
335.104
336.107
379.093
379.196
380.098
381.102
430.284
433.028
434.025
493.023
574.219
592.106
624.066
674.005
676.006
823.137
835.097
836.097
918.984
994.177
1078.064
1225.198
20.00000 40.00000 60.00000 80.00000 100.00000
0
1
Microseconds
Volts
\\Domainserver\public\Shared Spectra\stevenew\MiniTof_AutoSave-2008_05_15_15_24\MiniTof_AutoSave-000005105-0172-2008_05_15_15_27_41.156-matrix.mzml#0
126
7.16
113
00.090
1302
.089
1332
.141
1402
.199
1463
.193
1534.056
1617
.211
1686.518
175
5.79
0
1808
.014
1844
.757
1937.681
2052.64
0
110.00000 120.00000 130.00000
0.000
0.002
0.004
0.006
0.008
Microseconds
Vo
lts
Matrix blank, 2V digitizer range, major matrix peaks off-scale
threshold 100 ions/peak
\\Domainserver\public\Shared Spectra\stevenew\MiniTof_AutoSave-2008_05_15_15_24\MiniTof_AutoSave-000005105-0172-2008_05_15_15_27_41.156-matrix.mzml#0
1275
.132
127
9.13
1128
0.133
1291
.089
129
5.12
2
130
0.090
1302.089
1305
.077
1307
.952
104.0000000 105.0000000
0.000
0.005
0.010
MicrosecondsV
olts
4

Test Mixture for Determining Dynamic Range
Peptide Conc. (fmole/L) MH+ No.Angiotensin Fragment 1-7 10,000 899.47 1 Angiotensin II Acetate 1,000 1046.54 3des-Pro2 Bradykinin 100 963.51 2 Angiotensin I 2 1296.69 4Neurotensin 1 1672.92 5Glu-1 Fibrinopeptide B (synthetic) 0.2 1570.67 7ACTH (18-39) 0.01 2465.20 6BSA digest 0.1-1 1479.79 B
927.491283.711639.94, etc

\\domainserver\public\Shared Spectra\dynamic range)\MiniTof_AutoSave-2008_05_20_16_27\MiniTof_AutoSave-000011321-0301-2008_05_20_16_39_54.947-Run1.mzml#0
784
.045
R:1815
855.44
5R:174
0989
9.470
R:5880
953
.380
R:1992
1
1046
.550
R:153
26
1053
.570
R:183
48
120
0.642
R:2667
9
1296.685
R:281
25
1479.795
R:307
04
1672
.918
R:30996
80.80873 100.80873 120.80873 140.80873
0
1
2
3
4
5
Microseconds
Volts
\\domainserver\public\Shared Spectra\dynamic range)\MiniTof_AutoSave-2008_05_20_16_27\MiniTof_AutoSave-000011321-0301-2008_05_20_16_39_54.947-Run1.mzml#0
1283.711
R:29998
1296.685
R:28125
1335.670
R:31408
1479.795
R:30704
1570.668
R:24565
1672.918
R:30996
1726.841
R:28323
110.00000 120.00000
0.00
0.01
0.02
Microseconds
Volts
Normal laser
\\domainserver\public\Shared Spectra\dynamic range)\MiniTof_AutoSave-2008_05_20_16_27\MiniTof_AutoSave-000011229-0290-2008_05_20_16_36_49.046-Run1.mzml#4
1437.8174
1466.8455
1479.7985
1487.8878
1511.8489
1537.8066
1570.6850
1639.9341
1672.9120
1694.8790
1726.8187
1749.6452
1880.8425
1907.8395
110.000000 115.000000 120.000000 125.000000
0.00
0.01
0.02
Microseconds
Volts
Higher laser
\\domainserver\public\Shared Spectra\dynamic range)\MiniTof_AutoSave-2008_05_20_16_27\MiniTof_AutoSave-000011321-0301-2008_05_20_16_39_54.947-Run1.mzml#0
927.482
9
931.48
60
88.4000000 88.60000000.00
0.01
0.02
Microseconds
Volts
1 3
2
4
57BB
B
7B
5
BB B B
B
B
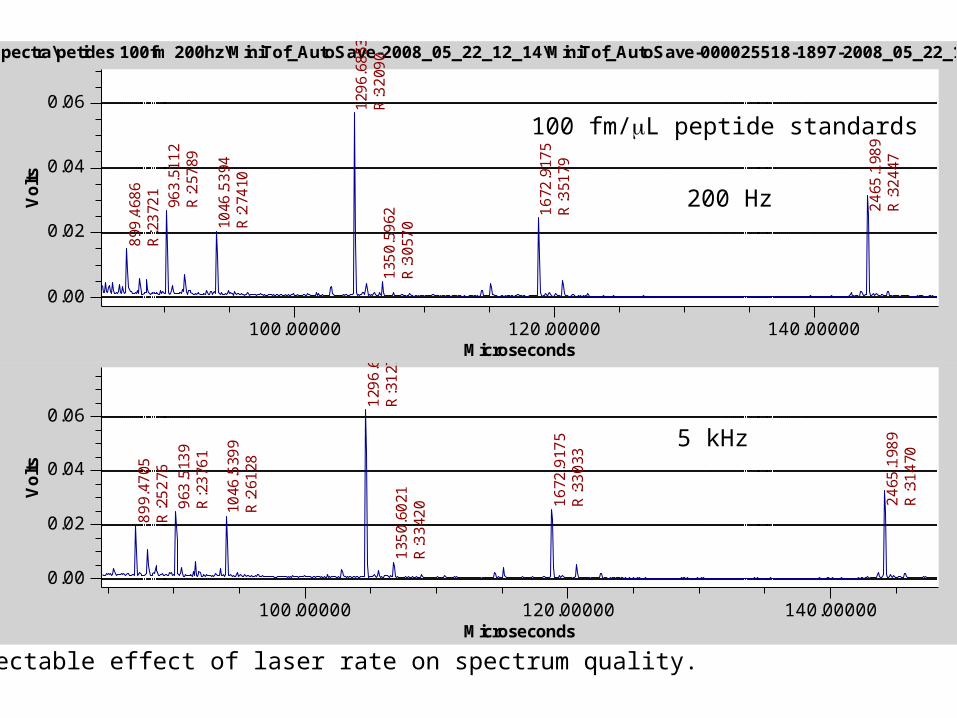
\\domainserver\public\Shared Spectra\petides 100fm 5khz\MiniTof_AutoSave-2008_05_22_12_03\MiniTof_AutoSave-000024199-1877-2008_05_22_12_07_45.906-100 femto.mzml#2
899.4705
R:25276
963.5139
R:23761
1046.5399
R:26128
1296.6853
R:31271
1350.6021
R:33420 1672.9175
R:33033
2465.1989
R:31470
100.00000 120.00000 140.00000
0.00
0.02
0.04
0.06
Microseconds
Volts
\\domainserver\public\Shared Spectra\petides 100fm 200hz\MiniTof_AutoSave-2008_05_22_12_14\MiniTof_AutoSave-000025518-1897-2008_05_22_12_16_58.543-100 femto.mzml#2
899.4686
R:23721
963.5112
R:25789
1046.5394
R:27410
1296.6853
R:32090
1350.5962
R:30570
1672.9175
R:35179
2465.1989
R:32447
100.00000 120.00000 140.00000
0.00
0.02
0.04
0.06
Microseconds
Volts
200 Hz
5 kHz
100 fm/L peptide standards
No detectable effect of laser rate on spectrum quality.

• Present status
– Resolving power > 30,000 for peptides
– Mass error < 2 ppm RMS over entire sample plate
– Detection limit ~1 attomole/L
– Dynamic range ~105
– Performance independent of laser rate (to 5 kHz)
• Future goals
– Resolving power >100,000
– Mass error < 1 ppm RMS
– 10x improvement in detection limit and dyanamic range
– Isotopic resolution of proteins to 30,000 Da
– Multiplexed MS-MS with >4000 resolving power for precursor selection and very high sensitivity and throughput
– Instruments designed for specific applications, e.g. isotope ratios at ppt level
limited by chemical noise
Conclusion and Future
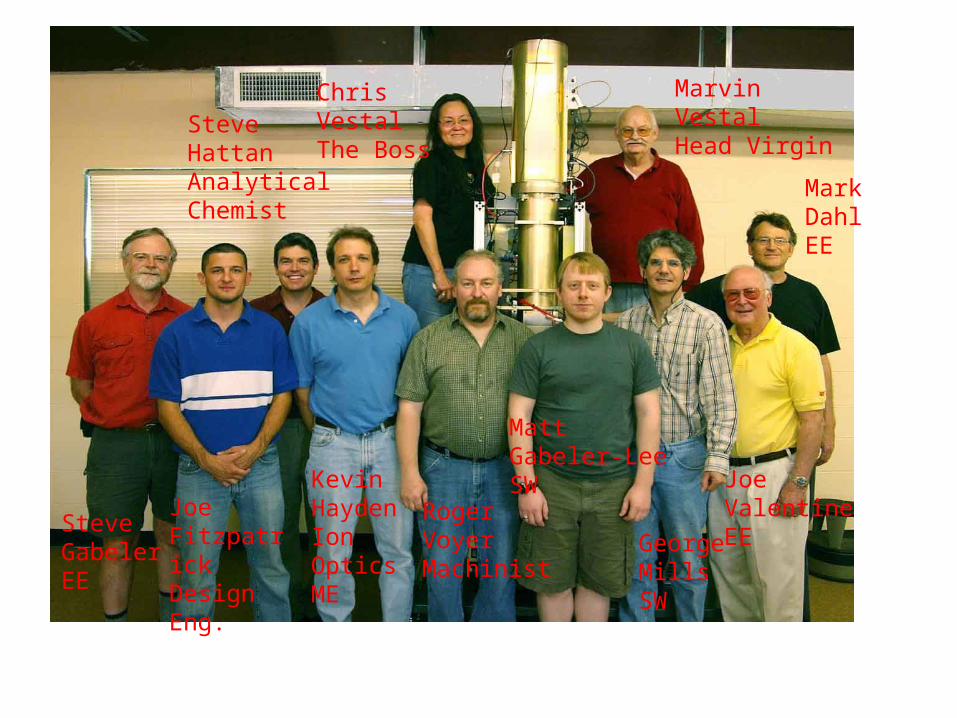
SteveGabelerEE
Joe FitzpatrickDesign Eng.
KevinHaydenIon OpticsME
RogerVoyerMachinist
MattGabeler-LeeSW
GeorgeMillsSW
JoeValentineEE
MarkDahlEE
SteveHattanAnalyticalChemist
ChrisVestalThe Boss
MarvinVestalHead Virgin