Embed Size (px)
DESCRIPTION
A Mason-Dixon poll released Tuesday shows Gov. Phil Bryant (R) easily winning reelection to a second term this fall. The poll shows Bryant leading attorney Vicki Slater (D) 61-30%, and he leads Air Force veteran Valerie Short (D) 63-28%. The poll shows Bryant with a 72% approval rating, while just 20% disapprove. (April 21-23; 625 RVs; +/- 4.0%) (release)
Citation preview
7/18/2019 Mason Dixon on MS GOV 4.28.15
http://slidepdf.com/reader/full/mason-dixon-on-ms-gov-42815 1/3
www.mason-dixon.com @MasonDixonPoll 1
ason-Dixon
olling & Research
Washington, DC • 202.548.2680
Jacksonville, FL • 904.261.2444
MASON-DIXON MISSISSIPPI POLL®
APRIL 2015
ANALYSIS
By: J. Bradford Coker, Managing Director
Mason-Dixon Polling & Research, Inc.©2015, All Rights Reserved
GOVERNOR BRYANT SOLID RE-ELECTION FAVORITE
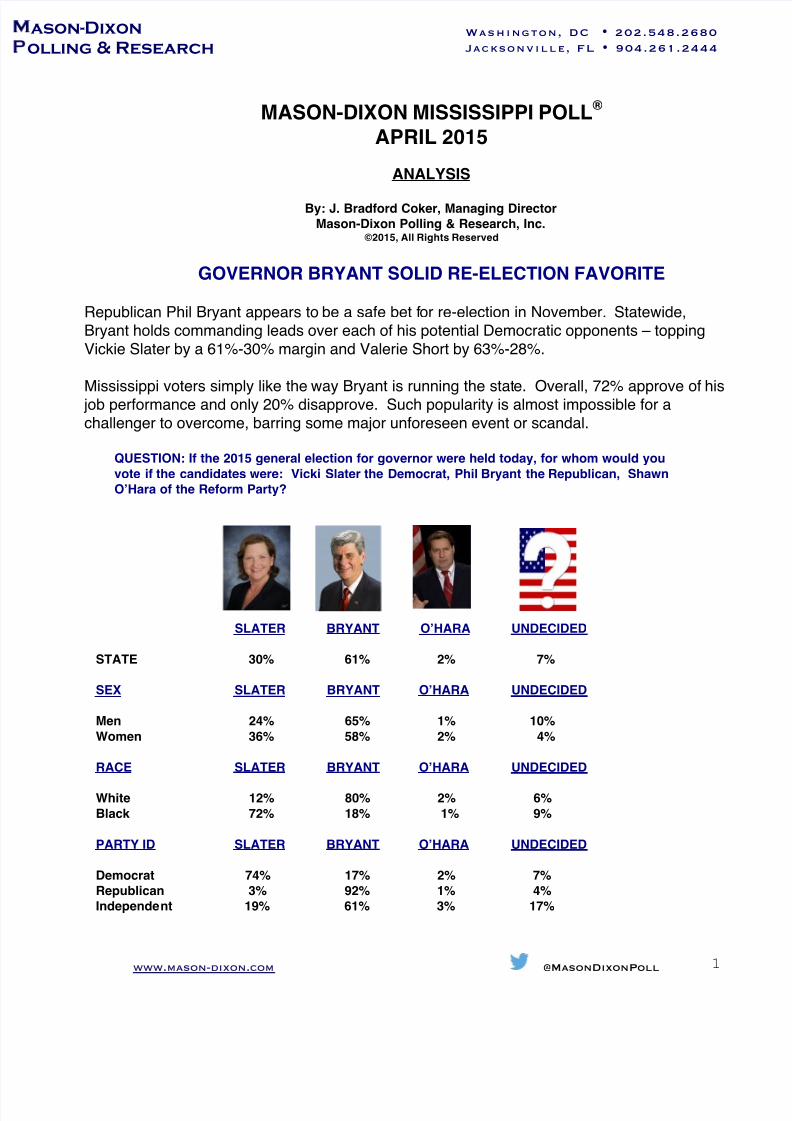
Republican Phil Bryant appears to be a safe bet for re-election in November. Statewide,Bryant holds commanding leads over each of his potential Democratic opponents – toppingVickie Slater by a 61%-30% margin and Valerie Short by 63%-28%.
Mississippi voters simply like the way Bryant is running the state. Overall, 72% approve of his job performance and only 20% disapprove. Such popularity is almost impossible for achallenger to overcome, barring some major unforeseen event or scandal.
QUESTION: If the 2015 general election for governor were held today, for whom would you
vote if the candidates were: Vicki Slater the Democrat, Phil Bryant the Republican, Shawn
O’Hara of the Reform Party?
SLATER BRYANT O’HARA UNDECIDED
STATE 30% 61% 2% 7%
SEX SLATER BRYANT O’HARA UNDECIDED
Men 24% 65% 1% 10%
Women 36% 58% 2% 4%
RACE SLATER BRYANT O’HARA UNDECIDED
White 12% 80% 2% 6%
Black 72% 18% 1% 9%
PARTY ID SLATER BRYANT O’HARA UNDECIDED
Democrat 74% 17% 2% 7%
Republican 3% 92% 1% 4%
Independent 19% 61% 3% 17%
7/18/2019 Mason Dixon on MS GOV 4.28.15
http://slidepdf.com/reader/full/mason-dixon-on-ms-gov-42815 2/3
www.mason-dixon.com @MasonDixonPoll 2
ason-Dixon
olling & Research
Washington, DC • 202.548.2680
Jacksonville, FL • 904.261.2444
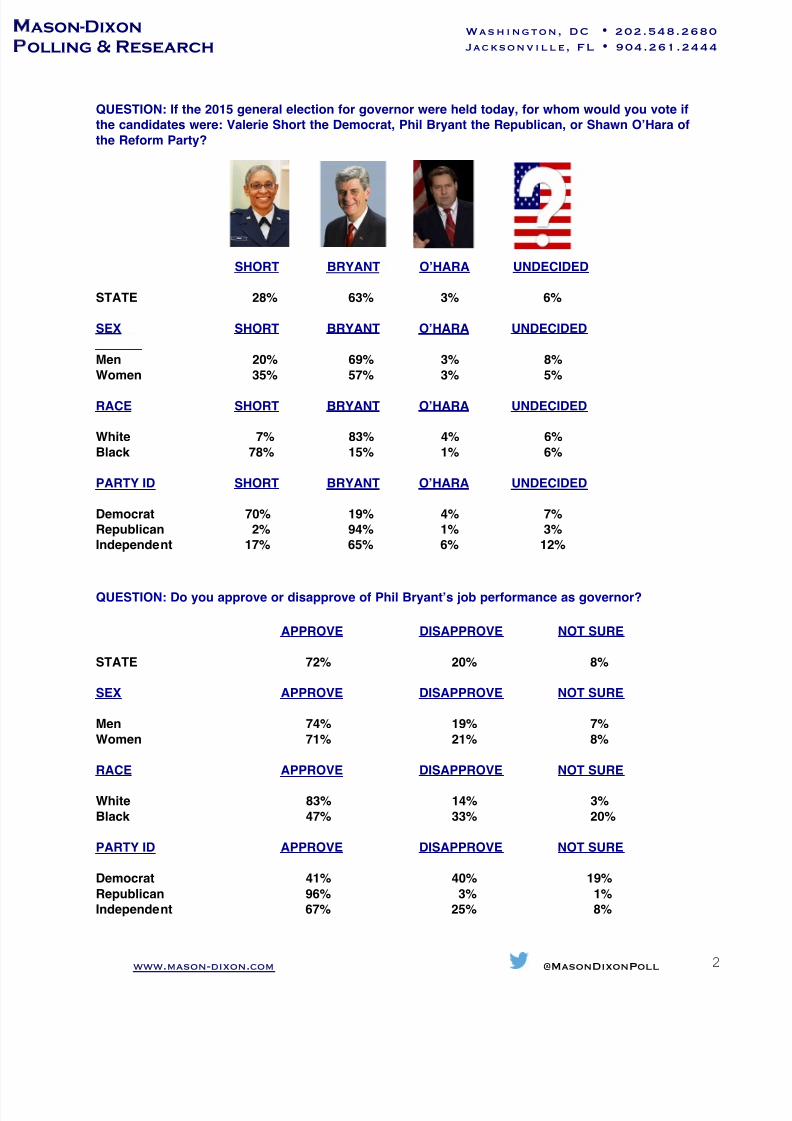
QUESTION: If the 2015 general election for governor were held today, for whom would you vote if
the candidates were: Valerie Short the Democrat, Phil Bryant the Republican, or Shawn O’Hara of
the Reform Party?
SHORT BRYANT O’HARA UNDECIDED
STATE 28% 63% 3% 6%
SEX SHORT BRYANT O’HARA UNDECIDED
Men 20% 69% 3% 8%
Women 35% 57% 3% 5%
RACE SHORT BRYANT O’HARA UNDECIDED
White 7% 83% 4% 6%
Black 78% 15% 1% 6%
PARTY ID SHORT BRYANT O’HARA UNDECIDED
Democrat 70% 19% 4% 7%
Republican 2% 94% 1% 3%
Independent 17% 65% 6% 12%
QUESTION: Do you approve or disapprove of Phil Bryant’s job performance as governor?
APPROVE DISAPPROVE NOT SURE
STATE 72% 20% 8%
SEX APPROVE DISAPPROVE NOT SURE
Men 74% 19% 7%
Women 71% 21% 8%
RACE APPROVE DISAPPROVE NOT SURE
White 83% 14% 3%
Black 47% 33% 20%
PARTY ID APPROVE DISAPPROVE NOT SURE
Democrat 41% 40% 19%
Republican 96% 3% 1%
Independent 67% 25% 8%
7/18/2019 Mason Dixon on MS GOV 4.28.15
http://slidepdf.com/reader/full/mason-dixon-on-ms-gov-42815 3/3
www.mason-dixon.com @MasonDixonPoll 3
ason-Dixon
olling & Research
Washington, DC • 202.548.2680
Jacksonville, FL • 904.261.2444
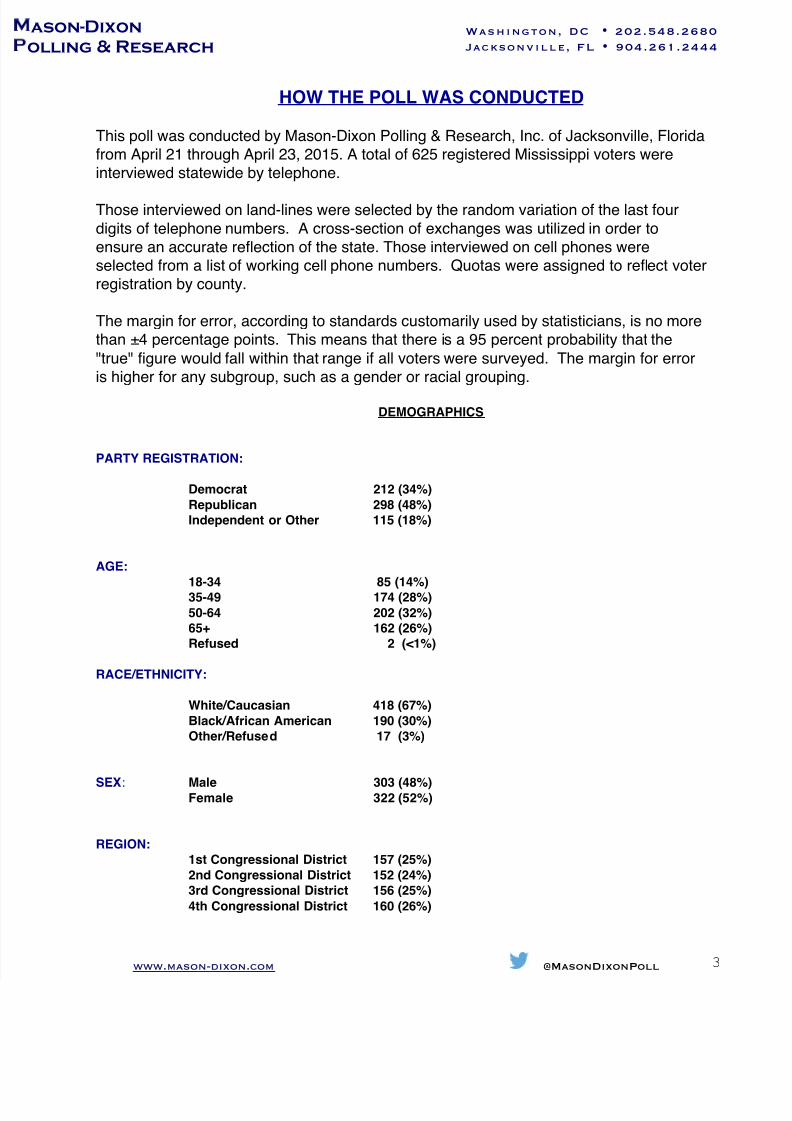
HOW THE POLL WAS CONDUCTED
This poll was conducted by Mason-Dixon Polling & Research, Inc. of Jacksonville, Floridafrom April 21 through April 23, 2015. A total of 625 registered Mississippi voters wereinterviewed statewide by telephone.
Those interviewed on land-lines were selected by the random variation of the last four
digits of telephone numbers. A cross-section of exchanges was utilized in order toensure an accurate reflection of the state. Those interviewed on cell phones wereselected from a list of working cell phone numbers. Quotas were assigned to reflect voterregistration by county.
The margin for error, according to standards customarily used by statisticians, is no morethan ±4 percentage points. This means that there is a 95 percent probability that the
"true" figure would fall within that range if all voters were surveyed. The margin for erroris higher for any subgroup, such as a gender or racial grouping.
DEMOGRAPHICS
PARTY REGISTRATION:
Democrat 212 (34%)
Republican 298 (48%)
Independent or Other 115 (18%)
AGE:
18-34 85 (14%)
35-49 174 (28%)
50-64 202 (32%)
65+ 162 (26%)
Refused 2 (<1%)
RACE/ETHNICITY:
White/Caucasian 418 (67%)
Black/African American 190 (30%)
Other/Refused 17 (3%)
SEX: Male 303 (48%)Female 322 (52%)
REGION:
1st Congressional District 157 (25%)
2nd Congressional District 152 (24%)
3rd Congressional District 156 (25%)
4th Congressional District 160 (26%)


![U.S. v. Dixon, 509 U.S. 688 (1993) - Columbus School of Lawclinics.law.edu/res/docs/US-v-Dixon.pdfU.S. v. Dixon, 509 U.S. 688 (1993) Dixon, Dixon. and [1] Dixon. *698. order. Dixon](https://img.pdfslide.us/doc/110x75/5ac1e6007f8b9ad73f8d6ea8/us-v-dixon-509-us-688-1993-columbus-school-of-v-dixon-509-us-688.jpg)