Embed Size (px)
Citation preview

Paper ID #33675
Mask Effectiveness: A Project to Connect Air Pollution and MaterialsScience
Prof. Jean M. Andino, Arizona State University
Jean M. Andino is a faculty member in Chemical Engineering and Civil, Environmental, and SustainableEngineering, and a Robust Entrepreneurial Mindset Leader in the Kern Entrepreneurial Engineering Net-work (KEEN) program at Arizona State University (ASU). She also serves as the Director of the WesternAlliance to Expand Student Opportunities (a National Science Foundation Louis Stokes Alliance for Mi-nority Participation program) and as Interim Director of the ASU Hispanic Research Center. Dr. Andinoearned a Bachelor of Science in Engineering Sciences from Harvard University and a PhD in ChemicalEngineering from the California Institute of Technology. Prior to being recruited to ASU, she was on thefaculty at the University of Florida, and also worked for 2 years at Ford Motor Company in both theirChemistry and Chemical Engineering departments. Prof. Andino is the recipient of the 2017 Societyof Hispanic Professional Engineers STAR Educator of the Year award, a Fulbright US Scholar award inRenewable Energy (for work in the Republic of Panama during her sabbatical from ASU), and a NationalScience Foundation CAREER award, among many other local and regional awards. She is also a regis-tered Professional Engineer that volunteers with the National Council of Examiners in Engineering andSurveying.
Cameron N. Morgan, Arizona State University
Cameron N. Morgan is an undergraduate student in the Ira A. Fulton Schools of Engineering at Ari-zona State University, majoring in environmental engineering. His research interests include air pollutioncontrol, atmospheric chemistry, climate change, and environmental educational outreach. Cameron is arecipient of the Fall 2021 Fulton Undergraduate Research Initiative award, a competitive award that en-ables undergraduates at Arizona State University to conduct laboratory research with faculty. Through thisaward, Cameron will conduct laboratory research in air pollution control within Prof. Andino’s group.
Dr. Lizandra C. Godwin, University of New Mexico
Lizandra C. Godwin is a faculty member in the Electrical and Computer Engineering Department at theUniversity of New Mexico. Dr. Godwin earned her B.S. in Mechanical Engineering from Florida A&MUniversity and her Ph.D. in Materials Science and Engineering from the University of Florida. Aftercompleting her degree, Lizandra worked at Intel Corporation on microchip development and processesfor 10 years. Prior to the Univ. of New Mexico, Lizandra was a research assistant professor at Boise StateUniversity, where her research group focused on developing 2D and 3D materials for electronic devicesand broadening participation in engineering.
c©American Society for Engineering Education, 2021

Mask Effectiveness: A Project to Connect Air Pollution and Materials Science Abstract The global COVID-19 pandemic promoted the world community to use face masks to reduce viral transmission. This practice has again raised interest in the effectiveness of masks in preventing the spread of virus particles. This theme provided a unique, timely subject to enhance learning in the field of air pollution control, while enabling distinct connections to the fields of material science as well as human health and air quality. A collaborative “Mask Effectiveness” class project was developed with the objectives of enabling students (a) to identify the types, sizes, and movement of particles that are found in air, particularly those that are expelled during normal human activity, and (b) to characterize the material properties that influence the control of these different particles. A specific focus was placed on the use of face masks made from common textile materials. The “Mask Effectiveness” project required the development of Excel-based animations and tools that encourage students to explore relationships between air pollutants and materials science. The tool was developed such that it provides a solution to the limitations of a student design project for online and hybrid courses. By engaging with the computer-based Excel tool, students are able to evaluate alternative scenarios that include the collection efficiency of particles that arise from different sources (talking, coughing, and sneezing) , and the relationships between mask “breathability”, porosity, and collection efficiency of a mask. The project was designed to be implemented initially with undergraduate engineering students across two universities- Arizona State University and the University of New Mexico. One specific goal at Arizona State University was to reinforce concepts consistent with entrepreneurial mindset learning approaches. An additional goal was to provide a learning experience which allowed students to connect environmental engineering and material science topics to a design challenge that addressed a global community need. This paper describes the specific activities that were undertaken, and connects these activities to ways in which teaching methods may be altered by using an Excel-based module.

2
Introduction The 3 Cs - generating Curiosity, making Connections, and Creating value are considered to be the seminal framework of Entrepreneurial Mindset Learning (EML) activities. At Arizona State University, a unique set of indicators has been mapped to the 3 Cs of EML in order to provide a context by which to assess progress in integrating EML into engineering teaching activities. These indicators are detailed in Lichtenstein and Collofello1. The current work is based on developing activities around the indicators of “exploring alternative solutions” and “integrating/synthesizing different kinds of knowledge”. In particular, the current work enables students to explore the essential design parameters of different face mask solutions that are aimed at filtering particles from exhaled air, by integrating knowledge of material science and air pollution control. These disparate fields are connected so that students are able to draw conclusions and explore relationships in the context of a real-world scenario. In order to discuss the teaching methods, it is important to first present background information, including the pertinent mathematical relationships. This discussion helps to provide insights into the types of connections that students can make between different parameters, and provides a path for students to explore a re-design of the masks (i.e. create new value in the context of EML) by adjusting the parameters in the Excel-based simulations. Subsequent to the presentation of the background information, additional discussion is provided on how the Excel-based tools can be used in teaching. Background
The current COVID-19 pandemic has raised awareness around the subject of air pollution, particularly biological air pollutants. Biological air pollutants can be either gases (e.g. volatile organic compounds that arise from mold and give the characteristic “musty” odor in mold-impacted buildings) or particles (i.e. liquids or solids) that are suspended in air. A major transmission mode of the COVID-19 virus relates to the movement of particles, specifically small particles that are suspended in air, i.e. aerosols. Studies have been published over the years on the spread of aerosols due to coughing and sneezing2–5. Recent work has focused on the release of aerosols due to speaking, with loud speaking resulting in markedly increased levels of aerosol production6. The aerosols that arise from human sources can range from nanometers to microns in size, with the smaller particles resulting in longer transmission distances. Recent experimental and computational work has shown the effective transmission of small particles2,5,7, with one study suggesting transmission of aerosols at a distance of up to 30 meters, depending on the original particle size 2. The movement of liquid-containing particles is a complex process due to the evaporation of water and subsequent changes in size. However, one point is common amongst all of the recent studies that have been published. All studies show that a barrier such as a face mask reduces the transport of aerosols that originate from humans through breathing, speaking, coughing or sneezing. The degree and efficiency of filtration are a function of the material that is used in the creation of face masks.
Particle transport and collection modes include diffusion, interception, impaction,
electrostatic interaction, and gravitational settling to or on a collector surface8,9. Gravitational settling would play an insignificant role in particle collection on masks since the force of gravity would be parallel to the face of the mask. The particle collecting mode and forces that are implemented to lower the particle loading depend primarily on particle size and, for the electrostatic interaction, the material composition. Figure 1 illustrates the different particle collecting modes, where the interceptor could be a fiber in a material.
3
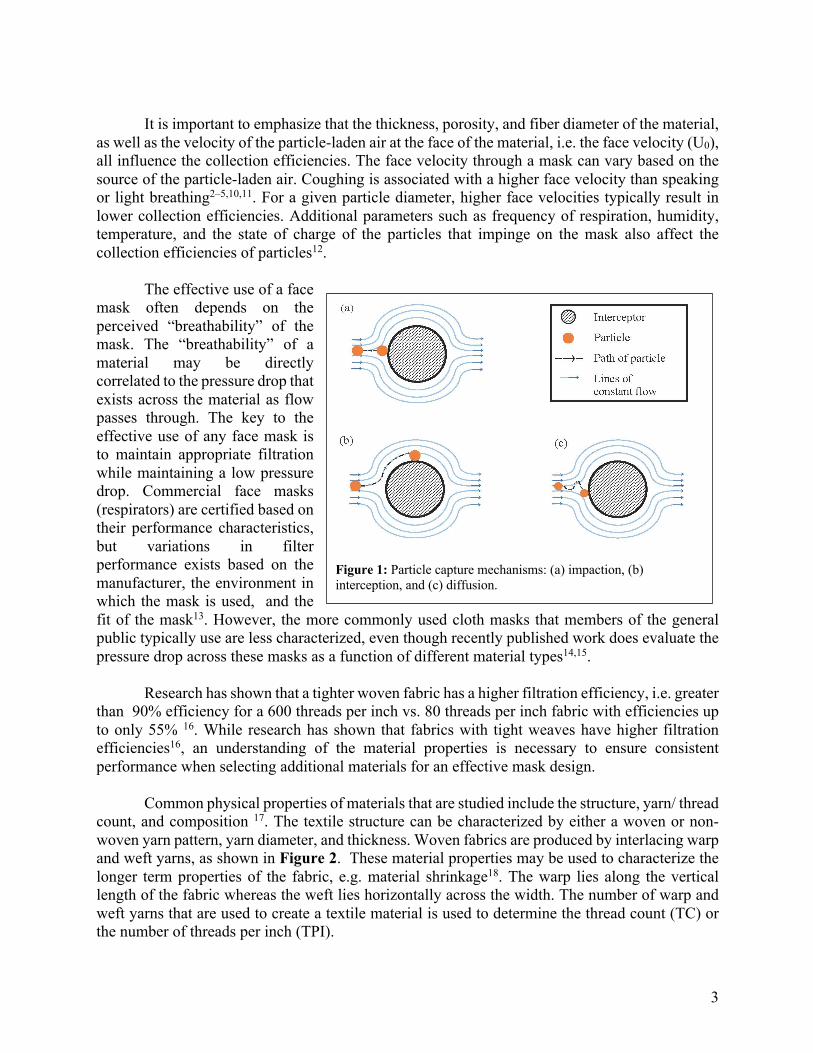
It is important to emphasize that the thickness, porosity, and fiber diameter of the material,
as well as the velocity of the particle-laden air at the face of the material, i.e. the face velocity (U0), all influence the collection efficiencies. The face velocity through a mask can vary based on the source of the particle-laden air. Coughing is associated with a higher face velocity than speaking or light breathing2–5,10,11. For a given particle diameter, higher face velocities typically result in lower collection efficiencies. Additional parameters such as frequency of respiration, humidity, temperature, and the state of charge of the particles that impinge on the mask also affect the collection efficiencies of particles12.
The effective use of a face
mask often depends on the perceived “breathability” of the mask. The “breathability” of a material may be directly correlated to the pressure drop that exists across the material as flow passes through. The key to the effective use of any face mask is to maintain appropriate filtration while maintaining a low pressure drop. Commercial face masks (respirators) are certified based on their performance characteristics, but variations in filter performance exists based on the manufacturer, the environment in which the mask is used, and the fit of the mask13. However, the more commonly used cloth masks that members of the general public typically use are less characterized, even though recently published work does evaluate the pressure drop across these masks as a function of different material types14,15.
Research has shown that a tighter woven fabric has a higher filtration efficiency, i.e. greater
than 90% efficiency for a 600 threads per inch vs. 80 threads per inch fabric with efficiencies up to only 55% 16. While research has shown that fabrics with tight weaves have higher filtration efficiencies16, an understanding of the material properties is necessary to ensure consistent performance when selecting additional materials for an effective mask design.
Common physical properties of materials that are studied include the structure, yarn/ thread count, and composition 17. The textile structure can be characterized by either a woven or non-woven yarn pattern, yarn diameter, and thickness. Woven fabrics are produced by interlacing warp and weft yarns, as shown in Figure 2. These material properties may be used to characterize the longer term properties of the fabric, e.g. material shrinkage18. The warp lies along the vertical length of the fabric whereas the weft lies horizontally across the width. The number of warp and weft yarns that are used to create a textile material is used to determine the thread count (TC) or the number of threads per inch (TPI).
Figure 1: Particle capture mechanisms: (a) impaction, (b) interception, and (c) diffusion.

4
Another characteristic of woven fabrics is the inclusion of pores, i.e. the open spaces that exist between the weft and warp yarns. The pore sizes depend on the thread count of the fabric. As the thread count or the number of threads per unit area increases, the porosity decreases for the same yarn diameter.
Porosity is critical for understanding the air permeability of a woven material19. Air permeability is a measure of the penetration of air through a material. This property depends upon both the porosity and the thickness of the material19. Therefore, the breathability and effectiveness of a mask is dependent on the porosity of the materials used.
The chemical nature of mask materials,
e.g. natural, synthetic, or blended raw materials is another important parameter that is used in the evaluation of cloth masks 9,16,17,20–22. Cotton is the most common fiber type used in masks. On the other hand, certain natural and synthetic fabrics have electrostatic interactions which results in added particle filtration23. For example, natural silk is a fiber that can be electrostatically charged. An understanding of the material composition and its properties are necessary when selecting a material for a mask design. Mathematics of Particle Collection on Mask Materials
Particle collection efficiency in percent, as determined through experiments, may be defined mathematically as:
Filtration Efficiency (%)= !!!"!"
!!" ∗ 100 , (Equation 1)
where Cu is the concentration of particles that are upstream of the filter and Cd is the particle concentration downstream of the filter. Concentration may be measured on either a mass or number basis, depending on the type of aerosol measuring equipment that is available. It is important to note that Equation 1 is applicable to particles of one size. In the Excel-based tool, the particle distribution is monodispersed. However, students may explore the influences of particle size on collection efficiency. Collection efficiencies will vary based on both the filter type and particle size.
Filtration efficiency can also be defined mathematically by considering the different forces that impact collection efficiency onto a single fiber. Once the collection on a single fiber is characterized, this can be extrapolated to particle collection on the overall fabric material. Mathematically, the overall efficiency of the fabric, assuming that all fibers have the same diameter, may be defined using Equation 2:
Figure 2: A diagram of a woven fabric showing the warp yarns, in yellow each with a diameter of d1 and the weft yarns, in red, each with a diameter of d2.
The distance from the right edge of one warp yarn to the right edge of the next warp yarn is the distance ”P1”.
The distance from the top of one weft yarn to the top of the next weft yarn is the distance ”P2”.
WARP yarns, each with diameter d1
WE
FT
ya
rns,
ea
ch w
ith
dia
me
ter
d2

5
Efficiency = 1 − 𝑒𝑥𝑝 *"#$%#&'($
+ , (Equation 2)
where 𝛼 = )*+,-/0123,
&0&41/0123,= 1- surface porosity
𝐸5 =
623+,-0)74-&*81,98011,8&,(+:426*&1,6;&<0)4)*+,-623+,-0)74-&*81,9*68*(,6&06426*&1,6;&<
t = thickness of the material df = diameter of the fiber.
A full discussion of the equations that are used to determine the total single fiber efficiency, 𝐸5, is available in Hinds8. However, the most significant contribution to 𝐸5 for sub-micron sized particles interacting with a fiber is the collection efficiency due to diffusion, with the collection efficiency due to interception and impaction becoming more important as the particle size increases beyond one micron in size.
As mentioned previously, the “breathability” of material may be characterized by the pressure drop across the material. Pressure drop varies as a function of flow conditions for different material types. It has been shown, even for nanofiber-based randomized filter material, that as the face velocity (volumetric flowrate / area of the material) across the surface increases, the pressure drop increases14. A commonly available relationship for pressure drop (∆𝑃 ) is provided in Equation 38.
∆𝑃 = !"#!$(&)("#
(Equation 3)
where 𝜇= viscosity of air at a given temperature
t = thickness of the material Uo = the face velocity = volumetric flowrate / area of the material = Q/Ac 𝑓(𝛼) = 64𝛼=.?(1 + 56𝛼@)for 0.006 < 𝛼 < 0.3 ,
and
𝛼 = surface solidity = 1 – surface porosity.
The surface porosity is defined subsequently.
The thread count and the surface porosity are important factors that impact the breathability of a fabric. The thread count in units of threads per inch (TPI) may be calculated using Equation 4.
6
TC = # warp yarns per square inch + # weft yarns per square inch (Equation 4) Thus, if there are 300 vertical yarns (warp) and 300 horizontal lines in a square inch, the thread count or number of threads per inch is 600 TPI.
Surface porosity, expressed as a fraction, is defined in a general manner using Equation 5. For a plain-woven pattern, the surface porosity (expressed as a fraction) can be estimated using Equation 6 24.
surface porosity = totalemptyarea
totalareaoffabric (Equation 5)
surface porosity = N%N&
(N%P(%)(N&P(&) (Equation 6)
where
P1=distance between warp threads, as shown in Figure 2 P2=distance between weft threads, as shown in Figure 2 d1=diameter of the warp yarn d2 =diameter of the weft yarn.
Equation 6 is based on the following assumptions: (1) the yarns are uniform along the length, (2) the yarns are equally spaced in the fabric, and (3) there is no flattening / deformation of the yarns. The mathematical expressions that have been presented form the basis of the module and computational tools that were developed to aid student exploration of the connection between air pollution and materials science. Overview of Module
The Mask Effectiveness module is meant to be implemented in multiple stages. These stages seek to raise the students’ curiosity, allowing them to make connections between materials and air pollution concepts, and then to explore ways to create value by prompting students to explore the parameters that influence good cloth mask design and use. Curiosity, connections, and creating value are the core elements of an entrepreneurial mindset approach to teaching and learning. The novel teaching aspects of this module consist of (1) connecting two fields (materials science and air quality) in a real-world example, thereby providing context to students, (2) employing computer-based tools with common measurements in order to reinforce concepts, (3) promoting added exploration of the relationships between parameters by providing open ended questions that could be answered by using the computer-based tools.
Enhancing Curiosity.
Aerosol science and air pollution control concepts such as particle sizes, particle interactions in the lung, and the characteristics of different types of personal protective gear are first introduced and discussed. This is done in the context of health concerns such as influenza25

7
and Covid-19 2,7 as well as regular speaking6,11,26 and coughing2–4,11 as sources of aerosols. Subsequently, students are introduced to material science themes such as textile types, manufacturing methods, and porosity.
Making Connections.
The air pollution and materials themes are subsequently combined in order to explore the effectiveness of particle filtration in the context of normal human activities, e.g. breathing, coughing, talking. An interactive PowerPoint file was created to cover (i) particle sizes from different human sources, (ii) mechanisms of particle interactions, (iii) material porosity, and (iv) particle penetration through a mask (including multiple mask layers). This PowerPoint file is available as part of the supplemental material to this paper.
Excel-Visual Basic for Applications (VBA) based tools were created to enable exploration
of the effects of particle sources, particle sizes, and material porosity on particle collection efficiency. The tools enable students to answer basic questions such as:
(1) How are porosity, pore size, and thread count related? (2) How is theoretical pressure drop across the material impacted by the properties of the
material? (3) What is the theoretical efficiency of particle collection across different materials,
considering different particle sources (e.g. regular speech, sneezing, coughing), particle sizes, and material properties?
Creating Value.
To assist students in “creating value”, students explore the design of a single layer mask by using the Excel-VBA tools and making connections between breathability considerations related to the materials, particle filtration ability, and replacement costs based on the properties and the useful life of the fabric.
Module Activities I. Relating Porosity and Threads per Inch of a Material
Entrepreneurial Mindset Theme: Curiosity Objectives:
(1) To determine the number of threads per inch (the thread count) by examining commonly available materials, and to correlate the thread count to the parameters defined in Figure 2 of P1 and P2. This information is essential in determining the porosity and perceived breathability of the fabric. (2) To utilize the Excel-VBA tool to calculate thread count and porosity for the commonly available materials. (3) To devise correlations and trends between porosity, thread count, and fiber diameter.
In this activity, students examine materials that are available in their own environments and use these materials to estimate material parameters.
Activities for Objective #1:
Students are asked to identify a material that has woven fibers, e.g. a scarf. A picture of the item in the presence of a ruler is taken to estimate the number of threads in a 1 square inch area.

8
This method mimics some of the imaging techniques that are used to characterize materials27. Students need to devise an appropriate method of estimating the number of threads per inch and determining the parameters that are needed to calculate the thread count according to Equation 4 and porosity according to Equation 6. An alternative to the task of having students find their own sample is to provide students with pictures of fabrics. To extend this investigation in a different way, students may use a material where the thread count is specified (e.g., a bed sheet), and then estimate the diameter of a fiber (d1 or d2) as well as the P1 and P2 distances in the sheet, making appropriate assumptions or further investigating the manufacturing process. Activities for Objective #2:
The Excel sheet labeled as “Thread Count & Porosity” can be used to estimate the properties of the chosen materials and compare different materials. Figure 3 shows a screen shot of the sheet. It is important to note that the sliders in the sheet may be used to alter the values that appear in the cream-colored boxes. Note that the slider for scenario #1 for the number of warp yarns controls the value for the # of warp yarns in scenario #2. In this manner, students are encouraged to compare items with changes in only one parameter. Students can press the provided button to enable a randomly generated yarn diameter. This diameter, combined with the number of warp and weft yarns enables students to calculate the parameters P1 and P2, and eventually the porosity using Equation 6. Students enter their values for the porosities in the boxes that are provided for scenarios 1 and 2. (Note that the instructions that appear in blue text guide the students as to where to enter their values.) As soon as an answer is provided by the student, the automated messages in blue switch to providing the correct porosity answer, without any judgement as to whether the student’s inputted answer was correct or not. Initially the sheet was set up to judge correctness/incorrectness of the answer. However, feedback (obtained in the Phase 1 assessment process described subsequently in this paper) suggested that exploration of the relationships might
Figure 3: A screen shot of the Excel-VBA sheet that is used to explore relationships between the thread count, porosity, and fiber diameter.

9
be encouraged more by simply allowing students to self-check their work. If students did not get the correct answer it was likely because they did not correctly determine the P1 and P2 distances from the warp, weft, and diameter information. To enable further checking of answers, and also to reinforce the connectivity of the different themes in the module, the materials information is transferred over to the “Pressure Drop” sheet. A screen shot of the “Pressure Drop” sheet is found in Figure 4. Specifically, the warp, weft, and diameter data are transferred, and the calculated P1 and P2 distances are revealed. In this manner, a student always has a way to check the numbers that must be used in their calculations. Once the student finishes, they may use the “RESET ALL VALUES” button to clear the values for the diameter, Scenario #1, and Scenario #2 on the “Thread Count & Porosity” sheet.
Activities for Objective #3:
Additional areas to explore while using the “Thread Count & Porosity” sheet, or by just considering the calculations that were carried out by the student to obtain their values of P1 and P2 include:
(a) how the distances P1 and P2 might change if the fiber diameters stay the same, but the thread count decreases,
Figure 4: A screen shot of the Excel-VBA “Pressure Drop” sheet that is used to explore relationships between material thickness, pressure drop across materials, particle sources, and particle collection efficiency.

10
(b) how the distances P1 and P2 might change if the fiber diameters stay the same, but the thread count increases, and
(c) the influences of P1 and P2 on porosity.
All of these activities rely on changing the thread count, and may be repeated for a different fiber diameter. Once repeated, students have enough data to create a plot and interpret the relationships between different material parameters. Additional items that are important to discuss and help to expand students’ curiosities include the testing methods that are used to characterize different materials28. Tests that characterize material thickness, weight per unit area, and bacterial filtration efficiency are already available as standard methods through the American Society for Testing and Materials (ASTM). These methods include, respectively, ASTM D17777-96, ASTM D3776-96, and ASTM F2101-01 28. II. Relating Fibers, “Breathability”, and Collection Efficiency
Entrepreneurial Mindset Theme: Connections Objective: (1) To establish connections between material properties and air pollutant control by examining the relationships between the material fiber properties, pressure drop across the material, and collection efficiency.
In this activity, students use the data that are obtained in the “Thread Count & Porosity” Excel-VBA sheet (a screen shot appears in Figure 4) to explore pressure drop across a mask, according to Equation 3. The pressure drop is related to the perceived “breathability” of the mask. Students can compare the calculated values to values that are observed through published experiments14,15,29. Discrepancies between the calculations and published literature can be used as a discussion point regarding mask fit. This discussion provides a transition to the topic of collection efficiency.
As seen in Equation 2, the theoretical collection efficiency is related to the porosity, the material thickness, and the single-fiber collection efficiency. In the Excel-VBA sheet titled “Pressure Drop”, students can enter the thickness of their material. The porosity from the “Thread Count & Porosity” sheet is also transferred over. The single fiber collection efficiency is calculated based on considering the size of particles from different sources. The sources may be chosen by the student in the upper left-hand portion of the “Pressure Drop” sheet. As a small added detail, we have set the “Particle Source” section of the sheet up in such a way as to enable students to not only see the data regarding particle properties, but to also visualize the differences in particles coming from the blue figure representing a person. The overall collection efficiency is calculated automatically at the bottom right of the “Pressure Drop” sheet for the given diameter of the source particle. It is important to note that once a student picks a particle source, the diameter that is randomly chosen only falls within the range of expected diameters for that source. Different particle sources, e.g. breathing, loud speaking, sneezing, and coughing may be examined.
Through the calculations and exercises that are part of this second activity, students are able to explore and quantitatively describe the correlations between material fiber sizes, and

11
pressure drop across a material. These correlations are extended to discuss mask “breathability” (which relates to the porosity and thickness of the mask and pressure drop across the mask) and particle collection efficiency for different particle sources. Students should find that as the porosity increases, particle collection efficiency decreases and mask effectiveness decreases. A natural extension to this discussion is how multiple mask filter materials joined together impact particle collection efficiency. This leads into the discussion of how students may join materials together to meet the multiple needs of good particle collection, but with good breathability (low pressure drop) and comfort for the user. Teaching Elements
The previous sections of this paper describe the various activities that students may be asked to undertake for this particular example. This section of the paper provides a discussion of how this “mask module” may be extended to address other topics.
Extension of the current activity into other topic areas can be made by undertaking a few basic steps:
1. Determine two connected theme areas that involve calculations, and where measurements are possible.
2. Create objectives for the calculations. In the current case it was important for students to be able to calculate the porosity of the material, and then explore the relationships between porosity and particle (air pollutant) collection efficiency.
3. Modify the first sheet (seen in Figure 3) of our Excel tool to address the theme area where the central calculation is to be accomplished. This should be the place where the students are able to input numbers generated from their measurements, easily alter scenarios by moving the sliders, and check their calculated answers for whatever related parameter needs to be calculated. This step of the process reinforces the accuracy of measurements, encourages the use of alternative scenarios to explore relationships, and helps to develop curiosity about design.
4. Connect the information from the first sheet where basic calculations are carried out (an example is seen in Figure 3) to the top right hand corner of the second sheet of our Excel Tool (an example is seen in Figure 4). Add any intermediate information that students may need in order to properly carry out the calculations from the first sheet. In our case, in order to properly carry out the porosity calculation, students needed to do a few calculations to determine the distances P1 and P2. Thus, we provided those numbers. This step of the process reinforces the process of “making connections” between concepts.
5. With the second sheet, the goal should be to combine the two theme areas that are chosen. Thus, the top left hand section of the second sheet (an example is seen in Figure 4) would include information from the second theme area. This could be data from papers, additional constraints introduced from the second theme area, etc.. In our case, we used data from papers to provide particle sizes, velocities, and concentration ranges from different activities (speaking, coughing, etc).
6. In the bottom portion of sheet 2 (see Figure 4 as an example), the two theme areas are combined to enable additional automated calculations and further exploration of how different parameters will change the outputs. The addition of a chart that includes multiple scenarios assists students in making comparisons. This portion of the second sheet allows students to make further connections, and enables the exploration of how design changes can influence the outcome, thereby enhancing or creating value. In the current mask example, at the bottom of sheet 2 (seen in Figure 4), students connect particle sources, material properties, and efficiency. For the same

12
particle size, students may decrease the material porosity and immediately see how the theoretical collection efficiency increases and the emitted particle number decreases. Alternatively, just the material thickness can be changed. The plot automatically shows the effect of changes in material properties on the number of particles that are effectively emitted from the person. Thus, students can begin to explore the best way to achieve the most effective mask. The use of the excel sheets places emphasis more on the exploratory component in order to focus the student on the connections. Assessment The assessment process for this project was planned in two phases: (1) determining the effectiveness of how the tools incorporated entrepreneurial mindset concepts of enhancing curiosity, making connections, and creating value and (2) determining the extent to which students (a) learned the concepts and (b) made the desired connections. The first phase of the assessment process was accomplished by sharing the tools with two faculty members, one staff member, and five environmental or chemical engineering students. Information was gathered on how the Excel tool could be altered and be made to be more effective. Seven of the eight individuals contacted did not realize that Excel could be automated in the way that was presented. One faculty member and a student suggested changing the first sheet (seen in Figure 3) to remove a “correct” versus “incorrect” assessment, and instead simply provide the answer so that students could compare their inputted answer themselves. By providing the calculated P1 and P2 parameters on the second sheet, students could check the intermediate steps. All participants in this phase of the evaluation recognized the connections between concepts.
The second phase of the assessment process is the evaluation of student learning. This process is ongoing. The easiest assessment process is to simply determine if a student can properly calculate the individual parameters, e.g. the thread count, surface porosity, pressure drop, and overall efficiency. Repeating the calculations a number of times and determining whether a student can correctly calculate the individual parameters at least 70% of the time is a straightforward assessment process that establishes “proficiency”. However, the larger goal of this Mask Effectiveness module is to enable students to make connections between the air pollution and materials fields. Thus, an assessment that focuses in on these connections is useful. Using the Entrepreneurial Mindset at Fulton Schools of Engineering (EM@FSE) indicators that have been established by the engineering leadership at Arizona State University1, we have crafted a set of rubrics that map to the specific EM@FSE indicator that is being assessed. The rubric that is being used is in Table 1.

13
Table 1: Rubrics used to assess student learning.
Entrepreneurial Mindset “Parameter”
Indicator Item(s) used for assessment
Level of Proficiency
Well Above Proficient Proficient Below Proficient
Curiosity Exploring alternative scenarios
Porosity calculations
The student is able to correctly calculate the porosities of fabric materials greater than 90% of the time, and is correctly able to explain the relationship between warp, weft, thread count and porosity of different materials. The student also does added research to explore the types of materials that can affect porosity.
The student is able to correctly calculate the porosities of fabric materials greater than 70% of the time, and is correctly able to explain the relationship between warp, weft, thread count and porosity of different materials.
The student is able to correctly calculate the porosities of fabric materials less than 70% of the time, and is correctly able to explain the relationship between warp, weft, thread count and porosity of different materials.
Connections integrating/ synthesizing different kinds of knowledge
Written Assignment
The student is able to connect the material properties of thread count and material thickness to material breathability (pressure drop across the mask), and particle collection efficiency of the mask by using data generated from different particle sources and tests accomplished with the Excel tool. The student does added research to explore other materials and provides an effective comparison.
The student is able to connect the material properties of thread count and material thickness to material breathability (pressure drop across the mask), and particle collection efficiency of the mask by using data generated from different particle sources and tests accomplished with the Excel tool.
The student connects the material properties of thread count to particle collection efficiency, but misses other connections.
Creating value integrating/ synthesizing different kinds of knowledge
Written Assignment
The student proposes the design of new mask structures, taking the data gathered and trends observed from use of the Excel simulation as well as additional data (e.g. cost, cleaning methods that may change material properties, etc.) that may influence the functionality of the material. The student acknowledges these elements and attempts to account for them in a sustainable design.
The student proposes the design of new mask structures, taking into account extensive data gathered or trends obtained from the Excel simulation and includes material cost. Basic attempts at considering sustainability are considered.
The student proposes the design of new mask structures, taking into account only one trends obtained from the Excel simulation (e.g. the effect of varying the thickness). No sustainability or cost analyses are considered.
As mentioned, the assessment process is ongoing as of the writing of this manuscript.
14
Acknowledgements Author JA gratefully acknowledges the Arizona State University KEEN program, including the Robust Entrepreneurial Mindset Leaders program for support. References (1) Lichtenstein, G.; Collofello, J. S. Infusing Entrepreneurial Mindset Into Engineering
Education: Five Strategies for Implementation Success. In IMECE2020; Volume 9: Engineering Education, 2020. https://doi.org/10.1115/IMECE2020-24644.
(2) Gorbunov, B. Aerosol Particles Generated by Coughing and Sneezing of a SARS-CoV-2 (COVID-19) Host Travel over 30 m Distance. Aerosol Air Qual. Res. 2021, 21 (3), 200468–200468. https://doi.org/10.4209/aaqr.200468.
(3) Gupta, J. K.; Lin, C.-H.; Chen, Q. Flow Dynamics and Characterization of a Cough: Flow Dynamics and Characterization of a Cough. Indoor Air 2009, 19 (6), 517–525. https://doi.org/10.1111/j.1600-0668.2009.00619.x.
(4) Lee, J.; Yoo, D.; Ryu, S.; Ham, S.; Lee, K.; Yeo, M.; Min, K.; Yoon, C. Quantity, Size Distribution, and Characteristics of Cough-Generated Aerosol Produced by Patients with an Upper Respiratory Tract Infection. Aerosol Air Qual. Res. 2019, 19 (4), 840–853. https://doi.org/10.4209/aaqr.2018.01.0031.
(5) Li, L.; Niu, M.; Zhu, Y. Assessing the Effectiveness of Using Various Face Coverings to Mitigate the Transport of Airborne Particles Produced by Coughing Indoors. Aerosol Sci. Technol. 2021, 55 (3), 332–339. https://doi.org/10.1080/02786826.2020.1846679.
(6) Asadi, S.; Wexler, A. S.; Cappa, C. D.; Barreda, S.; Bouvier, N. M.; Ristenpart, W. D. Aerosol Emission and Superemission during Human Speech Increase with Voice Loudness. Sci. Rep. 2019, 9 (1), 2348. https://doi.org/10.1038/s41598-019-38808-z.
(7) Rizki, S. A.; Kurniawan, A. Efficacy of Cloth Face Mask in Reducing Covid-19 Transmis s Ion: A Literature Review. Kesmas 2020, 15 (2), 43–48. https://doi.org/10.21109/KESMAS.V15I2.3893.
(8) Hinds, W. C. Aerosol Technology: Properties, Behavior, and Measurement of Airborne Particles, 2nd ed.; Wiley: New York, 1999.
(9) Tebyetekerwa, M.; Xu, Z.; Yang, S.; Ramakrishna, S. Electrospun Nanofibers-Based Face Masks. Adv. Fiber Mater. 2020, 2 (3), 161–166. https://doi.org/10.1007/s42765-020-00049-5.
(10) Maggiore, E.; Tommasini, M.; Ossi, P. M. Propagation in Outdoor Environments of Aerosol Droplets Produced by Breath and Light Cough. Aerosol Sci. Technol. 2021, 55 (3), 340–351. https://doi.org/10.1080/02786826.2020.1847247.
(11) Chao, C. Y. H.; Wan, M. P.; Morawska, L.; Johnson, G. R.; Ristovski, Z. D.; Hargreaves, M.; Mengersen, K.; Corbett, S.; Li, Y.; Xie, X.; Katoshevski, D. Characterization of Expiration Air Jets and Droplet Size Distributions Immediately at the Mouth Opening. J. Aerosol Sci. 2009, 40 (2), 122–133. https://doi.org/10.1016/j.jaerosci.2008.10.003.
(12) Tcharkhtchi, A.; Abbasnezhad, N.; Zarbini Seydani, M.; Zirak, N.; Farzaneh, S.; Shirinbayan, M. An Overview of Filtration Efficiency through the Masks: Mechanisms of the Aerosols Penetration. Bioact. Mater. 2021, 6 (1), 106–122. https://doi.org/10.1016/j.bioactmat.2020.08.002.
(13) Wen, Z.; Yu, L.; Yang, W.; Hu, L.; Li, N.; Wang, J.; Li, J.; Lu, J.; Dong, X.; Yin, Z.; Zhang, K. Assessment the Protection Performance of Different Level Personal Respiratory

15
Protection Masks against Viral Aerosol. Aerobiologia 2013, 29 (3), 365–372. https://doi.org/10.1007/s10453-012-9286-7.
(14) Xia, T.; Bian, Y.; Zhang, L.; Chen, C. Relationship between Pressure Drop and Face Velocity for Electrospun Nanofiber Filters. Energy Build. 2018, 158, 987–999. https://doi.org/10.1016/j.enbuild.2017.10.073.
(15) Jung, H.; Kim, J. K.; Lee, S.; Lee, J.; Kim, J.; Tsai, P.; Yoon, C. Comparison of Filtration Efficiency and Pressure Drop in Anti-Yellow Sand Masks, Quarantine Masks, Medical Masks, General Masks, and Handkerchiefs. Aerosol Air Qual. Res. 2014, 14 (3), 991–1002. https://doi.org/10.4209/aaqr.2013.06.0201.
(16) Konda, A.; Prakash, A.; Moss, G. A.; Schmoldt, M.; Grant, G. D.; Guha, S. Aerosol Filtration Efficiency of Common Fabrics Used in Respiratory Cloth Masks. ACS Nano 2020, 14 (5), 6339–6347. https://doi.org/10.1021/acsnano.0c03252.
(17) Wilson, A. M.; Abney, S. E.; King, M.-F.; Weir, M. H.; López-García, M.; Sexton, J. D.; Dancer, S. J.; Proctor, J.; Noakes, C. J.; Reynolds, K. A. COVID-19 and Use of Non-Traditional Masks: How Do Various Materials Compare in Reducing the Risk of Infection for Mask Wearers? J. Hosp. Infect. 2020, 105 (4), 640–642. https://doi.org/10.1016/j.jhin.2020.05.036.
(18) Kadi, N.; Karnoub, A. The Effect of Warp and Weft Variables on Fabric’s Shrinkage Ratio. J. Text. Sci. Eng. 2015, 05 (02). https://doi.org/10.4172/2165-8064.1000191.
(19) Ogulata, R. T. Air Permeability of Woven Fabrics. J. Text. Appar. Technol. Manag. 2006, 5 (2), 1–10.
(20) Zangmeister, C. D.; Radney, J. G.; Vicenzi, E. P.; Weaver, J. L. Filtration Efficiencies of Nanoscale Aerosol by Cloth Mask Materials Used to Slow the Spread of SARS-CoV-2. ACS Nano 2020, 14 (7), 9188–9200. https://doi.org/10.1021/acsnano.0c05025.
(21) Rengasamy, S.; Eimer, B.; Shaffer, R.E. Simple Respiratory Protection—Evaluation of the Filtration Performance of Cloth Masks and Common Fabric Materials Against 20–1000 Nm Size Particles. Ann. Occup. Hyg. 2010. https://doi.org/10.1093/annhyg/meq044.
(22) Lustig, S. R.; Biswakarma, J. J. H.; Rana, D.; Tilford, S. H.; Hu, W.; Su, M.; Rosenblatt, M. S. Effectiveness of Common Fabrics to Block Aqueous Aerosols of Virus-like Nanoparticles. ACS Nano 2020, 14 (6), 7651–7658. https://doi.org/10.1021/acsnano.0c03972.
(23) Perumalraj, R. Characterization of Electrostatic Discharge Properties of Woven Fabrics. J. Text. Sci. Eng. 2015, 06 (01). https://doi.org/10.4172/2165-8064.1000235.
(24) Ragab, A.; Fouda, A.; El-Deeb, H.; Abou-Taleb, H. Determination of Pore Size, Porosity and Pore Size Distribution of Woven Structures by Image Analysis Techniques. J. Text. Sci. Eng. 2017, 07 (05). https://doi.org/10.4172/2165-8064.1000314.
(25) Milton, D. K.; Fabian, M. P.; Cowling, B. J.; Grantham, M. L.; McDevitt, J. J. Influenza Virus Aerosols in Human Exhaled Breath: Particle Size, Culturability, and Effect of Surgical Masks. PLoS Pathog. 2013, 9 (3), e1003205. https://doi.org/10.1371/journal.ppat.1003205.
(26) Anfinrud, P.; Stadnytskyi, V.; Bax, C. E.; Bax, A. Visualizing Speech-Generated Oral Fluid Droplets with Laser Light Scattering. N. Engl. J. Med. 2020, 382 (21), 2061–2063. https://doi.org/10.1056/NEJMc2007800.
(27) Imrith, M. K.; Unmar, R.; Rosunee, S. Determination of Knitted Fabric Porosity Using Digital Imaging Techniques. Adv. Mater. Sci. Eng. 2016, 2016, 1–10. https://doi.org/10.1155/2016/6470351.

16
(28) Leonas, K.K.; Jones, C.R. The Relationship of Fabric Properties and Bacterial Filtration Efficiency for Selected Surgical Face Masks. J. Text. Appar. Technol. Manag. 2003, 3 (2), 1–8.
(29) Hill, W. C.; Hull, M. S.; MacCuspie, R. I. Testing of Commercial Masks and Respirators and Cotton Mask Insert Materials Using SARS-CoV-2 Virion-Sized Particulates: Comparison of Ideal Aerosol Filtration Efficiency versus Fitted Filtration Efficiency. Nano Lett. 2020, 20 (10), 7642–7647. https://doi.org/10.1021/acs.nanolett.0c03182.
Supplementary Material Available: The authors have prepared a supplemental folder of files that contains a PowerPoint presentation to introduce the material and Excel – VBA exercises. These files may be used to introduce the concepts in classes and carry out the suggested activities that are outlined in the paper.