Embed Size (px)
Citation preview

MAS 662J: Final Project Sergio Herrero‐Lopez Aithne Sheng‐Ying Pao Rahul Bhattacharyya
THE EFFECT OF SOCIAL INTERACTIONS ON P2P LENDING
Abstract: Peer to peer lending (P2P lending), also known as person‐to‐person lending or social lending, is one of the most traditional ways to borrow money. Nowadays a more and more popular form of P2P lending has been through the Internet, where P2P lending appears in two primary variations: an "online marketplace" model and a "family and friend" model. Prosper.com provides a platform for online P2P lending that allows people not only to manage their loans between friends and family, but also to raise funds from random people, to form groups, and to construct new social networks during the lending process. In this report, a series of clustering and classification techniques were applied to analyze the effect of social capital on P2P lending. Furthermore, the social interaction behavior features were minded from the real life P2P lending data collected on Prosper.com. The analysis revealed the impact of social capital, in comparison to financial profile, on the classification of P2P loan funding successfulness, and also provided a possible guideline for borrowers to increase their chances to get a loan.
I. INTRODUCTION
P2P Lending is based on an online reverse auction where individuals request either to borrow money, taking the Borrower role, or buy loans, taking the Lenders role. Borrowers set the amount of money they need and the maximum interest rate they would be willing to pay by posting a Listing; and lenders bid on their loans partial amounts and set the minimum interest rate they want to receive. P2P Lending users can adopt the borrower role, lender role or both. The main difference with traditional banking industry is that the lender not only has borrower’s financial information available, but they can also evaluate the risk of an operation based on the social characteristics of the individual.
The management of the auction is carried out by the P2P Lending website. It collects and displays listings or bids made by users, and provides a social networking engine that enables users establishing relationships with other users and joining or creating groups across the internet.
The goal of this project in not only to reveal hidden patterns in the behavior of P2P Lending users, but also to confirm or refute a priori obvious behaviors that are often assumed. This work is focused on: (1) the application of different data clustering techniques in order to analyze and validate the underlying distribution of the P2P Lending data; (2) the use of feature selection techniques to rank the relevance of financial and social features; (3) finding a classifier that predicts whether a listing will eventually be funded based on the financial and social profile of the borrower.
The organization of this paper is as follows: Section II introduces the Prosper dataset and its structure, and describes the data preprocessing that had to be applied prior to proceed to the analysis of the information. This section also introduces the common social features of P2P Lending sites. The application of data clustering techniques on P2P Lending data is described in Section III. Section IV analyzes the influence of the Group Rating as a classifying feature. A comparison between social features and financial features is provided in section V. Section VI describes the procedure to obtain new social interaction features. The impact of social interaction features on classification is confirmed in section VII. A selection of classifiers and their performance when predicting borrower’s success is studied in Section VIII. Finally, Section IX includes the conclusions of this project.

II. P2P LENDING DATA a. Dataset Structure
Prosper Marketplace’s database is open for researchers and other financial institutions in order to facilitate the understanding of this innovative financial service. The Prosper relational model is composed by eight tables: Bid, Category, CreditProfile, Listing, Loan, Group, Loan Performance, Marketplace and Member. For this project, Member, Group, Listing and Bid tables were joined in order to have a unique flat representation that could be processed. In order to facilitate the understanding of the different elements a brief description of each of these tables is given:
A Member is a registered user of the P2P Lending site. A member may have one or multiple roles which determine which actions the Member is allowed to perform on the site. A collection of Members who share a common interest or affiliation join into a Group.
A Bid is created when a Lender wishes to lend money to a Borrower in response to a Listing the Borrower created to solicit Bids. Bids are created by specifying an amount and a minimum rate the lender wishes to receive. In order to become a Loan, the Bids need to win the auction.
Borrowers create Listings to solicit bids by describing themselves and the reason they are looking to borrow money. If the Listing receives enough bids by Lenders to reach the amount requested before the Listing period ends it will become a loan.
b. Social components of P2P Lending
This project is specially focused on understanding social interactions in P2P Lending transactions. Next the common social networking components of peer banking are enumerated.
‐ “Friend”: It represents a one‐to‐one link from a member to other borrowers or lenders. This relationship between members is usually based on family, friendship or previous transaction history in Prosper. It is made public and intends to motivate lenders within borrower’s second degree social network to bid based on indirect trust. Similarly, the “Friend” link puts pressure on borrowers to meet their commitments in order not to decrease the credit worthiness of their friends.
‐ “Endorsement”: Members are allowed to give public feedback on previous transactions with other members.
‐ “Group”: Members are allowed to form communities. Group members help each other and the "group rating" depends on their performance. The trust among group members not only facilitates creating successful listings, but also generates peer pressure on colleague borrowers to force them have an appropriate loan performance. Groups are managed by group Leaders who bring borrowers to the P2P Lending site, maintain the presence of the group in the site, and collect or share group rewards. Borrowers who are members of a group often get better interest rates because Lenders tend to have more confidence in Borrowers that belong to trusted groups.
Figure 1 shows the amount that a listing managed to collect classified by the "group rating" of the
group that the borrower belongs to and the number of friends that the borrower has. The largest concentration is located in the low values of percent funded of groups ratings 0 and 1 and few friends. Simple statistics indicate that the social networking features are not often used, since 88% of the members have no friends and 80% belong to groups with rating 0.

c. Data Preprocessing and Feature Selection:
The Prosper dataset contains all the transaction and member data since its creation in November 2005. This is a considerable volume on information that encloses approximately 6M bids, 900K members, 4K groups and 350K listings. In order to facilitate the analysis of the data, the dataset was scaled down to contain all the listings created in calendar year 2007, the bids created for these listings, the set of members that created these listings and bids, and finally, the groups these members are affiliated with. The filtering resulted in considerable reduction of the dataset: 1.5M bids, 74K members, 2K groups and 93K listings. The reason to reduce the dataset based on the listing creation date is because it allows having a snapshot of the entire dataset without losing information on the activity and interactions between members.
In order to analyze the P2P Lending data, it was necessary to remove unnecessary features and encode some of the remaining into numerical values. Features related with time, geolocation and personal descriptions were ignored for this study, while financial features like the credit grade, which is graded from AA to E, were transformed to numerical scales. Similarly, "group rating"s (0‐5 stars) and home ownership (0‐1) indicators were encoded into numbers.
It is considered that descriptive features can have relative relevance for lenders when evaluating the risk of a listing. Nevertheless, the quantitative evaluation of a descriptive feature is not considered in this work.
There is a previous research in Prosper’s dataset that carried out feature selection and analyzed the regression model and correlation between variables [1]. In this paper, different feature selection
Figure 1: Percent Funded function of "group rating" and #Friends

algorithms were applied to confirm or refute those results and reveal new findings. Next, a succinct description of the features analyzed in subsequent sections is provided:
‐ Max Borrower Ratio: Maximum interest the borrower is willing to pay if the listing becomes a loan.
‐ Final Borrower Ratio: The final interest that the borrower will pay if the listing becomes a loan. ‐ Amount Requested: Amount that the borrower requests to the lender community. ‐ Credit Grade: Borrower’s credit grade. It goes from 7 (best) to 1(worst). ‐ Debt To Income Ratio: Comparison of borrower’s debt to its income. ‐ Homeowner: Indicates whether the borrower owns its home. True/False. ‐ Group Leader’s Reward Rate: The rate the group leader gets if a group member borrows
money. ‐ # Endorsements: Number of positive endorsements received by the borrower requesting the
loan. ‐ # 1st Degree Friends: Number of direct friends of the borrower requesting the loan. ‐ # 2nd Degree Fiends: Number of indirect friends of the borrower requesting the loan. ‐ # Group Members: Number of users in the group that the borrower is affiliated with. ‐ Group Rating: Quantitative evaluation of the performance of the group given by Prosper based
on the transaction history. 5 (best) to 0 (worst). ‐ Total # of Bids: Number of bids a listing receives during the auction. ‐ Percent funded: Fraction of the total amount that the borrower managed to collect during the
lifetime of the listing. Listings with 90% funded or above are considered “successful listings”, while the rest are “failed listings”.
III. P2P LENDING DATA CLUSTERING
In order to analyze the distribution of the P2P Lending dataset two different clustering techniques
were applied: Gaussian Mixture Models (GMM) and K‐Means clustering. The results shown in the next subsections correspond to the mean vectors obtained after the execution of the GMM technique. The covariance matrices are omitted for simplicity but are available upon request. The application of the K‐Means clustering technique does not intend to find additional hidden patterns in the data, but to validate the results obtained by GMM.
a. Gaussian Mixture Models:
The application of Gaussian Mixture Models follows the approach described by M. Figueiredo and A. Jain in [2]. This method not only applies the standard Expectation‐Maximization (EM) to find the optimum parameters of the Gaussian model, but also is capable of selecting the best number of components of the mixture model. The number of Gaussians is selected based on a tradeoff between the fit of the model to the data (log‐likelihood) and the complexity of the mixture (number of Gaussians). In order to facilitate the understanding of the clusters generated by the EM algorithm, this analysis limited the Gaussians to have diagonal covariance matrices. The initialization method follows an uninformative (high entropy) called random starting.
Each column in the tables of Figures 2, 3 and 4 represents a Gaussian. The probability of the cluster is indicated on the top, along with the values of the mean vector for each of the Gaussian models. The individual values of the mean vectors are color‐coded to represent its grade of attractiveness for lenders. Green denotes attractive, while red represents repelling for lenders to risk their money.

Initially, the clustering algorithm is going to be applied to the entire 2007 dataset aiming to find two groups: “successful listings” and “failed listings”. Once that this groups are found, the clustering algorithm is going to be applied in each of this subsets in order to obtain the characteristics that best define each of these groups.
‐ Clustering on the entire 2007 data:
The clustering algorithm found three clusters as shown in Figure 2, two of which represent the “failed listings” and enclose 90% of the occurrences; and the other the “successful listings”, which represents 10% of the listings posted. Simple inspection of the values of the means for each cluster indicates that being affiliated to a group with high rating and having a low debt to income ratio are determinant factors to attract more bids and eventually get the listing completely funded. Besides, it can be seen that being a home owner, having endorsements and friends are in the background. It is interesting to see that some loan requests, even if they offer attractive interests and carried out by people with high credit grades, do not attract the interests of the lender community.
It has been determined that "group rating" and the # of bids are determinant variables for the definition of the clusters. Therefore, these two variables are considered the best to be used to divide the entire dataset into subsets. "group rating" separates “Trusted/Exclusive Group Listings” from “Open Group Listings”, while # of bids divides “Active Listings” groups from “Passive Listings” groups. Next, the clustering algorithm is going to be applied on each of these subsets so as to find their defining characteristics.
‐ Clustering on “Active Listings”: # of bids > = Avg(# of bids)
The average number of bids for all the listings generated in 2007 is 17. Therefore, the entire dataset is filtered to keep only those listings that received more than 17 bids, and consequently created significant activity in Prosper.
The clustering algorithm found six clusters that are described in the left table of Figure 3. Approximately 82% of the listings that received more than 17 bids were successful. The "group rating" is shown to be a determinant factor for the success of the listing. This is confirmed by the outcome of Clusters 1 and 2, in which low "group rating" is the cause of these listings to be cancelled. Specifically,
Figure 2: Clustering on entire 2007 data

Cluster 1 shows that presenting a good offer but out of any of the trusted groups does not usually lead to getting the loan.
The most prominent concentration, Cluster 4, represents the general case when all the features are attractive for lenders. In this cluster, high "group rating", low debt, good credit score and good high interest rates are offered.
Clusters 3 and 6 are examples in which being strong in some features helps overcome other weak characteristics. For example, a high debt to income ratio is concealed by having several endorsements and first degree friends in cluster 3; furthermore, not having collateral can be overcome by offering a high interest and a good credit profile as in cluster 4.
Cluster 5 leads to one of the most important conclusions, which are also the basis of P2P Lending: Being member of a highly trusted community facilitates getting a loan for members that a priory should be classified as non‐bankable. In this case, low interest and low credit grades are easily assimilated by the members of the community.
‐ Clustering on “Passive Listings”: # of bids < Avg(# of bids)
The opposite situation, the case in which the number of bids is less or equal to 17 provides a completely different result, as shown in the right table of Figure 3. Offering an interesting interest rate and a high credit grade do not guarantee getting the loan fully funded. Besides, being affiliated to a low rating group is a common characteristic of those listings that receive fewer bids than the average.
‐ Clustering on “Trusted Group Listings”: "group rating" > 1
Figure 3: Clustering on data divided by #bids
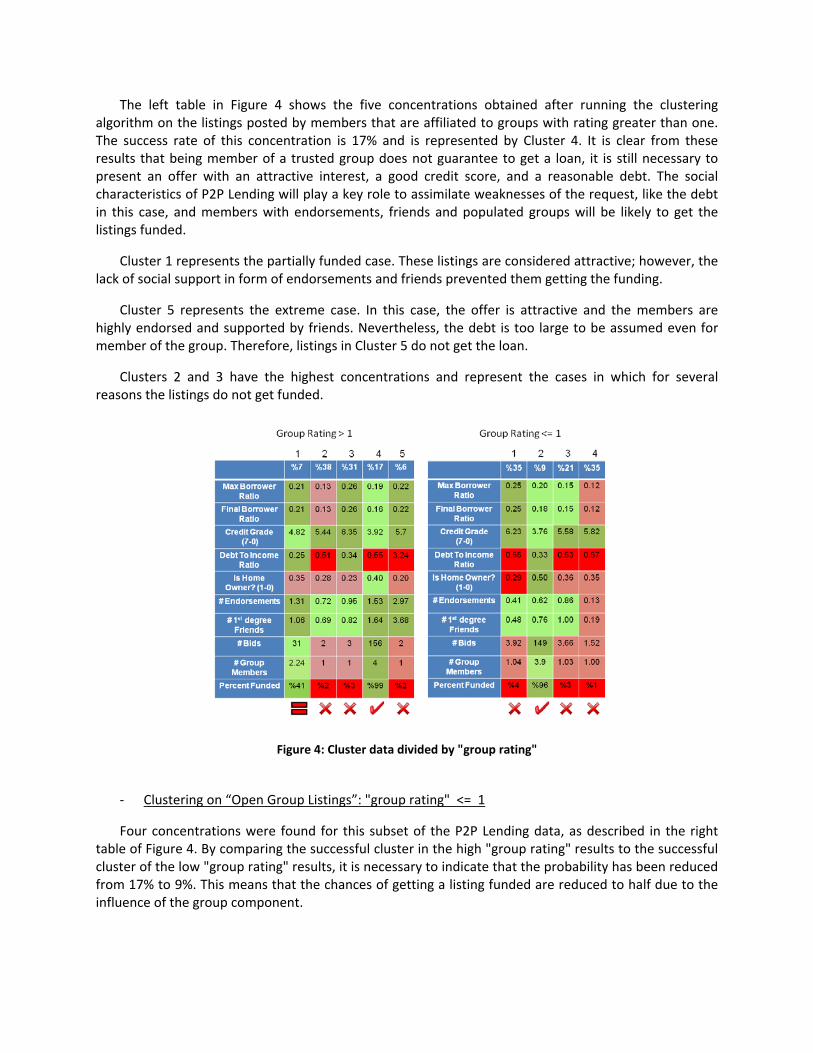
The left table in Figure 4 shows the five concentrations obtained after running the clustering algorithm on the listings posted by members that are affiliated to groups with rating greater than one. The success rate of this concentration is 17% and is represented by Cluster 4. It is clear from these results that being member of a trusted group does not guarantee to get a loan, it is still necessary to present an offer with an attractive interest, a good credit score, and a reasonable debt. The social characteristics of P2P Lending will play a key role to assimilate weaknesses of the request, like the debt in this case, and members with endorsements, friends and populated groups will be likely to get the listings funded.
Cluster 1 represents the partially funded case. These listings are considered attractive; however, the lack of social support in form of endorsements and friends prevented them getting the funding.
Cluster 5 represents the extreme case. In this case, the offer is attractive and the members are highly endorsed and supported by friends. Nevertheless, the debt is too large to be assumed even for member of the group. Therefore, listings in Cluster 5 do not get the loan.
Clusters 2 and 3 have the highest concentrations and represent the cases in which for several reasons the listings do not get funded.
‐ Clustering on “Open Group Listings”: "group rating" <= 1
Four concentrations were found for this subset of the P2P Lending data, as described in the right table of Figure 4. By comparing the successful cluster in the high "group rating" results to the successful cluster of the low "group rating" results, it is necessary to indicate that the probability has been reduced from 17% to 9%. This means that the chances of getting a listing funded are reduced to half due to the influence of the group component.
Figure 4: Cluster data divided by "group rating"

There are two features that differentiate success stories in this subset to the failed cases. Low rating groups are usually open to new members to join and consequently these are highly populated. The trust of exclusive groups is not a component to consider anymore, and lenders show to be more conservative than in the previous case.
Success stories show that only low debts are accepted in this scenario, along with some collateral. The results show that is also important to be affiliated to highly populated groups to attract more bids.
b. K‐Means Clustering:
For the K‐Means Clustering algorithm, the number of clusters k obtained for the GMMs was used. The distance measure used is Squared Euclidean distance, and the initialization chooses k random observations from the dataset.
Parallel to the GMM, K‐Means is applied in each of the reduced datasets “Trusted/Exclusive Group Listings”, “Open Group Listings”, “Active Listings” and “Passive Listings”.
The conclusions obtained from K‐Means clustering are the same as for the GMM clustering. The results are provided upon request.
IV. "GROUP RATING" IN P2P LISTING CLASSIFICATION
According to the clustering results, "group rating" is determinant to get a loan funded. When a borrower is in a “trusted group”, he or she got almost twice the chance to get the loan greater than 95% funded. Is "group rating" a crucial factor determining whether a loan is successful? To answer this question, "group rating" was used to classify whether a loan is successfully funded. On Prosper, only loans 100% funded is considered successful. If a loan is not 100% funded, the borrower would not get any money. The data used here is year 2007 data from Prosper.com, which has 87631 listings of loans in total. The dataset is divided into two ‐‐ class one is successful loans, which are loans got 100% funded, class two are loans less than 100% funded. Same number of samples was selected from both classes. For each class 80% of the data were sampled as training dataset, and 20% were sampled as testing dataset.
First, a Generalized Linear Discriminant (GLD) in conjunction with the pseudoinverse technique was used to the binary classification. The degree k is estimated using leave‐one‐out validation. By choosing the maximum number of times the sample left out was correctly classified, the degree k=7 is obtained (Figure 5). The performance of GLD is 63%. It was further compared with the performance of two other classifiers, Fisher’s linear discriminant and K‐Nearest Neighbors. The accuracies are close to that of LDA, approximately 63% (Table 1).
Table 1: Classification accuracy using ""group rating"" as the feature
classifier Performance
LDA (k=7) 0.6300

Fisher’s 0.6399
KNN (k=6127) 0.6231
Figure 5: Estimate the degree k in GLD by computing the evidence curve. v(k) denotes the maximum number of times the sample left out was correctly classified.
V. SOCIAL FEATURES V.S. FINANCIAL FEATURES IN P2P LISTING CLASSIFICATION
Using only the "group rating" feature does not yield a very good performance in classifying whether a loan is successful. Would more features help increase the classification performance? In order to see the impact of social capital on getting founded or not, we divided the P2P lending features into two sets: (1) social profile and (2) financial profile (Table 2), and compared the classification performance using different feature sets.
Fisher’s linear discriminant, K‐Nearest Neighbors, and Naïve Bayes were applied to each of the sets
and to the combination of all the features. The training sets and testing sets contain the same number of samples for each class. For all methods, 80% of samples were used for training and 20% for testing. To clearly show the impacts from social features and financial features, we exclude the "total number of bids" from the features considered in the following analysis, due to the fact that "total number of bids" dominate the classification performance (see section VII). The results of the performance using three different classification algorithms based on three different sets of features are shown in Table 3. The following observations were drawn from the results:
First, comparing the performance of using all the 6 social features with the performance of using
only "group rating", there is no significant improvement. The classification accuracy is still around 64% (Table 1 and Table 3.Table 2)

Second, comparing the financial features with the social features, the classification performance is
better when using financial features (Table 3.) Third, considering all features, the performance is better than using social features. However, it is a
little bit worse than using only the financial features (Table 3.) The above observations are consistent across different classification algorithms applied here. The
results showed that:
• Financial profiles play a more important role than social profiles in deciding whether a listing will succeed.
• Adding more features doesn’t ensure better classification performance. However, comparing the performance of using all features with using only financial features, it
showed that social features damped the classification accuracy. However, it is also possible that the social profiles do not reflect real social interaction behavior in getting a loan through peer‐to‐peer lending platforms. To further see the impact of social capital on lending, features which represent social interactions are needed. Next section explains "social profile" features, "social interaction" features, and their impact on peer‐to‐peer lending.
Table 2: Two sets of features: Social Profile features and Financial Features
Social profile features Financial features
Group Leader Reward Rate
Endorsement Number
First Degree Friend Number
Second Degree Friend Number
group rating
Group Size
Borrower Maximum Rate
Credit Grade
Debt To Income Ratio
Amount Requested
Is Borrower Homeowner
Table 3: Classification performance using different feature sets
All
features
Social Profile
features
Financial
features
Fisher's 0.7035 0.64 0.7129

KNN 0.6889
(k=3)
0.6405
(k=1)
0.6998
(k=7)
Naïve Bayes 0.6781 0.6395 0.6791
VI. SOCIAL INTERACTION FEATURES IN P2P LOAN CLASSIFICATION
The social profile features provided in Table 2 represent the information and status of the social network that a borrower belongs to. However, it does not reflect the social interaction behavior among members.
Hence, more meaningful social features which represent social interaction activities on peer‐to‐peer lending were mined from raw data. These new social features are “three bidding forces” ‐‐ 1) the number of bids from first degree friends, 2) the number of bids from second degree friends, and 3) the number of bids from group members. All of them were normalized by the total number of bids on the corresponding listing of loan.
The three bidding forces are added to the original "social profile" feature set. The new social feature set is named “social interaction" features. Same classification algorithms were applied using the new feature configuration. Table 4 shows the classification performance using different feature sets. “Social profile” is the same feature set used in the previous section, and “social interaction” contains three bidding forces. Adding the three bidding forces to the social features improved the performance for all classifiers, both when applied to social‐feature set and to all‐feature set. Comparing the performance of all features and financial features, "social profile" feature set damped the classification performance, but "social interaction" feature set rescued the performance.
Table 4: Classification Performance using different feature sets
All
features
Social
features
Financial
features
Fisher's Social Profile 0.7035 0.6400 0.7129
Social Interaction 0.7724 0.6810 0.7129
KNN Social Profile 0.6889 0.6405 0.6998
Social Interaction 0.7639 0.6988 0.6998
Naïve Bayes Social Profile 0.6781 0.6395 0.6791
Social Interaction 0.7898 0.6674 0.6791

The results imply that the social interaction behaviors (bid on by friends or group members), have greater influence than the social profiles. However, social features, comparing to financial features, are still not determinant in classifying whether a loan is successful. Financial features are the first consideration in peer‐to‐peer lending, and social interaction behavior add marginal improvement.
VII. FEATURE SELECTION IN P2P LISTING CLASSIFICATION
To further see what factors are important in deciding whether a loan is successful, we applied Pudil's forward floating feature selection (SFFS) algorithm [3]. 14 features were considered, including financial features, social profiles features, and the three bidding forces. The optimal feature sets based on forward floating feature selection and the performances using Fishers’s linear discriminant classifier, K‐Nearest Neighbors classifier, and Naïve Bayes classier are listed in Table 5. The results from Fishers’s linear discriminant and K‐Nearest Neighbors classifier are consistent. They both chose a small number of features and achieve over 90% accuracy. Similar feature sets were selected for both classifiers, where "total number of bids" and "amount requested" are ranked the highest. The most important social feature is "bids from first degree friend". Naïve Bayes classifier chose 11 features and the performance is lower than the other two algorithms. Similarly, "total number of bids" and "amount requested" are still dominant. As for the social features, Naïve base selected more social features than Fisher’s and KNN. Note that all of them selected one of the three bidding forces, “bids from first degree friends,” which is also the only social feature selected in Fisher’s linear discriminant optimal set. The least ranked social feature is "group leader reward rate." The result showed that "bids from first degree friends" is a relatively the most determinant social feature.
"Total number of bids" is a very determinant feature in classifying loan successfulness. Taking "total number of bids" as the only feature, Fisher’s discriminant classifier reached 80.1% accuracy, and KNN reached 91% accuracy. Unlike other factors, the total number of bids is not a factor that are available in the begging when borrowers posting a loan. In addition, it is unlike other social interaction features that a borrower can control. We excluded "total number of bids" in the rest of our analysis, although it is the major feature that optimizes the classification performance.
When excluding "total number of bids", the optimal feature sets that were selected became larger, wherein 8 to 9 features were selected for all the three classifiers. The results for the three classifiers were consistent in selecting all the financial features, among which, "credit grade" is ranked the highest. As for social features, all the three classifiers selected the three bidding forces. Other social features selected were "group rating" and "number of second degree friends". None of them chose "group leader reward rate" and "group size."
Interestingly, when adding the features "number of first degree friends," the performance of all
three classifiers dropped. Meanwhile, all the three bidding forces were selected for fisher's linear discriminant classifier and KNN, and two of them are selected for Naïve Bayes, which are "bidding by first degree friends" and "bidding by group members." The results again emphasize the importance of social interactions," rather than social "profiles." Number of friends listed on a borrower's social profile increases the noise when classifying the loan successfulness. The bidding behavior from friends and

group members reflects the actual social interaction activities, rather than having many first‐degree friends listed on a borrower's profile. These bidding forces, combining with financial profile, play a more important role in determining whether a borrower will get founded.
Table 5: Optimal Feature sets and classification performance based on SFFS. Social features are listed in red.
Classifier Performance # of features Optimal feature sets
Fisher's 94.3% 4
Total Number Of Bids Amount Requested Debt To Income Ratio Bids From First Friends
KNN 97.67% (k=1)
5
Total Number Of Bids Amount Requested Bids From First Friends Credit Grade Group Rating
Naïve Bayes 82.7% 11
Credit Grade Total Number Of Bids Borrower Maximum Rate Amount Requested Bids from Group Member. Group Rating Endorsement Number Bids Of First Friends First Degree Friend Num Second Degree Friend Number Debt To Income Ratio
VIII. P2P LISTING CLASSIFICATION:
The purpose of this section is to find a binary classifier that predicts whether a listing will eventually become a loan based on borrower’s financial and social profile. For this task, only those features that are available at the beginning of the auction are considered. Consequently, features like the final borrower rate, the number of bids received and the percent funded, that are highly correlated to the listing outcome and are not available at the beginning of the auction, should not be considered for classification.
In this section two different experiments were performed: 1) Binary classification based on the status (Success/Failed) of the listing provided by Prosper. 2) Binary classification based on the percentage funded of the listing (High/Low).
a. Prior Listing Distributions
Most of the algorithms tested in this study attempt to solve a 2 class classification problem. The prosper data set is then partitioned to obtain datasets containing sample points for the two classes being considered. Very frequently in our analysis, it was noticed that the number of data points in one

class far outnumber the number of data points in the second class. Assuming a cross section across the year 2007, the following cases serve as interesting illustrations:
• The number of listings of people belonging to groups with rating 1 is about 17 times the number of listings of people from groups with rating 5.
• Listings which are less than 25% funded outnumber those that are more than 25% funded 7.3:1.
• Listings which successfully become loans constitute 90% of the listings actually posted on Prosper.
It is therefore important to note that the data is skewed more towards listings that remain unfulfilled, for people that do not belong to any strongly rated group and for listings that do not attract many bids. This could pose a problem in analysis. For example in a 2 class problem where one of the classes consists of unfulfilled listings the results of analysis will be deceptively good as the classifier will merely classify a test case as “unsuccessful” simply because of the skewed prior preference towards this class.
Since our analysis focuses more on socio‐financial features, understanding the underlying relative weight of the sample points from the 2 classes being considered is crucial – especially if the discrimination is between poorly performing listings and successful listings. It is essential to consider data filtering techniques that ensure that the number of sample data points in the 2 classes is more or less equivalent (within the same order of magnitude).
b. Success Failed Binary Classification
For this task, two methods where considered: Soft Margin SVM with different kernels and K‐Nearest Neighbor. These classifiers were applied for each of the datasets considered in section III. The training and testing datasets contain the same number of samples for each class. For both methods 80% of samples were used for training and 20% for testing.
‐ Soft‐Margin Support Vector Machine:
In order to solve the SVM efficiently Sequential Minimal Optimization (SMO) algorithm was used. Four different kernels were applied: Linear, Quadratic, 3rd Degree Polynomial and Gaussian Radial Basis Function with sigma of 1. No fraction of the variables was allowed to violate Karush‐Kuhn‐Tucker (KKT) conditions. The results are shown in Table 6.
‐ K‐Nearest Neighbor
For each of the datasets, the algorithm runs from k=1 to k=31 only considering odd values of k, to avoid “ties” between the classes that the neighbors belong to. For each dataset, the value of k that minimizes the training error was chosen. The results are available in Table 6.
Table 6: Classifier Performance
Dataset Method Kernel K Correct Rate Confussion Matrix
Entire 2007 Soft Margin Linear x 0.83 943 156
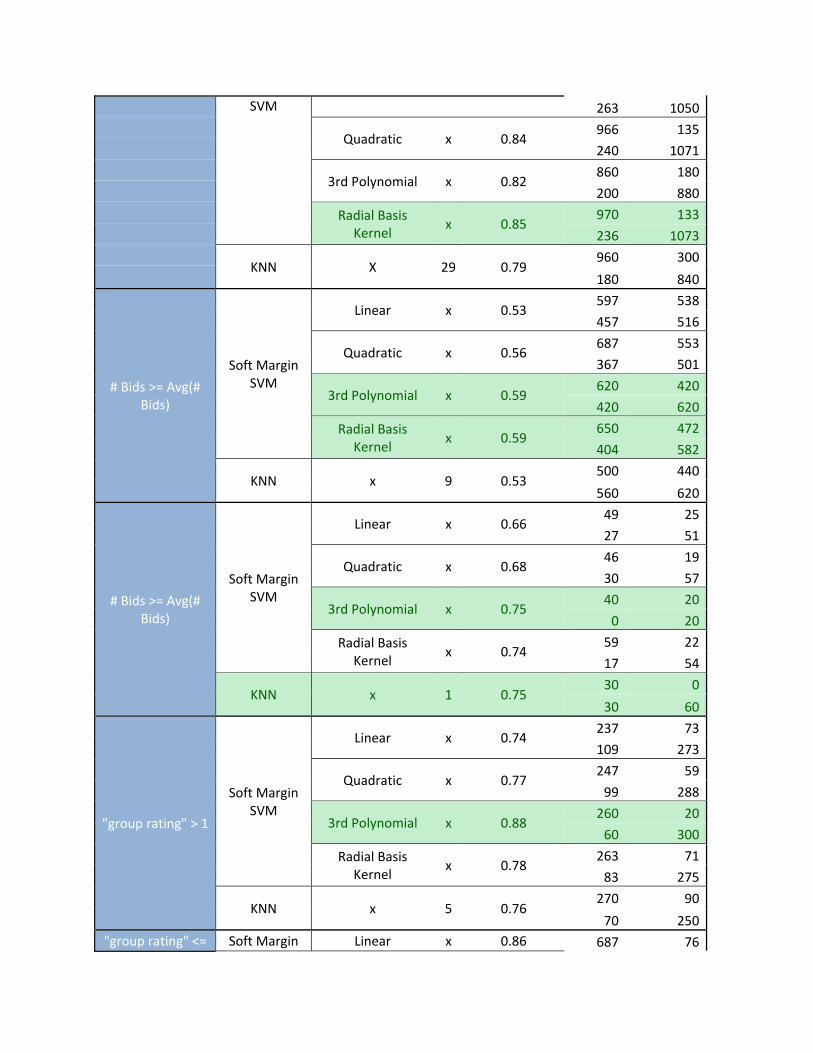
SVM 263 1050
Quadratic x 0.84 966 135
240 1071
3rd Polynomial x 0.82 860 180
200 880
Radial Basis Kernel
x 0.85 970 133
236 1073
KNN X 29 0.79 960 300
180 840
# Bids >= Avg(# Bids)
Soft Margin SVM
Linear x 0.53 597 538
457 516
Quadratic x 0.56 687 553
367 501
3rd Polynomial x 0.59 620 420
420 620
Radial Basis Kernel
x 0.59 650 472
404 582
KNN x 9 0.53 500 440
560 620
# Bids >= Avg(# Bids)
Soft Margin SVM
Linear x 0.66 49 25
27 51
Quadratic x 0.68 46 19
30 57
3rd Polynomial x 0.75 40 20
0 20
Radial Basis Kernel
x 0.74 59 22
17 54
KNN x 1 0.75 30 0
30 60
"group rating" > 1
Soft Margin SVM
Linear x 0.74 237 73
109 273
Quadratic x 0.77 247 59
99 288
3rd Polynomial x 0.88 260 20
60 300
Radial Basis Kernel
x 0.78 263 71
83 275
KNN x 5 0.76 270 90
70 250"group rating" <= Soft Margin Linear x 0.86 687 76

1 SVM 173 784
Quadratic x 0.87 709 81
151 779
3rd Polynomial x 0.95 680 20
60 720
Radial Basis Kernel
x 0.87 707 69
153 791
KNN x 9 0.87 640 100
90 630
c. High/Low Level funded Binary Classification
The previous analysis has shown that financial features are the most important criterion in deciding whether a listing becomes a loan. If a fixed set of financial features is given, social interaction variables further help to boost the chance of success of a loan.
It would be worthwhile to determine whether a person should be motivated to attempt and seek out a loan on prosper given his / her financial or social characteristics. In this study, it is assumed that posting a listing on prosper would be worthwhile if it is likely to be more than 75% funded.
This problem was solved using a 2 class approach: o Class 1: Based on the person’s social and financial characteristics, the predictor
algorithm states that the person’s listing would be less than 75% funded (it is assumed that a person would be interested in posting a listing to prosper if he/she knows the listing would attract more than 75% funding)
o Class 2: The predictor states that the person’s listing would attract more than 75% funding. It would thus be worthwhile to post a listing to Prosper since there is a good chance it may receive full funding.
The performance of a number of different algorithms is compared in the prediction analysis to test for consistency of the results. It is noted that the criterion of more than 75% funding is arbitrary ‐ higher funded listings tend to have more activity in the number of bids they receive and it is conceivable that such listings could potentially attract enough funding to become a loan.
The goal of this section is to predict the attractiveness of a listing based on social and financial features. Most of the prediction algorithms involve a training phase – where they are trained on random samples obtained from the dataset, followed by a testing phase ‐ where the accuracy of the classifier is mapped using random test samples obtained from the data set.
The following financial features are considered in forming the discriminant function / as inputs to the training algorithm:
• Borrower Rate

• Credit Grade
• Debt / Income Ratio
• IsBorrowerHomeOwner (collateral)
The following are the social features included in the discriminant function / as inputs to the training algorithm:
• "group rating"
• Number of members in the group
• Number of first degree friends
Listings less than 75% funded (class1) are far more than the number of listings which are more than 75% (Class 2) funded (by a factor of 5). Hence, it was necessary to implement filtering algorithms to ensure the data is not biased to the first class. The filtering algorithms used are:
• Filter 1: Randomly select equal number of random samples from the datasets from both classes.
• Filter 2: Select only those samples on which there is some activity – in this case we choose only those samples which have more than 5 bids as the ratio then become approximately 1.
‐ Use of ANN in predicting whether a loan attracts >75% funding
Several variations of a back propagation ANN were tried to train and then test the data. Table 7 presents the results for the 2 types of filtering mechanisms. The ANN to classify whether given stats a person could attract 75%+ funding: Class1 < 75% points and Class2 > 75%
Table 7: ANN Classification Accuracy with different learning parameters
Filter 1 Filter 2 Num of layers
# of nodes LR
Training Algo
Transfer Fn CM
% Correct
CM
% Correct
2 4 0.07 GDM TanSig
134 65 63.8
285
215 64.5
116
185
140
360
2 4 0.15 GDM TanSig
159 75 66.8
331
169 64.4
91175
187
313
2 4 0.3 GDM TanSig 113 41 64.4
290
210 64.6
137
209
144
356

2 4 0.01 GDM TanSig
247
245 50.4
316
184 60.8
3 5 208
292
3 4 0.12 GDM TanSig
179
134 59
328
172 65.4
71116
174
326
3 4 0.12 GDM PureLin
250
249 50.2
157
343 58.8
0 1 69 431
Comments:
• An optimal learning rate (for the GDA learning algorithm) exists – in this case about 0.15. A learning rate which is too low or too high gives worse results.
• The results vary between 50‐67% giving a best classification performance of 67% (summing diagonal members of confusion matrix CM)
• Adding more layers need not significantly boost the performance.
• Filtering by BidCount>5 tends to provide better results (sometimes marginally and sometimes as high as 10%).
‐ Use of Linear Discrimminant Analysis
A linear discriminant (LDA) is used next for the 2 class classification study. The input vector consists of a linear combination all 7 features listed above and the number of training and testing samples is shown in Table 8. LDA to classify the probability of getting percent funded > 75% based, class 1 <75% funded, Class 2 > 75% funded.
Table 8: Performance of LDA
Testing Training CM % acc CM % acc 2500 1000 339 161 66.7 345 155 64.9
172 238 196 304 2500 500 160 90 64.8 164 86 61

86 164 109 141 3500 250 76 49 62 80 45 63.2
46 79 47 78 2500 2500 862 388 67.16 841 409 61.72
433 817 548 702
Observations:
• Increasing the #training/#testing ratio does not significantly improve the classification accuracy
• Similarly decreasing the ratio does not significantly reduce the accuracy either.
• The performance accuracy averages in the lower 60% which is similar to the results from the ANN analysis
‐ Use of KNN in classification
KNN is used as our classifier for the 2 class problem. Since all 7 features are included, the Euclidian Distance generalized for N dimensions is used in our calculation of “nearest neighbor”
Where n =7 in our case
The number of training and testing samples is varied and the results for both types of filters are shown in Table 9. For Training 1000 samples were used, testing 200 samples.
Table 9: KNN Performance
Filter 1 Filter 2 % Accurate Class % Accurate Class
64 1 52 165 2 60 2
Training 400 Testing 100 % Accurate Class % Accurate Class
62 1 56 158 2 62 2

Training 200 Testing 100 % Accurate Class % Accurate Class
50 1 46 162 2 58 2
Training 750 Testing 200 % Accurate Class % Accurate Class
60 1 71 158 2 59 2
Observations:
• Here too the classification accuracy varies between 50‐65% (with one exception for class 1 classification with filter 2 that gives 70% recognition accuracy).
• KNN is prohibitively time consuming for number of training samples exceeding 1000, although the effect of increasing the number of training samples does not seem to significantly boost the results
‐ Classifier comparison:
The prediction algorithms had a wide range of performance efficiencies. We summarize the important findings here:
• ANN : The ANN gave the best classification accuracy of about 67% with a variation between 50‐67% depending upon the network parameters. The following observations are important:
o There exists an optimal learning rate for the Steepest Descent Algorithm. Too fast or too slow gives worse results
o More hidden layers need not give better results
• LDA : The LDA gave best performances in the lower 60%’s. The discriminant function used was a simple linear combination of all 7 features. It is possible that improving the form of this discriminant would boost the results. Further we see that increasing or decreasing the ratio of number of training to number of testing samples did not affect the efficiency of classification much
• KNN : We have assumed a 7‐Dimensional Euclidian Norm as the distance criterion. KNN tends to be very computationally intensive which severely restricts the number of samples that can be taken for training and testing. The algorithm is run several times (10) to check for consistency of the classification results in this case. We note that increasing the number of training samples does boost classification efficiency, but the marginal improvement is not worth the trade off of computational time.
• While the classification efficiencies of all 3 algorithms are not as good as hoped, it is interesting to note that they are consistent. It is conceivable that the features are random enough that an efficiency of 60% is the best we can hope to achieve.
IX. CONCLUSIONS
The study of the distribution of the Prosper.com dataset confirms that social features influence the probability of getting funding for a loan request. Affiliation with “Trusted groups” not only doubles the probability of getting a loan request fully funded, but also, establishes the scenario for borrowers with a priori non‐bankable profile to get a loan with reasonable rates. Unattractive features such as high debt or low credit scores can be overcome by either financially attractive offers (high interest), or social features (endorsements). This work uncovered the fact that attractive loan requests made by people affiliated with “Open groups” do not easily get a loan, and lenders show a more conservative behavior with them. The success of these strongly depends on the number of people in these “Open groups” and their financial profile.
The classification of listings on the entire dataset resulted in 85% of accuracy, with a slightly better performance predicting failed listings. In general, the SVM 3rd degree polynomial kernel gave the best performance, although differences between classifiers can be considered negligible. In this situation, the SVM with linear kernel should be chosen for simplicity. Due to the high correlation between the number of bids, the "group rating" and the listing outcome, the accuracy of the classifiers was reduced when considering the reduced datasets. Since the samples within a reduced dataset lose one of the relevant dimensions the separability of the data got worse. For the case of “Active Listings” the reduction in accuracy was dramatic.
The social profile features on Prosper, such as "number of first degree friends," "group size," and "group leader's reward rate", blur the influence of social capital on P2P Lending. Rather than the social network profile, social interaction behavior plays a more important role in deciding whether a borrower will get founded. Having many friends listed on a borrower's social profile, or joining a large group does not reflect the real social interactions. When deciding whether a borrower would get funded, financial profile is still the most determinant consideration. Beyond financial profiles, bidding behavior among social networks is the major social capital impact on peer‐to‐peer lending. According to the analysis, what borrowers can do to increase their chance of getting funded is not only to join social networks on Prosper, but, more importantly, to invite friends and group members to bid on them.
REFERENCES
[1] J.Ryan, K.Reuk, C.Wang, “To Fund Or Not To Fund: Determinants Of Loan Fundability in the Prosper.com Marketplace.”, Stanford Graduate School of Business.
[2] M. Figueiredo, A.K. Jain, "Unsupervised Learning of Finite Mixture Models", IEEE Transactions on Pattern Analysis and Machine Intelligence, Vol. 24, No. 3, March 2002, pp. 381‐396.
[3] P. Pudil, J. Novovicov and J. Kittler , “Floating search methods for feature selection with nonmonotonic criterion functions ” Pattern Recognition Letters, 15 (11) (1994) pp. 1119‐1125