Embed Size (px)
Citation preview
Markets in pre-industrial societies: storage in Hellenistic Babylonia in
the medieval English mirror* **
Bas van Leeuwen
Humanities, Free University, 1081 HV, Amsterdam, the Netherlands
Humanities, Utrecht University, 3512 BL, the Netherlands
Economics, Warwick University, CV4 7AL, UK
E-mail: [email protected]
Peter Földvári
Faculty of Economics and Business Administration, H-4028, Debrecen University, Hungary
Humanities, Utrecht University, 3512 BL, the Netherlands
E-mail: [email protected]
Reinhard Pirngruber
Humanities, Free University, De Boelelaan 1081 HV, Amsterdam, the Netherlands
E-mail: [email protected]
Abstract
Recent research has shown that as early as the third century BCE certain civilizations had already
developed various risk-management strategies to minimize price volatility. In this paper we
examine one such strategy by means of a dataset only recently made available that provides
agricultural prices for Babylonia during the Late Achaemenid and Hellenistic periods (ca. 400-65
BCE). A comparative cost (i.e., interest rates) – benefit (i.e., seasonal price changes) analysis of
medieval England and Hellenistic Babylonia reveals a low level of inter-annual storage in both
economies. However, in contrast with England, Babylonia had a dual crop structure of barley and
dates which reduced seasonality and consequently potential benefits for storage. Yet, the absence of
any evidence that interest rates consequently declined suggests that it is not entirely, or even
primarily, within the agricultural sector that they were determined. One can therefore safely
conclude that, while in the case of Hellenistic Babylonia the correlation of seasonality with the
interest rate over time was generally positive, this is not necessarily the case across regions, even
among pre-industrial economies, in which one would presume interest rates and seasonality to have
been closely related.
Keywords risk reduction, storage, ancient economies, Babylon, England
*This paper is part of the project „On the efficiency of markets for agricultural products in pre-industrial societies: the
case of Babylonia c. 400 - c. 60 BC‟, funded by the Netherlands Organisation for Scientific Research (NWO).
** We are grateful to Ken Pomeranz, Deirdre N. McCloskey, and an anonymous referee for their helpful comments.
Introduction
Market efficiency, defined as the capability of markets to use trade, technology, and/or storage
techniques to reduce the risk of shortage, has in recent years become the focus of considerable
attention.1 With the exception of medieval England,
2 however, quantifications of the magnitude of
storage have rarely been attempted for pre-industrial societies3 in spite of the often rich evidence
found for many societies – from Nigeria ca. 600 BCE by way of the Inca Empire to Classical
Rome.4 This can be partially explained by a lack of quantifiable data, i.e., prices.
5
Fortunately, a dataset only recently made available, for the city of Babylon, allows precisely
such an analysis for the second half of the first millennium BCE, the so-called Hellenistic era, when
the region fell under the sway of Alexander the Great and his successors, known collectively as the
1 See, for example, Karl-Gunnar Persson, Grain markets in Europe, 1500-1900: Integration and deregulation,
Cambridge: Cambridge University Press, 1999; Peter Temin, „Price behavior in ancient Babylon‟, Explorations in
Economic History, 39, 1, 2002, pp. 46-60; ; Roman Studer, ‘India and the great divergence: assessing the efficiency
of grain markets in eighteenth- and nineteenth-century India‟, Journal of Economic History, 68, 2, 2008, pp. 393-
437. 2 See Stefano Fenoaltea, „Risk, transaction costs, and the organization of medieval agriculture‟, Explorations in
Economic History, 13, 2, 1976, pp.129-51; Stefano Fenoaltea, „Transaction costs, Whig history, and the common
fields‟, Politics & Society, 16, 2-3, 1988, pp. 171-240; Donald N. McCloskey and John Nash, „Corn at Interest: the
extent and cost of grain storage in medieval England‟, American Economic Review, 74, 1, pp. 174-87; John Komlos
and Richard Landes, „Anachronistic economics: grain storage in medieval England‟, Economic History Review, 44,
1, 1991, pp. 36-45; Donald N. McCloskey, „Conditional economic history: a reply to Komlos and Landes‟, ,‟
Economic History Review, 44, 1, 1991, pp. 128-32; Nicholas Poynder, „Grain storage in theory and history‟, paper
presented at third conference of European Historical Economics Society, Lisbon, 1999; Jordan Claridge and John
Langdon, „Storage in medieval England: the evidence from purveyance accounts, 1295-1349‟, Economic History
Review, no. doi: 10.1111/j.1468-0289.2010.00564.x. 3 Exceptions are, for example, Kenneth Pomeranz, The making of a hinterland: state, society, and economy in inland
North China, 1853-1937, Berkeley, CA: University of California Press, 1993, pp. 32-3. 4 See, for example, Giovanna Vitelli, „Grain storage and urban growth in imperial Ostia: a quantitative study‟, World
Archeology, 12, 1, 1980, pp. 54-68; Terry Y. Levine, Inka storage systems, Norman, OK: University of Oklahoma
Press 1992; Detlef Groneborn‚ „An ancient storage pit in the SW Chad Basin, Nigeria‟, Journal of Field Archeology,
24, 1997, pp. 431-9. 5 Important studies of price data of antiquity include Dominic Rathbone, „Prices and price formation in Roman
Egypt’, in J. Andreau et al., eds., Économie antique: prix et formation des prix dans les économies antiques, Saint-
Bertrand-de-Comminges: Musée archéologique départemental, 1997, pp.183-244; Gary Reger, Regionalism and
change in the economy of independent Delos, Berkeley, CA: University of California Press, 1994; Sitta von Reden,
Price fluctuations in Babylonia, Egypt, and the Mediterranean world, third to first centuries BC, paper presented at
the conference „Too many data? generalizations and model-building in ancient economic history on the basis of
large corpora of documentary evidence‟, Vienna, 17-19 July 2008.
Seleucid dynasty. The data are available from the „Astronomical Diaries‟6, which are a set of
cuneiform tablets recording a variety of observed celestial, climatic, ecological and economic
phenomena, and accounts of historical events as well. One of the largest collections of observational
data available from any ancient period in world history, they consist of hundreds of tablets spanning
several hundred years (ca. 400-60 BCE). Among the economic information they contain price
quotations of, inter alia, barley and dates, Babylon‟s two main staple crops.7 In theory reliable data
(in some cases multiple observations) are available for every month, but in fact, on account of
numerous gaps in the documentation, barley-price data are available for only 13.76% of the months
(or 535 out of 3,887) spanned by the dataset; as for dates, the percentage is slightly lower, at 12.58.
Földvári and Van Leeuwen (2009) contend, however, that the missing data are „missing at random‟
and therefore uncorrelated with our key variable: seasonality.8
In the pages that follow we will use this unique dataset to compare storage in Hellenistic
Babylon and medieval England. Scarcity of data is always a problem when it comes to historical
research, our decision to compare the market mechanisms operating in these two societies also
being largely a consequence of the existence of data. But this issue is, in fact, of little consequence,
since, as it turns out, what we are able to glean from it concerning their risk-reduction strategies can
be extended to pre-industrial societies generally. This generalization follows from the difference
between both societies: although in both cases we are dealing with a pair of societies that, being
agrarian, did not need to import basic foodstuffs, there the similarity ends. It is the difference
between their crop structures that enables us to test the validity of the McCloskey-Nash storage
model for pre-industrial economies in general, and to assess its cross-regional value.
6 H. Hunger and A. Sachs, Astronomical diaries and related texts from Babylonia. 3 vols.: vol. 1, 652- 262 BC,
Vienna 1988; vol. 2, 261- 165 BC, Vienna 1989; III: vol. 3, 164- 61 BC, Vienna 1996. 7 For prior analyses of the data see Alice L. Slotksy, The Bourse of Babylon: market quotations in the Astronomical
Diaries of Babylonia, Bethesda, MD: CDL Press, 1997 (with the important review of R. J. Van der Spek, and C.
Mandemakers, Sense and nonsense in the statistical approach of Babylonian prices, Bibliotheca Orientalis, 60
(2003), pp. 521-7; Peter Vargyas, Les prix des denrées alimentaires de première nécessité en Babylonie à l’époque
achémenide et hellénistique, in J. Andreau et al., eds., Économie antique, pp. 335-54. See Alice L. Slotksy and
Ronald Wallenfels, Tallies and trends: the late Babylonian commodity price lists, Bethesda, MD: CDL Press, 2010,
for additional price data. 8 Peter Földvári and Bas van Leeuwen, „The structural analysis of Babylonian price data: a partial equilibrium
approach‟, paper presented at the World Economic History Congress, Utrecht, 2009.
According to McCloskey and Nash the price that a given season‟s grain commands after the
harvest must exceed the price that it had commanded prior to the harvest by a sum equal to the
marginal cost of its storage.9 On the one hand, if there is a profit in storing grain and thereby
delaying its sale, this will be done; on the other hand, since this causes the post-harvest price to fall
so far that the storage profit margin shrinks to nothing, the post-harvest price must cover the cost of
storage: more specifically, of foregone investment, barn rental, and loss of stored grain to
spoilage.10
Storage seems a straightforward method of risk-management, but several studies indicate
that during their pre-industrial period few societies practiced it to a significant extent. McCloskey
and Nash as well as Clark argue that in England high interest rates significantly reduced the
financial advantages of storage11
hence its rarity.12
As we will show, this argument holds for
Babylonia, too, even though the two societies‟ agricultural-supply situations were radically
different. In England, the outputs of the two main crops, barley and wheat, were positively (though
weakly) correlated sharing as they did the same harvest period; it was as if English agriculture was
dominated by a single food crop. Instead of wheat Babylon cultivated dates, which, harvested as
they were in the autumn, were negatively correlated with its other main crop, barley, harvested in
the spring. This dual crop structure implies that that intra-annual price changes, and thus the
financial advantages of storage, were probably reduced.13
Thus -- if we assume that the agricultural
9 McCloskey and Nash, „Corn at interest‟. See also Gregory Clark, „The cost of capital and medieval agricultural
technique‟, Explorations in Economic History, 25, 3, 1988, pp. 265-94; Poynder, „Grain storage in theory and
history‟. 10
McCloskey and Nash, „Corn at interest‟; Poynder, „Grain storage in theory and history‟. 11
McCloskey and Nash, „Corn at interest‟; Clark, „The cost of capital‟. 12
On the other hand, some authors argue for a much larger role for storage. For example, Stefano Fenoaltea, „Risk,
transaction costs, and the organization of medieval agriculture‟, p. 139, argued that storage in England could easily
be in the order of magnitude of 1.5 times the annual consumption. However, two preconditions for such a high
storage rate are sharply higher grain-yield variances and the disappearance of the phenomenon of recurrent famine,
both of which are extremely unlikely. 13
Dates played a fundamental part in the dietary habits of the Middle East until well into the twentieth century:
according to a study quoted in Michael Jursa, Aspects of the economic history of Babylonia in the first millennium
BC: economic geography, economic mentalities, agriculture, the use of money and the problem of economic growth
(with contributions by J. Hackl, B. Janković, K. Kleber, E. E. Payne, C. Waerzeggers and M. Weszeli), AOAT 377,
2010, p. 50, an Iraqi small-scale farmer consumed 65.1 kilograms of dates a year as compared with 75.3 kilos of
wheat, barley, rice; the two commodities together accounted for about two-thirds of total caloric intake. A similar
proportion in antiquity is indicated by the „ration‟ system of the Ebabbar-temple of Sippar, in northern Babylonia,
which ideally provided workers with equal amounts of barley and dates; see M. Jursa, „The remuneration of
sector alone determines the interest rate – storage costs (foregone interest, primarily) must have
been lower as well. In an ancient society such as Babylonia, dominated as it was by agricultural
credit, with the interest rate driving seasonality, one would expect the combination of a dual crop
structure with relatively low seasonal volatility to lead to an interest rate substantially lower than
medieval England‟s, but this was not the case. There are two possible explanations: either the costs
of barn rental and crop-storage losses were considerably lower in Babylon, or in both economies --
despite their being pre-industrial -- the interest rate was determined by sectors other than
agriculture, in which case comparison of their seasonal price changes cannot provide a reliable basis
for a comparison of interest rates across economies.14
In the next section, we will discuss the evidence for storage; in Section 3 the benefits and
costs of storage; and in Section 4 the discrepancy of costs and benefits. In the fifth and last section
we will offer our conclusions concerning not only storage in Hellenistic Babylon but also the role of
the interest rate in pre-industrial economies generally.
Evidence for storage
There is little direct evidence for crop storage in pre-industrial societies. A simple model would
suggest that, in order to assure a smooth consumption path, in the case of a single crop harvested
once a year (or two related crops harvested at roughly the same time) the entire crop was stored for
six months, on average. In England prior to the Black Death (which peaked in Europe in the middle
of the fourteenth century) we can distinguish barley and wheat as the two main crops. Broadberry et
al. estimate the share of barley and wheat in the total output of England‟s arable sector around 1300
to have been close to 60%.15
Winter wheat was harvested in May/June, whereas spring barley was
institutional labourers in an urban context in Babylonia in the first millennium BC‟, in P. Briant et al., eds.,
L´archive des fortifications de Persépolis. État des questions et perspectives de recherches. (Persika 12), Paris: De
Boccard, 2008. 14
A third possibility, outlined by Komlos and Landes, „Anachronistic Economics‟, is that when it comes to storage
small-scale farmers may be hampered by socio-economic limitations, even though not by the opportunity costs to
large-scale producers and traders. 15
Steve Broadberry, Bruce Campbell, Alex Klein, Mark Overton, and Bas van Leeuwen, „British economic growth,
1300-1850: some preliminary estimates‟, paper presented at the World Economic History Congress, Utrecht, 2-7
August 2009.
harvested in late August/September. In the period prior to the Black Death, barley was milled for
flour and baked into bread, but by 1600, according to Overton and Campbell, only 35% of
England‟s total barley output was put to this use, and, furthermore, by „The late sixteenth century,
most English ale was being brewed from barley, in contrast to the situation 300 years earlier when
significant quantities had been brewed from dredge and oats.‟16
It therefore seems safe to make two
assumptions: that barley and wheat were the main foodstuffs before the Black Death and that during
three seasons out of four – that is, except in summer – the English had to rely on storage.
Babylon was similar to England prior to the Black Death in that it too had two main crops,
barley and dates, but it differed from England in that the two harvest times were farther apart,
March/April and October, respectively. Hence, if we follow the literature17
in assuming 1) that the
shares of the two crops in the diet are roughly equal and 2) that the two crops are perfect
substitutes,18
it follows that if starvation was to be prevented then, in principle, each crop had to be
stored for only three months on average: that is, until the harvest of the other crop. Additionally, we
must take into consideration that whereas the quality of barley and wheat deteriorates with storage,
the quality of dates may actually improve, and therefore their value may increase. Since fresh dates
cannot be stored (they would rot on account of their high water content), about two months after the
harvest dried dates started to dominate the date market.19
Dried dates have a higher sugar content,
and a lower volume than fresh ones. Because dates were sold by volume (per qa, conveniently close
to a litre), soon after the harvest the price started to rise as the proportion of fresh to dried dates
diminished over time. This seasonality must be factored into any calculation of the costs and
benefits of storage.
16
Mark Overton and Bruce Campbell, „Production et productivité dans l‟agriculture anglaise, 1086-1871‟, Histoire et
Mesure, 11, 3-4, 1996, 255-97, Table XII. 17
Aperghis, The Seleucid royal economy: the finances and financial administration of the Seleukid empire,
Cambridge: Cambridge University Press, 2004, and the literature quoted therein; Jursa, Aspects of the economic
history of Babylonia. See also the information provided above, footnote 15. An important corroboration is the
finding of Vargyas, Les prix des denrées alimentaires, that the date harvest constituted a relief in the supply situation
of the food market, resulting in higher barley equivalents, that is, lower barley prices. 18
As we will explain, this assumption can be defended in times of famine, when the vital need is for any calories.
Barley and dates are thus considered simply as sources of kcalories, and hence as substitutes. 19
For instance, Dowson, Dates and date cultivation of the ‘Iraq, [S.I.]: Agricultural Directorate of Mesopotamia,
part 1, 1921, p. 41.
It goes without saying – since people have to eat between as well as during harvest periods -
- that every economy needs at least a basic sort of short-term-storage system. Since during each of
the twelve months of the year roughly a twelfth of the crop harvested is consumed, it would follow
that six months is one harvest‟s average storage time, if it were not for the possibility of carryover
from one year to the next (inter-annual storage). According to McCloskey and Nash, there is direct
evidence that in medieval England carryovers averaged 5% of the harvest at best and were limited,
for the most part, to manors and royal storage facilities.20
Although they show that in plentiful years
there may have been some carryover,21
it was rarely of any significance. Beveridge concurs,
concluding that little in the way of grain was stored beyond the following harvest.22
Similarly, M. Jursa estimates as minimal the role of storage in Babylonia during the first
millennium BCE, mostly on account of the socioeconomic situation. He argues that, in order to
meet tax requirements, the big producers (i.e., the temples) were forced to sell the lion‟s share of
their cash-crop production immediately after harvest. Having revealed a seasonal pattern in the sales
of dates of the Ebabbar-temple in Sippar (with dates usually being described as the temple‟s main
cash crop) he concludes that „by and large the temple did not hoard dates with the intention of
making them available to outsiders after the intensive phase of selling following the harvest.‟23
In
other words, the tax demand of the central government meant that the temples were unable to store
commodities on large scale, with the aim of selling them in the following year.
In addition, among the price quotations in the so-called Astronomical Diaries (ADs) one
finds several observations of „old‟ and „new‟ barley and dates but most of them refer to the new
harvest and therefore do not prove that carryovers existed. Indeed, new barley generally appears in
the texts during the harvest period (Babylonian months I and II). This „new‟ (eššu) barley is always
cheaper, and either replaces barley without additional attribute (as in AD -308)24
or runs parallel to
20
McCloskey and Nash, „Corn at interest.‟ 21
Ibid., p.174. 22
William H. Beveridge, „The yield and price of corn in the Middle Ages,‟ Economic History Review, 1, 1927, pp.
155-67. 23
Jursa, Aspects of the economic history of Babylonia, pp. 591-2. 24
That is, specified by neither „old‟ nor „new‟.
it (S/W, texts 9 and 12);25
in either case the price decreases. A clear example is given in Table 1,
where one can see that the prices rise until day 15 when the new barley enters the market, and that
at that point they begin to fall. This pattern can be best explained as an effect of the supply increase,
with the arrival of the new crop, rather than as a change in quality. Again, we fail to find any solid
evidence of inter-annual storage is available for barley.
Table 1 about here
„New dates‟ follow the same pattern. It is not surprising that at harvest time, when supply
rose, prices for both barley and dates fell, that of dates by about twice as much as that of barley:
about 20% and 10%, respectively. The fact that, as we have mentioned, dried (=old) dates have a
higher weight per litre and a higher sugar content than do fresh ones accounts for the difference in
the percentage of the price declines for fresh dates and fresh barley. In fact, this pattern is
widespread; in his study of Roman Egypt, for instance, Drexhage26
reports fresh dates to have been
cheaper than dried dates.
The only extant reference to either old or new dates outside the harvest season is recorded
on the cuneiform tablet known as S/W text 6. The most plausible explanation is that it refers to
inter-annual storage: if the standard dates were the ones most recently harvested, in the autumn of
138 BCE, then the dates designated as old must be from an earlier harvest. Evidence referring to
„old‟ produce, defined here as produce stored for longer than a year, is thus very meager in the rich
corpus of Late Babylonian price records (and we are talking about more than 3,500 price
observations). This finding is consistent with the contention that the economic impact of carryover
was minimal during the Late Babylonian era.
There is considerable indirect evidence of small-scale storage in both Hellenistic Babylonia
and medieval England associated with periods of famine, most notably the great European famine
25
S/W x: Text number in Slotsky and Wallenfels, Tallies and trends. 26
Hans-Joachim Drexhage, Preise, Mieten/Pachten, Kosten und Löhne in römischen Ägypten, St Katharinen: Scripta
Mercaturae Verlag, 1992, p. 36.
of 1315-17. Since it is difficult to establish what each of the various chroniclers and
historiographers of the two societies under study meant by „famine‟, we shall define it broadly
enough to include food crises characterized „by rising prices, popular discontent and hunger, in the
worst cases leading to death by disease or starvation‟ rather than restricting it to cases of mass
starvation.27
Our broader definition enables us to compare the two datasets and, more specifically,
to analyze the correlation of famine with extremely high prices, as is often done in the literature on
both England (e.g., Hoskins 1964, 1968)28
and Babylon (e.g., Vargyas 1997; Van der Spek 2006).29
On average, England experienced famine as often as every ten to fifteen years,30
evidence in
its own right of the lack of large-scale inter-annual storage. As for Babylon, we are fortunate to have
the so-called „siege documents‟ edited by Oppenheim, direct evidence of what Babylonians
themselves considered famine prices.31
However, the prices in these documents are mere
formulations rather than actual sale prices (in the style of „barley costs a million nowadays‟) and are
therefore conspicuously high:32
in all cases these prices ranged between 8.3 and 50 shekels per 100
litres of barley. The more reliable famine prices recorded in the Astronomical Diaries are
considerably lower. In fact, several passages in the historical sections of the same tablets report that
famines could be so severe that residents of the city of Babylon were obliged to sell their children in
order to stave off starvation: a phenomenon reported in the siege documents as well. Using these
data, based on the notations of contemporary Babylonian scribes, Van der Spek calculates that
27
Peter Garnsey, „Famine in history‟, in P. Garnsey, ed., Cities, peasants and food in classical antiquity,
Cambridge: Cambridge University Press,1998, pp. 272-92, quotation from p. 275. Note however that the Babylonian
famine threshold employed seems to meet one important criterion of famine as defined more narrowly, namely a
„collapse of the social, political, and moral order‟ (Garnsey, „Famine in history’, p. 275); this, at least, this is how
we would interpret the fact that parents were reported to sell their children in order to fend off starvation. Cormac
Ó‟Gráda, Famine: a short history, Princeton, NJ: Princeton University Press, 2009, pp. 3-7, likewise offers a
pragmatic definition of famine. 28
W. G. Hoskins, „Harvest fluctuations and English economic history 1480-1619‟, Agricultural History Review, 12,
1964, pp. 28-46; „Harvest fluctuations and English economic history 1620-1759‟, Agricultural History Review, 16,
1968, pp. 15-31. Hoskins defines famine years as those when the price was higher than 10% above a 31-year
moving average. 29
Vargyas, Les prix des denrées alimentaires.Robartus Van der Spek, „How to measure prosperity? the case of
Hellenistic Babylonia‟, in R. Descat et al., eds., Approches de l’économie hellénistique, Paris: Entretiens
d‟Archéologie et d‟Histoire, St Saint-Bertrand-de-Comminges 7, 2006, pp. 287-310. 30
Donald N. McCloskey, „English open fields as behavior towards risk‟, in P. Uselding, ed., Research in economic
history, vol. 1, Greenwich, CT: JAI Press, 1976, pp. 124-70, p. 144. 31
A. Leo Oppenheim, „Siege documents from Nippur‟, Iraq, 17, 1955, pp. 69-89. 32
This has also been shown by Israel Eph‟al, The city besieged: siege and its manifestations in the ancient Near East,
Leiden: Brill, 2009; he argues that these prices are best considered literary topoi of little historical value.
famine conditions can be said to have prevailed when one shekel could buy 39 litres barley.33
We
set the per-shekel price slightly lower, at 40 litres, but add a constraint: the prices of both barley and
dates must fall to this level or lower for the term „famine‟ to be applicable, since barley and dates
contain roughly the same number of kcalories per litre, making the cheaper of the two the logical
choice when starvation threatens. Using this method, we can identify 9 famines in the 133 years for
which we have data, a rate that works out to one famine roughly every fourteen years.
As we have pointed out, this relatively high famine frequency, in both England and Babylon,
clearly indicates that carryovers of any significance were not a standard practice. We can formalize
this conclusion by estimating the expected time that it will take for a famine to occur, given a
certain level of inter-annual storage. The first step is to calculate the standard deviation of
agricultural output: a straightforward calculation in the case of one crop, but in England we have
wheat and barley and in Babylon barley and dates. These two pairs of crops are far from equivalent:
since England‟s wheat and barley, have more characteristics in common (both being grain crops
harvested in the spring) than do Babylon‟s barley and dates (the latter being a fruit harvested in the
fall), it follows that the outputs of wheat and barley in England are more closely correlated than are
those of barley and dates in Babylon. This discrepancy has an impact on the standard deviation and
hence on the likelihood of famines. Since the standard deviation is simply the square root of the
variance, we combine, for simplicity‟s sake, the variances of the two series: that is, we treat barley
and dates as perfect pair of substitutes. This assumption can be defended since when threatened by
famine people maximize their calorie intake,34
and dates and barley have approximately the same
per-litre caloric content,35
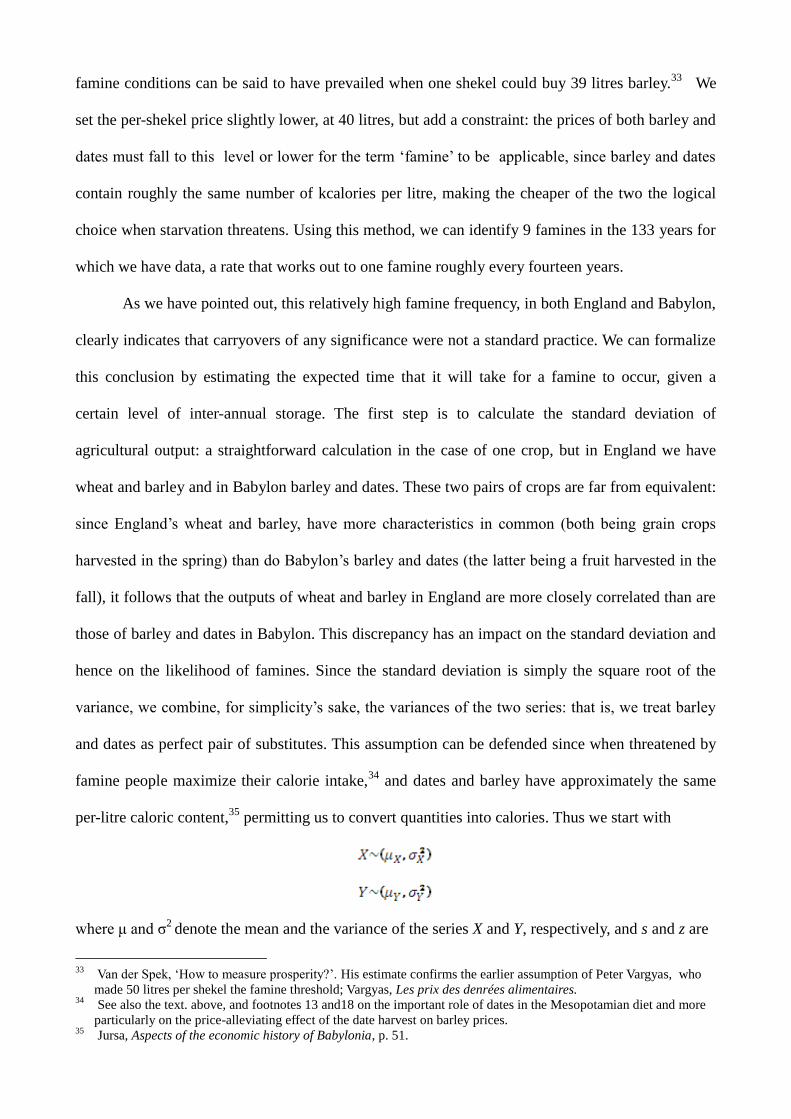
permitting us to convert quantities into calories. Thus we start with
where μ and σ2
denote the mean and the variance of the series X and Y, respectively, and s and z are
33
Van der Spek, „How to measure prosperity?‟. His estimate confirms the earlier assumption of Peter Vargyas, who
made 50 litres per shekel the famine threshold; Vargyas, Les prix des denrées alimentaires. 34
See also the text. above, and footnotes 13 and18 on the important role of dates in the Mesopotamian diet and more
particularly on the price-alleviating effect of the date harvest on barley prices. 35
Jursa, Aspects of the economic history of Babylonia, p. 51.
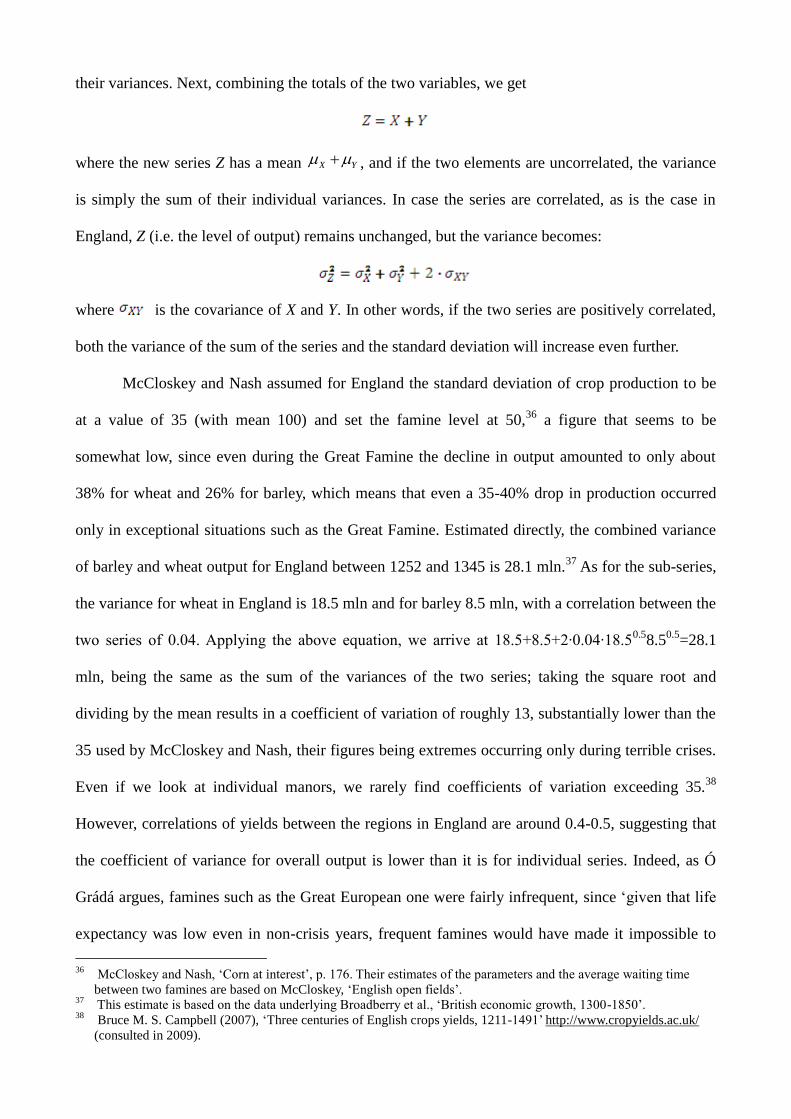
their variances. Next, combining the totals of the two variables, we get
where the new series Z has a mean X Y , and if the two elements are uncorrelated, the variance
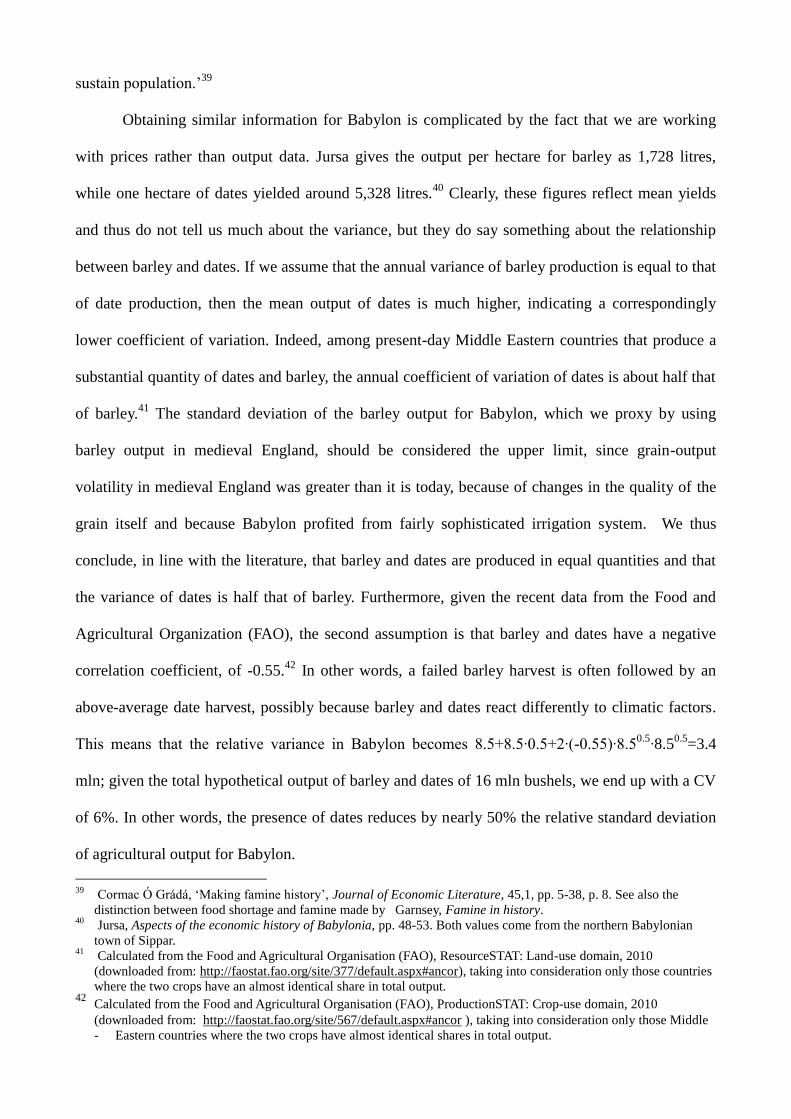
is simply the sum of their individual variances. In case the series are correlated, as is the case in
England, Z (i.e. the level of output) remains unchanged, but the variance becomes:
where is the covariance of X and Y. In other words, if the two series are positively correlated,
both the variance of the sum of the series and the standard deviation will increase even further.
McCloskey and Nash assumed for England the standard deviation of crop production to be
at a value of 35 (with mean 100) and set the famine level at 50,36
a figure that seems to be
somewhat low, since even during the Great Famine the decline in output amounted to only about
38% for wheat and 26% for barley, which means that even a 35-40% drop in production occurred
only in exceptional situations such as the Great Famine. Estimated directly, the combined variance
of barley and wheat output for England between 1252 and 1345 is 28.1 mln.37
As for the sub-series,
the variance for wheat in England is 18.5 mln and for barley 8.5 mln, with a correlation between the
two series of 0.04. Applying the above equation, we arrive at 18.5+8.5+2∙0.04∙18.50.5
8.50.5
=28.1
mln, being the same as the sum of the variances of the two series; taking the square root and
dividing by the mean results in a coefficient of variation of roughly 13, substantially lower than the
35 used by McCloskey and Nash, their figures being extremes occurring only during terrible crises.
Even if we look at individual manors, we rarely find coefficients of variation exceeding 35.38
However, correlations of yields between the regions in England are around 0.4-0.5, suggesting that
the coefficient of variance for overall output is lower than it is for individual series. Indeed, as Ó
Grádá argues, famines such as the Great European one were fairly infrequent, since „given that life
expectancy was low even in non-crisis years, frequent famines would have made it impossible to
36
McCloskey and Nash, „Corn at interest‟, p. 176. Their estimates of the parameters and the average waiting time
between two famines are based on McCloskey, „English open fields‟. 37
This estimate is based on the data underlying Broadberry et al., „British economic growth, 1300-1850‟. 38
Bruce M. S. Campbell (2007), „Three centuries of English crops yields, 1211-1491‟ http://www.cropyields.ac.uk/
(consulted in 2009).
sustain population.‟39
Obtaining similar information for Babylon is complicated by the fact that we are working
with prices rather than output data. Jursa gives the output per hectare for barley as 1,728 litres,
while one hectare of dates yielded around 5,328 litres.40
Clearly, these figures reflect mean yields
and thus do not tell us much about the variance, but they do say something about the relationship
between barley and dates. If we assume that the annual variance of barley production is equal to that
of date production, then the mean output of dates is much higher, indicating a correspondingly
lower coefficient of variation. Indeed, among present-day Middle Eastern countries that produce a
substantial quantity of dates and barley, the annual coefficient of variation of dates is about half that
of barley.41
The standard deviation of the barley output for Babylon, which we proxy by using
barley output in medieval England, should be considered the upper limit, since grain-output
volatility in medieval England was greater than it is today, because of changes in the quality of the
grain itself and because Babylon profited from fairly sophisticated irrigation system. We thus
conclude, in line with the literature, that barley and dates are produced in equal quantities and that
the variance of dates is half that of barley. Furthermore, given the recent data from the Food and
Agricultural Organization (FAO), the second assumption is that barley and dates have a negative
correlation coefficient, of -0.55.42
In other words, a failed barley harvest is often followed by an
above-average date harvest, possibly because barley and dates react differently to climatic factors.
This means that the relative variance in Babylon becomes 8.5+8.5∙0.5+2∙(-0.55)∙8.50.5
∙8.50.5
=3.4
mln; given the total hypothetical output of barley and dates of 16 mln bushels, we end up with a CV
of 6%. In other words, the presence of dates reduces by nearly 50% the relative standard deviation
of agricultural output for Babylon.
39
Cormac Ó Grádá, „Making famine history‟, Journal of Economic Literature, 45,1, pp. 5-38, p. 8. See also the
distinction between food shortage and famine made by Garnsey, Famine in history. 40
Jursa, Aspects of the economic history of Babylonia, pp. 48-53. Both values come from the northern Babylonian
town of Sippar. 41
Calculated from the Food and Agricultural Organisation (FAO), ResourceSTAT: Land-use domain, 2010
(downloaded from: http://faostat.fao.org/site/377/default.aspx#ancor), taking into consideration only those countries
where the two crops have an almost identical share in total output. 42
Calculated from the Food and Agricultural Organisation (FAO), ProductionSTAT: Crop-use domain, 2010
(downloaded from: http://faostat.fao.org/site/567/default.aspx#ancor ), taking into consideration only those Middle
- Eastern countries where the two crops have almost identical shares in total output.
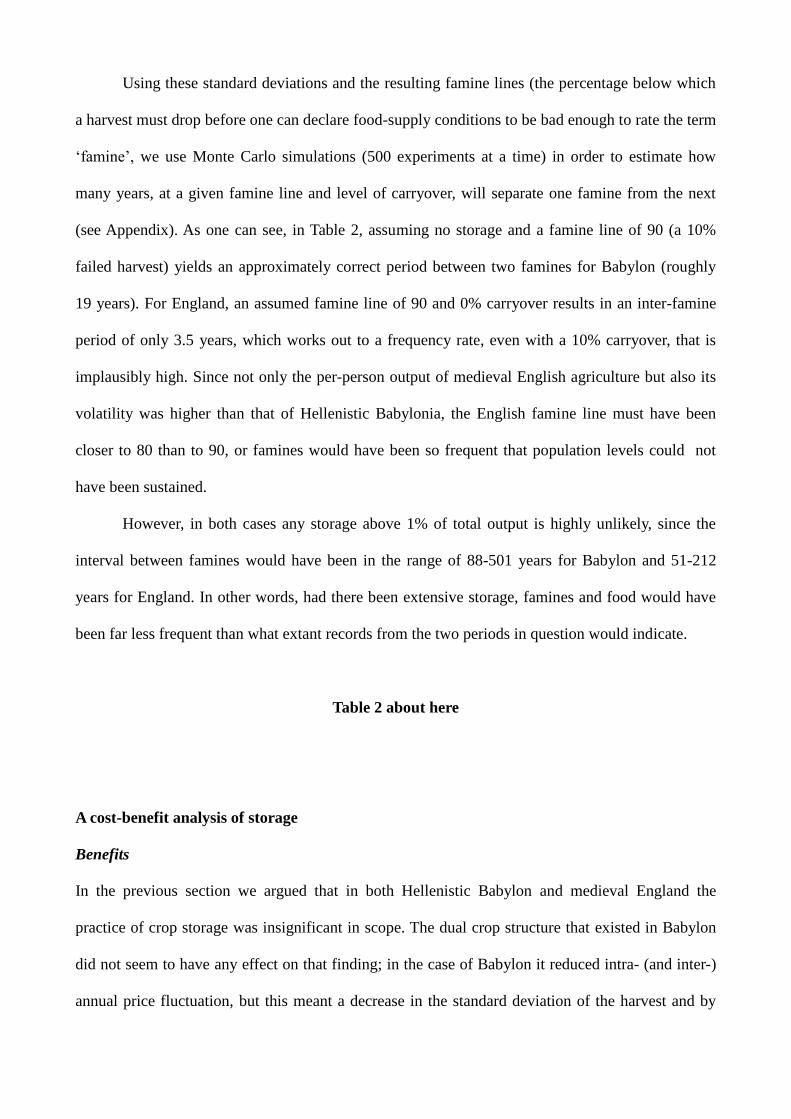
Using these standard deviations and the resulting famine lines (the percentage below which
a harvest must drop before one can declare food-supply conditions to be bad enough to rate the term
„famine‟, we use Monte Carlo simulations (500 experiments at a time) in order to estimate how
many years, at a given famine line and level of carryover, will separate one famine from the next
(see Appendix). As one can see, in Table 2, assuming no storage and a famine line of 90 (a 10%
failed harvest) yields an approximately correct period between two famines for Babylon (roughly
19 years). For England, an assumed famine line of 90 and 0% carryover results in an inter-famine
period of only 3.5 years, which works out to a frequency rate, even with a 10% carryover, that is
implausibly high. Since not only the per-person output of medieval English agriculture but also its
volatility was higher than that of Hellenistic Babylonia, the English famine line must have been
closer to 80 than to 90, or famines would have been so frequent that population levels could not
have been sustained.
However, in both cases any storage above 1% of total output is highly unlikely, since the
interval between famines would have been in the range of 88-501 years for Babylon and 51-212
years for England. In other words, had there been extensive storage, famines and food would have
been far less frequent than what extant records from the two periods in question would indicate.
Table 2 about here
A cost-benefit analysis of storage
Benefits
In the previous section we argued that in both Hellenistic Babylon and medieval England the
practice of crop storage was insignificant in scope. The dual crop structure that existed in Babylon
did not seem to have any effect on that finding; in the case of Babylon it reduced intra- (and inter-)
annual price fluctuation, but this meant a decrease in the standard deviation of the harvest and by
extension, in the frequency of famines. The next question is, Then why were carryovers so small? .
For McCloskey and Nash (1984) the explanation is simply that storage was prohibitively
expensive in medieval England.43
In order to test this hypothesis and also determine whether it can
be extended to Babylon, we will assess the potential benefits of storage in each of the two cases and
only then address the issue of storage‟s costs, leaving our discussion of cost-benefit discrepancies to
the next section.
With the model of McCloskey and Nash (1984) as our point of departure, we proceed on the
assumption that not only intra-annual price changes but also inter-annual carryovers are equal to
changes in the costs of storage since inter-harvest prices track storage costs: after all, storing grain
makes economic sense only if the benefits outweigh the costs. If the price increase is sufficient to
make storage, despite its costs, profitable, then the storage rate will increase, in turn pushing up the
price to the point at which the marginal costs and benefits are equal. McCloskey and Nash as well
as Clark claim that the costs of storage consist of a) rental costs of a barn, b) losses (spoiled grain
and theft) and most importantly c) foregone earnings, best approximated by the interest rate on
capital.44
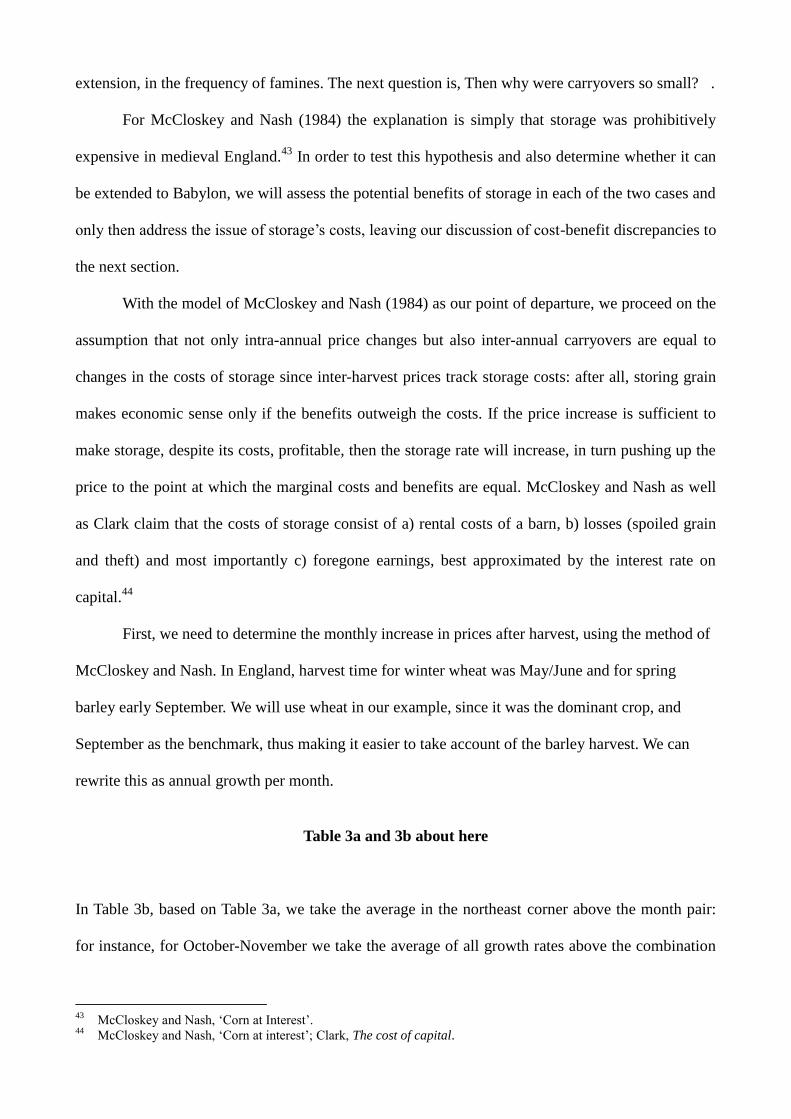
First, we need to determine the monthly increase in prices after harvest, using the method of
McCloskey and Nash. In England, harvest time for winter wheat was May/June and for spring
barley early September. We will use wheat in our example, since it was the dominant crop, and
September as the benchmark, thus making it easier to take account of the barley harvest. We can
rewrite this as annual growth per month.
Table 3a and 3b about here
In Table 3b, based on Table 3a, we take the average in the northeast corner above the month pair:
for instance, for October-November we take the average of all growth rates above the combination
43
McCloskey and Nash, „Corn at Interest‟. 44
McCloskey and Nash, „Corn at interest‟; Clark, The cost of capital.
October-November in the matrix.45
The annual price increase for wheat is 24.4%. One should bear
in mind that this estimation technique is based on the premise of a single annual harvest. If two
equally important crops are harvested half a year apart, as was the case in Babylon, taking the
average of the growth rates of the complete northeast corner will result in an overestimation of the
growth (or, to describe it from a cost perspective, the price decline after the second harvest).
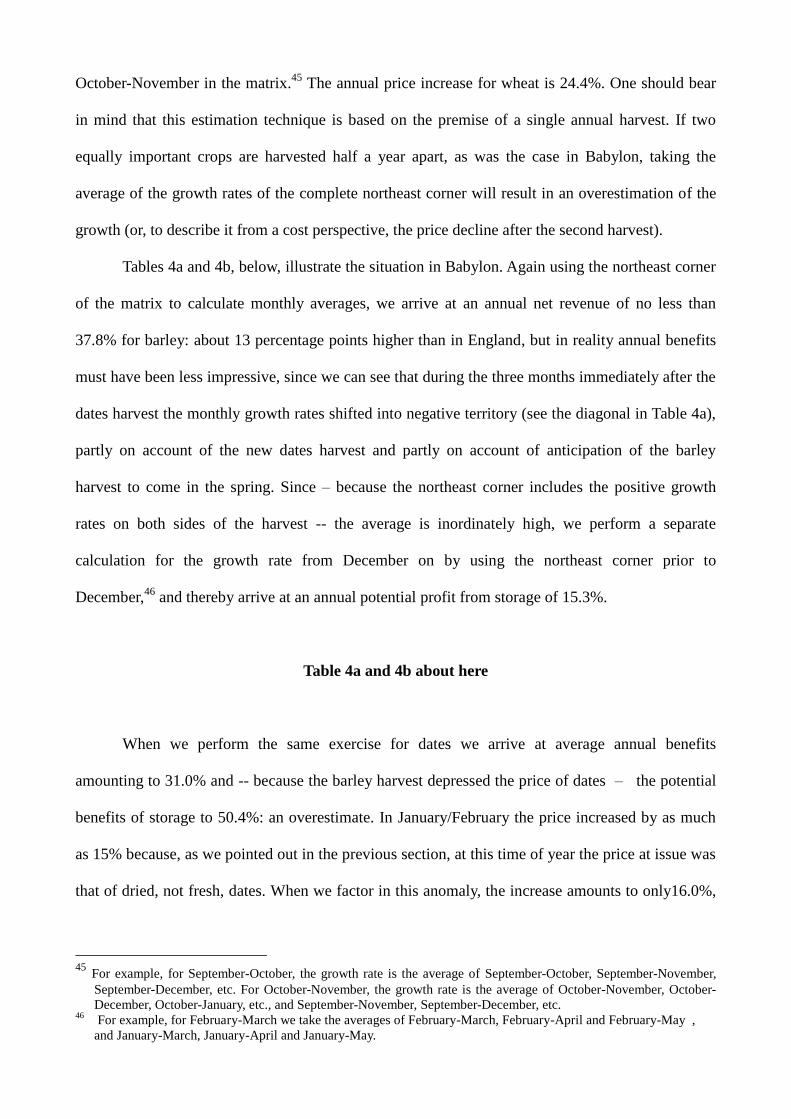
Tables 4a and 4b, below, illustrate the situation in Babylon. Again using the northeast corner
of the matrix to calculate monthly averages, we arrive at an annual net revenue of no less than
37.8% for barley: about 13 percentage points higher than in England, but in reality annual benefits
must have been less impressive, since we can see that during the three months immediately after the
dates harvest the monthly growth rates shifted into negative territory (see the diagonal in Table 4a),
partly on account of the new dates harvest and partly on account of anticipation of the barley
harvest to come in the spring. Since – because the northeast corner includes the positive growth
rates on both sides of the harvest -- the average is inordinately high, we perform a separate
calculation for the growth rate from December on by using the northeast corner prior to
December,46
and thereby arrive at an annual potential profit from storage of 15.3%.
Table 4a and 4b about here
When we perform the same exercise for dates we arrive at average annual benefits
amounting to 31.0% and -- because the barley harvest depressed the price of dates – the potential
benefits of storage to 50.4%: an overestimate. In January/February the price increased by as much
as 15% because, as we pointed out in the previous section, at this time of year the price at issue was
that of dried, not fresh, dates. When we factor in this anomaly, the increase amounts to only16.0%,
45
For example, for September-October, the growth rate is the average of September-October, September-November,
September-December, etc. For October-November, the growth rate is the average of October-November, October-
December, October-January, etc., and September-November, September-December, etc. 46
For example, for February-March we take the averages of February-March, February-April and February-May ,
and January-March, January-April and January-May.
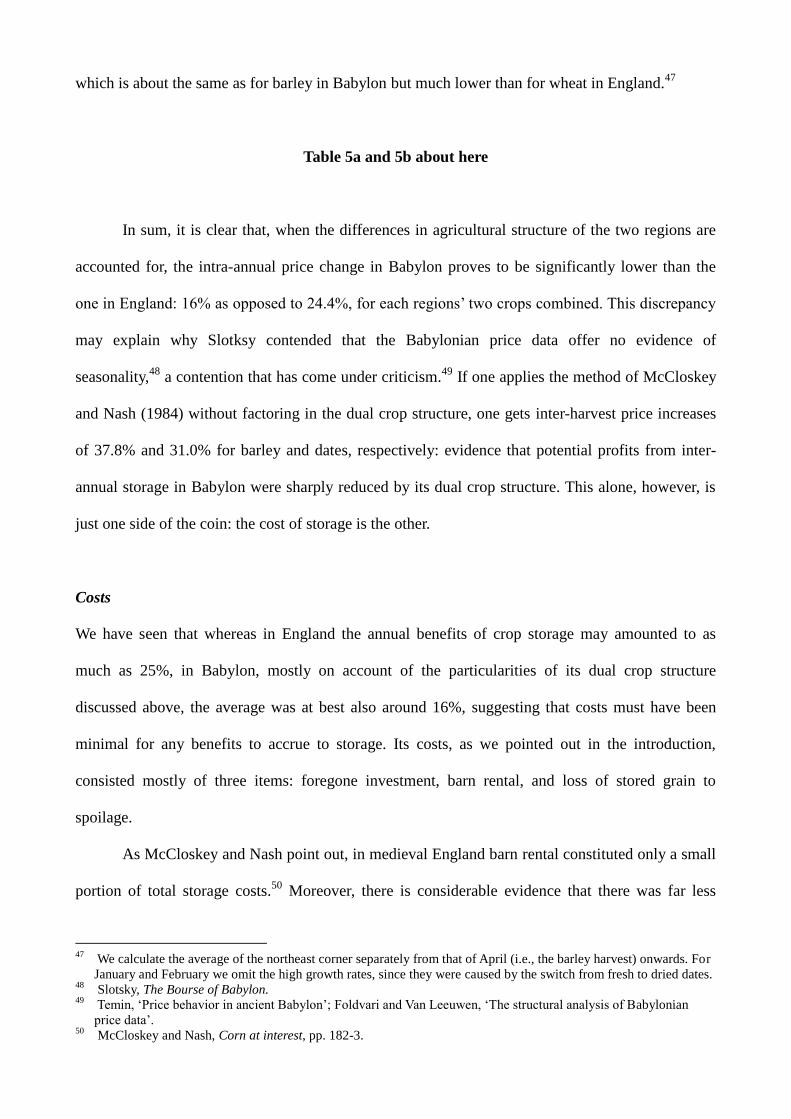
which is about the same as for barley in Babylon but much lower than for wheat in England.47
Table 5a and 5b about here
In sum, it is clear that, when the differences in agricultural structure of the two regions are
accounted for, the intra-annual price change in Babylon proves to be significantly lower than the
one in England: 16% as opposed to 24.4%, for each regions‟ two crops combined. This discrepancy
may explain why Slotksy contended that the Babylonian price data offer no evidence of
seasonality,48
a contention that has come under criticism.49
If one applies the method of McCloskey
and Nash (1984) without factoring in the dual crop structure, one gets inter-harvest price increases
of 37.8% and 31.0% for barley and dates, respectively: evidence that potential profits from inter-
annual storage in Babylon were sharply reduced by its dual crop structure. This alone, however, is
just one side of the coin: the cost of storage is the other.
Costs
We have seen that whereas in England the annual benefits of crop storage may amounted to as
much as 25%, in Babylon, mostly on account of the particularities of its dual crop structure
discussed above, the average was at best also around 16%, suggesting that costs must have been
minimal for any benefits to accrue to storage. Its costs, as we pointed out in the introduction,
consisted mostly of three items: foregone investment, barn rental, and loss of stored grain to
spoilage.
As McCloskey and Nash point out, in medieval England barn rental constituted only a small
portion of total storage costs.50
Moreover, there is considerable evidence that there was far less
47
We calculate the average of the northeast corner separately from that of April (i.e., the barley harvest) onwards. For
January and February we omit the high growth rates, since they were caused by the switch from fresh to dried dates. 48
Slotsky, The Bourse of Babylon. 49
Temin, „Price behavior in ancient Babylon‟; Foldvari and Van Leeuwen, „The structural analysis of Babylonian
price data‟. 50
McCloskey and Nash, Corn at interest, pp. 182-3.
investment in the construction and renovation of barns than of houses; but we find that around 1300
a year‟s house rental cost roughly the equivalent of 15 bushels (or about 525 litres) of barley, a price
that the Black Death would slash in half.51
As for Babylon, Jursa estimates that house rental cost a
minimum of 3-4 shekels a year, the equivalent of about 400 litres of barley, and somewhere
between one month‟s and two months‟ wages for full-time work in the sixth century BCE.52
Since
presumably, as was the case in medieval England, house rental cost more than barn rental, it is
unlikely that the latter exceeded 6% of the annual value of the grain stored.53
We thus conclude that
the cost of renting a barn in Babylon was slightly lower than that of renting a barn in England.
The costs of spoilage during storage follows the same pattern. For England, Overton and
Campbell estimate these losses to have been about 10% per annum.54
While we do not have
comparable data for Babylon, Adamson shows that 10% was about the loss rate in ancient Egypt,
whereas he sets the rate for Mesopotamia somewhat higher, on account of its less favorable
climate.55
The fact that numerous references to the threat to stored produce that was posed by fungi
and lichens are to be found in Babylonian scientific literature indicates how serious it was. One line
of the omen collection šumma ālu dealing with various terrestrial phenomena reads: „If there is
green fungus in a storage bin, there will be no grain in the man‟s house‟.56
The mere fact that an
entire tablet (comprising about 120 omens) was dedicated to problems posed by these two crop
parasites speaks volumes. In general, storage losses were likely to be lower for dates than for grain;
combined loss was probably on average about 10%. While this estimate has a wide margin of error,
it is safe to say that storage losses constituted a small share of total losses, so the question of the
degree of this figure‟s accuracy is academic.
This brings us to interest rates, the most important and most discussed, perhaps because the
most complex, variable: ranging from 10% on standard loans to more than 50% on consumption
51
Gregory Clark, „The condition of the working-class in England, 1209-2004‟, Journal of Political Economy, 113, 6,
2005, pp. 1307-40. 52
Jursa, Aspects of the economic history of Babylonia, p. 686. 53
G. E. Fussel, ed., Robert Loder’s farm accounts: 1610-20, London: Camden Society, 1936, pp. 158-9. 54
Overton and Campbell, Production et productivité dans l’agriculture anglaise. 55
P. B. Adamson, „Problems over storing food in the ancient Near East‟, Welt des Orients, 16, 1985, pp. 5-15. 56
Sally M. Freedman, If a city is set on a height, vol. 1 (OPSNKF), Philadelphia, PA: University of Pennsylvania
Museum, 1998.
credit. The fact that they can be calculated in a number of different ways further complicates the
situation. Say that a farmer who had been granted consumption credit shortly before the next
harvest -- that is, before grain prices begin to decline – had to repay the equivalent of two bushels
of barley; shortly after the harvest, when the price grain had fallen by half, the cost of the credit
would double, to the equivalent of four bushels.
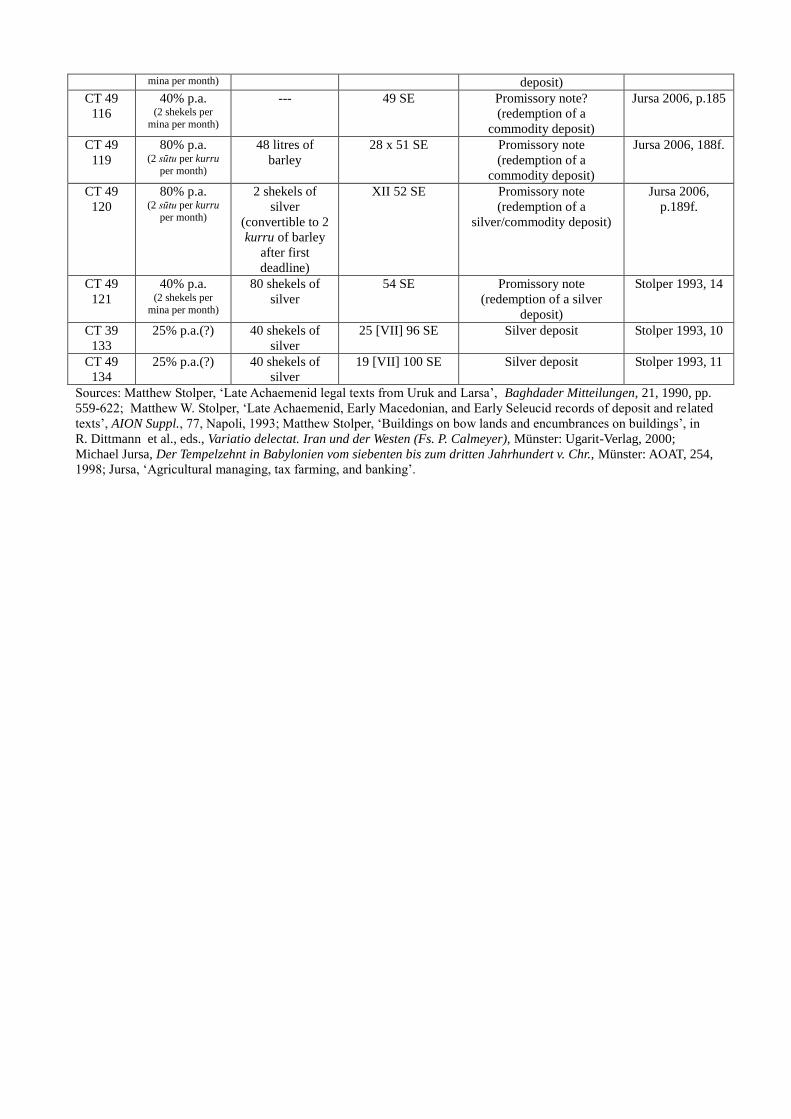
We summarize in Table 6 what little direct evidence we have regarding interest rates in
Babylon. Admittedly, most of these data – the promissory notes concerning the redemption of a
silver (or, if infrequently, a commodity) deposit – are rather to be interpreted as penalty clauses:
effective only after an initial interest-free period.57
These penalties (compounded monthly) were, in
effect, interest rates. It is most interesting that the percentage rate of these penalties – in effect,
interest payments -- on commodity loans was always higher than the rate of the official ones; for
example, Late Achaemenid “real” interest rates, which ranged between 25 and 40% per month for
silver loans.58
Whereas the average interest rate on silver was about 34% per annum, the rate on
commodity loans was up to 100%. Evidently commodity loans were deemed high-risk ones, even
though the sums involved were relatively small: only a few shekels, as opposed to an average of
about 30 for silver. In addition, payment was in kind, indicating that grain-loan borrowers were cash
poor.
Table 6 about here
These interest rates are slightly higher than in medieval England, where, according to Homer
and Sylla,59
interest rates ranged between 10% for institutional loans60
and more than 50% for
57
See Michael Jursa, „Agricultural managing, tax farming and banking: aspects of entrepreneurial activity in
Babylonia in the Late Achaemenid and Hellenistic periods‟, in P. Briant and F. Joannès, eds., La transition entre
l’empire achéménide et les royaumes hellénistiques (Persika 9), Paris: De Boccard, 2006, pp. 137-222. 58
Sidney Homer and Richard Sylla, A history of interest rates, 4th
ed., Hoboken, NJ: John Wiley, 2005, p. 27, point
out that the Code Hammurabi had already set a higher maximum interest rate on loans in grain than on loans in
silver. This policy remained in effect until about 600 BCE, when the same maximum was set for the two
commodities, although the interest on loans in the produce sector remained higher than those in precious metals. 59
Homer and Sylla, A history of interest rates, p. 89. 60
See also Clark, „The cost of capital‟.
individual loans.61
The interest-rate ranges for the two periods are remarkably similar in two key
respects: not only did they share a very high range (in sharp contrast to the ranges during the
intervening two millennia) but they were structurally similar as well. It was around 1220 that the
term „interesse‟, referring to a compensation or penalty for delayed repayment of a loan, and thus a
way to circumvent the long-established usury laws, began to appear:62
a distant descendant of the
penalty clause in Babylonian contracts by which, after an initial interest-free period, a monthly
interest payment was imposed.
Our comparison of the interest rates in Babylon and England is further facilitated by the
existence of one element common to the two regions: livestock. As McCloskey and Nash observe,
the profit on capital investment in livestock -- that is, the net (that is, gross minus costs) annual
output of an animal divided by the total value of the animal yields an estimate equivalent to the
interest rate.63
Of all the livestock candidates for the interest-rate comparison that follows, sheep
best suit our purposes for three reasons: they constituted one of the dominant varieties of livestock
in both Babylon and England; they did not require costly feed, such as beans or oats; and their
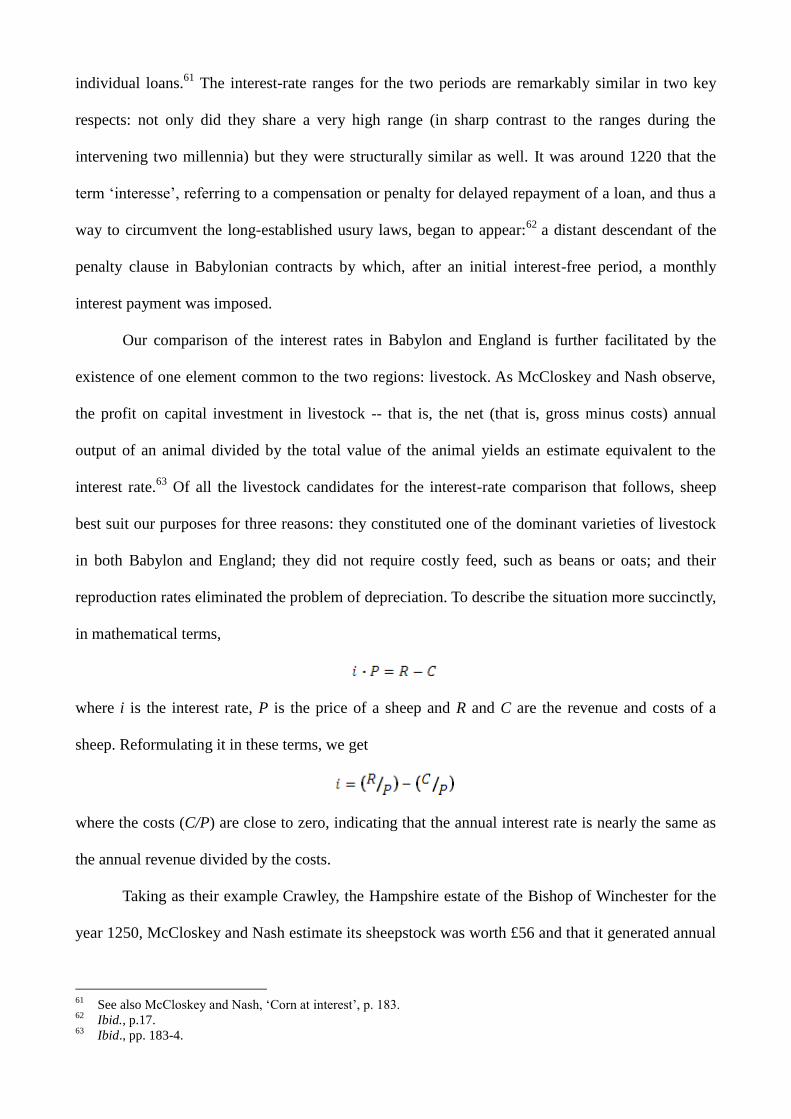
reproduction rates eliminated the problem of depreciation. To describe the situation more succinctly,
in mathematical terms,
where i is the interest rate, P is the price of a sheep and R and C are the revenue and costs of a
sheep. Reformulating it in these terms, we get
where the costs (C/P) are close to zero, indicating that the annual interest rate is nearly the same as
the annual revenue divided by the costs.
Taking as their example Crawley, the Hampshire estate of the Bishop of Winchester for the
year 1250, McCloskey and Nash estimate its sheepstock was worth £56 and that it generated annual
61
See also McCloskey and Nash, „Corn at interest‟, p. 183. 62
Ibid., p.17. 63
Ibid., pp. 183-4.
income earnings of £25.2, or an interest rate of 45%.64
The calculation for Babylon is simpler.
Using silver talents as the unit of value, Aperghis estimates the overall value of the livestock
consisting of 3,648 mln sheep at 1,204, of their meat at 241 and of their wool at 620, yielding an
interest rate of 71.5%:65
lower than Hellenistic Babylonia‟s, although the gap was probably not this
wide, since in medieval England the cost of such produce, being relatively abundant, was relatively
low. Nevertheless, both our sheep-based and our direct estimates confirm that interest rates in
Babylon, contrary to what the McCloskey-Nash model would indicate, were slightly higher than in
medieval England.
If we assume, in line with our discussion of the benefits of storage, the average annual benefits of
storage in medieval England to be about 25%, it follows that only institutions and wealthy
merchants could afford to store grain, since nobody else could afford to pay an interest rate of 10%
and a barn-rental rate of 5% and, on top of that, absorb a storage-loss rate of 5-10%. However, it is
possible that storage costs were much higher and that institutions and wealthy merchants had other
investment opportunities. Babylon‟s storage-loss rate was the same as England‟s, whereas the
interest rate (opportunity costs) was higher. When we add to the calculation a smaller profit from
inter-annual storage, its exploitation by wealthy merchants in Babylon is even more unlikely than
for their peers in England. Small-scale farmers, however, are another matter, since they did not have
the same access to capital and therefore did not pay such high interest rates, and yet we found, in
Section 2, that they did not store grain to any significant extent. The question of why they did not
do so is the subject of our next and last analysis.
The role of small-scale farmers
It is not surprising that in Babylon large institutions and wealthy merchants enjoyed such high
opportunity costs that they would find the practice of storing grain only in exceptional cases to be
64
Ibid. 65
G. G. Aperghis, „ABACUS historical modeling system‟, paper presented at the Francqui Conference „Long-term
quantification in ancient Mediterranean History‟, Brussels, November 2009.
profitable, in light of the fact that the interest rate on small loans was relatively high. What is
surprising is how little such storage was done by farmers at the other end of the scale: peasants
whose profit margin was too slim to allow for investment in the capital market, and, who therefore
were not burdened with high opportunity costs.
Indeed, we find that in both Babylon and England small-scale farmers who chose to invest
were obliged to pay a much higher interest rate than did major institutions, an indication that their
credit worthiness was suspect. In England the problem was compounded by commodity loans that
had to be repaid in cash on unfavorable terms. Standard operating procedure was to borrow at the
moment, just before the harvest, when they ran out of seed or, worse yet, out of food, and repay the
loan after the harvest. According to our data, prices would have meanwhile fallen by 20%: in other
words, the monetary value of 2 bushels before the harvest at 20% interest was equivalent to that of
3 bushels after the harvest, making in effect for an overall interest rate of 50%, and not just the 20%
one set forth in the pre-harvest contract.
As for Babylonia, the interest rate on small loans that were to be repaid in barley or dates was
much higher than the rate for larger loans to be repaid in silver. Flynn and Gíraldez theorize that
silver was highly valued because so little of it was in circulation; therefore repayment in kind was
discouraged, by keeping the interest rate on it high, in order to prompt borrowers to part with their
silver instead.66
This theory corroborates one of ours: that high interest rates were due to a low level
of monetization and to a paucity of silver in circulation.
The sort of silver loans discussed thus far, made as they were to high temple officials and
entrepreneurs with a certain cash liquidity, were by definition an urban phenomenon; those engaged
in small-scale farming, necessarily in more or less remote rural areas, lacked access to capital
markets. The Late Achaemenid (late fifth century BCE) promissory notes from Nippur, in Southern
Babylonia, preserved in the Murašû archive (and those from several other smaller archives as well),
show that in rural areas it were specialized entrepreneurs who extended credit to tenants of „fiefs‟
66
Dennis Flynn and Arturo Gíraldez, „Cycles of silver: global economic unity through the mid-eighteenth century‟,
Journal of World History, 13, 2, 2002, pp. 391-427.
(the term is used here simply to denote land on which service was incumbent in a general way, and
not as part of any feudal system along the lines of medieval Europe‟s) not for the purpose of paying
their taxes, rather than for purposes of increasing one‟s property‟s productivity.67
Repayment is
consistently stipulated as being in kind and occurring during the harvest month. Other archival
materials reveal that with the reign of Darius I (523-486) the tax burden began to increase.68
Again,
as in the case of silver loans, credit for the purpose of improving productivity – for instance, in the
form of trading partnerships known as harrānu -- was a strictly urban and upper-class affair,69
comparable to the consumption loans made to small-scale farmers in England around 1300.
There were two reasons that, despite the fact that their opportunity costs were low (if only
because capital markets were out of reach), most small-scale farmers could not afford to store their
harvests: their lack of collateral meant that small commodity loans carried prohibitively high
interest rates; and the need to repay loans for more immediate needs left them without the means to
engage in the speculative tactic of storing grain for sale in the following year. Indeed, if the temple
in Ebabbar could not afford to store grain (Jursa 2010) it is all the more unlikely that small-scale
farmers could do so.70
In addition, Babylon‟s high famine line, 90 (see Section 2) meant that famine
was an ever-present threat. The potential benefit of low opportunity costs was nullified by the
combination of this famine threat with a heavy tax burden, rendering impracticable the use of crop
storage as a means of manipulating market prices and thereby enhancing profitability.71
Instead,
inter-annual carryover must have been mostly a matter of seasonal leftovers of seasonal and storage
67
The system was first described by Matthew Stolper, Entrepreneurs and empire: the Murašû archive, the Murašû
firm, and Persian rule in Babylonia, Istanbul: Nederlands Historisch-Archaeologisch Instituut te İstanbul, 1985.
Regarding credit, see pp. 104-07. The most recent description of the system is to be found in Jursa, Aspects of the
economic history of Babylonia, pp.198-203. 68
Michael Jursa and Caroline Waerzeggers, „On aspects of taxation in Achaemenid Babylonia: new evidence from
Borsippa‟, in P. Briant and M. Chauveau, eds., Organisation des pouvoirs et contacts culturels dans les pays de l’
empire achéménide (Persika 14), Paris, pp. 237-69. Jursa, Aspects of the economic history of Babylonia, p. 252,
emphasizes that the dependence of these small-scale farmers „on outside funds in order to be able to fulfil their tax
obligations‟ was considered „potentially disruptive to the economy‟ (Jursa 2010, p.60). 69
Jursa, Aspects of the economic history of Babylonia, pp. 206-8. On the distinction between rural consumption loans
and urban credit for business activities, see also the summary remarks (pp. 249-50) of C. Wunsch, „Debt, interest,
pledge, and forfeiture in the Neo-Babylonian and Early Achaemenid period: the evidence from the private archives‟,
in M. Hudson and M. van der Mieroop, eds., Debt and economic renewal in the Ancient Near East, Bethesda, MD:
CDL Press, 2002, pp. 221-55. 70
Jursa, Aspects of the economic history of Babylonia. 71
For a similar argument regarding subsistence and famine frequency, see Ó Grádá, Making famine history, p. 8. ,
on the part of the government.
Conclusion
When it comes to the market in foodstuffs, storage is one of the best ways to reduce risk and thus
maximize market efficiency. Drawing on a large food-price dataset that has only recently been made
available, we estimate possible storage for Hellenistic Babylonia and medieval England. Our
comparison of the extent of food storage in these two regions is based on the model of McCloskey
and Nash (1984), which we are obliged to modify in order to capture the divergence between the
agricultural structures of the two regions. In England wheat and barley were comparable crops, with
an annual-production correlation close to zero, permitting us to combine their variances, a step that
yields rather high annual price fluctuations and therefore equally high potential profits. In Babylon,
the fact that the production of dates was negatively correlated with that of barley indicates that the
effect of a meager harvest of one of these two crops could be offset by an abundant harvest of the
other, reducing the standard deviation of total crop output, and thus price volatility to a level at
which it was less profitable in Hellenistic Babylonia than it was in medieval England.
We find little evidence for any substantial storage in either of the two regions, where for
large-scale merchants costs outweighed benefits, especially in the case of Babylon, where
seasonality and therefore potential benefits were less significant than they were in England; nor do
we find evidence for any significant inter-annual storage on the part of small-scale farmers, whose
access to capital markets (and thus low opportunity costs) was limited. A plausible explanation for
this situation is the immense tax burden on Babylonians, which obliged even the large temples to
sell all of their agricultural products as soon as possible after the harvest.
We also find that, even though potential benefits (i.e., seasonality) in Babylon were lower
than they were in England, this does not hold for interest rates, being the main component of costs.
This finding, in combination with the limited possibilities of loans to small-scale farmers, suggests
that interest rates were set to a large extent outside of the agricultural sector, meaning that – despite
the finding of McCloskey and Nash (1984) that they are, as a rule, positively correlated with
seasonality over time within one region72
this is not necessarily the case across two or more regions
-- including one that is ancient and the other medieval, and both overwhelmingly agricultural.
Bas van Leeuwen is senior researcher at the department of economics, Warwick University, and
postdoc researcher at the Free University and Utrecht University
Peter Foldvari is associate professor at the department of economics and business history,
Debrecen University, amd postdoc researcher at Utrecht University.
Reinhard Pirngruber is a PhD student at the Faculty of humanities, Free University.
72
McCloskey and Nash, „Corn at interest‟, p. 183.
Appendix: A Monte Carlo Simulation of the impact of storage on famine
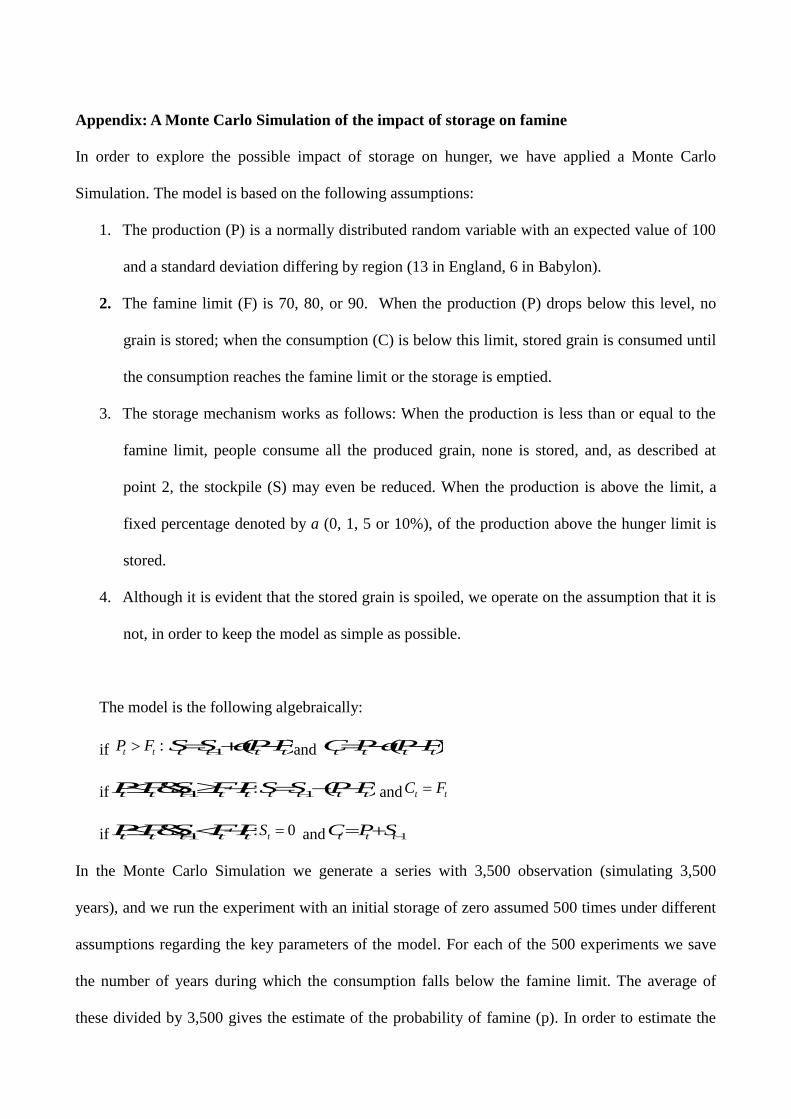
In order to explore the possible impact of storage on hunger, we have applied a Monte Carlo
Simulation. The model is based on the following assumptions:
1. The production (P) is a normally distributed random variable with an expected value of 100
and a standard deviation differing by region (13 in England, 6 in Babylon).
2. The famine limit (F) is 70, 80, or 90. When the production (P) drops below this level, no
grain is stored; when the consumption (C) is below this limit, stored grain is consumed until
the consumption reaches the famine limit or the storage is emptied.
3. The storage mechanism works as follows: When the production is less than or equal to the
famine limit, people consume all the produced grain, none is stored, and, as described at
point 2, the stockpile (S) may even be reduced. When the production is above the limit, a
fixed percentage denoted by a (0, 1, 5 or 10%), of the production above the hunger limit is
stored.
4. Although it is evident that the stored grain is spoiled, we operate on the assumption that it is
not, in order to keep the model as simple as possible.
The model is the following algebraically:
if :t tP F 1 ( )t t t tS S aPF and ( )t t t tC PaPF
if 1& :t t t t tPFS FP 1 ( )t t t tS S PF and t tC F
if 1& :t t t t tPFS FP 0tS and 1t t tC P S
In the Monte Carlo Simulation we generate a series with 3,500 observation (simulating 3,500
years), and we run the experiment with an initial storage of zero assumed 500 times under different
assumptions regarding the key parameters of the model. For each of the 500 experiments we save
the number of years during which the consumption falls below the famine limit. The average of
these divided by 3,500 gives the estimate of the probability of famine (p). In order to estimate the

average waiting time between two famines, we use a geometric distribution with parameter p, which
has the probability mass function: (1 )kp p . The average waiting time is simply the expected value,
that is, 1 p
p
.
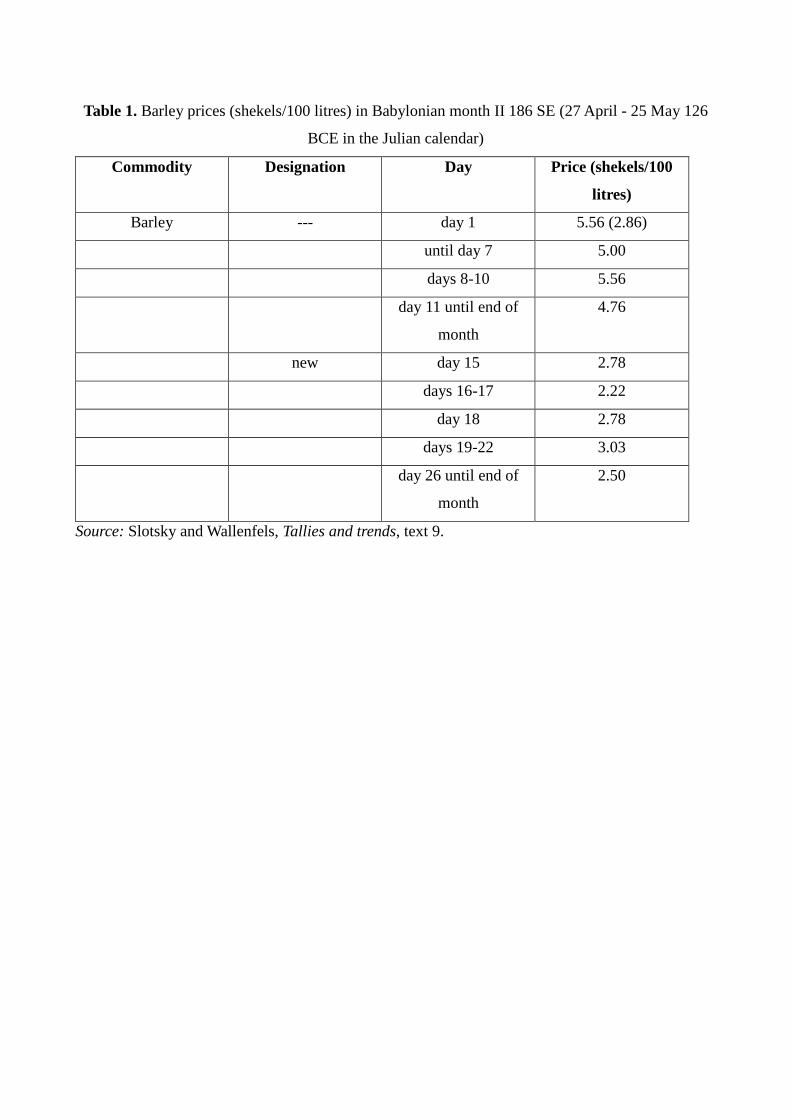
Table 1. Barley prices (shekels/100 litres) in Babylonian month II 186 SE (27 April - 25 May 126
BCE in the Julian calendar)
Commodity Designation Day Price (shekels/100
litres)
Barley --- day 1 5.56 (2.86)
until day 7 5.00
days 8-10 5.56
day 11 until end of
month
4.76
new day 15 2.78
days 16-17 2.22
day 18 2.78
days 19-22 3.03
day 26 until end of
month
2.50
Source: Slotsky and Wallenfels, Tallies and trends, text 9.
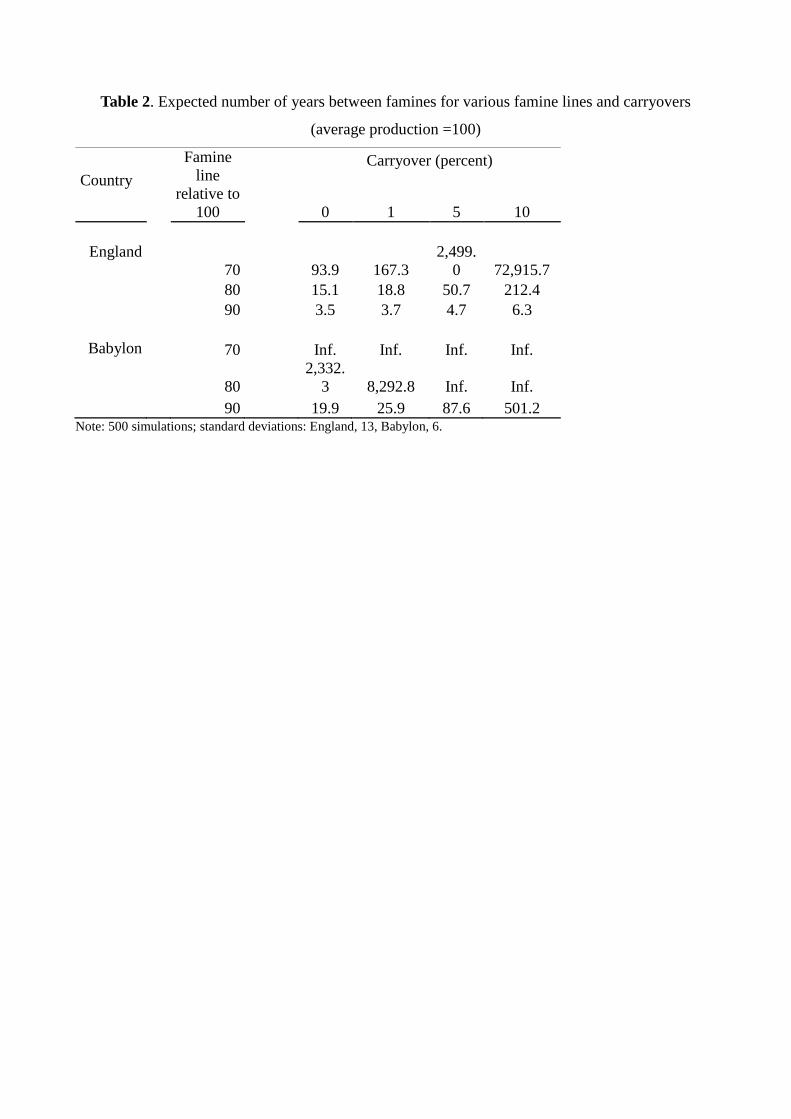
Table 2. Expected number of years between famines for various famine lines and carryovers
(average production =100)
Famine
line
relative to
100
Carryover (percent)
Country
0 1 5 10
England
70 93.9 167.3
2,499.
0 72,915.7
80 15.1 18.8 50.7 212.4
90 3.5 3.7 4.7 6.3
Babylon 70 Inf. Inf. Inf. Inf.
80
2,332.
3 8,292.8 Inf. Inf.
90 19.9 25.9 87.6 501.2 Note: 500 simulations; standard deviations: England, 13, Babylon, 6.
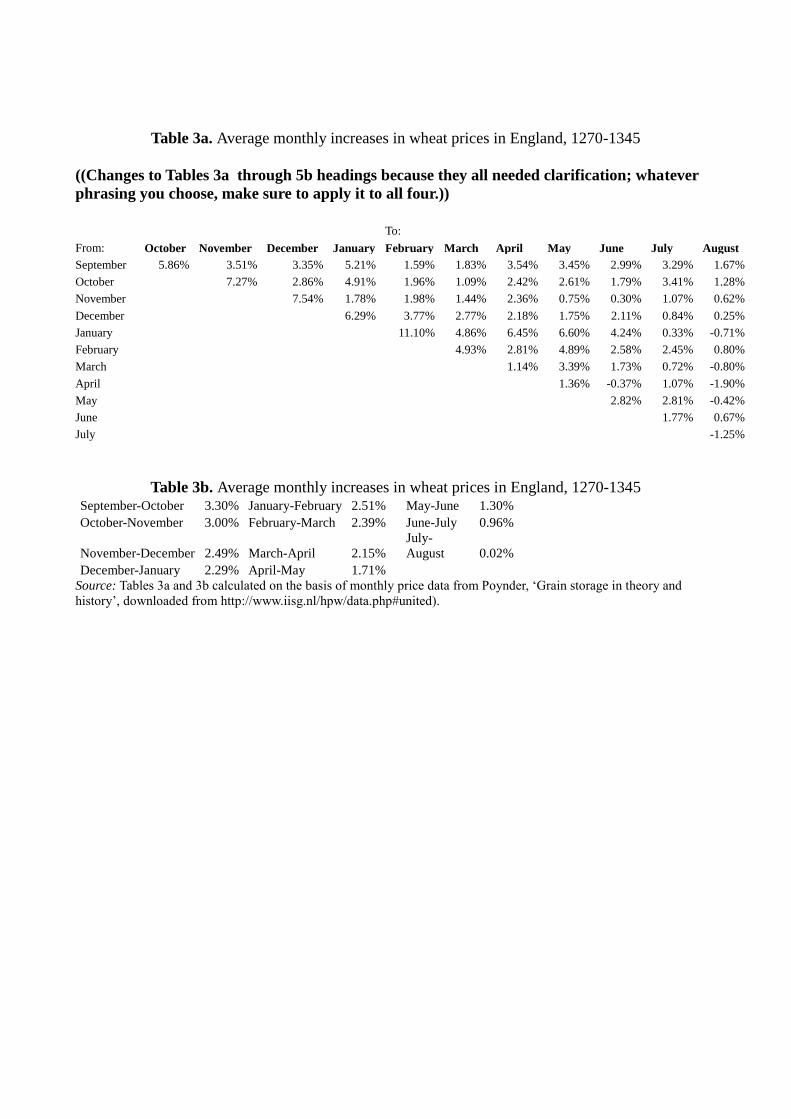
Table 3a. Average monthly increases in wheat prices in England, 1270-1345
((Changes to Tables 3a through 5b headings because they all needed clarification; whatever
phrasing you choose, make sure to apply it to all four.))
To:
From: October November December January February March April May June July August
September 5.86% 3.51% 3.35% 5.21% 1.59% 1.83% 3.54% 3.45% 2.99% 3.29% 1.67%
October 7.27% 2.86% 4.91% 1.96% 1.09% 2.42% 2.61% 1.79% 3.41% 1.28%
November 7.54% 1.78% 1.98% 1.44% 2.36% 0.75% 0.30% 1.07% 0.62%
December 6.29% 3.77% 2.77% 2.18% 1.75% 2.11% 0.84% 0.25%
January 11.10% 4.86% 6.45% 6.60% 4.24% 0.33% -0.71%
February 4.93% 2.81% 4.89% 2.58% 2.45% 0.80%
March 1.14% 3.39% 1.73% 0.72% -0.80%
April 1.36% -0.37% 1.07% -1.90%
May 2.82% 2.81% -0.42%
June 1.77% 0.67%
July -1.25%
Table 3b. Average monthly increases in wheat prices in England, 1270-1345 September-October 3.30% January-February 2.51% May-June 1.30%
October-November 3.00% February-March 2.39% June-July 0.96%
November-December 2.49% March-April 2.15%
July-
August 0.02%
December-January 2.29% April-May 1.71%
Source: Tables 3a and 3b calculated on the basis of monthly price data from Poynder, „Grain storage in theory and
history‟, downloaded from http://www.iisg.nl/hpw/data.php#united).
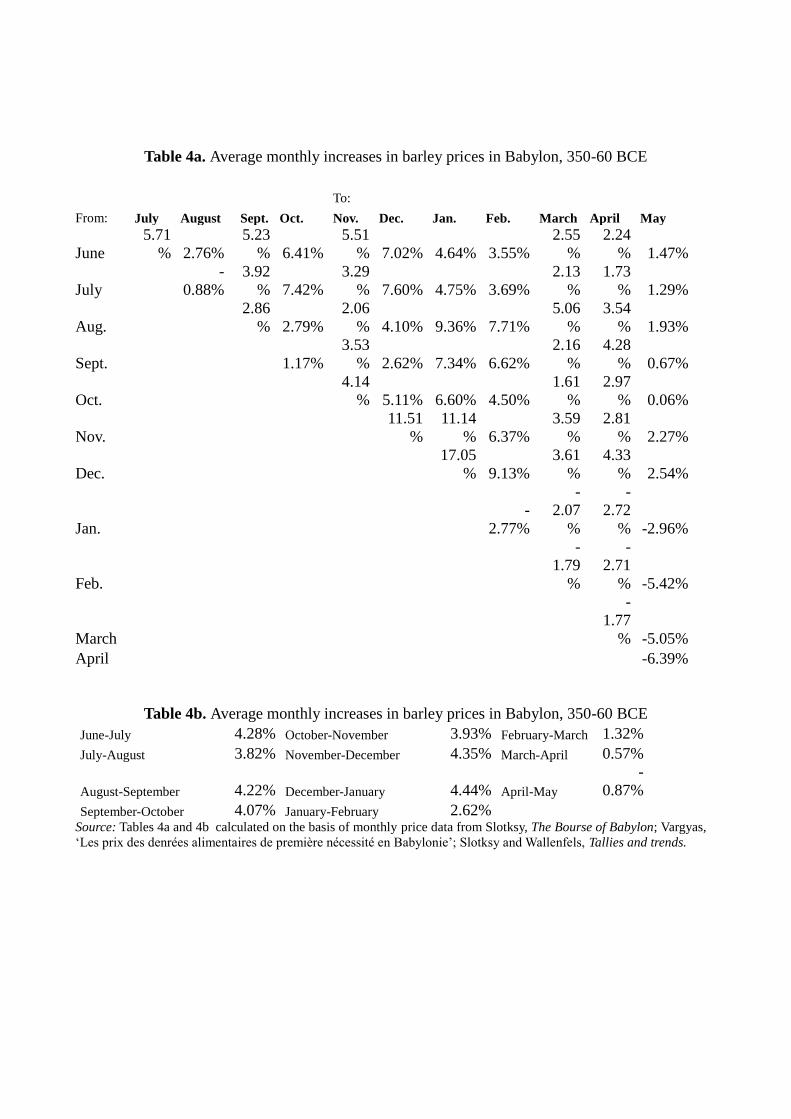
Table 4a. Average monthly increases in barley prices in Babylon, 350-60 BCE
To:
From: July August Sept. Oct. Nov. Dec. Jan. Feb. March April May
June
5.71
% 2.76%
5.23
% 6.41%
5.51
% 7.02% 4.64% 3.55%
2.55
%
2.24
% 1.47%
July
-
0.88%
3.92
% 7.42%
3.29
% 7.60% 4.75% 3.69%
2.13
%
1.73
% 1.29%
Aug.
2.86
% 2.79%
2.06
% 4.10% 9.36% 7.71%
5.06
%
3.54
% 1.93%
Sept. 1.17%
3.53
% 2.62% 7.34% 6.62%
2.16
%
4.28
% 0.67%
Oct.
4.14
% 5.11% 6.60% 4.50%
1.61
%
2.97
% 0.06%
Nov.
11.51
%
11.14
% 6.37%
3.59
%
2.81
% 2.27%
Dec.
17.05
% 9.13%
3.61
%
4.33
% 2.54%
Jan.
-
2.77%
-
2.07
%
-
2.72
% -2.96%
Feb.
-
1.79
%
-
2.71
% -5.42%
March
-
1.77
% -5.05%
April -6.39%
Table 4b. Average monthly increases in barley prices in Babylon, 350-60 BCE
June-July 4.28% October-November 3.93% February-March 1.32%
July-August 3.82% November-December 4.35% March-April 0.57%
August-September 4.22% December-January 4.44% April-May
-
0.87%
September-October 4.07% January-February 2.62%
Source: Tables 4a and 4b calculated on the basis of monthly price data from Slotksy, The Bourse of Babylon; Vargyas,
„Les prix des denrées alimentaires de première nécessité en Babylonie‟; Slotksy and Wallenfels, Tallies and trends.
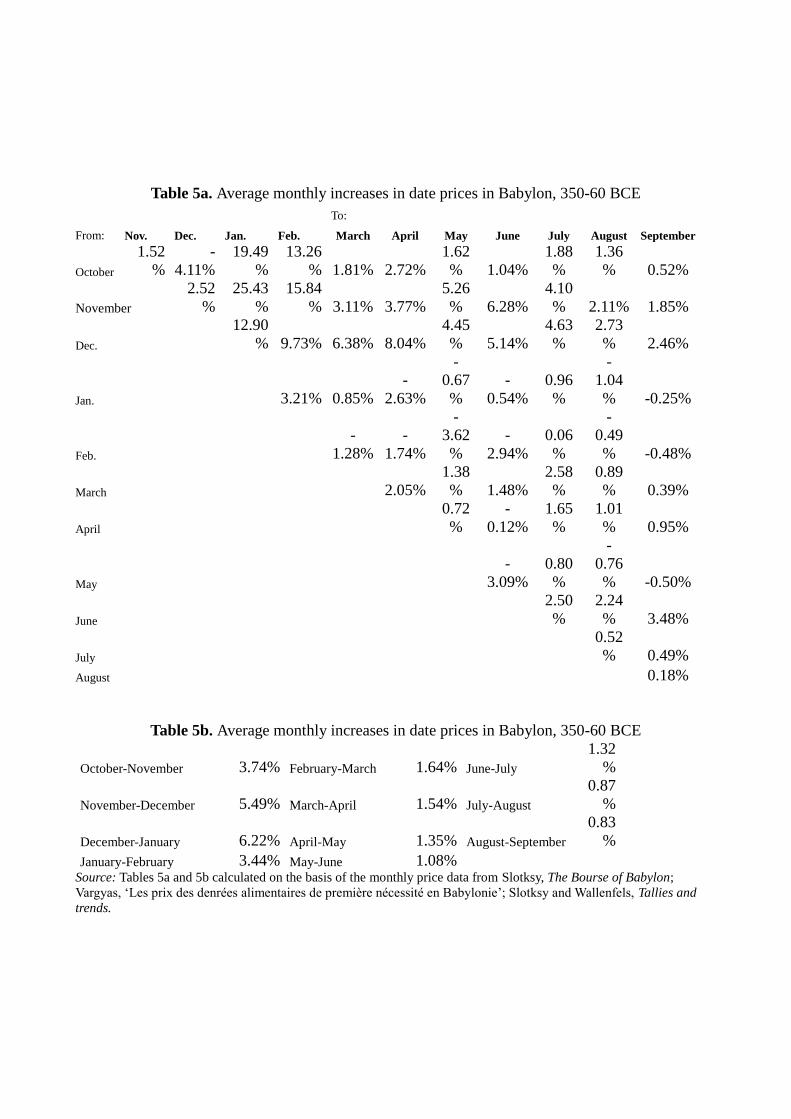
Table 5a. Average monthly increases in date prices in Babylon, 350-60 BCE
To:
From: Nov. Dec. Jan. Feb. March April May June July August September
October
1.52
%
-
4.11%
19.49
%
13.26
% 1.81% 2.72%
1.62
% 1.04%
1.88
%
1.36
% 0.52%
November
2.52
%
25.43
%
15.84
% 3.11% 3.77%
5.26
% 6.28%
4.10
% 2.11% 1.85%
Dec.
12.90
% 9.73% 6.38% 8.04%
4.45
% 5.14%
4.63
%
2.73
% 2.46%
Jan. 3.21% 0.85%
-
2.63%
-
0.67
%
-
0.54%
0.96
%
-
1.04
% -0.25%
Feb.
-
1.28%
-
1.74%
-
3.62
%
-
2.94%
0.06
%
-
0.49
% -0.48%
March 2.05%
1.38
% 1.48%
2.58
%
0.89
% 0.39%
April
0.72
%
-
0.12%
1.65
%
1.01
% 0.95%
May
-
3.09%
0.80
%
-
0.76
% -0.50%
June
2.50
%
2.24
% 3.48%
July
0.52
% 0.49%
August 0.18%
Table 5b. Average monthly increases in date prices in Babylon, 350-60 BCE
October-November 3.74% February-March 1.64% June-July
1.32
%
November-December 5.49% March-April 1.54% July-August
0.87
%
December-January 6.22% April-May 1.35% August-September
0.83
%
January-February 3.44% May-June 1.08%
Source: Tables 5a and 5b calculated on the basis of the monthly price data from Slotksy, The Bourse of Babylon;
Vargyas, „Les prix des denrées alimentaires de première nécessité en Babylonie‟; Slotksy and Wallenfels, Tallies and
trends.
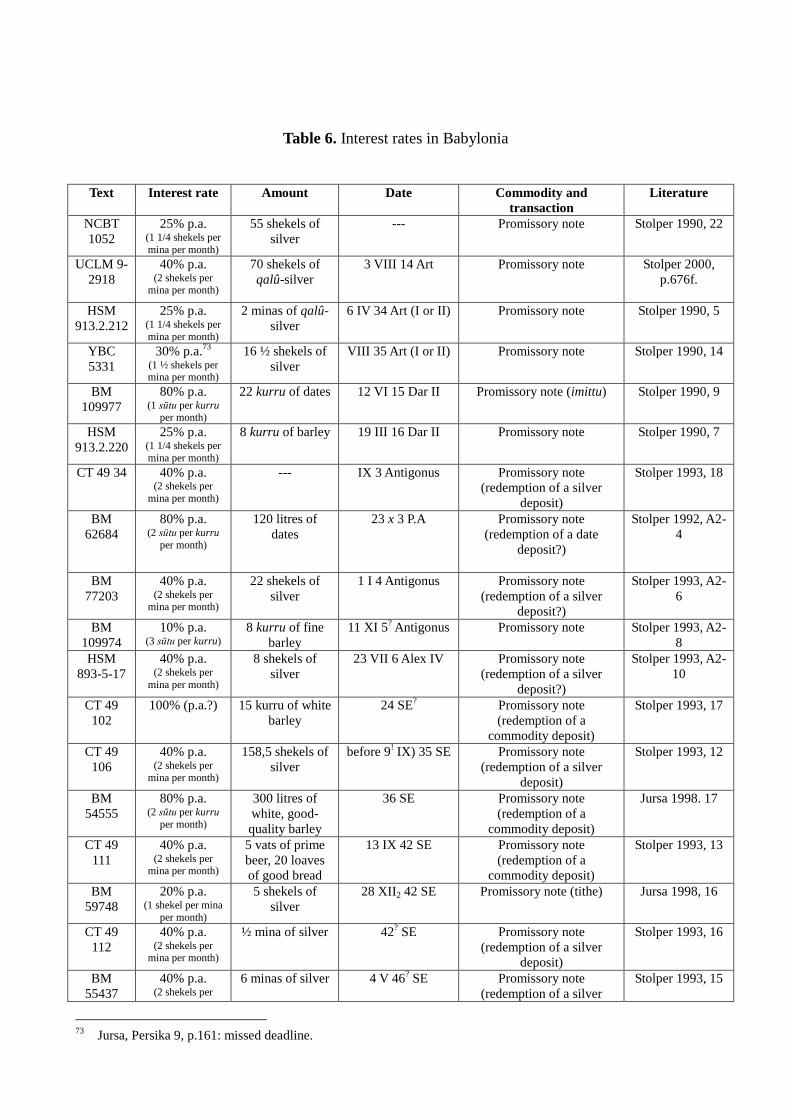
Table 6. Interest rates in Babylonia
Text Interest rate Amount Date Commodity and
transaction
Literature
NCBT
1052
25% p.a. (1 1/4 shekels per
mina per month)
55 shekels of
silver
--- Promissory note Stolper 1990, 22
UCLM 9-
2918
40% p.a. (2 shekels per
mina per month)
70 shekels of
qalû-silver
3 VIII 14 Art
Promissory note Stolper 2000,
p.676f.
HSM
913.2.212
25% p.a. (1 1/4 shekels per
mina per month)
2 minas of qalû-
silver
6 IV 34 Art (I or II) Promissory note Stolper 1990, 5
YBC
5331
30% p.a.73
(1 ½ shekels per mina per month)
16 ½ shekels of
silver
VIII 35 Art (I or II)
Promissory note Stolper 1990, 14
BM
109977
80% p.a. (1 sūtu per kurru
per month)
22 kurru of dates 12 VI 15 Dar II
Promissory note (imittu) Stolper 1990, 9
HSM
913.2.220
25% p.a. (1 1/4 shekels per
mina per month)
8 kurru of barley 19 III 16 Dar II Promissory note Stolper 1990, 7
CT 49 34 40% p.a. (2 shekels per
mina per month)
--- IX 3 Antigonus
Promissory note
(redemption of a silver
deposit)
Stolper 1993, 18
BM
62684
80% p.a. (2 sūtu per kurru
per month)
120 litres of
dates
23 x 3 P.A
Promissory note
(redemption of a date
deposit?)
Stolper 1992, A2-
4
BM
77203
40% p.a. (2 shekels per
mina per month)
22 shekels of
silver
1 I 4 Antigonus Promissory note
(redemption of a silver
deposit?)
Stolper 1993, A2-
6
BM
109974
10% p.a. (3 sūtu per kurru)
8 kurru of fine
barley
11 XI 5? Antigonus Promissory note Stolper 1993, A2-
8
HSM
893-5-17
40% p.a. (2 shekels per
mina per month)
8 shekels of
silver
23 VII 6 Alex IV
Promissory note
(redemption of a silver
deposit?)
Stolper 1993, A2-
10
CT 49
102
100% (p.a.?) 15 kurru of white
barley
24 SE?
Promissory note
(redemption of a
commodity deposit)
Stolper 1993, 17
CT 49
106
40% p.a. (2 shekels per
mina per month)
158,5 shekels of
silver
before 9! IX) 35 SE Promissory note
(redemption of a silver
deposit)
Stolper 1993, 12
BM
54555
80% p.a. (2 sūtu per kurru
per month)
300 litres of
white, good-
quality barley
36 SE Promissory note
(redemption of a
commodity deposit)
Jursa 1998. 17
CT 49
111
40% p.a. (2 shekels per
mina per month)
5 vats of prime
beer, 20 loaves
of good bread
13 IX 42 SE
Promissory note
(redemption of a
commodity deposit)
Stolper 1993, 13
BM
59748
20% p.a. (1 shekel per mina
per month)
5 shekels of
silver
28 XII2 42 SE
Promissory note (tithe) Jursa 1998, 16
CT 49
112
40% p.a. (2 shekels per
mina per month)
½ mina of silver 42? SE
Promissory note
(redemption of a silver
deposit)
Stolper 1993, 16
BM
55437
40% p.a. (2 shekels per
6 minas of silver 4 V 46? SE
Promissory note
(redemption of a silver
Stolper 1993, 15
73
Jursa, Persika 9, p.161: missed deadline.
mina per month) deposit)
CT 49
116
40% p.a. (2 shekels per
mina per month)
--- 49 SE Promissory note?
(redemption of a
commodity deposit)
Jursa 2006, p.185
CT 49
119
80% p.a. (2 sūtu per kurru
per month)
48 litres of
barley
28 x 51 SE
Promissory note
(redemption of a
commodity deposit)
Jursa 2006, 188f.
CT 49
120
80% p.a. (2 sūtu per kurru
per month)
2 shekels of
silver
(convertible to 2
kurru of barley
after first
deadline)
XII 52 SE Promissory note
(redemption of a
silver/commodity deposit)
Jursa 2006,
p.189f.
CT 49
121
40% p.a. (2 shekels per
mina per month)
80 shekels of
silver
54 SE
Promissory note
(redemption of a silver
deposit)
Stolper 1993, 14
CT 39
133
25% p.a.(?) 40 shekels of
silver
25 [VII] 96 SE Silver deposit Stolper 1993, 10
CT 49
134
25% p.a.(?) 40 shekels of
silver
19 [VII] 100 SE Silver deposit Stolper 1993, 11
Sources: Matthew Stolper, „Late Achaemenid legal texts from Uruk and Larsa‟, Baghdader Mitteilungen, 21, 1990, pp.
559-622; Matthew W. Stolper, „Late Achaemenid, Early Macedonian, and Early Seleucid records of deposit and related
texts‟, AION Suppl., 77, Napoli, 1993; Matthew Stolper, „Buildings on bow lands and encumbrances on buildings‟, in
R. Dittmann et al., eds., Variatio delectat. Iran und der Westen (Fs. P. Calmeyer), Münster: Ugarit-Verlag, 2000;
Michael Jursa, Der Tempelzehnt in Babylonien vom siebenten bis zum dritten Jahrhundert v. Chr., Münster: AOAT, 254,
1998; Jursa, „Agricultural managing, tax farming, and banking‟.