Embed Size (px)
Citation preview

Customer Satisfaction MARKETING ANALYTICS PROJECT
Submitted by-Anurag Patel(15BM6JP07)Sailesh Mohanty(15BM6JP39)

The problemWhich Customers are happy Customers?
Santander Bank is asking to help them identify dissatisfied customers early in their relationship. Doing so would allow Santander to take proactive steps to improve a customer's happiness before it's too late.

Index
Methods to measures customer satisfaction
About dataModels fittedResult
Methods to Measure Customer Satisfaction
Customer Satisfaction Survey
Net Promoter Score Survey
Customer Feedback Survey

Customer Satisfaction Survey
Overall how satisfied you are with company?
Describe the product in one word
Value for the money of the product
How well do our product meets your need?
Customer Care Service Rating
Likelihood of purchasing in future
How would you rate the quality of product

Customer Feedback Survey
Overall how would you rate the quality of service/product
How much time did it take to address your problem
How well did we understand your questions?
How would you rate the quality of product

Net Promoter Score Survey
on the scale of 1 to 10,How likely you are to recommend the product to your friends
If % of promoters is significantly higher ===> customers are satisfied

Our Dataset Contains both...
Customer Satisfaction Survey Questionnaire
Customer Feedback Survey Questionnaire

The Data:Santander Bank

Familiarising with the data
Anonymized data set containing 370 features.
The response variable is a binary variable, where 0 indicates dissatisfied customers and 1 indicates satisfied customers
Training Data Set - 76020 rows (No. of Satisfied Customers - 3008)
Testing Data Set - 75818
The model evaluation metric used is AUC (Area under the curve)

Our Approach

Feature Engineering and Selection
Selecting a subset of important features out of the given list of 370 features is crucial.
The following methods were implemented for feature selection:Some variables had only one level. They were deleted
Highly correlated variables were removed.
A combination of 50 variables was chosen that gave the best AUC score on the validation set, this was done via a simple random forest model on the data and then choosing the important variables.

Challenges
Anonymized data set. Deciphering the variables would of greater help in helping build better models.
Based on market survey conducted by Santander Bank, so the method of data collection is beyond our purview.
Data was skewed heavily in favor of dissatisfied customers, so there is a need to oversample to counter the imbalance.


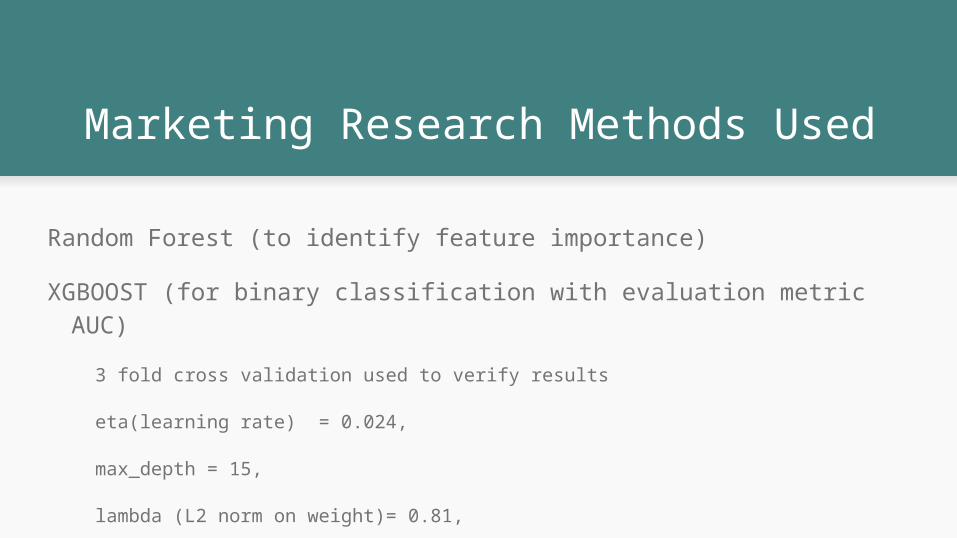
Marketing Research Methods Used
Random Forest (to identify feature importance)
XGBOOST (for binary classification with evaluation metric AUC)3 fold cross validation used to verify results
eta(learning rate) = 0.024,
max_depth = 15,
lambda (L2 norm on weight)= 0.81,
lambda_bias(L2 norm on bias) = 0.519,
subsample(of training sample) = 75.8%,
colsample_bytree(no features used in a tree) = 65.2%,
min_child_weight = 13.1,
gamma = 1.43

Further AnalysisWe found the following variables to be highly important as per the
XGBOOST model: 'var15',
'ind_var5',
'ind_var8_0',
'ind_var30',
'num_var5',
'num_var30',
'num_var42',
'var36',
'num_meses_var5_ult3'


Results
Final Model used: Weighted ensemble of Random Forest (10%) and XGBOOST (90%)
AUC Score obtained: 0.841667
Rank: 125/4105
AUC score lag from leader = 0.002125

Way Ahead
Outlier detection of variables.
Using further techniques like Naive Bayes, SVM, LDA to develop a better ensemble
Identify variables that can be clustered to generate features.
Identify clusters using self organizing maps.