Embed Size (px)
Citation preview
Aswath Damodaran 120
Price Sales Ratio: Definition
The price/sales ratio is the ratio of the market value of equity to the sales.
Price/ Sales=
Consistency Tests • The price/sales ratio is internally inconsistent, since the market value of equity is
divided by the total revenues of the firm.
€
Market value of equityRevenues
Aswath Damodaran 121
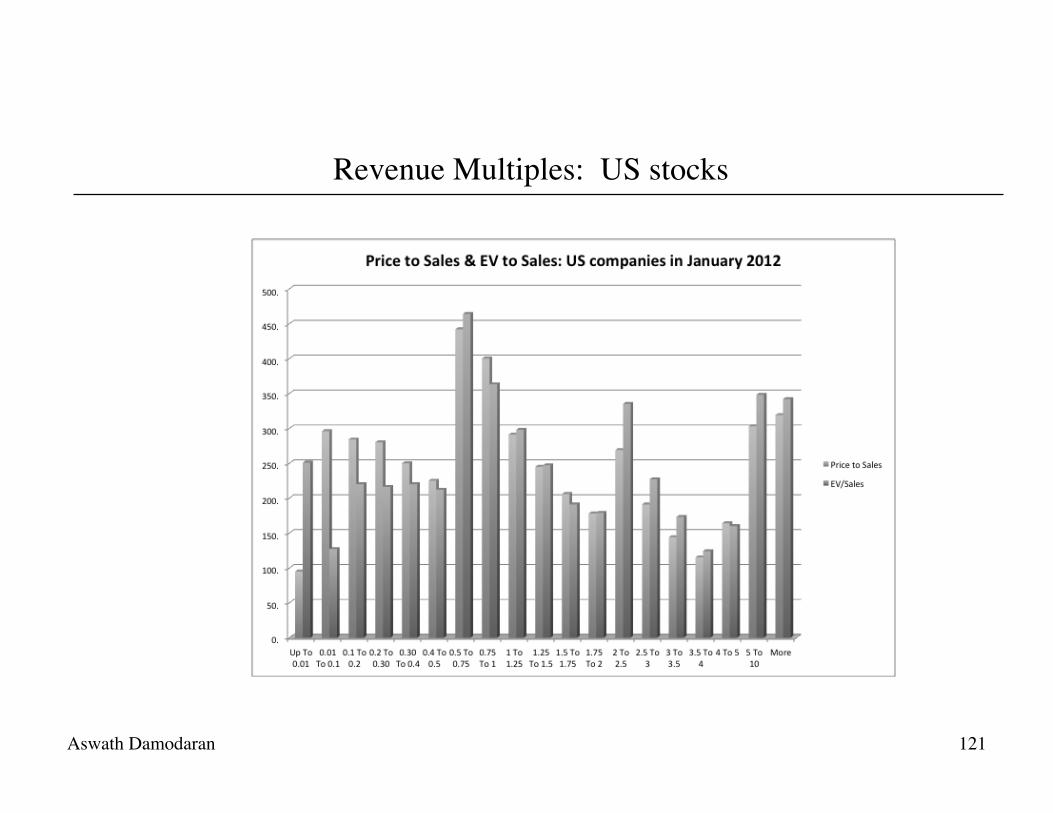
Revenue Multiples: US stocks
Aswath Damodaran 122
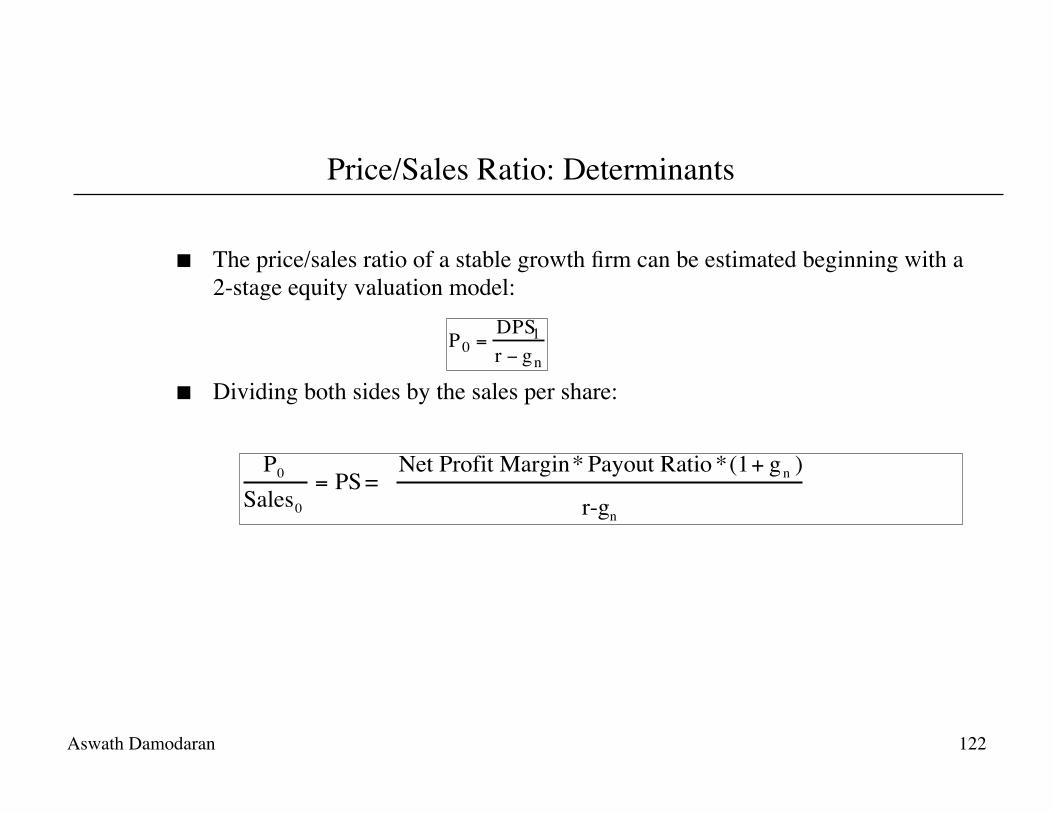
Price/Sales Ratio: Determinants
The price/sales ratio of a stable growth firm can be estimated beginning with a 2-stage equity valuation model:
Dividing both sides by the sales per share:
P0 =DPS1r − gn
P0
Sales0
= PS = Net Profit Margin* Payout Ratio *(1+ gn )
r-gn
Aswath Damodaran 123
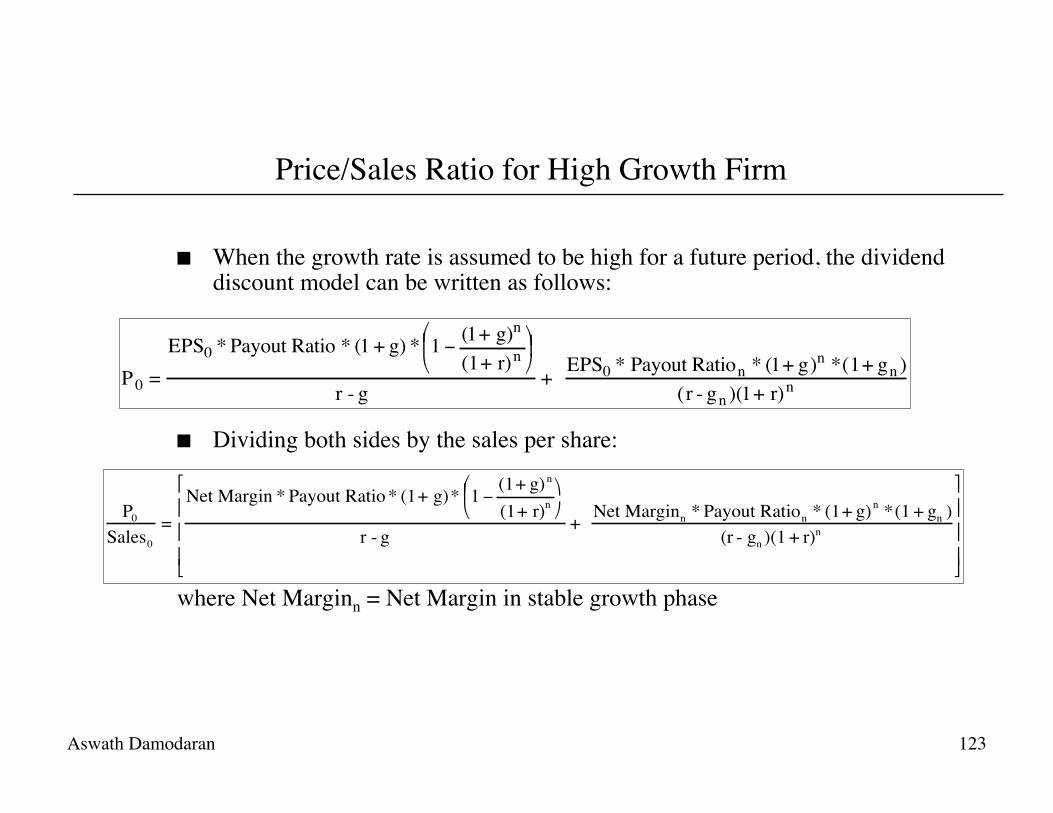
Price/Sales Ratio for High Growth Firm
When the growth rate is assumed to be high for a future period, the dividend discount model can be written as follows:
Dividing both sides by the sales per share: where Net Marginn = Net Margin in stable growth phase
P 0 =EPS0 * Payout Ratio * (1 + g) * 1 − (1+ g)n
(1+ r)n"
# $ %
& '
r - g+
EPS0 * Payout Ration * (1+ g)n *(1+ gn )(r - gn )(1+ r)n
P0
Sales0
=Net Margin * Payout Ratio * (1+ g)* 1 −
(1+ g)n
(1+ r)n
"
# $ %
&
r - g+
Net Marginn * Payout Ration * (1+ g)n *(1 + gn )(r - gn )(1 + r)n
'
(
) ) )
*
+
, , ,
Aswath Damodaran 124
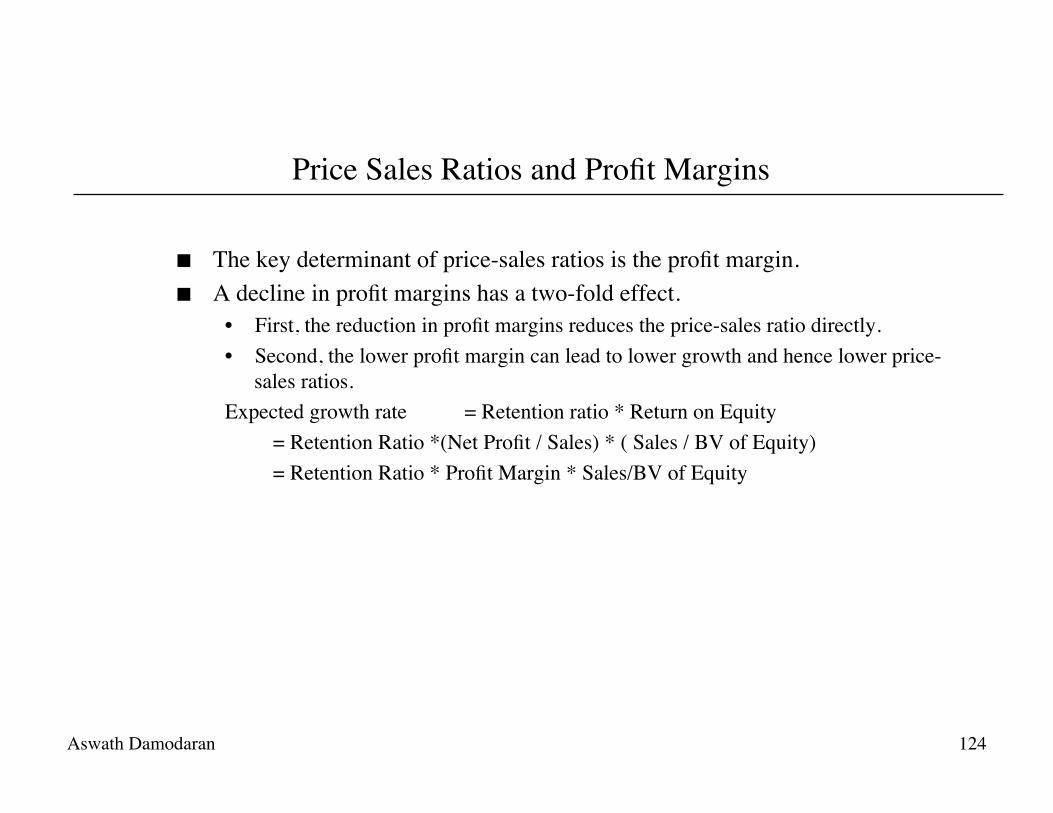
Price Sales Ratios and Profit Margins
The key determinant of price-sales ratios is the profit margin. A decline in profit margins has a two-fold effect.
• First, the reduction in profit margins reduces the price-sales ratio directly. • Second, the lower profit margin can lead to lower growth and hence lower price-
sales ratios. Expected growth rate = Retention ratio * Return on Equity = Retention Ratio *(Net Profit / Sales) * ( Sales / BV of Equity) = Retention Ratio * Profit Margin * Sales/BV of Equity
Aswath Damodaran 125
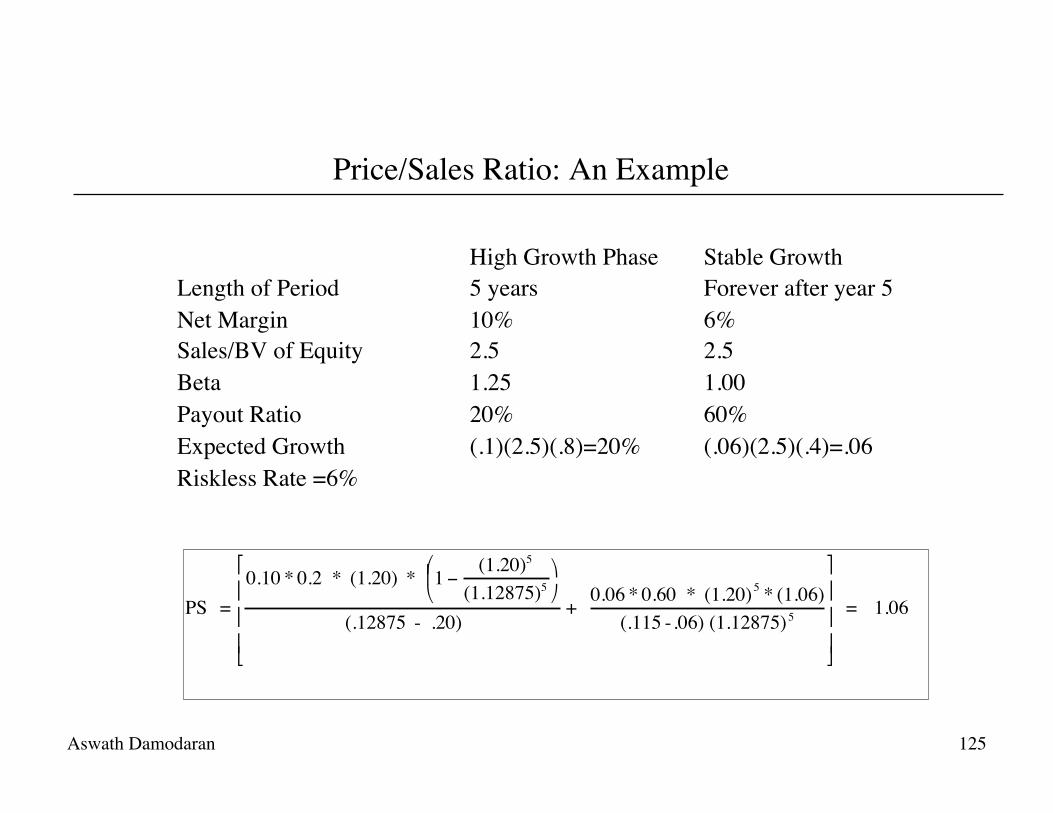
Price/Sales Ratio: An Example
High Growth Phase Stable Growth Length of Period 5 years Forever after year 5 Net Margin 10% 6% Sales/BV of Equity 2.5 2.5 Beta 1.25 1.00 Payout Ratio 20% 60% Expected Growth (.1)(2.5)(.8)=20% (.06)(2.5)(.4)=.06 Riskless Rate =6% PS =
0.10 * 0.2 * (1.20) * 1 − (1.20)5
(1.12875)5
"
# $ %
&
(.12875 - .20)+ 0.06 * 0.60 * (1.20)5 * (1.06)
(.115 -.06) (1.12875)5
'
(
) ) )
*
+
, , ,
= 1.06
Aswath Damodaran 126
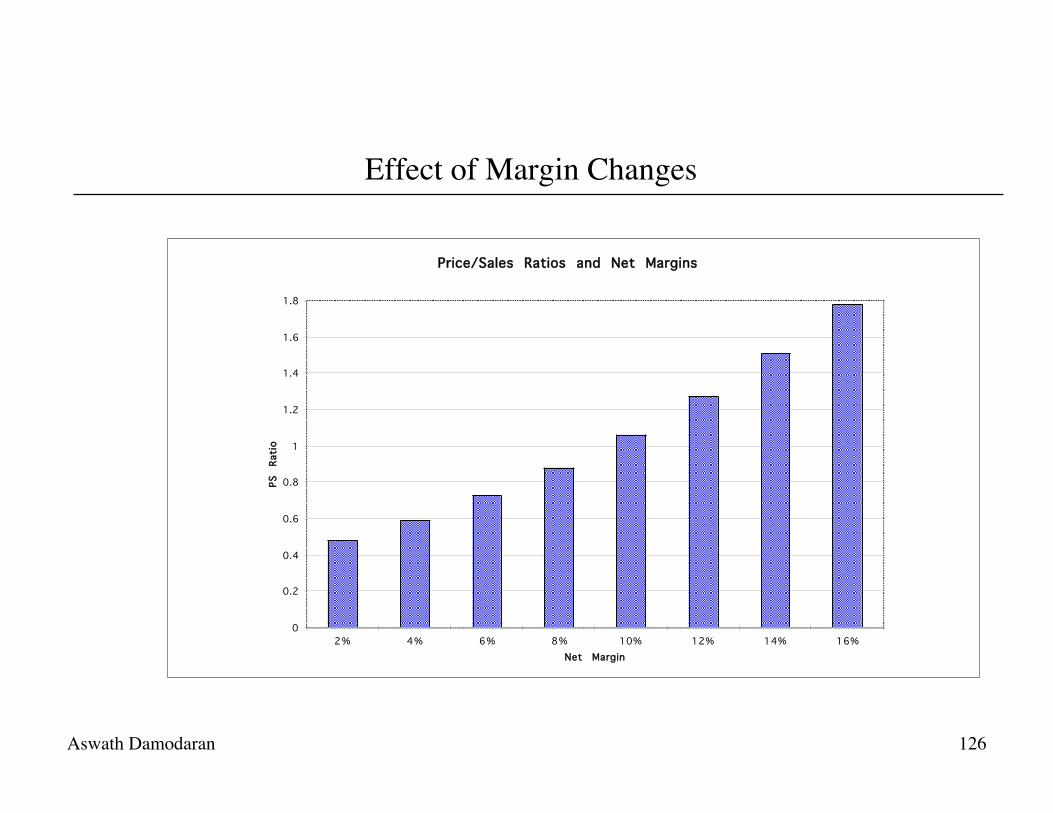
Effect of Margin Changes
Price/Sales Ratios and Net Margins
0
0.2
0.4
0.6
0.8
1
1.2
1.4
1.6
1.8
2% 4% 6% 8% 10% 12% 14% 16%Net Margin
PS
Rati
o
Aswath Damodaran 127
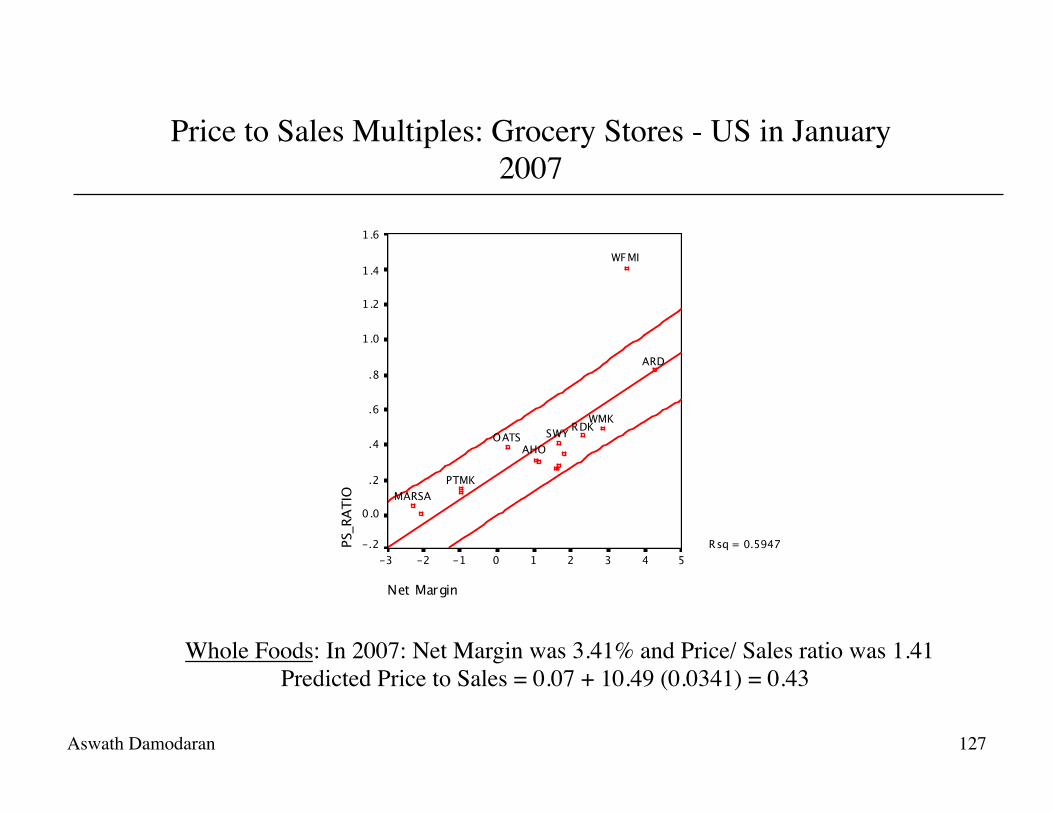
Price to Sales Multiples: Grocery Stores - US in January 2007
Net Margin
543210-1-2-3
PS_R
ATIO
1 .6
1.4
1.2
1.0
.8
.6
.4
.2
0.0
-.2 Rsq = 0.5947
WFMI
ARD
RDKSWYWMK
AHOOATS
PTMKMARSA
Whole Foods: In 2007: Net Margin was 3.41% and Price/ Sales ratio was 1.41 Predicted Price to Sales = 0.07 + 10.49 (0.0341) = 0.43
Aswath Damodaran 128
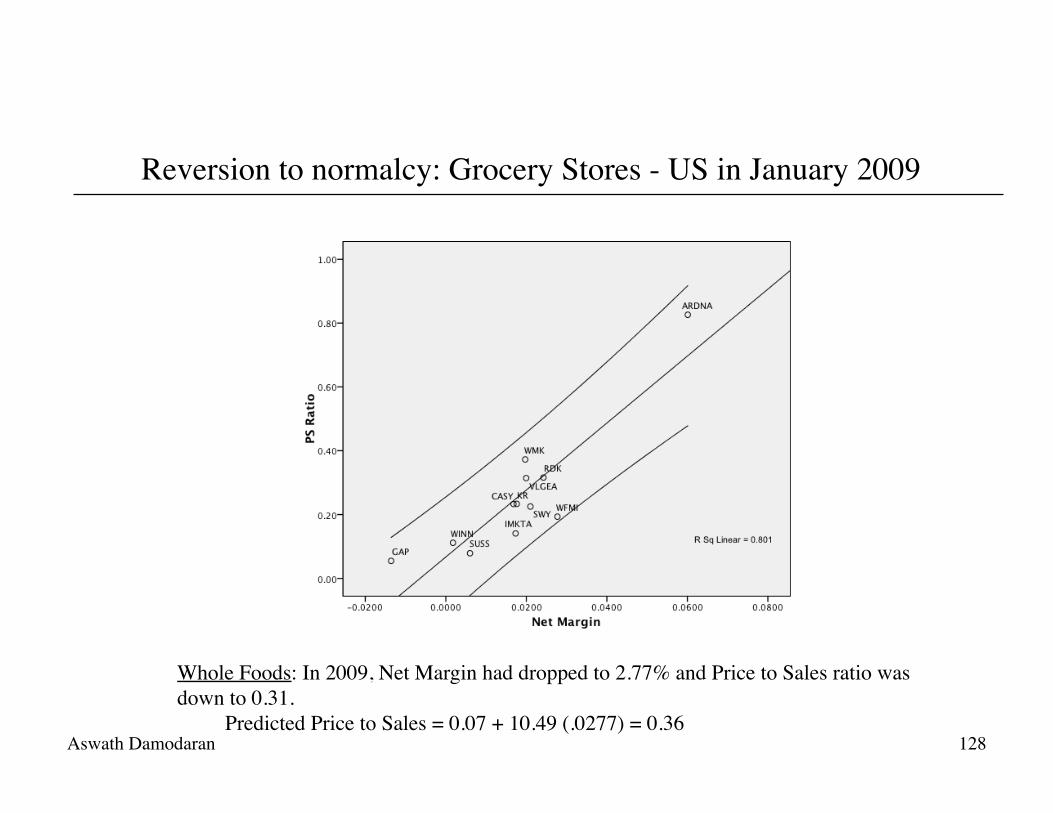
Reversion to normalcy: Grocery Stores - US in January 2009
Whole Foods: In 2009, Net Margin had dropped to 2.77% and Price to Sales ratio was down to 0.31.
Predicted Price to Sales = 0.07 + 10.49 (.0277) = 0.36
Aswath Damodaran 129
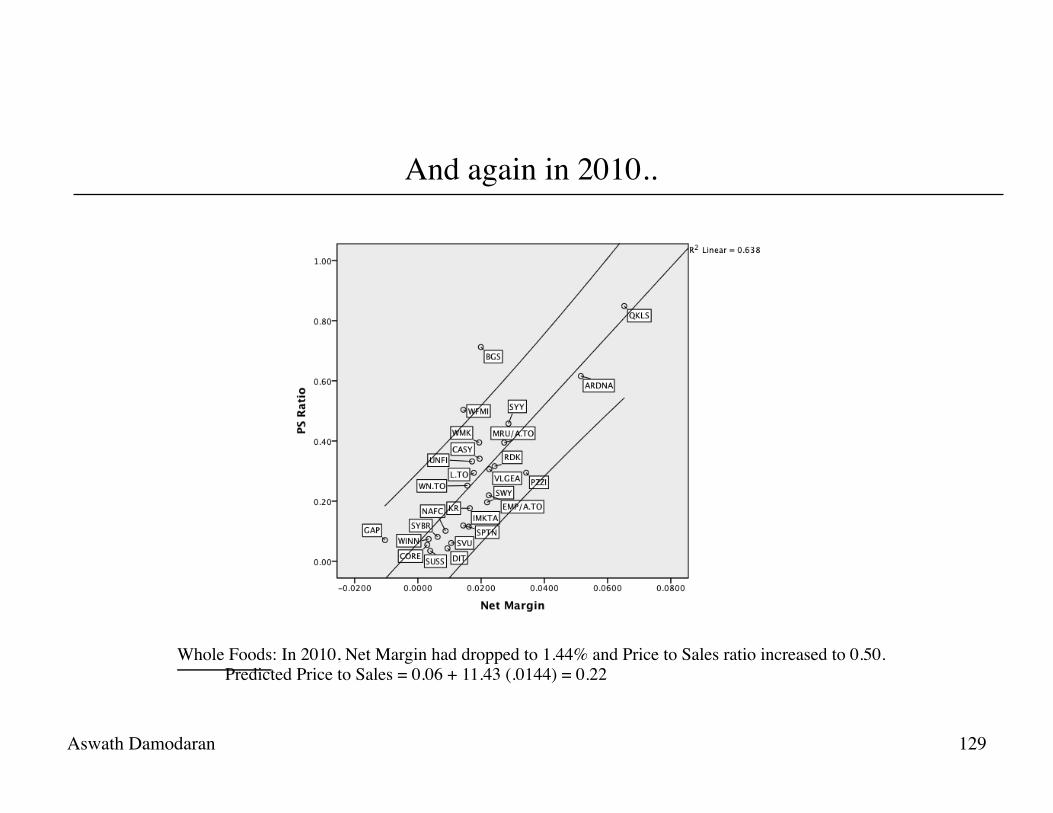
And again in 2010..
Whole Foods: In 2010, Net Margin had dropped to 1.44% and Price to Sales ratio increased to 0.50. Predicted Price to Sales = 0.06 + 11.43 (.0144) = 0.22
Aswath Damodaran 130
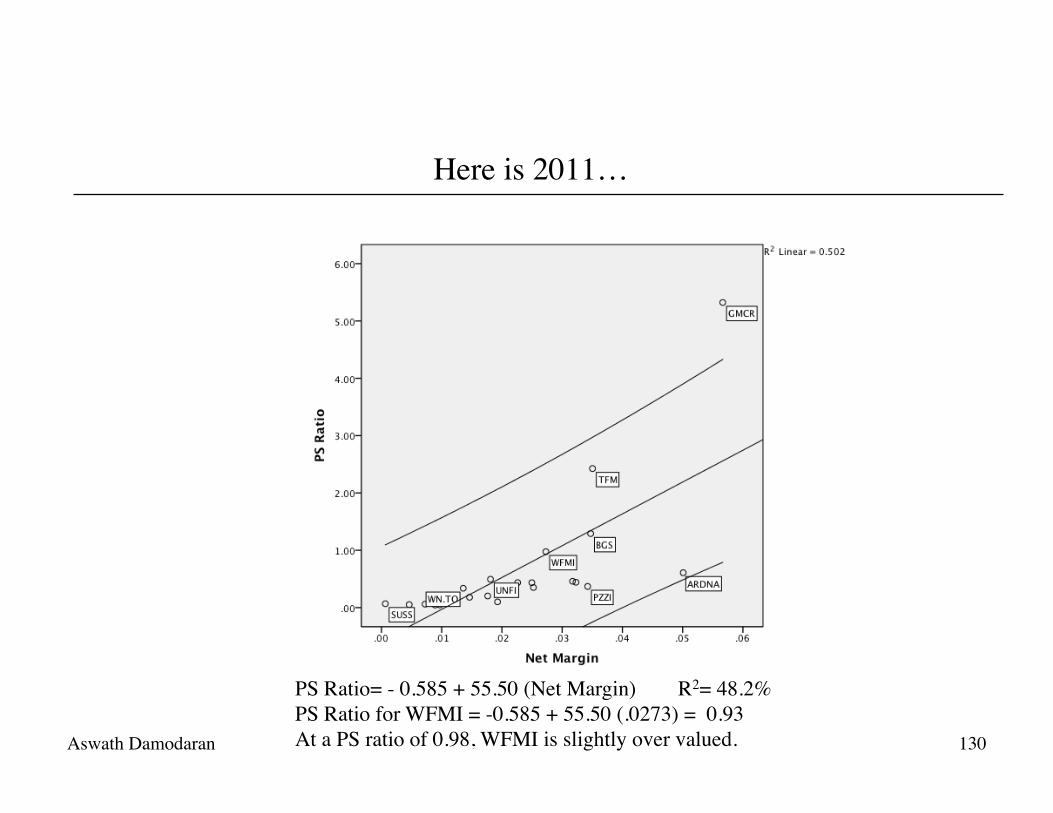
Here is 2011…
PS Ratio= - 0.585 + 55.50 (Net Margin) R2= 48.2% PS Ratio for WFMI = -0.585 + 55.50 (.0273) = 0.93 At a PS ratio of 0.98, WFMI is slightly over valued.
Aswath Damodaran 131
Current versus Predicted Margins
One of the limitations of the analysis we did in these last few pages is the focus on current margins. Stocks are priced based upon expected margins rather than current margins.
For most firms, current margins and predicted margins are highly correlated, making the analysis still relevant.
For firms where current margins have little or no correlation with expected margins, regressions of price to sales ratios against current margins (or price to book against current return on equity) will not provide much explanatory power.
In these cases, it makes more sense to run the regression using either predicted margins or some proxy for predicted margins.
Aswath Damodaran 132
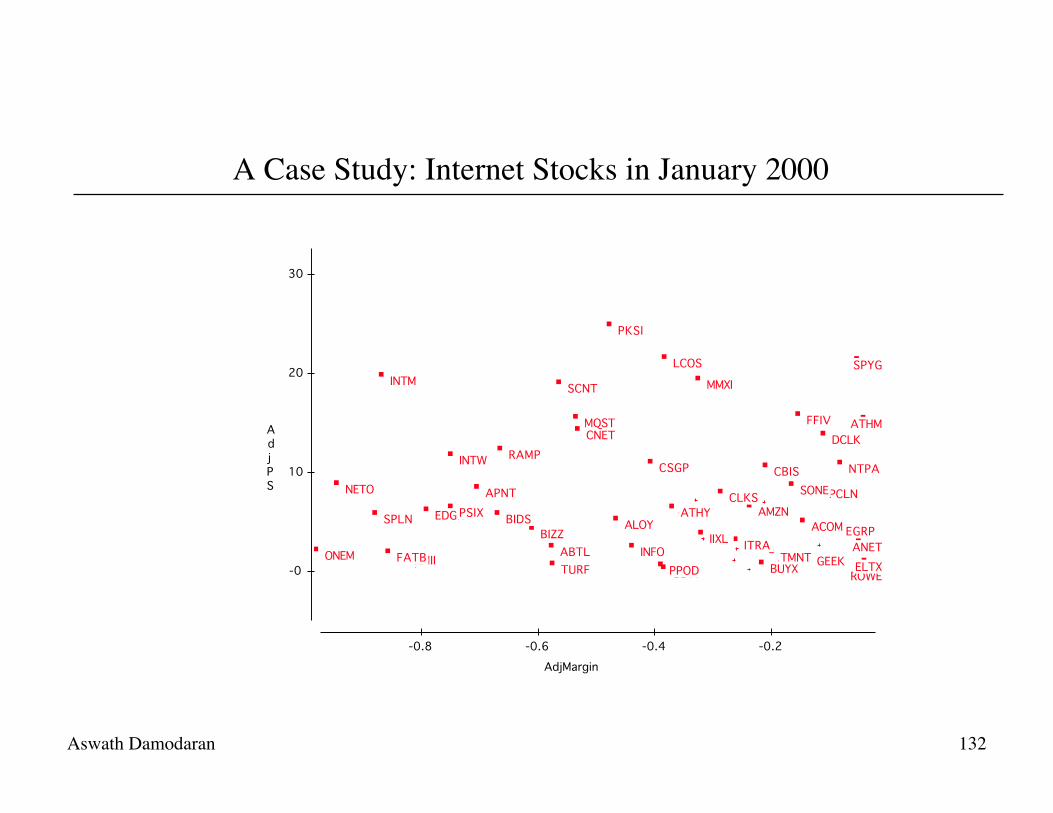
A Case Study: Internet Stocks in January 2000
ROWEGSVIPPODTURF BUYX ELTXGEEKRMIIFATB TMNTONEM ABTL INFO ANETITRAIIXLBIZZ EGRPACOMALOYBIDSSPLN EDGRPSIX ATHY AMZNCLKS PCLNAPNT SONENETO
CBIS NTPACSGPINTW RAMPDCLKCNET
ATHMMQST FFIV
SCNT MMXIINTMSPYGLCOS
PKSI
-0
10
20
30
-0.8 -0.6 -0.4 -0.2AdjMargin
AdjPS
Aswath Damodaran 133
PS Ratios and Margins are not highly correlated
Regressing PS ratios against current margins yields the following PS = 81.36 - 7.54(Net Margin) R2 = 0.04 (0.49)
This is not surprising. These firms are priced based upon expected margins, rather than current margins. Consequently, there is little relationship between current margins and market values.
Aswath Damodaran 134
Solution 1: Use proxies for survival and growth: Amazon in early 2000
Hypothesizing that firms with higher revenue growth and higher cash balances should have a greater chance of surviving and becoming profitable, we ran the following regression: (The level of revenues was used to control for size)
PS = 30.61 - 2.77 ln(Rev) + 6.42 (Rev Growth) + 5.11 (Cash/Rev) (0.66) (2.63) (3.49)
R squared = 31.8% Predicted PS = 30.61 - 2.77(7.1039) + 6.42(1.9946) + 5.11 (.3069) = 30.42 Actual PS = 25.63 Amazon is undervalued, relative to other internet stocks.
Aswath Damodaran 135
Solution 2: Use forward multiples
You can always estimate price (or value) as a multiple of revenues, earnings or book value in a future year. These multiples are called forward multiples.
For young and evolving firms, the values of fundamentals in future years may provide a much better picture of the true value potential of the firm. There are two ways in which you can use forward multiples:
• Look at value today as a multiple of revenues or earnings in the future (say 5 years from now) for all firms in the comparable firm list. Use the average of this multiple in conjunction with your firm’s earnings or revenues to estimate the value of your firm today.
• Estimate value as a multiple of current revenues or earnings for more mature firms in the group and apply this multiple to the forward earnings or revenues to the forward earnings for your firm. This will yield the expected value for your firm in the forward year and will have to be discounted back to the present to get current value.
Aswath Damodaran 136
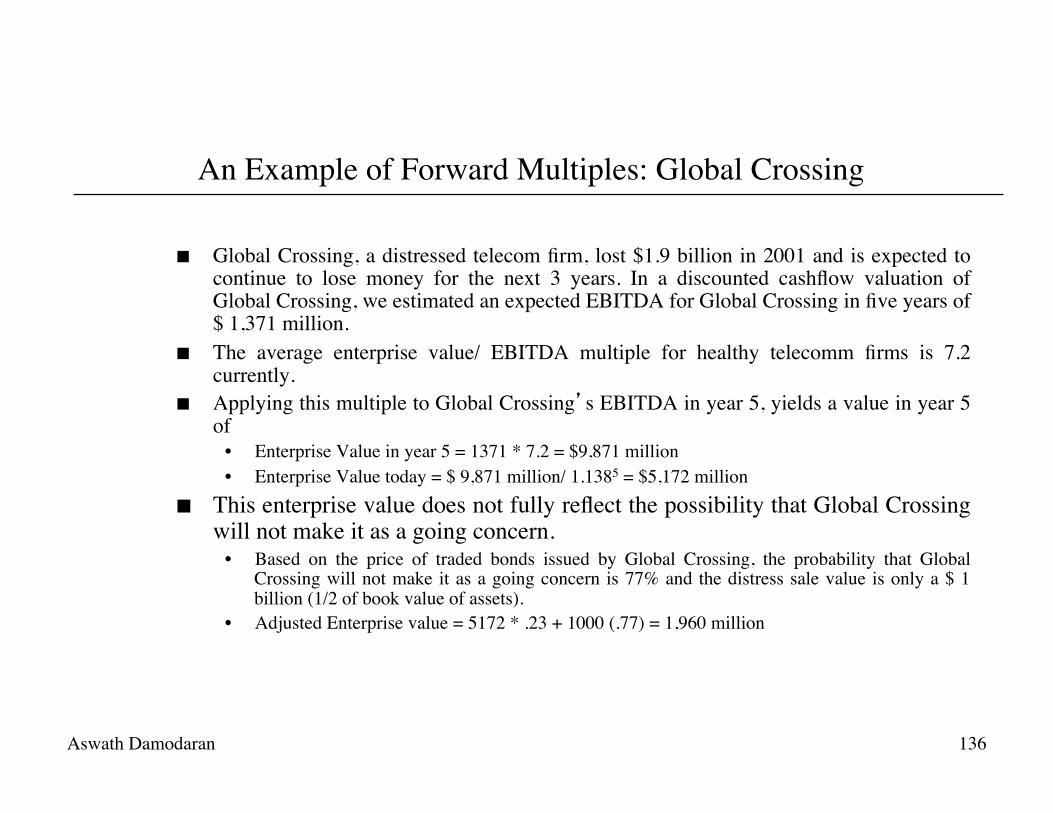
An Example of Forward Multiples: Global Crossing
Global Crossing, a distressed telecom firm, lost $1.9 billion in 2001 and is expected to continue to lose money for the next 3 years. In a discounted cashflow valuation of Global Crossing, we estimated an expected EBITDA for Global Crossing in five years of $ 1,371 million.
The average enterprise value/ EBITDA multiple for healthy telecomm firms is 7.2 currently.
Applying this multiple to Global Crossing’s EBITDA in year 5, yields a value in year 5 of
• Enterprise Value in year 5 = 1371 * 7.2 = $9,871 million • Enterprise Value today = $ 9,871 million/ 1.1385 = $5,172 million
This enterprise value does not fully reflect the possibility that Global Crossing will not make it as a going concern.
• Based on the price of traded bonds issued by Global Crossing, the probability that Global Crossing will not make it as a going concern is 77% and the distress sale value is only a $ 1 billion (1/2 of book value of assets).
• Adjusted Enterprise value = 5172 * .23 + 1000 (.77) = 1,960 million
Aswath Damodaran 137
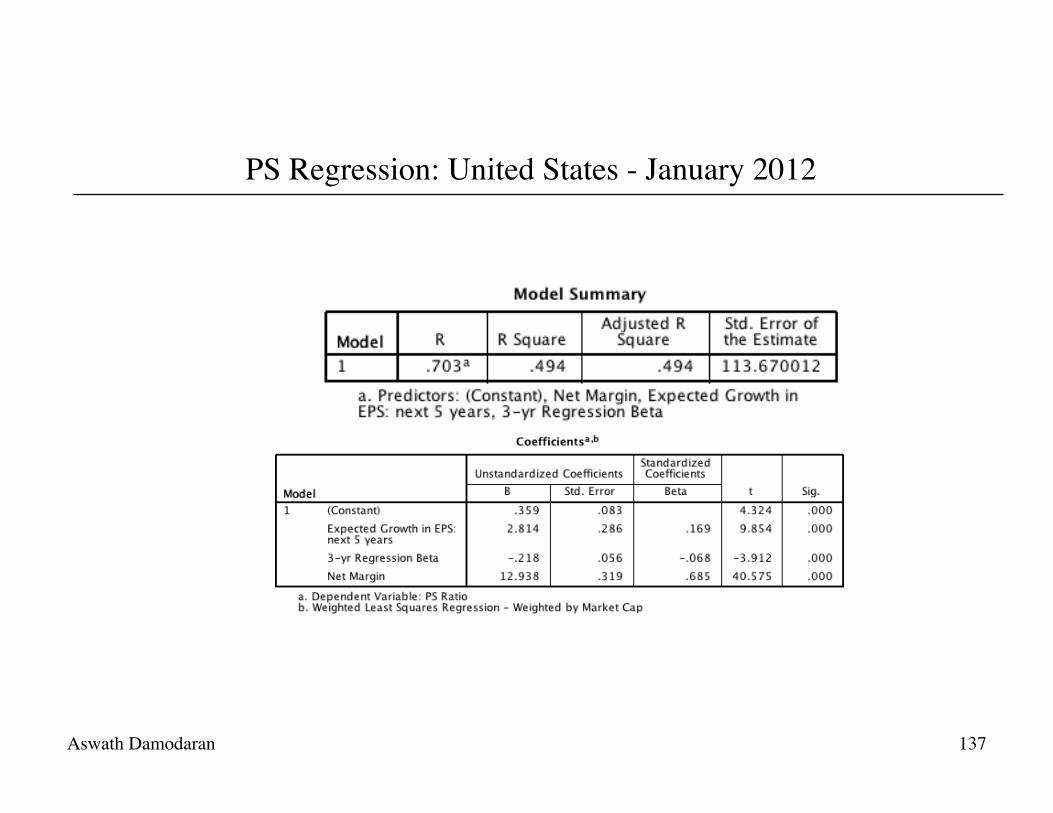
PS Regression: United States - January 2012
Aswath Damodaran 138
EV/Sales Ratio: Definition
The value/sales ratio is the ratio of the market value of the firm to the sales. EV/ Sales= Market Value of Equity + Market Value of Debt-Cash Total Revenues
Aswath Damodaran 139
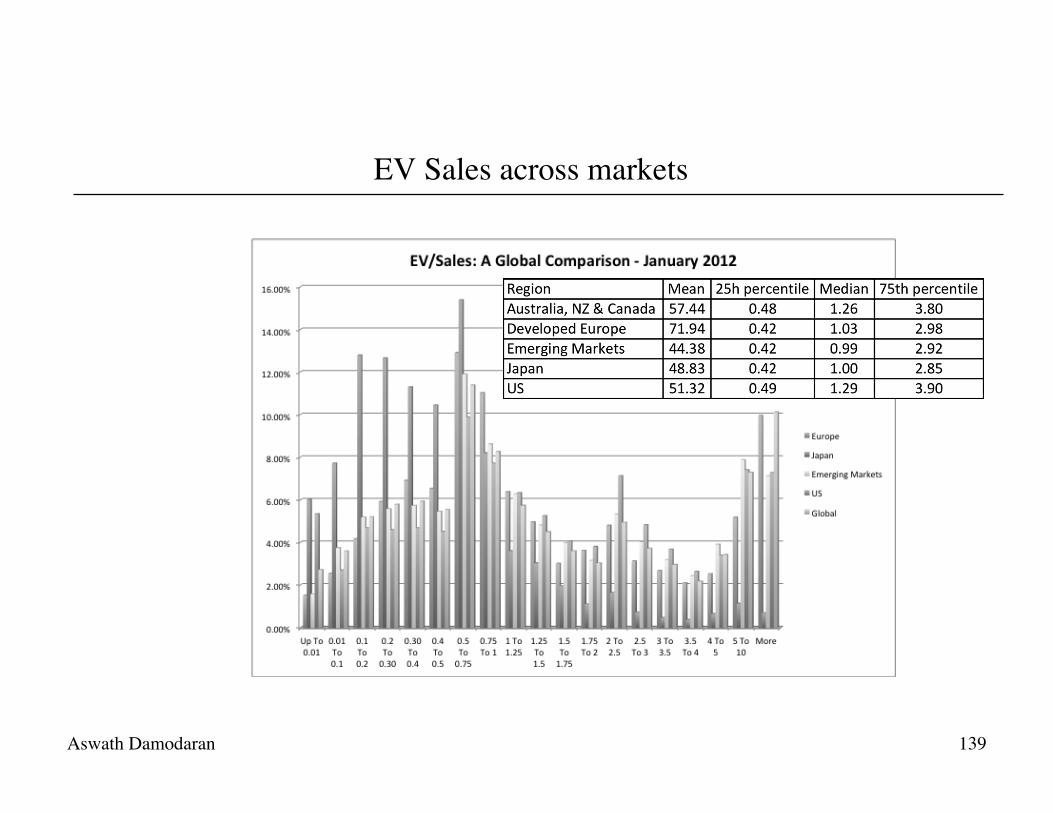
EV Sales across markets
Aswath Damodaran 140
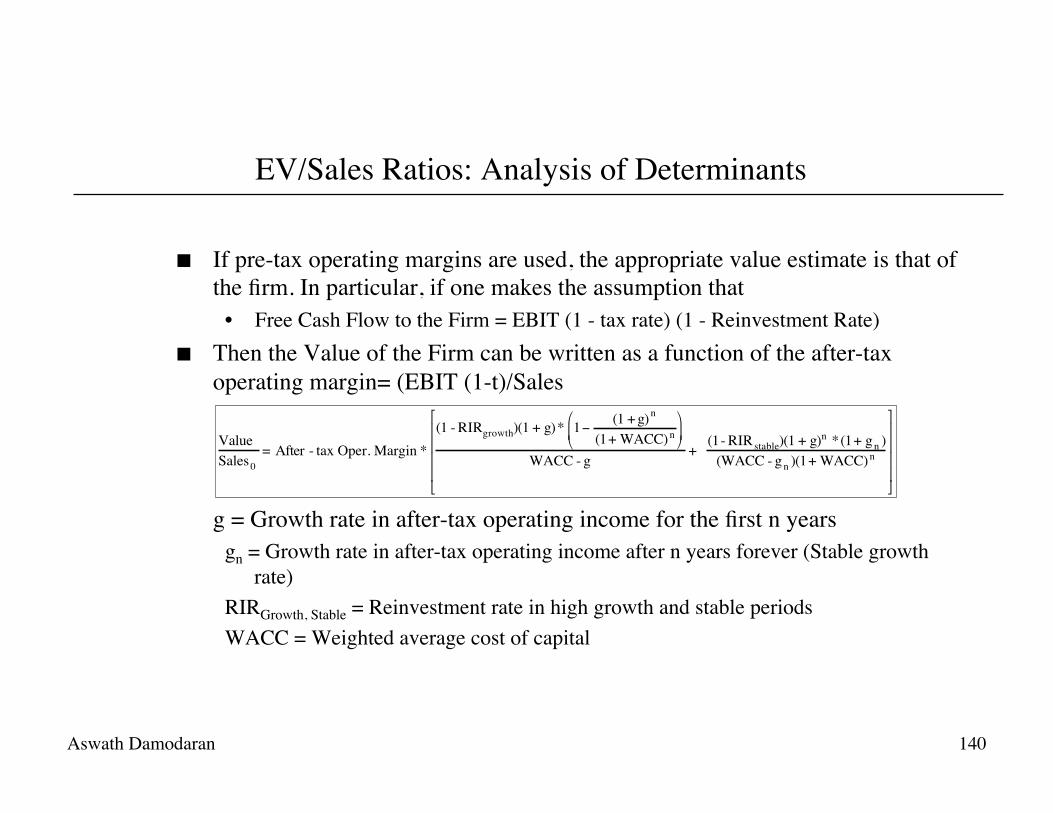
EV/Sales Ratios: Analysis of Determinants
If pre-tax operating margins are used, the appropriate value estimate is that of the firm. In particular, if one makes the assumption that
• Free Cash Flow to the Firm = EBIT (1 - tax rate) (1 - Reinvestment Rate) Then the Value of the Firm can be written as a function of the after-tax
operating margin= (EBIT (1-t)/Sales g = Growth rate in after-tax operating income for the first n years
gn = Growth rate in after-tax operating income after n years forever (Stable growth rate)
RIRGrowth, Stable = Reinvestment rate in high growth and stable periods WACC = Weighted average cost of capital
Value Sales0
= After - tax Oper. Margin *(1 - RIRgrowth)(1 + g)* 1− (1 + g)n
(1+ WACC)n"
# $
%
& '
WACC - g+
(1- RIRstable)(1 + g)n *(1+ gn )(WACC - gn )(1+ WACC)n
(
)
* * * *
+
,
- - - -
Aswath Damodaran 141
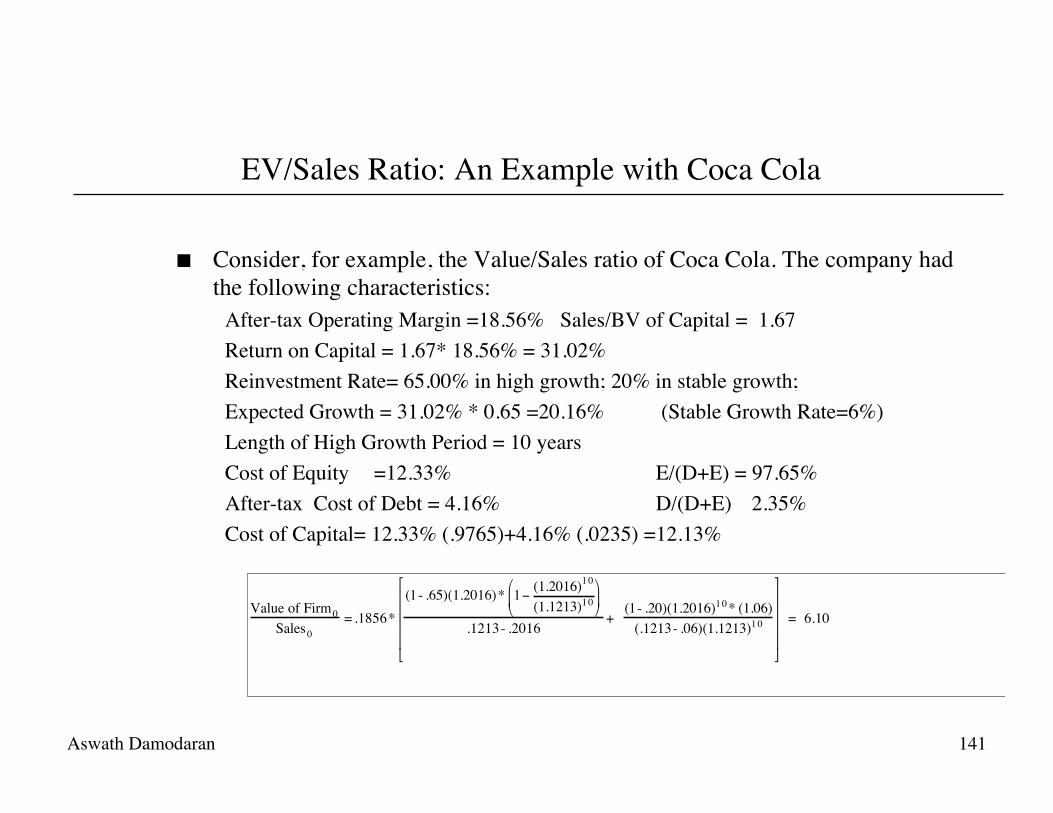
EV/Sales Ratio: An Example with Coca Cola
Consider, for example, the Value/Sales ratio of Coca Cola. The company had the following characteristics:
After-tax Operating Margin =18.56% Sales/BV of Capital = 1.67 Return on Capital = 1.67* 18.56% = 31.02% Reinvestment Rate= 65.00% in high growth; 20% in stable growth; Expected Growth = 31.02% * 0.65 =20.16% (Stable Growth Rate=6%) Length of High Growth Period = 10 years Cost of Equity =12.33% E/(D+E) = 97.65% After-tax Cost of Debt = 4.16% D/(D+E) 2.35% Cost of Capital= 12.33% (.9765)+4.16% (.0235) = 12.13%
Value of Firm0Sales0
= .1856*(1- .65)(1.2016)* 1− (1.2016)1 0
(1.1213)1 0"
# $
%
& '
.1213- .2016+
(1- .20)(1.2016)1 0* (1.06)(.1213- .06)(1.1213)1 0
(
)
* * * *
+
,
- - - -
= 6.10
Aswath Damodaran 142
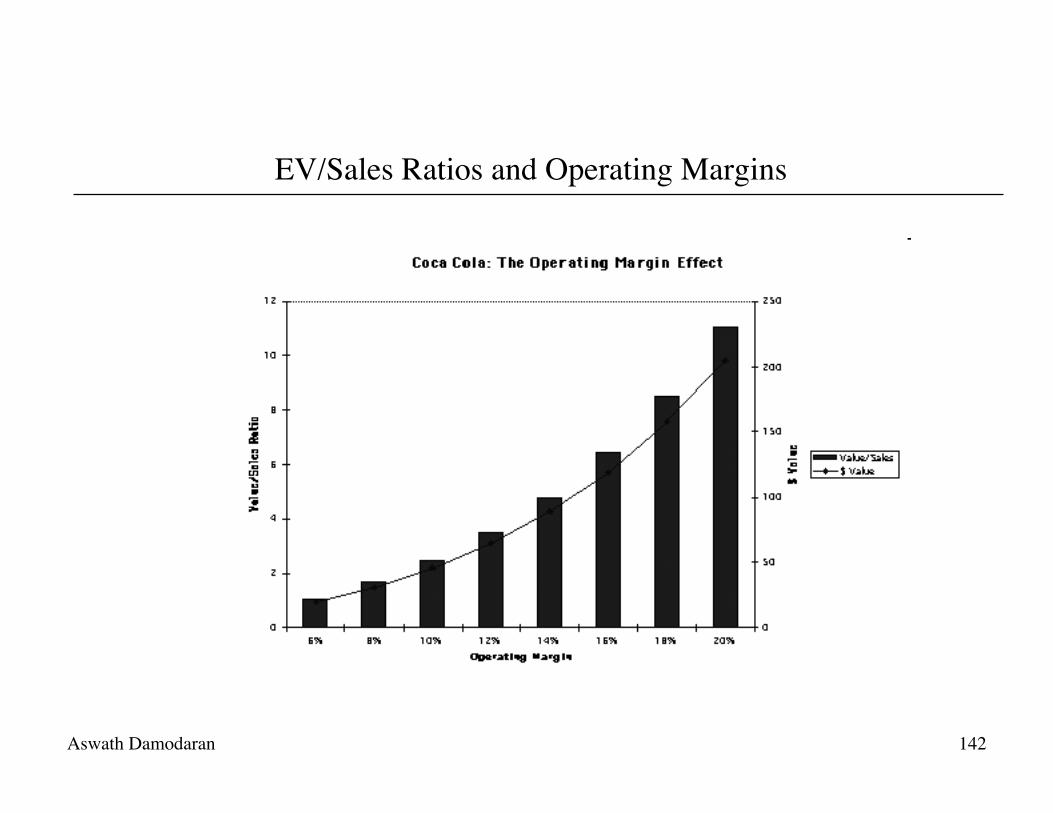
EV/Sales Ratios and Operating Margins
Aswath Damodaran 143
Brand Name Premiums in Valuation
You have been hired to value Coca Cola for an analyst reports and you have valued the firm at 6.10 times revenues, using the model described in the last few pages. Another analyst is arguing that there should be a premium added on to reflect the value of the brand name. Do you agree?
Yes No Explain.
Aswath Damodaran 144
The value of a brand name
One of the critiques of traditional valuation is that is fails to consider the value of brand names and other intangibles.
The approaches used by analysts to value brand names are often ad-hoc and may significantly overstate or understate their value.
One of the benefits of having a well-known and respected brand name is that firms can charge higher prices for the same products, leading to higher profit margins and hence to higher price-sales ratios and firm value. The larger the price premium that a firm can charge, the greater is the value of the brand name.
In general, the value of a brand name can be written as: Value of brand name ={(V/S)b-(V/S)g }* Sales (V/S)b = Value of Firm/Sales ratio with the benefit of the brand name (V/S)g = Value of Firm/Sales ratio of the firm with the generic product
Aswath Damodaran 145
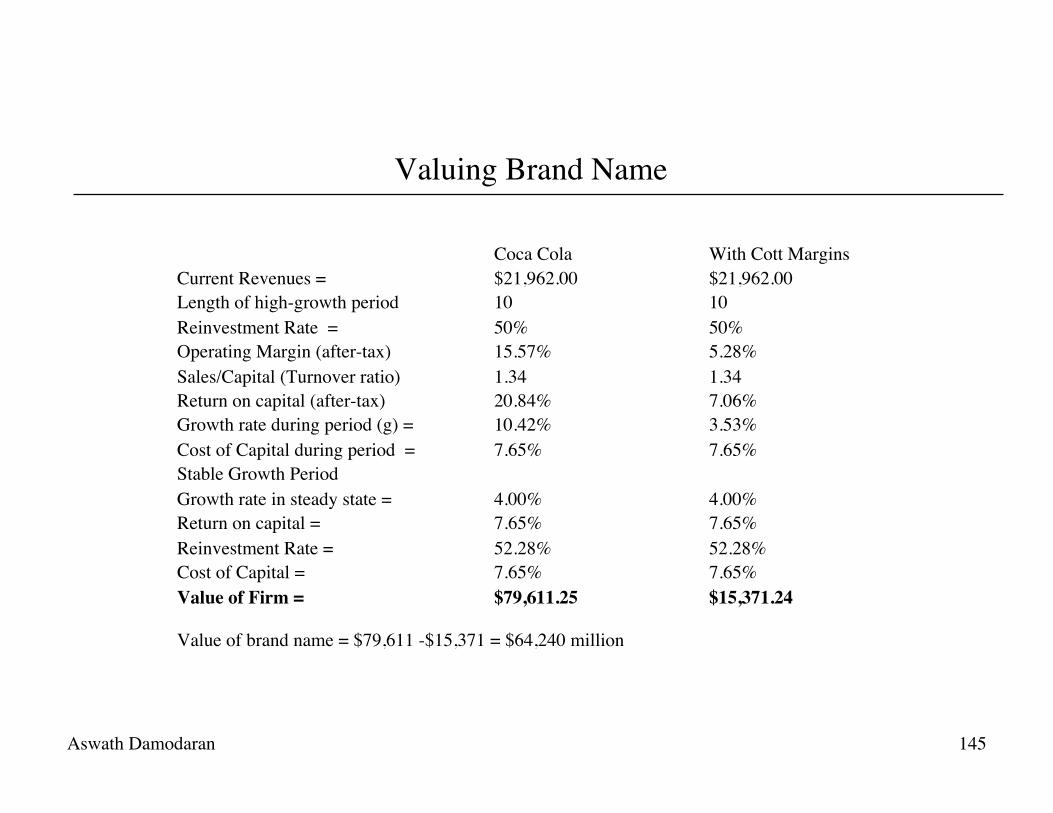
Valuing Brand Name
Coca Cola With Cott Margins Current Revenues = $21,962.00 $21,962.00 Length of high-growth period 10 10 Reinvestment Rate = 50% 50% Operating Margin (after-tax) 15.57% 5.28% Sales/Capital (Turnover ratio) 1.34 1.34 Return on capital (after-tax) 20.84% 7.06% Growth rate during period (g) = 10.42% 3.53% Cost of Capital during period = 7.65% 7.65% Stable Growth Period Growth rate in steady state = 4.00% 4.00% Return on capital = 7.65% 7.65% Reinvestment Rate = 52.28% 52.28% Cost of Capital = 7.65% 7.65% Value of Firm = $79,611.25 $15,371.24
Value of brand name = $79,611 -$15,371 = $64,240 million
Aswath Damodaran 146
More on brand name value…
When we use the difference in margins to value brand name, we are assuming that the difference in margins is entirely due to brand name and that it affects nothing else (cost of capital, for instance) . To the extent that this is not the case, we may be under or over valuing brand name.
In which of these companies do you think valuing brand name will be easiest to do and which of them will it be hardest?
Kelloggs Sony Goldman Sachs Apple Explain.
Aswath Damodaran 147
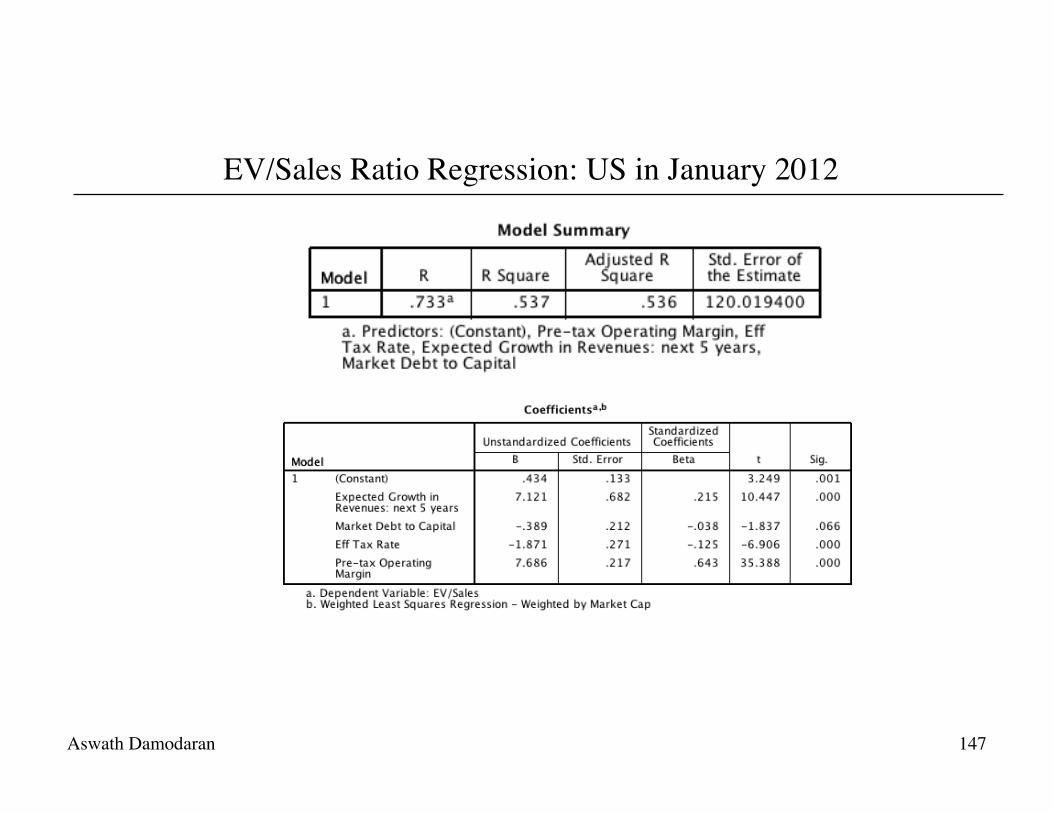
EV/Sales Ratio Regression: US in January 2012
Aswath Damodaran 148
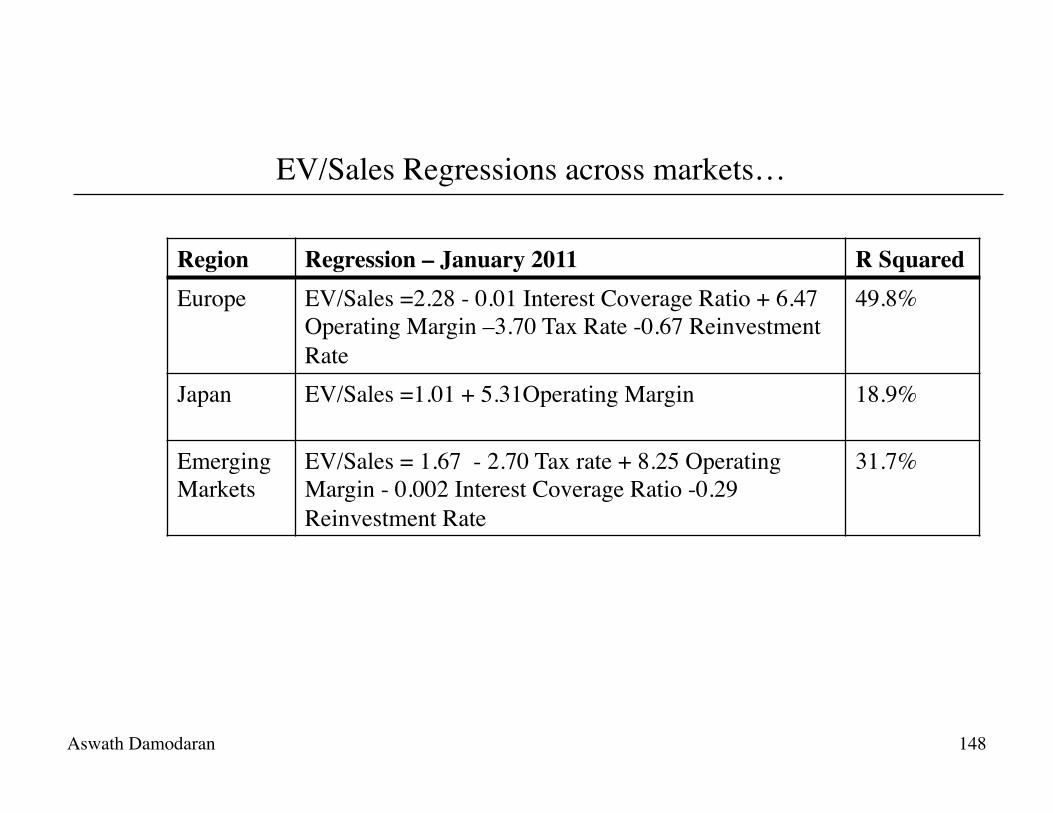
EV/Sales Regressions across markets…
Region Regression – January 2011 R Squared Europe EV/Sales =2.28 - 0.01 Interest Coverage Ratio + 6.47
Operating Margin –3.70 Tax Rate -0.67 Reinvestment Rate
49.8%
Japan EV/Sales =1.01 + 5.31Operating Margin 18.9%
Emerging Markets
EV/Sales = 1.67 - 2.70 Tax rate + 8.25 Operating Margin - 0.002 Interest Coverage Ratio -0.29 Reinvestment Rate
31.7%


![[XLS] · Web viewIncome Statement Summary Non-operating income Total Airport Revenues Operating aeronautical revenues Ground handling revenues Operating non-aeronautical revenues](https://img.pdfslide.us/doc/110x75/5acac1f37f8b9a7d548e1826/xls-viewincome-statement-summary-non-operating-income-total-airport-revenues-operating.jpg)