Embed Size (px)
Citation preview

For the first time the Bronwen Wood Memorial Prize was open to
candidates of the Spring Diploma examination. Fittingly, it was awarded
to a candidate who wrote an outstanding paper, earning the highest mark
ever given in the Diploma examination – 94%. The examiners offer their
congratulations to Nicholas Hodson on his excellent achievement.
Last year saw a significant improvement in the overall quality of
examination papers and the trend was maintained this year. Although
there were fewer candidates, 43 as opposed to 54 last year, more
distinctions were awarded – four compared to three in the previous year.
However, the overall average mark of 71.7% was slightly down on last
year’s 72.1%.
The committee would like to thank all the lecturers; it is pleasing that their
efforts have produced such worthwhile results. It also nice to see that some
of the students from earlier courses have progressed to being lecturers
themselves. This was the first year that the courses have been held at the
London School of Economics. The new location and the move to the
Society running the course by itself have been heralded a great success and
a new round of lectures begins in the New Year (see page 11 for details).
There have been a few changes on the Committee. After serving for many
years as the Society’s treasurer, Vic Woodhouse, has stepped down and we
would like to thank him for his contribution. Simon Warren, who has been
working alongside Vic in bringing the Society’s book-keeping system into
the 21st century, has taken over the job of treasurer. Earlier in the year
David Watts was co-opted onto the Committee. David has his own
company, Market Systems, and for a number of years he has been
producing the Software reports in the Journal. He is also the author of the
annual survey of technical analysis/data products. We are delighted that
he has joined the Committee and will be taking a fuller role in the running
of the Society. Another very welcome addition to the committee is David
Sneddon. David is an extremely experienced technical analyst, having
worked with Credit Suisse First Boston for nine years.
Technical analysis has been the subject of much comment in the press in
recent months. Philip Coggan, the Investment Editor of the Financial
Times, announced that he has had what might be described as a
Damascene conversion in reverse. After years of watching the Coppock
Indicator, he has become disillusioned with it and challenged technical
analysts to participate in a test devised by Patrick Burns. Apparently very
few analysts took up the challenge, probably because the test
demonstrated a lack of understanding of the basic concepts of technical
analysis – as the Chairman, Adam Sorab, pointed out in a letter to the FT
editor which was published on September 13th.
Our own challenge to members to give their views on whether the
market had bottomed met with a similarly poor take-up. Those who did
reply thought that the March low would not represent the bottom of the
bear market but it is encouraging to note that, since the last issue, the
market has been trending higher.
STOP PRESS: IFTA Conference
The IFTA Conference in Washington was well attended with a good
contingent from the UK. The general view was the uptrend in equities
would continue for another year but that investors should not be too
greedy. There are concerns that, once the Presidential election is out of
the way, prices could slide. On the currency front, Fred Bisset of A.G.
Bisset noted that the Japanese authorities had been intervening
heavily to prevent the yen strengthening against the dollar but he
suspected that eventually they would have to abandon this policy
which could see the dollar dropping towards a target of ¥80. There was
broad consensus that commodities are in a secular bull market. The big
story here is China and there was considerable debate about when the
renminbi is going to float.
IN THIS ISSUE
STA Exam Results . . . . . . . . . . . . . . . . . . . . . . . . . . . . . . . . . 2
R. Giles Forward Looking UK Interest Rates:
a point and figure chart approach . . . 3
R. Ramyar Gann’s Legacy:
a modern perspective . . . . . . . . . . . . 6
R. Lie The Trend Intensity Indicator . . . . . 11
M. Blazey Letter . . . . . . . . . . . . . . . . . . . . . . . . . . 11
G. Celaya Web Notes from Academia . . . . . . . 12
November 2003 The Journal of the STAIssue No. 48 www.sta-uk.org
MARKET TECHNICIAN
COPY DEADLINE FOR THE NEXT ISSUE
31st January 2004
PUBLICATION OF THE NEXT ISSUE
March 2004
FOR YOUR DIARY
3rd December Christmas Party
‘South East Asian markets’
Speaker: Hamish Calder
14th January Problems with pattern recognition
Speaker: Michael Smyrk
N.B. The monthly meetings will take place at the
Institute of Marine Engineering, Science and Technology
80 Coleman Street, London EC2 at 6.00 p.m.

MARKET TECHNICIAN Issue 48 – November 20032
BRONWEN WOOD MEMORIAL PRIZE
NICHOLAS HODSON
DISTINCTION
TARQUIN COE
PARAS ANAND
GAUTUM SHAH
PASS
VINCENT BARBARIN
MILLY CASUCCI
CLAIRE CORUM
JANE DAVIES
EMMA EDWORTHY
GAVIN FLEMING
RORY FLYNN
WERNER GEY VON PITTUS
RICHARD GRASSET
CHRIS GREEN
ZEID HADDAD
OLIVER HILTON
DAVID JOHNSON
RAVI KHOSLA
GULSHAN KUMAR
ADAM LEES
JEAN LEMOYNE DE FORGES
ALESSANDRO MARIANI
TIM MCCULLOUGH
DEAN PALLIN
TIM PARKER
MURRAY RADESTOCK
STEVE REAY
SUMEET ROHRA
STEPHEN SOMMONS
DANIEL SMITH
ANTHONY SMITH
CLIVE TILLBROOK
JONATHON WEBB
HOA QUACH
DAVID FLERE
SINHA SUDIP
CHAIRMAN
Adam Sorab,Deutsche Asset Management,1 Appold Street, London EC2A 2UU
TREASURER
Simon Warren. Tel: 020-7656 2212
PROGRAMME ORGANISATION
Mark Tennyson d'Eyncourt.Tel: 020-8995 5998 (eves)
LIBRARY AND LIAISON
Michael Feeny. Tel: 020-7786 1322
The Barbican library contains our collection. Michael buys new books for itwhere appropriate. Any suggestions for new books should be made to him.
EDUCATION
John Cameron. Tel: 01981-510210 George Maclean. Tel: 020-7312 7000
EXTERNAL RELATIONS
Axel Rudolph. Tel: 020-7842 9494
IFTA
Anne Whitby. Tel: 020-7636 6533
MARKETING
Simon Warren. Tel: 020-7656 2212 Kevan Conlon. Tel: 020-7329 6333Barry Tarr. Tel: 020-7522 3626
MEMBERSHIP
Simon Warren. Tel: 020-7656 2212
REGIONAL CHAPTERS
Robert Newgrosh. Tel: 0161-428 1069 Murray Gunn. Tel: 0131-245 7885
SECRETARY
Mark Tennyson d’Eyncourt.Tel: 020-8995 5998 (eves)
STA JOURNAL
Editor, Deborah Owen,Tel: 020-7278 4605
Please keep the articles coming in – the success of the Journal dependson its authors, and we would like to thank all those who have supportedus with their high standard of work. The aim is to make the Journal avaluable showcase for members’ research – as well as to inform andentertain readers.
The Society is not responsible for any material published in The MarketTechnician and publication of any material or expression of opinionsdoes not necessarily imply that the Society agrees with them. TheSociety is not authorised to conduct investment business and does notprovide investment advice or recommendations.
Articles are published without responsibility on the part of the Society,the editor or authors for loss occasioned by any person acting orrefraining from action as a result of any view expressed therein.
NetworkingWHO TO CONTACT ON YOUR COMMITTEE
Diploma Exam 2003
ANY QUERIESFor any queries about joining the Society, attending one of the
STA courses on technical analysis or taking the diploma examination,please contact:
STA Administration Services (Katie Abberton)
Dean House, Vernham Dean, Hampshire SP11 0LA Tel: 07000 710207 Fax: 07000 710208
www.sta-uk.org
For information about advertising in the journal, please contact
Deborah Owen
PO Box 37389, London N1 OES. Tel: 020-7278 4605

Issue 48 – November 2003 MARKET TECHNICIAN 3
In this article, forward looking interest rates are based on patternrecognition and congestion. This assumes the data series can beinterpreted as a memory pattern using past performance. Attentionis focused on the votes of constituent members of the Bank ofEngland’s Monetary Policy Committee. The point and figure chart isable to identify structural breaks in the data, thus only relevant timeperiods need be considered.
IntroductionTechnical analysis is usually associated with financial markets, wherethe interaction of buyers and sellers find a market clearing price.Additional information is provided by the volume of interest atdefined points in time and price. Such information is portrayed in theform of a time series chart where critical / sensitive price levels andtime targets are overlaid.
Accuracy in forecasting normally depends on combining a correctprice with correct timing and forecasting failure occurs when one orboth these targets are not met. However, not all forecasting takes thisstyle. If we consider interest rates, the timing element is oftenseparated from the level of interest rates. The former becomes theminor partner. Baker (2001) “How low can interest rates go?” and theBank of England (BoE) (2003) “...an increase in interest rates mightsoon become necessary” (a support level?) intimate that timing has alower role to play and all levels are not equal. Hence, a technicalanalysis approach may assist policy makers in interest ratedetermination especially as methodological objections may bediminishing.
Whilst “prospect theory” and the “ endowment effect” are not commonterms for “technicians”, repetition of bad mistakes and placing extravalue on items owned will have a familiar ring in behavioural tradingerrors. This “raging battle” (Economist 2003) between economistsmoving from neoclassicism to behaviouralism lends support to thetechnician’s approach. Previously, the technical approach to financialtheory had been relegated to the higher moments of the non-linearprocess (Neftci 1991) although important research work was findingits way into the academic literature (Lo and MacKinlay 1999). Clemen(2001) summarised the forecasting experience as follows” ...simplerforecasting methods perform well on average whilst statisticallysophisticated methods tend to perform poorly on average”
UK interest rate settingForecasting plays a crucial role in economic policy decision-making,especially two-year ahead inflation targets and the pattern of interestrate changes can provide a planned convergence on currencies andeconomic cycles, especially within the European Union. Allen (1999)and Price (1996) describe the difficulty central banks have, and inparticular the Bank of England (BoE), in forecasting interest rates.However, interest rate setting is often based on incorrect inflationforecasts (Howells and Blain 2000). Basing financial decisions onmarket interest rate expectations can be also be costly anddangerous ( FT 2001a). To reflect the uncertainty, BoE forecasts nowembody probability distributions of economic variables in the form offan charts. The distributions need not be symmetric. With suchuncertainty, Monetary Policy Committee (MPC) members increasinglyresort to judgement and the characteristics of such judgements overtime are well documented and are of interest to technicians.
Since May 1997, the Bank’s monetary policy committee has beengranted rate-setting powers consistent with a UK inflation target setby the UK Treasury, currently 2.5 per cent. As long as financialmarkets believe that the MPC is sticking to its task, or that risinginflation is due to temporary factors, then long term inflationexpectations are likely to remain fairly stable, and UK gilt yields rises
will be constrained. A change in the business cycle has caused areversal of fiscal policy, hence the importance of the interest rate/inflation axis.
The make up of the MPC comprises nine members with a majority offive from BoE staff. The other four are appointed by the UKChancellor of the Exchequer for fixed time periods. (Observer 2001a)
Initially, a hawkish MPC raised rates five times between May andNovember 1997. The then eight committee members had to copewith an in-house inflation forecast breaching the governmentguidelines and a highly erratic economy with sectors such asinformation technology proving insensitive to interest rate changes.By February 2000, the headline rate of inflation began rising,suggesting that underlying inflation would rise above the target bythe year-end, but a year later inflation was falling below target.Speculation as to fundamentals that may affect future changes split acohesive committee on several occasions. Hence, the monthlymeeting and the resultant interest rate set can be viewed as a contestof differing financial economic philosophies. The purpose ofcommittee members is not only to vote in a certain direction, but alsoto convince sufficient members to support their stance. Apsychological element is part of the member’s judgement. The MPC’srecorded transparency of views and votes is at the extreme spectrumof central bank interest rate setting. These views are translated into aqualitative voting analysis of each member. Given the range of beliefson the usefulness of standard econometric forecasting models as anaid to MPC policy making, it is worth considering the effectiveness ofalternative forecasting methods used in financial markets based on atheory of contest. One MPC member (FT 2001b) emphasised the biasin the fan charts of the Bank of England towards an upside risk ofinflation and called for a broader range, in the target. MPC members(FT 2001b), (Observer 2001b), have also questioned the appropriateinflation target. In theory, base rate changes should be unpredictableand set according to the BoE forecast. However, by employing astrategy of raising rates gradually, the MPC can insure against a rise ininflation caused by above trend growth. This would not choke offgrowth or rule out the” new paradigm view” (that the trend growthhad risen). The MPC tends to err towards the orthodox view. Belief isin the supply side view that attributes the current upturn to improvedsupply. New technology has boosted capital spending, increasingcompetition, forcing down prices and attracting more customers.Hence, rapid economic growth is a sign that increased potentialoutput will reduce the inflationary threat. An increase in immigrationhas also been attributed to above average growth forecasts (Guardian2002). The BoE (1997) found that UK economic fluctuations weresupply side driven.
With this in mind, this article considers whether the technical methodof point and figure charts can be used to aid policy decision making ofinterest rates. Point and figure charts also have the advantage ofconcentrating on target levels. This shows some coherence with thepattern of interest rate setting, which may not change its level forseveral periods and then follow with a period of rapid interest ratemovements.. The UK is left as the dominant economy within the EUthat is not a member of the Euro. A greater convergence with theEurozone economies is required before entry. The important role of theUS dollar in “Euroland” trading has been a primary reason for the BritishPound to not track the Euro but to have stability against the US dollar.Therefore, this paper can address the short-term problem of the MPCtargets by establishing classic support and resistance levels that areused in financial markets but differ from standard statisticalsignificance.
Clements and Hendry (CH1998) argue that the constant timeinvariant data generating process, perfectly replicated by aforecasting model, is not consonant with an empirical track record of
Forward Looking UK Interest Rates: a pointand figure chart approach
By Ronald Giles

MARKET TECHNICIAN Issue 48 – November 20034
large predictive failures. A theory of forecasting allowing forstructural breaks may provide a useful basis for interpreting andcircumventing predictive failure in economics. Following a shock,the system is taken some distance from its theoretical equilibriumand estimating such equations using time series techniques withoutthe adjustment for the structural break will generally be unstable.Omeroid, suggests that containment of shocks is a deeper matterthan allowed for by CH. Box-Jenkins type models, however, whichcontain a unit root, will adapt quite well to shocks, (Granger 1998),and soon return to their previous performance level, thus,emphasising the benefits of non-deterministic modelling. Smith(1998) responds to CH by suggesting that it is a further developmentof the Hendry (1986) concept. Smith concludes that Hendry’sapproach gives good reasons for adopting the practitioners’ stanceon forecasting. Theorists find that the methods that work empiricallyare not those that would be predicted by statistical theory.
At the last trough, the UK fourth quarter inflation figure for 1993 hadan out-turn of 1.4 per cent. This presented a problem for the majorforecasters who regularly forecast eight quarters ahead. The timing ofthe forecast starting point was unfortunate in that the UK had left theERM (European exchange rate mechanism) in September 1992,expecting inflation to rise. In fact, it fell sharply, against all theestablished theory of floating exchange rates being associated withhigher inflation in the past. Of the 52 UK forecasters, only one waswithin an error of +/- 1/2 per cent error. The average error was 1.73per cent, an average 123.6 per cent overshoot. By 1996 trends werewell established, and forecasts improved dramatically. Of the 40forecasters predicting fourth quarter values for 1997 inflation, over 82per cent were within +/- 1/2 per cent error. The average error was+0.15 per cent representing a 5.5 per cent overshoot. Figures for baserate forecasts showed interesting results. On an out-turn of 7.25 percent for UK base rates in the fourth quarter of 1997, the forecastingpanel (abandoned in May 1996) advising the Bank of England hadforecast a 5.8 per cent interest rate. Other forecasters fared better. Theaverage error was -0.2 per cent and almost 30 per cent of theforecasters were within +/- 1/4 per cent of the outcome, thusanticipating most of the interest rate rises by the MPC. In 1999, twoout of 44 forecasters accurately forecasted a UK base rate of 5.5percent at the end of the year, another ten were within an error of +/-1/2per cent. An error in the UK average earnings figures (discovered in1998) had sent base rates rising to 7.5 per cent in 1998. A downwardincremental fall to 5 per cent during 1999 was reached before anotherturn around led to a UK base rate of 6 per cent by February 2000.Interest rates started to fall in 2001 to 4 per cent by the year end. Noforecaster at the start of the year had predicted such a fall. This ‘finetuning’ of interest rates has been questioned on several fronts. NIESR(1999) has evaluated the overall impact of these interest rate changessince the MPC’s inception and concluded that it was no different to ano base rate change. This analysis is supported by a review in theLondon Guardian (1999) “the snag is the end product.... It is becominghard to avoid the view that the MPC.... is a body which has difficultyseeing the wood from the trees.”. Changes in monetary policy takesome time to make themselves felt. In a low inflation environment thetime lag between policy changes and outcome may become shorter,however, it is questionable that the outlook for inflation between Apriland November 1999 changed so much that it required four base rateadjustments, two down and two up. Another downward spiral ofinterest rate cuts took place in 2001. What is clear is at or near theturning points on base rates, the views of the committee becomemore diverse, similar to the way investors respond in financial markets.What is not captured in the economic forecasts is the sentiment by thedecision makers. Hence the outcome of the MPC vote will at suchtimes deviate from the forecasts.
Point and figure chartingMarket action, as described in Murphy (1998), is important because itacts as a leading indicator of known fundamentals. The freedom fromrelating one variable with another over time provides an addedbonus to the technical analysis approach, primarily because economicrelationships are not well defined for forecasting purposes. Somecharting methods are able to use all the available price informationover a given time period or alternatively ignore the time elementaltogether. It is the latter approach that concerns us. The point andfigure method is an extreme example and is not widely usedgenerally in financial forecasting or specifically in technical analysis,
partly because of the current emphasis on time series forecasting. Itis rarely used as a primary indicator partly because other methods aremore specific for certain tasks. Among technicians its take up rate israrely above 10 per cent. Reviewing the literature, it appears never tohave been used in economic policy forecasting.
The term point and figure is attributed to de Villiers (1933). Prior tothat it had been known as the book method. Dow indicated that afounding date was 1886, (Murphy 1999). Point and figure charts areideal for long term observations without being handicapped bydefining long-term relationships, using up less space because there isno horizontal time axis. The conventional cardinal system of chartingis replaced by an ordinal system of rises and falls causing movementalong the horizontal axis. The result of this alternative approach toforecasting is that turning points are clearly defined. Breakoutpositions both up and down are established, defining stop loss ortrigger levels. These can be of immense use to policy makers as aform of support and resistance level. Furthermore, as a result of itsconstruction, the point and figure approach identifies congestionlevels from which future turning point targets are derived. Hence thetime series data can be reconstructed into groups of structuralbreaks. Some structures are looped within each other. Whilst this isobvious to the chartist, it is undetectable by conventional modelling.Therefore, as extraneous information they provide more specificinformation than the BoE forecasts. We consider determination ofcurrent UK base rates in the way nine members of the MPC vote onaltering the base rate. The monthly rate declaration is reported bythe media as a contest of different ideas and groupings within theMPC, being labelled activists and gradualists as well as hawks anddoves (Guardian 2002). Prior to the MPC, interest rate setting wasundertaken by a UK Treasury Committee headed by the Chancellor.Thus interest rate setting has always been, in practice, a consensusview. The contention that point and figure charts are often said to beone dimensional because of the absence of a time scale is incorrect.They are two- dimensional because movement along the chart takesplace on direction reversals. For interest rates this could be definedas a policy reversal. These reversals have a filtering method assignedto them that is unique to technical analysis. Therefore, if theprice/interest rate movement is less than the assigned movement it isignored. Point and figure charts also filter movement differentlydepending whether they are with or against the trend. No othermethod has the ability to do this. Interest rate change in a column ofX’s is plotted when the movement is up. A series of O’s is plotted inthe next column corresponding to a fall in price or level. A significantupward movement occurs when it breaches a previous turning point.
ResultsA degree of modelling the point and figure chart is required. A seriesof different box reversal systems with different unit changes ofinterest rates was considered but not produced here. In order tocapture most of the activity a one box reversal was consideredoptimal. The most common UK interest rate change is 0.25 per cent.To filter out single rises and falls of 0.25per cent, a 0.5 per cent boxsize is used to obtain the best predictor. The count on the horizontalcongestion fitted the down/up count on the vertical scale. Thereason for such symmetry is reflected in “balance” in the market. Thisworks quite well for the one box reversal system for the UK base ratesas shown in a point and figure table (PFT). The method requires thatthe lower maximum activity level (MAL) is used. Normally a wall ofupward movements (X’s) is required on the extreme left side and awall of (0’s) is located on the right side of the congestion. However,extending this method,we have also used two walls of X’s whereapplicable. Hence the number of horizontal boxes is a predictor ofthe upward or downward movement to give a target level. If theprediction is incorrect, this often indicates that the congestion periodhas not finished. Six maximum activity levels are identified and thetarget levels for MAL 2, 3 & 4 are readily achieved. MAL target level 1eventually reaches the required level but only after three attempts atbreaking through a resistance level. The benefit of this filter is thatpoints of support/resistance can be more clearly defined. Hence thedecision by the MPC whether to raise interest rates a further 0.25 percent in February 2000 did trigger a change of direction and sentimentto a rising interest regime under a one box regime. No resistance wasfound at this new level until over 7.0 per cent, then over 7.5 per cent.Such vital information is not available to the policy maker fromfundamental models. Target 4 having been achieved, suggests that a

Issue 48 – November 2003 MARKET TECHNICIAN 5
new structure started at the beginning of the Labour Government in1997. Target 4 started its inception over a decade earlier. Yet with acommon starting point two or more target levels may occur. Thereforethe point and figure method in interest rate terms is forward looking.
For conventional forecasting the start is the data collecting stage.Forecasters have no idea what data period is relevant to theirforecasts. Only when a successful forecast has been made is theappropriate time period for estimation confirmed. This in one sensedefeats the object of the forecast. The point and figure chart revealsthat appropriate time periods (measured by the number of interestchanges) do vary and do overlap. Once the target level has beenreached, the appropriate time period is confirmed.
The notion of a point and figure approach has inferences that may beacceptable to financial markets, but not to decision-makers. Thereasoning behind maximum activity levels and the balancing factordetermining future interest rate turning points implies that thecustodians of interest rate change are following a behavioural path inwhich future interest rate turning points have been set some time in thepast. This may be as long as a decade before hand. The most recent cut(July 2003) in base rates reaches the target level, indicative of a troughand a support level. Therefore the September minutes of MPC showedthat despite a 9-0 vote for unchanged rates,“an increase in interest ratesmight soon becomes necessary” is consistent with our results.
Past performance on the frequency of changing rates may be a guideto the probability of a future change in the same direction and can beused as a forecasting tool. Since 1985 UK base rates have been raisedon 33 occasions, but have been lowered on 57 occasions. Rates wereraised on 15 occasions within a month of a previous rise. Theincidence of a rate rise falls drastically after an interval of a month (andhence the probability). On the lowering of rates, most are followed bya further fall within a month (26 out of 57 reductions).
ConclusionThis article started with a quote from the Bank of England Inflationreport relating to raising interest rates. The report did not mention atime or level target. The technical analysis method used was able toconsider time and level targets separately. We have been able todemonstrate that using the point and figure charts one box system,
important turning point levels for UK interest rates are predictablesometimes decades in advance. The importance of interest ratesetting should prioritise forecasts. Hence finding the turning pointshas a higher priority than predicting the level at a given date. Mostinterest changes occur in subsequent months and a time delayreduces the probability of a further rate change in the same direction.With the aid of a point and figure chart, interest rate setters may beable to have a different type of understanding of the environment inwhich they are operating. The method works equally well with otherinterest rate setters. When applied to US base rates, the level ofcongestion merited the drastic falls seen.
ReferencesAllen W A (1999) “Inflation Targeting: The British Experience”
Handbooks in Central Banking, Lecture Series no 1. Centre forBanking Studies, Bank of England UK.
Barr D G and Peseran B (1995) “An assessment of the relativeimportance of real interest rates, inflation and term premia indetermining the prices of real and nominal UK bonds” Bank ofEngland working paper series no 32
Bank of England Inflation Reports (1997-02), various issues.
Clemen R.T. (2001) “ Simple versus complex methods” Journal ofForecasting Vol 17, No4, 549-550
Clements M and Hendry D (1998) “Forecasting Economic Processes”,International Journal of Forecasting Vol 14, No 1, 111-132
Corkish J and Miles D (1994) “Inflation, inflation risks and assetreturns” Bank of England working paper series no 27
DeVilliers V (1933) “The Point and Figure Method of AnticipatingStock Price Movements” traders Library Press, Ellicott City,MD
Deacon M and Derry A (1994) “Estimating the term structure ofinterest rates” Bank of England Working paper series no 24
Economist The (2003) “ To have and to hold”August 28th Edn.
Economist The (2001) “How low can they go? Oct 4th Edn.
Economist The (1998) “ A Survey of EMU”April 11 edition
Financial Times (2001a) “ Alternatives to inflation targets”February 28 edn
Financial Times (2002 b) “ Fallible guides to your future”May 25th edn.
Financial Times (1997) Forecasts for 1998, p5 Weekend Money Dec 28
Financial Times (1998) Weekend Money p2,May 9 .
Granger C, Omeroid P, and Smith R (1998) “ Comments on ForecastingEconomic Processes” International Journal of Forecasting vol 14 no 1 , 133-137.
Guardian, the London (2002) “ The Old Lady Opens Up”- May 19 edn.
Hans Franses P and Ooms M (1997),“ A periodic long memory modelfor quarterly UK inflation” International Journal of Forecasting,Vol 13 No 1, 117 -126
Hendry D (1986) “The role of prediction in evaluating econometricmodels.” Proceedings of the Royal Society A407, 25-33
Hendry D and Clements M (1998) “Forecasting Non-stationaryEconomic Time Series” ESRC Economic Modelling Workshop Jan 1998
Howells P and Bain K (2000) “ Financial Markets and Institutions”Third ed. Prentice Hall
Joyce M A S (1995) “Modelling UK inflation uncertainty: the impact ofnews and the relationship with inflation” Bank of England workingpaper series no 30
Continues on page 9
Point and figure chart of UK bank rate, minimum lending
rate and bank’s base rate 1950-September 2003.
One box reversal at 0.5 per cent intervals.

Legend and legacyWilliam Delbert Gann was one of the early twentieth century’s greatWall Street personalities whose trading career spanned from the turnof the last century up until his death in 1955. His place in the tradingcommunity was respected and affirmed by the trading legends of hisday. Wyckoff’s 1909 interview with Gann in the Ticker and InvestmentDigest independently verified 92% profitability, over 25 days and 286trades, and Gann was also one of several creditors who would lendJesse Livermore money when he overextended his risk. Uncannymarket forecasts were issued in advance for several decades and hissupposed studies of commodity cycles back to the 1200s wererumoured to have profited him to the tune of $50m by his death($335.6m in 2002 prices).
There are several versions of various stories regarding fortunes, or lackthereof, but a real legacy was indeed bequeathed by Gann to traders.Gann wrote a number of public and private courses and bookscovering a range of conventional and esoteric techniques. His worksdo not spoon-feed or provide step by step analysis routines, and it canthus be difficult to prioritise the techniques given. The most powerfultools are either the most “boring” or difficult to work out when to listen tothem. Nevertheless, the reality must be stated: Gann was a self-marketer who knew the value of mystique and silence. This truth hasallowed many vendors of Gann related products and services toexploit the holy-grail appeal of “the legend” at the expense of theprimary truth regarding Gann: he was above all a disciplined trader.
This article focuses on the sound trading advice and primarytechniques most easily integrated into other methodologies, whetherposition or intra-day trading. Swing chart trend analysis is introducedand integrated into the modern indicator environment followed by anintroduction to time and price proportionality. Trading strategies andkey points to note are outlined, followed by an analysis of the S&P.
Gann trend analysisTrend analysis is the most important part of Gann analysis and asksthe fundamental question of whether you want to step in front of thetrain. It is conventional and unexciting but basic realities are toooften ignored by those hunting the “truth.” Useful swing charttechniques (similar to P&F) are offered by Gann to filter out noise,identifying support /resistance relevant to your timeframe whilstignoring insignificant levels. The interpretation of swing charts issimilar to other technical analysis techniques – an uptrend is a seriesof higher highs and lows and a downtrend is signalled by lower highsand lows. A break of previous turning points shows that the currenttrend is at risk.
Figure 1 shows the weekly cash S&P – for a swing to turn up a marketmust have three bars where the top of the bar is higher than theprevious bar and the low is higher than the previous bar (two bars
can be used when corrections are minor in faster markets). A choiceneeds to be made as to how to treat inside and outside bars: ignorethem or base swing changes on the close. The x-axis on the first chartin Figure 1 does not represent time, as per P&F. Figure 2 showsanother type of chart offered by Gann, the Point Swing Chart. Thisdaily chart for July Soybeans requires a 30c turn to alter swingdirection, 30c being chosen as appropriate for this particular market.It has to be noted that traded points do not cater for “proportionality”– e.g. 100 point swings on the S&P were not appropriate in the 1980s(this issue does not present as severe a problem if traders tend tothink in fixed units over time e.g. bonds or some intradayenvironments). Several charting programs also include swing filtersbased on percentage change, for example Metastock’s Zig-Zag. Theinterpretation of all of these swing charts is merely that the lastextreme to be broken shows the current trend is at risk and may betreated as changed.
Role of wider trend analysisIf swing charts suggest when a trend is at risk and allow one toconceptualise trend direction, how can one synthesise this approachusing modern indicators? One could filter swing chart signals usingindicators such as moving average direction and position relative toprice,MACD, ADX, DMI +/-, etc., or vote trend direction using acombination of these. Note can also be taken of when a trend is overextended; oscillators are persistently oversold in the later stages oftrends, for example price divergence,MACD and ADX are at extremesor +/- DI are highly divergent. When this is the case, one candetermine price and time levels at which one could considertightening stops – but remember that a trend is a trend...
I cannot over-stress that the trader should also assess the sustainabilityof the trend by looking at the wider market environment. The technicalposition of industry and sector indices should be examined and relativestrength analysis between these and wider indices must be consideredin order to appreciate what is transpiring and how general or specific aparticular trend is. Furthermore, Rome was not built in a day.Accumulation and distribution cycles require time/volume to be spentat major tops and bottoms; the CFTC’s Commitment of Traders Reportbeing helpful in this respect. Furthermore, Livermore’s “underlyingconditions” also warrant analysis i.e. the fundamentals themselves. Theneed to account for these factors challenges the pride in one’s ability toforecast on the basis of an individual chart alone. Whilst individualchart analysis is undoubtedly powerful, this is one of many areas wherea trader’s humility needs to coexist with necessary confidence inpulling the trigger.
Time and price ratiosI said above that one can determine price and time levels at which onecould consider tightening stops. Basic support/resistance and price
MARKET TECHNICIAN Issue 48 – November 20036
Gann’s Legacy: a modern perspectiveBy Richard Ramyar MSTA
Figure 1 Swing Chart (S&P Weekly)
Figure 2 Point Swing Chart (July Soy)

Issue 48 – November 2003 MARKET TECHNICIAN 7
retracements are familiar to most of us who use technical analysis; yetadditional related techniques are offered by Gann analysis.
Fibonacci ratios based on F(1.618) and J(0.618) are used to projectranges from past swings and examine retracements. Both of theseare performed in respect of time and price. Gann did, however, use adifferent set of ratios based on 1/8 divisions:
8/8 100%
7/8 87.5%
6/8 75%
5/8 62.5% (similar to 61.8% Fib ratio)
4/8 50%
3/8 37.5% (similar to 38.2% Fib ratio)
2/8 25%
1/8 12.5%
0/8 0%
Since most readers will be familiar with price retracements andprojections, for example in ABC wave projections, the next section willonly focus on time analysis.
Time analysisTime considerations can start with cyclical analysis, such asseasonality, particularly for agricultural products but this is only aguide to cyclical perceptions of fundamental pressures. The monthlycycle and even oscillators can be tied in, as these are quasi-cyclical,but they do require selection of appropriate parameters. Theimportance of time results from profitability being a function of bothprice and time. Keynes’s comment that “we are all dead in the longrun” applies to both fundamental and technical forecasts. Moreover,there is an emphasis on the time needed to build up the potentialenergy required for large moves as people need time to “forget” whatwent before – again, accumulation and distribution cycles take time.
In terms of market geometry, the same analytical principles that areapplied to time are applied to price analysis, as it is believed that timeand price are interchangeable and linked in their analysis. Figure 3shows that the 1500c level approached in early June has been pivotalsince the late 1980s in the CSCE Cocoa market. An examination oftime retracements and projections on the July contract showed thatthe downtrend stalled at the beginning of June at 161.8% of theprevious upswing’s duration and 100% of the time taken between theOctober 2002-January 2003 peaks. These lows proved to be the firsttrough in a double bottom from which we have just broken out.These techniques do link through to classic pattern analysis. For afamiliar example Figure 4 shows the symmetry between bothshoulders and the head of the head and shoulder patter much spokenof on the S&P. Such analysis is best done using calendar days,weeks ormonths, with a spreadsheet making the calculations simple. There aremany ways of looking at time but, as Gann would have put it, thereare also pressures of both time and space in this article.
Percentage projections and square root growthAnother simple Gann method for projecting levels involvespercentage projections from highs and lows, based on change from a
single point, rather than price retracements e.g. low at $100 + 25% =$125, $100 + 50% = $150, etc. Combined with Gann’s Square RootGrowth Spiral projections, which are related to the Fibonacci growthspiral, these levels can be helpful (see Connie Brown’s video for raisingfunds for the MTA library destroyed in the WTC attacks). In 1987 theDJ-30 had made a 360 degree progression (a full circle across squareroot growth) from the 729.9 low (the start of the 1980s bull market) tothe high at 2746.65. This also coincided with a series of 25% andsquare root growth projections thereby giving a heads up indicationto be taken account of in the environment of bond yields andinflationary pressures at that time. This is about all one can take fromany of these techniques as they stand – one would have waited to seehow the market traded these levels as they did not predict a crash perse, they just provided the point at which there was the strongestconfluence of projections. Furthermore, and most importantly, thesetechniques do not dictate how one would trade such analysis or theposition management itself, as with any indicator or chartingtechnique.
Time: price anglesAs well as time and price being interchangeable in their analysis,relationships between them are pivotal in analysis offered by Gann.Most technical analysts do already analyse time:price relationshipsusing trendlines and channels. I have often heard it asked whytrendlines work? From a Gann perspective, the reason is one of aconstant relationship between time and price at turning points in themarket. When a trendline is drawn supporting three troughs what weare saying is that the time:price relationship between these troughs isconstant (if a chart is plotted semi-log the constant relationship isbetween percentage changes and time). The optimum time: pricerelationship is often referred to as the Gann line or the 45º line. Manyprograms do not plot this line correctly, as the 1x1 angle is not in fact a45º line – its screen appearance is immaterial. It represents time:priceunity e.g. price has moved 10 points in 10 calendar days. Time units canbe calendar days,weeks, months or years and price units can be dollarsor traded points. The solution is to draw your own Gann line using thetrend-line tools in your existing software between points equallyseparated by time and price. There are many ways which these linesare used to examine the squaring of time and price, yet the primarypoint to note is that many applications do not draw them correctly.
Trading strategiesAn examination of trading strategies is frequently not separated fromthe wider “strategic” analysis/directional forecasting outlined above.Trading strategies look for real opportunity based on risk:reward,often with a tight stop loss at a level of clear significance (significancebeing defined as a technically significant level or at a point of pivotalinformation flow). When making trading decisions there is no need toprove anything – cash pays interest and transactions cost moneywhich is all too easily forgotten. The question is not one of beingcorrect, but of entirely accepting an individually random outcome atthe moment of taking a risk:reward decision. Statistically, the best
Figure 3 Monthly Cocoa
Figure 4 S&P TIme and Pattern Analysis

MARKET TECHNICIAN Issue 48 – November 20038
approaches or systems in the world will face periods of manyconcurrent losses – you will not know when you will face these.
So what things should we watch? The market leaders/decliners andhow these affect the termination of bull or bear markets – Gann,Livermore and many others have written on this (look at the perceiveddot.com leaders – AOL, for example,was making a double top whenthe Nasdaq made its 2000 top). Watch for basic trade triggers: reversaldays, inside/outside days, persistent 4-7 day support somewhere“interesting” and breakouts which look real one level higher.
How can one assess this?In terms of scientific assessment of these techniques, non-parametricstatistical tests that avoid traditional assumptions about the statisticaldistribution of returns are used. This avoids assumptions regardingthe skewness (asymmetry in the distribution of returns) or kurtosis(fat-tails in the distribution of returns caused by the “unusual”frequency of extreme moves in the markets). As a basic exampleFigure 5 shows the difference between the Normal distributionusually assumed, and how returns were actually distributed on lastyear’s NYMEX Light Crude December contract.
Resampling is where one randomly reorders returns data to createsimulated price series e.g. 10,000 series. This is not dependent on anyassumed distribution and uses the actual distribution of the data.Average results from these simulated time-series provide a benchmarkof what is achievable even with data “randomly” generated. Onewould then examine phenomenon on the simulated series e.g.breakouts and these “real” results are then compared to this.
Similarly, random levels can be generated to test any kind ofsupport/resistance phenomenon. Random levels are placed on theprice series e.g. 10,000 random levels and how the simulated seriesreacts on average to the phenomenon being examined provides abenchmark. Again, the “real” results are then compared to this.
Step by step reviewTraders should be following a review process, regardless of Gann.
• Looking at swing charts and indicators, what is the basic trend forthree levels? (The environmental higher timeframe, the timeframeyou are trading and a level below this to fine-tune timing).
• Does the trend appear under threat or look overextended? If so,project time and price levels at which to tighten stops.
• What are your patterns and/or wave analysis telling you?
• What is happening in the wider market environment?
• Which fundamentals are in fashion and which fundamentals arepeople going to be forced to accept if reality hits them?
CaveatsThis is the section which I feel many readers will skip through, yet is themost important. Firstly, one must be trading the relevant trend for one’srisk/capital profile. Once this is decided, additional analysis is only thereto assist in the context of support/resistance, help when the minortrend reverts back to the major trend and tighten stops when the trendappears overextended. It helps you decide when you will NOT trade...
No techniques can stand on their own (for long) and one’s focusshould be risk control – a trader is better off being random/non-systematic with good risk control than vice versa. Because offluctuating appropriateness, one must understand what to use indifferent types of markets – sometimes the solution is to shifttimeframes and trading horizons.
The “I could do that!” factor is dangerous. – do not play number gamesor draw lines all over the place. Do not get carried away like Elliott did inthe latter stages of his life – it is not about the “secrets of the universe.”Gann theory is not a “natural law” which takes away your responsibilityfor your trades, it is just a way to conceptualise a market. Therefore, youmust not expect too much – you cannot trade every market position.Without accepting this and the fact that losses are as sure as nightfollows day you will become disillusioned. Never forget that you arebeing paid by the market to assume risks and the safest way to doubleyour money is to fold it over twice and put it in your pocket.
Remember, Gann was a trader whose work overlapped with the restof technical analysis. Basic trading analysis always applies – asaforementioned this is different from forecasting. It all comes backdown to the same old things 99.99% of people avoid:
• Keep records
• Trade management
• Position sizing
• Know yourself
The “Key”, if there is onePeople attending the presentation I gave in June may have beensurprised by my apparent cynicism, I felt this was necessary becauseof the dangers of the ‘holy grail’ appeal of Gann analysis. Whilst suchcynicism is necessary, it has to be balanced by a mind open toobjective research.
So what is the key? The 3P’s : Patience, Perspective and Pleasure.What is actually possible in the markets? Gann is not needed tounderstand this – here is some food for thought:
• The 1929 top was not breached until 1956
• Early 1960s equities moved sideways until the 1980s regardless ofinflation
– Compound returns for the S&P 1966-1982 was 0 per cent
– From 1966 the Dow returned 0 per cent after inflation by 1994.
– From 1972 Coca-Cola and Disney gave no return until 1985
• Capitalisation weighted indices only show ‘winners’
– The indices would look very different if still composed of their1929 or 1987 or 2000 constituents!
There is wild speculation in a sector every 20 years or so. Keynes et alsaw cycles as being right at the heart of economics. Despite theimportance of trend, people can become too used to extrapolatingrecent trends and growth rates. The patience and perspective allowedby appreciation of historical market action does have to be enjoyed byitself and not merely as an attempted route to riches. As CharlesSchwab said,“The man who does not work for the love of work butonly for money is not likely to make money nor find much fun in life.”
Gann and wider strategic analysis: where are we now?In terms of upside resistance on the S&P, the highs at 1170 areimportant. They sit at the 38.2% price retracement of the all-timehigh to the September 2001 low and both the 61.8% time and price
Figure 5 Normal v Observed Returns
Issue 48 – November 2003 MARKET TECHNICIAN 9
retracements of May-September 2001 downtrend (time and pricesquared). The current lows are important at this triple bottom at the50% retracement down from the all time high and for a range ofother reasons (see Figure 6).
At the time of writing, the Dow had been looking more positive thanthe S&P – but despite both breaking out it appears that the generalsare still being held back by the S&P. Good corporate earnings appearto have already been priced in or are being ignored for the moment.Earnings are being perceived as not as bad as expected, hardly aringing endorsement. Overcapacity and inventories seem to be beingworking through without as much dependence on the consumer forthese earnings improvements, yet... As a proportion of GDP, corporateearnings levels mean that equities are still overvalued by 40%compared to 1997. If good volume and activity confirm the currentbreakout then we may be on to something that gives people enoughhope to claim a new horizon. We are still a long way off from theequity highs and people forget that average returns will take a longtime to get us back up to these levels. Furthermore, people appear tobe underestimating the effect of the strength of crude oil.
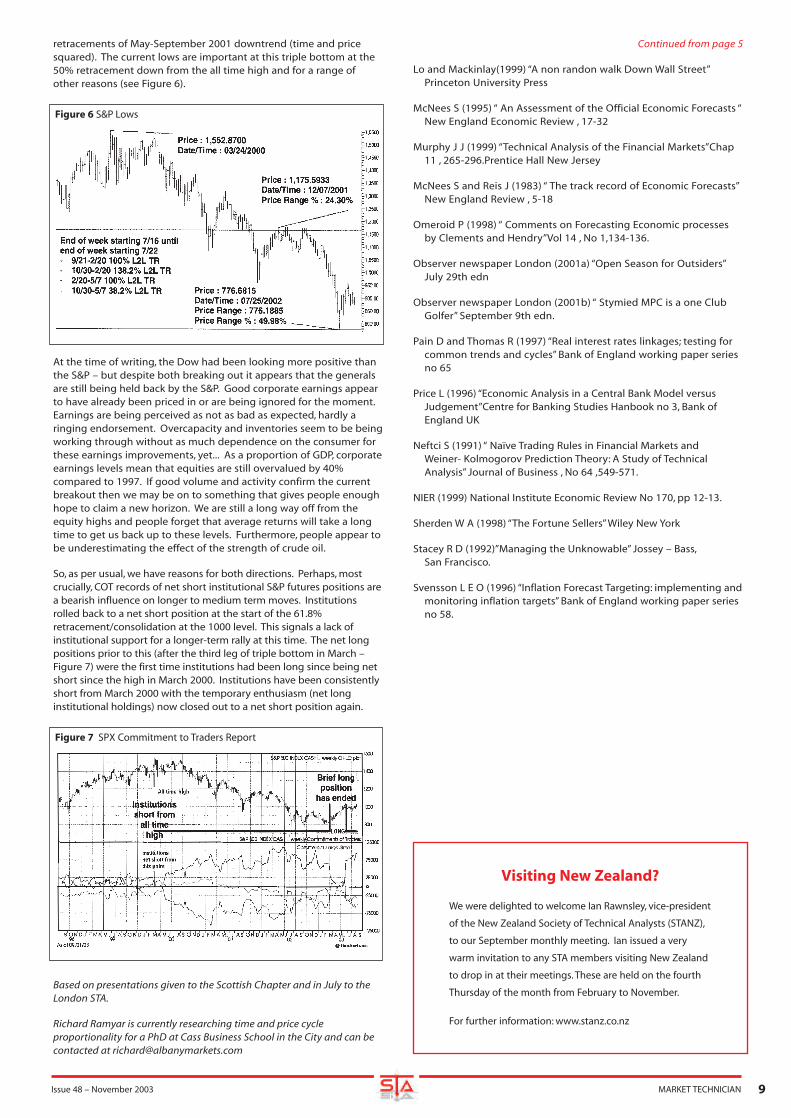
So, as per usual, we have reasons for both directions. Perhaps, mostcrucially, COT records of net short institutional S&P futures positions area bearish influence on longer to medium term moves. Institutionsrolled back to a net short position at the start of the 61.8%retracement/consolidation at the 1000 level. This signals a lack ofinstitutional support for a longer-term rally at this time. The net longpositions prior to this (after the third leg of triple bottom in March –Figure 7) were the first time institutions had been long since being netshort since the high in March 2000. Institutions have been consistentlyshort from March 2000 with the temporary enthusiasm (net longinstitutional holdings) now closed out to a net short position again.
Based on presentations given to the Scottish Chapter and in July to theLondon STA.
Richard Ramyar is currently researching time and price cycleproportionality for a PhD at Cass Business School in the City and can becontacted at [email protected]
Continued from page 5
Lo and Mackinlay(1999) “A non randon walk Down Wall Street”Princeton University Press
McNees S (1995) “ An Assessment of the Official Economic Forecasts “New England Economic Review , 17-32
Murphy J J (1999) “Technical Analysis of the Financial Markets”Chap11 , 265-296.Prentice Hall New Jersey
McNees S and Reis J (1983) “ The track record of Economic Forecasts”New England Review , 5-18
Omeroid P (1998) “ Comments on Forecasting Economic processesby Clements and Hendry”Vol 14 , No 1,134-136.
Observer newspaper London (2001a) “Open Season for Outsiders”July 29th edn
Observer newspaper London (2001b) “ Stymied MPC is a one ClubGolfer” September 9th edn.
Pain D and Thomas R (1997) “Real interest rates linkages; testing forcommon trends and cycles” Bank of England working paper seriesno 65
Price L (1996) “Economic Analysis in a Central Bank Model versusJudgement”Centre for Banking Studies Hanbook no 3, Bank ofEngland UK
Neftci S (1991) “ Naïve Trading Rules in Financial Markets and Weiner- Kolmogorov Prediction Theory: A Study of TechnicalAnalysis” Journal of Business , No 64 ,549-571.
NIER (1999) National Institute Economic Review No 170, pp 12-13.
Sherden W A (1998) “The Fortune Sellers” Wiley New York
Stacey R D (1992)”Managing the Unknowable” Jossey – Bass,San Francisco.
Svensson L E O (1996) “Inflation Forecast Targeting: implementing andmonitoring inflation targets” Bank of England working paper seriesno 58.
Figure 6 S&P Lows
Figure 7 SPX Commitment to Traders Report
Visiting New Zealand?
We were delighted to welcome Ian Rawnsley, vice-president
of the New Zealand Society of Technical Analysts (STANZ),
to our September monthly meeting. Ian issued a very
warm invitation to any STA members visiting New Zealand
to drop in at their meetings. These are held on the fourth
Thursday of the month from February to November.
For further information: www.stanz.co.nz

IntroductionMarket sentiment plays a critical role in assessing share price movements.This article describes an indicator that I have developed which delivers aconsistent measurement of market sentiment using a uniquecombination of indicators. I have called it the Trend Intensity Indicator.
The Trend Intensity Indicator combines and weighs four simple tools:trend, volume,moving averages and price momentum. This generatesan invaluable benchmark that highlights only those stocks withcompelling trending qualities that offer the best prospects forsustained price movement.
Why sentiment?The motivation for designing an indicator evolved from a realisationthat fundamental analysis was not necessarily providing all theanswers, nor explaining many share price movements.
Price analysis is the examination of a company’s share price. At anyone point in time buyers and sellers agree on a market price, which isa direct reflection of market sentiment and drives the share price.
Fundamental and price analysis are two entirely separate movingtargets that very often diverge, but it is movement in the share pricewhich we are most interested in and from which we profit.
The “sentiment” factor can drive prices far from fundamental value.The unexpected news of the 2002 profit downgrades were dealt withso harshly by the market that it drove prices well below theirfundamental value. By contrast, future expectations can build prices tounrealistic levels far beyond fundamental value. This is what made theBiotech sector such a burial ground of shattered dreams – so manyexpectations. And of course, the Internet bubble was built almostentirely on sentiment with little consideration for value at all.
Sentiment is a powerful force, and an understanding is essential tosuccessful stock market trading and investing. The difference betweena stock’s fundamental valuation and its share price could be explainedas the “sentiment” factor.
How do we measure sentiment? To initiate analysis using the Trend Intensity Indicator a definition oftrend is first established. A stock, which moves in a sequence of higherhighs and higher lows, is defined as having an uptrend. At the pointthat this sequence begins, i.e. when it changes from a downtrend oflower highs and lower lows,we consider the trend reversed.
Only weekly reversals are employed in our approach. The basis forthis rule is that a weekly trend change avoids daily market noise. It isa reliable medium term indicator and provides a clear and objectiveview of market sentiment.
Once a stock fulfils a simple trend definition, our Trend IntensityIndicator then rates the power of that trend and establishes a clearview of market sentiment towards it, or against it.
The Trend Intensity Indicator calculates a single value from a “basket”of sentiment indicators.
1.Trend – for direction
2. Price/volume – investor participation/non participation
3.Moving average – for averaging probabilities
4. Price momentum – to define the power of the crowd behaviour
The calculationBy taking each indicator and breaking it down to the most basicsignals, we provide a value for the state each indicator is in. For trend,it is either up or down which then receives a negative or positivevalue reflecting that state. This is then weighted into the end result,its Trend Intensity Rating.
Of the other three indicators we ask the question: Does volumesupport the rise? Where is the price in relation to its moving average?And is price movement attracting positive crowd behaviour?
The following table shows the indicators used for calculating the TrendIntensity Indicator and their different states. The values andcalculations that generate the Trend Intensity Rating for each stock areproprietary to Stockradar, however, the objective rule-based approachbecomes clear with only the most reliable signals being employed.
Trend Intensity IndicatorThe Trend Intensity Indicator calculation generates a stock ratingbetween 10 and -10. The highest value of 10 reflects a consensusagreement by all indicators that all positive sentiment rules havebeen satisfied and the stock is, therefore, rated at a maximum on theTrend Intensity scale. The lowest value of -10 reflects consensusagreement from all indicators that no conditions have been met thatsuggest a stock has any positive sentiment towards it.
A stock that reverses its trend to up and has a Trend Intensity Ratingof 4 or greater will qualify as a Stockradar Stock Pick and, as such, willhave compelling trending qualities and offer the best prospects ofprice movement. Alternatively, a stock that reverses its trend and hasa Trend Intensity Rating of -4 or less will be disqualified fromStockradar’s Stock Picks on the grounds that it has lost its trendingqualities. This breaks the market down into two distinct groups ofstocks. One that is trending, or one that is not. Our focus is on uptrending stocks only.
MARKET TECHNICIAN Issue 48 – November 200310
The Trend Intensity IndicatorBy Richard Lie
INDICATOR STATUS
PRICE
1a. Trend Up Higher Highs and Higher Lows
1b. Trend Down Lower Lows and Lower Highs
VOLUME
2a. Volume Bullish Volume Expanding & Price Rising
2b. Corrective in up trend Volume Contracting & Price Rising
2c. Volume Bearish Volume Expanding & Price Falling
2d. Corrective in down trend Volume Contracting & Price Falling
MOVING AVERAGE (XMA)
3a. Moving Average – Positive Price > XMA
3b. Moving Average – Negative Price < XMA
3c. Moving Average – Neutral Prices closes once above/below XMA
MOVING AVERAGE CONVERGENCE/DIVERGENCE INDICATOR (MACD)
4a. MACD – Positive MACD lines > 0,
MACD Histogram Rising and > 0
4b. MACD lines > 0,
MACD Histogram Rising and < 0
4c. MACD lines > 0,
MACD Histogram Falling and > 0
4d. MACD lines > 0,
MACD Histogram Falling and < 0
4e. MACD – Negative MACD lines < 0,
MACD Histogram Falling < 0
4f. MACD lines < 0,
MACD Histogram Falling > 0
4g. MACD lines < 0,
MACD Histogram Rising > 0
4h. MACD lines < 0,
MACD Histogram Rising < 0

Issue 48 – November 2003 MARKET TECHNICIAN 11
TREND INTENSITY INDICATOR RATING SCALE
The ResultStockradar’s coverage is of the ASX/300. Weekly results are presentedeach Monday with our recommended Stock Picks atStockradar.com.au. Our weekly Stock Picks are supported by a StockAlert facility that scans the market daily, targeting stocks that aremoving in and out of their trends. Along with specific stock analysis,the Weekly Sector Update takes on a thorough review of a marketsector. Published bi-monthly our free newsletter features a selectionof market highlights.
Richard Lie is an independent research provider licensed by the ASIC(Australian Securities and Investments Commission).
An interesting article by Beverley Antrobus (MT August 2003), butunfortunately a little flawed in the logic and also in some of the “facts”quoted. Beverley’s basic premise was that you cannot make more moneyby actively trading a large move compared to the money you would makeby sitting tight for the long haul. This argument assumes that it is notpossible to identify intermediate turning points in advance and that youhave to wait for “a change in trend” before you act. This is not the case.The concept that “profit and loss is virtually random at the short termlevel” is incorrect. Markets are fractal, they are self similar and thereforebecome predictable even at short time frames as well as over periods ofseveral years. I am also curious as to why Beverley uses W.D Gann as proofthat you should throw away your “ticker” and then describe the sameperson as a “self publicising failure”.
Markets are not random and with hundreds of years of data thoroughlytested do not appear to have ever been random. Why am I convinced thatthe markets are fractal? Because using these fractal qualities, I can predictfuture price movements every hour of every day in the same manner onmultiple time frames. Predicting these future price movements, includingdefinitive price levels in areas where no trading has existed before, is notimpossible as Beverley would have you believe. It is not easy but it is notimpossible. The truth is that “market price moves to find a new barrier atevery level of oscillation”, and that is quoting Beverley’s own article. Ofcourse you have to know how to find a way of predicting these levels inadvance, and that is the hard part. Beverley states that the short termtrader cannot know where these reflective barriers will appear as there isno magic formula. The only part of this I would agree with is the fact thatit is not magic. It is just a formula and there are short term traderseffectively using these levels every day.
Beverley seems to think that technical analysis will not be serious until it canpredict all markets all of the time. When are we going to get measured on alevel playing field with the economists? They can’t always tell what hashappened accurately in the past, let alone the future. Economics, withperhaps the exclusion of Econophysics, has nothing to do with predictingaccurate levels where markets will make significant changes in trend.Telling me that the bond market may have changed trend after one of thebiggest one month falls in over 50 years is not helpful. Predicting thecollapse and getting short at the highs is useful, which is the level ofaccuracy actually provided by technical analysis. Is it possible to trademarkets successfully purely from technical analysis with no knowledge ofeconomic theory or even access to news? Yes it is. Let’s take this a stagefurther. It is possible to predict, from technicals alone, where a turning pointwill come in a market of such magnitude that it will force commentators tochange their assessment of the underlying economic situation? Economiststend to write the story to fit the events that they know.
Regarding Gann, Livermore and Elliott failures, does the apparent successor failure of their personal trading matter? One of the most respectedequity analysts of the past 40 years, who made substantial sums for hisclients, couldn’t trade his own account successfully. Did that make him afailure? Livermore took a huge punt on there not being a Second WorldWar and stopped himself out permanently. I can’t see that this provesanything except that everyone needs a better money managementsystem than just blowing your brains out.
Gann however was not a failure. The methods worked then and worknow. Nobody, however ever said that they were easy methods. Anecdotalevidence suggests that much of the negative information aboutW.D.Gann’s “success” came from his son, with whom he appeared to havebeen in some kind of dispute.
So back to Beverley’s basic conclusion that you cannot make more moneyby actively trading a large move compared to the money you would makeby sitting tight for the long haul, I have looked hard at the article andcannot find any solid evidence furthermore if Beverley is so convincedthat you cannot improve results by active trading does his own tradingstrategy actually reflect this?
Malcolm Blazey F.S.T.A. Managing Director TradingSkills.ComAugust 2003
LetterRATING STATUS10 to 7 Trending up strongly
6 to 4 Trending Up
3 to -3 Neutral
-3 to -6 Trending down
-6 to -10 Trending down strongly
Society of Technical Analysts Ltd (STA)Diploma Course
15 January – 6 April 2004
For the eighth year running, the Society of Technical Analysts Ltd (STA) EducationCommittee is holding its Diploma course in Technical Analysis. This year it will beheld at London School of Economics in Aldwych.
The course is a preparation for the Diploma examination in April 2004. It consistsof 11 Thursday evenings starting on Thursday 15 January, followed by a full dayRevision Day (including Report writing), on Tuesday 6 April 2004. Eveningsessions are from 6.00pm to 9.00pm and Revision Day, which includes lunch, from9.30am to 5.00pm. The Exam itself lasts three hours and will be held later in April(date to be announced).
The course is expected to cover:1. Bar charts. Gaps, islands, key reversals. Defining price objectives from gaps and
patterns on bar charts. Arithmetic versus logarithmic scales.2. Moving averages – arithmetic, weighted, and exponential. Centred, non-
centred and advanced. Single, double and multiple moving averagecrossovers. Moving envelopes, including Bollinger Bands.
3. Candle charts and candle patterns.4. Point and figure charts. Construction, scale, box reversal, objective counting.
Advantages and disadvantages compared to other types of chart.5. Dow Theory.6. Chart patterns, eg. triangles, flags, pennants, diamonds, broadening patterns
(megaphones), wedges.7. Reversal patterns and how to identify/anticipate them. Rounding tops and
bottoms, head and shoulders, spikes, double/treble/multiple tops and bottoms.8. Trend. How to draw correct short, medium and long-term trendlines. Trend
channels. Return lines and internal trendlines. Unconventional but usefultrendlines. Acceleration. Speed lines. Trend characteristics.
9. Consolidation – how and why it occurs. Breakouts and how to recognise them.10. Corrections: when and how far.11. Support and resistance.The various chart points and facets that can act as such.12. Basic elements of Gann theory.13. Basic elements of Elliott wave theory.14. Fibonacci series, fan lines, arcs and time zones.15. Cycles. Amplitude, length, phase, harmonicity, synchronicity, left and right
translation. Detrending.16. Relative performance and how to interpret relative strength charts.17. Momentum indicators and oscillators including:
Rate of change – Welles Wilder's RSI – Stochastics (%K & D) Moving Average Convergence Divergence (MACD) & MACD histogram Directional Movement Indicator – Parabolics – Commodity Channel Index
18. Volume signals and indicators, including On-Balance Volume, VolumeAccumulator etc. Open interest.
19. Breadth indicators.20. Sentiment indicators and contrary opinion.21. Market Profile (TM).22. Investor psychology – individual and group.
If you would like further information please contact Katie Abberton on 07000 710207

It is interesting to take a snapshot of academic research now and then totry and gauge where technical analysis stands with respect to our friendsin the ‘ivory towers’. Keep in mind that technical analysis as a trading toolhas been a puzzle to academics, as trend following techniques seem toprovide consistent positive returns. A good starting point for examiningthese ideas is Dr. Ron Giles paper ‘The Importance of Price Information’which is available on the STA website (www.sta-uk.org/rg_wita.pdf ).Dr. Giles does a great job of reviewing current research and describingsome of the problems experienced by academicians as the idea that onecan make money in a consistent manner makes a mockery of financialmarket theories. Keep in mind that the Efficient Market Hypothesis hasdominated academic thinking for some time. A useful look at some ofthe early work by Eugene Fama, the father of EMH, is available athttp://www.sjcny.edu/~kaplan/pdf2/fama_70.pdf. A list of some of hisother major research is available at http://cepa.newschool.edu/het/profiles/fama.htm. The EMH is important as this sets out the ideas of aweak form, semi-strong form and strong form of efficiency. The weakform asserts that all past prices and data are fully reflected in the assetprice in which case technical analysis should be of no use to a traderattempting to ‘beat the market’. The semi-strong form asserts that allpublicly available information is fully reflected in the asset price, whichsuggests that fundamental analysis is of no use either. The strong formasserts that all information is fully reflected in the asset price, whichwould suggest that even insider trading is of no use.
As technical analysis models seem to generate positive returns in manystudies, the benchmark has shifted and now a model is judged on thebasis of being able to generate positive returns net of transaction costsand on a risk adjusted basis. The list of papers below is by no meanscomplete, but I have tried to cite those that can be found with a weblinkin all instances and will post the links and some information about thearticle in the members’ area (and update them with any more researchlinks that member send in to me).
A good web source for academic research articles on technical analysis isthe Social Science Electronic Publishing site (www.ssrn.com). Oneinteresting paper there is ‘Do the Profits From Technical Trading RulesReflect Inefficiencies?’ by Hendrik Bessembinder of the University of Utah– Department of Finance and Kalok Chan of the Hong Kong University ofScience & Technology – Department of Finance. They look at stockreturns and seem to conclude that while it’s possible to forecast returnsusing TA models, once transaction costs are added in the market isdifficult to beat.
Another interesting paper is the ‘Foundations of Technical Analysis:Computational Algorithms, Statistical Inference, and EmpiricalImplementation’ by Andrew W. Lo from the Massachusetts Institute ofTechnology (MIT) – Sloan School of Management; National Bureau ofEconomic Research (NBER) and Harry Mamaysky from the Yale School ofManagement and Jian Wang from the Massachusetts Institute ofTechnology (MIT) – Sloan School of Management; National Bureau ofEconomic Research (NBER). They attempt to quantify chart patterns andconclude that there may be some value to charting after all, but leave theconclusions open to further research.
A different take on why TA may work is found in ‘Technical Analysis andLiquidity Provision’ by Kenneth A. Kavajecz from the University ofWisconsin – Madison – Department of Finance; University ofPennsylvania – Finance Department and Elizabeth R. Odders-White fromthe University of Wisconsin – Madison – School of Business. While at firstblush the premise of this paper (chartists are unwittingly finding theorder levels on market makers’ books and gauging the depth of themarket) may seem unlikely, careful reading does suggest that the authorshave a decent case. Support and resistance levels should/can coincidewith order levels (chicken and egg syndrome here) and the attempt tosquare the circle and tie in TA with EMH is useful.
European stock index traders may find the research paper by P.J. Detry(Facultes U. Notre-Dame de la Paix Namur) and Philippe Gregoire(University Catholique de Louvain, CeReFiM) on ‘Other Evidence of thePredictive Power of Technical Analysis: The Moving Averages Rules on
European Indexes’ useful. They suggest that even the simplest trendfollowing models can forecast returns, and make money, but withtransaction costs they feel that excess profits will be eliminated.
Foreign Exchange traders should be familiar with the concepts in‘Technical Analysis and Central Bank Intervention’ by Christopher Neely(Federal Reserve Bank of St. Louis) and Paul A. Weller (University of Iowa)in which the authors provide further research on their previous work. Ina nutshell they find that technical trading rules usually take a positionagainst the central bank intervention and in a few currencies are quiteprofitable. Food for thought given current activity in Asian currencies?
A very thorough paper on TA in stock markets is ‘Technical Analysis in theMadrid Stock Exchange’ by Fernando Fernandez Rodriguez (Universidadde Las Palmas de Gran Canaria), Simon Sosvilla Rivero (Foundation forApplied Economic Research) and Julian Andrada Felix (Universidad deLas Palmas de Gran Canaria). They look at simple trend following rulesover a long period (over 30 years) and show that money can indeed bemade from these TA techniques. The fly in the ointment is that they leftthe door open on transaction costs, which may have swung the results.
An argument that TA practitioners will embrace is put forth by StefanReitz (University of Giessen) in the paper ‘Why Technical Trading Works. ASimple Illustration’ where imperfect information holds the key. A movingaverage system can make up for the lag in information, hence TA works,simple really...
And finally for this paper, the Fed has a decent history of looking intomarket activity and trying to figure out how things work. The NY Fedweblink at http://www.ny.frb.org/research/staff_reports/index.html isuseful in order to find articles by their economists. A paper by CarolOsler with P.H. Kevin Chang in 1995 ‘Head and Shoulders: Not Just a FlakyPattern’ not only suggests that Fed economists can have a sense ofhumour, but also provides food for thought as they found that this classicpattern produced profits in the Dollar-Mark and the Dollar-Yen FX rates.The head and shoulder pattern did not provide great results in the othercurrencies studied, but did hold up in the face of transaction costs beingadded to the DEM and YEN studies.
A paper that is probably more interesting in the background informationand analysis than in the conclusion is Osler’s ‘Identifying Noise Traders:The Head and Shoulders Pattern in U.S. Equities’ (1998). The conclusion isthat head and shoulders patterns do not provide consistent profits in U.S.equities, but the arguments leading into why this may be the case andthe discussion on other factors that could be in play makes this paper auseful background study. Of note is the idea that pre-1930s insidertrading and market manipulation were more common and that since thiswas outlawed some technical patterns may not function as they oncedid. Financial newspaper headlines over the last few years wouldprobably suggest that these practices still plague the market and thatchart analysis may still offer clues as to what is really going on in a share.
Finally, Osler’s ‘Currency Orders and Exchange-Rate Dynamics: Explainingthe Success of Technical Analysis’ (2001) provides an interesting overviewof the FX market participants and the importance of orders. FX trendstend to pause at order levels which may be clustered at round numbers,and if these levels are broken, the trend accelerates. Any FX dealer willbe quite aware of how important this information is and this paper willgive them the ammunition to exhort the sales staff to ‘get orders!’ fromtheir customers. For the TA community? Good background informationand it should add food for thought in any short term analysis.
In conclusion, the above articles provide a snapshot of what is availableon the web and I hope that the articles, if they spark a bit of interest, willbe useful. Academic researchers seem to find TA quite interesting, notjust in the quest to ‘beat the market’ but also in the attempt to quantifywhat is in many ways a study of market behaviour. I will post these linksand notes in the members’ section of the web, and if STA members haveany further notes or wish to alert members of other research articles I willbe happy to post them up.
MARKET TECHNICIAN Issue 48 – November 200312
Web Notes from AcademiaBy Gerry Celaya