Embed Size (px)
Citation preview

2014
Engineering Technology
An analysis of the following
engineering technician occupations:
Mechanical
Electrical, Electronics, and
Instrumentation
Electromechanical
Drafting/CAD
Delmarva Region
Author: Veronica S. Buckwalter, MPA Center for Industry Research & Workforce Alignment (CIRWA) Delaware Technical Community College
LABOR MARKET SCAN
FEBRUARY

1

2
Table of Contents
Executive Summary…………………………………………………………………………………..………Page 4
Acknowledgements…………………………………………………………………………………………..Page 8
Introduction………………………………………………………………………………………….………..Page 9
Regional Overview…………………………………………………………………………………………..Page 10
Industry Overview……………………………………………………….………………………………….Page 10
Occupational Overview……………………………………………………...……………………………...Page 14
Employer Skill Needs and Hiring Challenges…..…………………………………………..…................Page 18
Supply/Demand Gap Analysis…………………………………………………………………………….Page 20
Delaware Tech Response and Challenges…………………………………………….………….……….Page 22
Conclusions & Recommendations…………….……………………………….…………………………..Page 23
Appendix A - Occupational Profiles
A-1. Mechanical Engineering Technology………………………………………………..………Page 28
A-2. Electrical, Electronics, & Instrumentation Engineering Technology…………………….Page 30
A-3. Electromechanical Engineering Technology………………………………………………..Page 33
A-4. Drafting/CAD Technology..…………………………………………………………………Page 35
Appendix B – Methodology………………………………………………………………………………...Page 37
Appendix C – Data Limitations……………………………………………………………………………Page 44
Appendix D – Supplemental Employment Data…………………………………………………………Page 45
Appendix E – List of Study Contributors……………………………………………………………........Page 48
© 2014 Center for Industry Research & Workforce Alignment, Delaware Technical Community College

3
Mission: The Center for Industry Research & Workforce Alignment, in close partnership with local businesses,
government, and academia, delivers future-focused labor-market data and workforce information enabling
educational institutions to make proactive and flexible decisions in response to the evolving workforce needs of
Delaware’s competitive industries.
Vision: The Center for Industry Research & Workforce Alignment strives to be Delaware’s key source of labor-
market insight to enable educational institutions to better align their program and training resources to meet the
skill demands of business and industry.
------------------------------------------------------------------------------
This report was completed by The Center for Industry Research and Workforce Alignment (CIRWA), an initiative
of Delaware Technical and Community College. It was completed in cooperation with the California Centers of
Excellence as part of the USDOL-ETA Trade Adjustment Assistance Community College Career Training grant
awarded to Delaware Tech in October 2011. Special thanks to the following individuals from the California
Community Colleges’ Centers of Excellence:
Elaine Gaertner – Former Statewide Director of Centers of Excellence
Breakthrough Consulting Services
1218 Fiddlers Green
San Jose, CA 95125
John Carrese – Director, Bay Region Center of Excellence
City College of San Francisco
50 Phelan Avenue Cloud Hall, Rm 233
San Francisco, CA 94112
Zhenya Lindstrom – Director, San Diego-Imperial Regions Center of Excellence
Chaffey College
5897 College Park Ave
Chino, CA 91710
This workforce solution was funded by a grant awarded by the U.S. Department of Labor's employment and Training
Administration. The solution was created by the grantee and does not necessarily reflect the official position of the U.S.
Department of Labor. The Department of Labor makes no guarantees, warranties, or assurances of any kind, express or
implied, with respect to such information, including any information on linked sites and including, but not limited to,
accuracy of the information or its completeness, timeliness, usefulness, adequacy, continued availability, or ownership.
4
Executive Summary
Delaware Technical Community College requested this labor market scan in an effort to determine employment
dynamics and drivers for a set of its engineering technology programs. The engineering technology occupations
examined in this scan include:
Mechanical Engineering Technology
Electrical, Electronics, and Instrumentation Engineering Technology
Electromechanical Engineering Technology
Mechanical and Electrical Drafters and CAD Technicians
The scan seeks to understand how the region defines and values engineering technology by examining engineering
technicians within a 13-county mid-Atlantic region that includes the three counties in the State of Delaware and ten
bordering counties. The scan asked employers to consider how these jobs are changing due to advancing
technology and the economic environment and what Delaware Tech and other community colleges can do to
ensure that associate degree programs accurately reflect the skill needs of employers five years from now.
This scan includes information gleaned from a regional survey of employers which yielded responses from 150
firms. Given that firms may employ multiple types of technicians, many respondents completed the survey for
more than one occupation resulting in 252 occupation-level responses. Executive interviews were held with 21
individuals from 11 firms and organizations so as to provide qualitative context to the survey data.
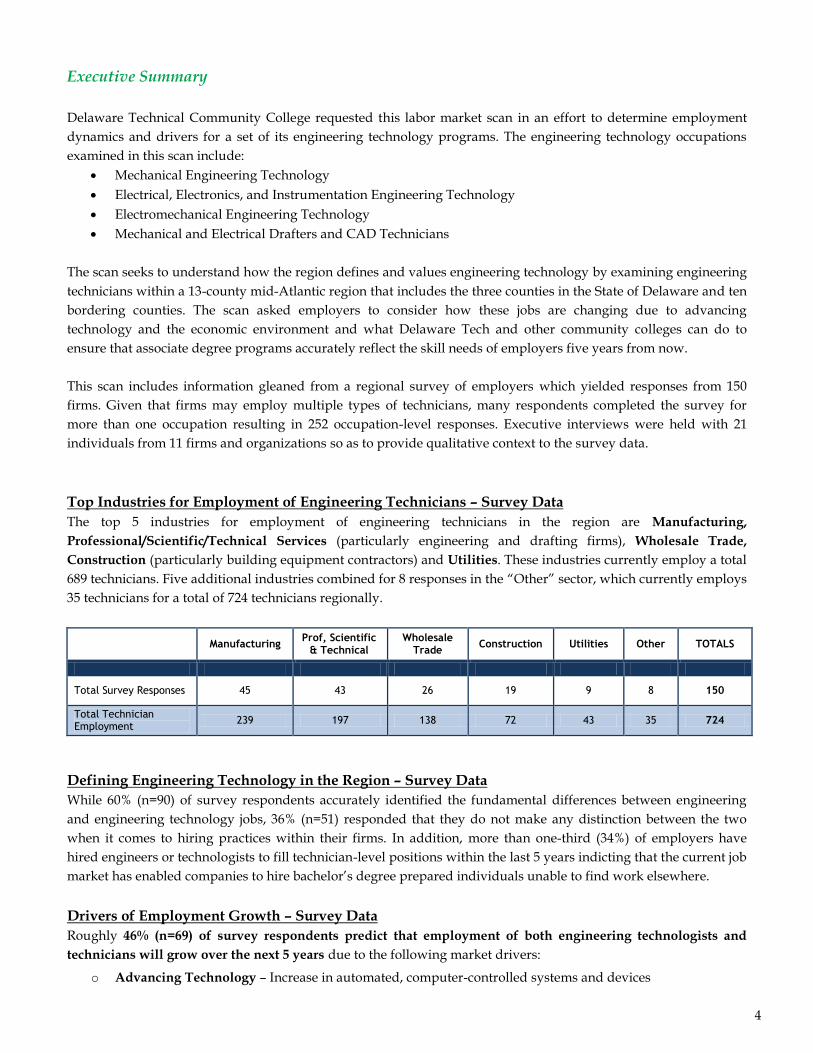
Top Industries for Employment of Engineering Technicians – Survey Data
The top 5 industries for employment of engineering technicians in the region are Manufacturing,
Professional/Scientific/Technical Services (particularly engineering and drafting firms), Wholesale Trade,
Construction (particularly building equipment contractors) and Utilities. These industries currently employ a total
689 technicians. Five additional industries combined for 8 responses in the “Other” sector, which currently employs
35 technicians for a total of 724 technicians regionally.
Manufacturing Prof, Scientific
& Technical Wholesale
Trade Construction Utilities Other TOTALS
Total Survey Responses 45 43 26 19 9 8 150
Total Technician Employment
239 197 138 72 43 35 724
Defining Engineering Technology in the Region – Survey Data
While 60% (n=90) of survey respondents accurately identified the fundamental differences between engineering
and engineering technology jobs, 36% (n=51) responded that they do not make any distinction between the two
when it comes to hiring practices within their firms. In addition, more than one-third (34%) of employers have
hired engineers or technologists to fill technician-level positions within the last 5 years indicting that the current job
market has enabled companies to hire bachelor’s degree prepared individuals unable to find work elsewhere.
Drivers of Employment Growth – Survey Data
Roughly 46% (n=69) of survey respondents predict that employment of both engineering technologists and
technicians will grow over the next 5 years due to the following market drivers:
o Advancing Technology – Increase in automated, computer-controlled systems and devices

5
o Infrastructure Upgrades – Need for improved buildings, systems, and transportation
o Educational Affordability and Flexibility – Rising cost of universities versus community colleges
o Economic Recovery - Projected slow, but steady, economic recovery
o Global Competitiveness – Need for increased production and cost efficiency to compete globally
o Cost-effectiveness of Technologists/Technicians – Traditionally command lower salaries than engineers Overall, only 15% of firms (n=10) anticipate the demand for technologists declining and even fewer (3 firms)
anticipate the demand for technicians declining within the next 5 years.
Engineering Technician Employment Outlook – Survey Data
The table below outlines current employment data for engineering technicians within the region. Survey data for
projected growth, retirements, turnover, and position openings are also provided.
Current Employment
Projected Employment
in 5 years
5-year Projected Openings Total 5-yr Openings
incl. Growth
Annual Openings over next
5 yrs.
Projected Job
Growth
Current Openings
Projected Retirements
Projected Turnover
Mechanical Engineering Technicians
159 197 38 21 39 8 106 21
Electrical, Electronic, Instrument Engineering Technicians
221 293 72 27 37 24 160 32
Electromechanical Engineering Technicians
76 99 23 7 8 12 50 10
Drafting/CAD Techs 268 311 43 42 34 36 155 31
TOTAL 724 900 176
(24%) 97 118 (16%) 80 (11%) 471 94
Combined employment for all occupations in the region totals 724 jobs (known employment taken from survey
data). The survey data indicates that participants are projecting a 24% increase in employment over the next 5
years. Survey data revealed that although many engineering technicians may be reaching retirement age,
employers are only expecting roughly 16% of their workers to actually leave the workforce within the next five
years due to retirement. This indicates that workers eligible for retirement are expected to remain in the workplace
longer, possibly due to the current economic environment.
Engineering Technician Employment Outlook – Extrapolated Estimates CIRWA estimates that the total number of firms in the region that hire these engineering technician
occupations is roughly 1,854 firms. This is a conservative estimate based on the survey’s qualifying incidence rate
(the percentage of firms in each industry that qualified to take the survey) and occupational incidence rate (the
percentage of qualified firms that hire each occupation). That being said, CIRWA estimates that this survey data
(n=150) is representative of approximately 8 percent of the total “universe of firms” (n=1 ,854).
Estimated current employment for the region could be as high as 7,713 technicians. This is a conservative,
extrapolated estimate calculated by multiplying firms’ average current employment at the occupational level by the
estimated universe of firms that hire each occupation. In addition, when examining survey respondents’ average
firm-level projected employment 5 years from now, one can apply that average to the estimated universe of firms
to determine the 5-year change (growth/decline). Using this formula, these occupations could grow to roughly

6
9,675 jobs (1,962 jobs added) by 2019. This is a 5-year growth rate of approximately 25 percent. Position openings
due to growth and replacements are determined by multiplying firms’ projected 5-YR employment, retirements,
and turnover averages (taken from survey data at the occupational level) to the estimated universe of firms that
employ that occupation. A summary of extrapolations for several data points is provided below. For extrapolated
estimates by occupation, please see page 16 or the Occupational Profiles in Appendix A. In addition, for greater
explanation of the extrapolation process for all data points, please see Appendix B – Methodology.
Extrapolated Estimates for Total Employment, Projected Change, and Openings
Estimated Universe of Firms
Current Employment
Projected Employment
in 5 years
5-year Projected Openings Total 5-yr Openings
incl. Growth
Annual Openings over
next 5 yrs. Projected
Job Growth Projected
Retirements Projected Turnover
All Technicians
1854 7713 9675 1962 (25%)
773 (8%) 619 (8%) 3353 671
Employer Hiring Challenges and Skill Needs – Survey Data
Nine out of ten employers surveyed indicated that they find it at least somewhat difficult to find a highly
skilled job candidate to fill their technician jobs. The top 3 items employers selected when asked to identify their
biggest challenges in finding a qualified applicant include:
Lack of position-related job skills (67%)
Lack of minimum required work experience (65%)
Lack of “soft skills” such as written and oral communication (59%)
Four of the top five skills employers selected as either “extremely” or “very important” are traditionally considered
“soft skills”. Satisfactory Math Skills and Troubleshooting Technical Problems with Devices or Systems were
selected by employers as the top two most important technical skills. Forty-two percent (42%) of survey
respondents felt that the need for in-depth knowledge of computer systems and automation, particularly
networking and programming, has been the biggest change to technician positions within the last 10 years. Skill
needs specific to each occupation are provided in the Occupational Profiles available in Appendix A.
Supply/Demand Gap Analysis – Extrapolated Estimates
The table below provides an overview of regional program graduates based on IPEDS (Integrated Postsecondary
Education Data System) data compared to CIRWA’s extrapolated estimates of annual and 5-year position openings
for all technicians of focus within the region. Data in this table is provided in aggregate form; however,
extrapolated estimates for each occupation can be found on page 21 and in the Occupational Profiles in Appendix A.
IPEDS Regional Graduate Data versus Extrapolated Estimates for Regional Position Openings
Openings due to Replacements
Openings due to Growth
Total Position Openings
Average Regional Program Graduates
Supply/Demand Gap
Annual 5-YR Total
Annual 5-YR Total
Annual 5-YR 3-YR
Annual Avg.
5 –YR Total
Annual Deficit
5-YR Deficit
All Technician Occupations
392 1962 278 1392 671 3353 137 685 (533) (2648)

7
Please note: While the graduates-to-position openings gap from may seem large, it is likely that the job growth
average on which “Openings due to Growth” extrapolations were based is slightly inflated due to the uncertainty
of a 5-year projection versus a 1 or 2-year projection of employment and the inherent optimistic bias of self-
reported data provided by firms. In addition, large firms (greater than 100 employees) represented roughly 7
percent of our adjusted database of firms; however large firms represented roughly 10 percent of survey responses.
This may have slightly skewed the average growth rate toward the high end since a greater percentage of large
firms responded than was represented in the database. It is also important to keep in mind that a large percentage
of these workers do not currently possess a formal degree and there are no industry standards requiring that job
candidates have or obtain one to hold these positions. Finally, completion data does not include graduates of any
programs that do not receive federal financial aid since those programs do not report to IPEDS. Regardless, if we
examine supply versus demand based solely on replacement data, programs are still not producing enough
graduates to meet the replacement needs of these occupations.
---------------------------------------------------------------------------------------------------
Labor Market Scan Conclusions and Recommendations
The conclusions below provide an overview of the principle findings of this labor market study. The proceeding
recommendations provide suggestions for consideration by Delaware Technical Community College and/or other
educational institutions to address the study findings. Greater detail on the conclusions and recommendations can
be found on page 23 of this report.
Conclusions
1. The region is not producing enough engineering technicians to fill the replacement or growth need
projected through 2019.
2. There is recognized value in the skills and abilities of associate degree prepared engineering technicians,
but not enough awareness of Delaware Tech’s program offerings.
3. Computer technology is rapidly advancing the skill requirements of these jobs.
4. Troubleshooting, particularly the methodological process of troubleshooting, is a critical skill need among
engineering technician employers in the region.
5. Soft skills (particularly teamwork and collaboration, problem solving, and communication) are a high skill
need throughout the region across all industries.
6. A majority of the industry acknowledges the technical and conceptual differences between engineering and
engineering technology. However, hiring practices and preferences are interchangeable dependent on the
company.
Recommendations
1. Promote involvement and partnerships with K-12 and other related organizations in an effort to increase
teachers’, counselors’, parents’, and middle and high school students’ awareness of engineering technology
options available to them.
2. Explore strategies and opportunities for a more targeted and cohesive marketing strategy for engineering
technology programs based on the success of the College’s allied health department.
3. Consider adopting a cooperative workplace education experience as a requirement for graduation in the
engineering technology programs.
4. Consider expanding engineering technology programs’ focus on troubleshooting methodology and
computer networking and programming competencies to better meet the skill needs of employers.
5. Further explore the data from the regional survey to determine significant outcomes related to 4-year
engineering technologists.

8
Acknowledgements
The Center for Industry Research & Workforce Alignment would like to acknowledge the individuals listed below.
Their leadership and guidance throughout the creation and start-up of CIRWA has been invaluable. Their shared
commitment to accurate, reliable labor-market intelligence and workforce excellence will ensure that CIRWA is
successful in better informing and aligning Delaware Tech’s educational offerings to meet our industries’ changing
needs.
Steve Borleske, Independent consultant for CIRWA
Mike Bowman, Chairman & President, Delaware Technology Park
Alan B. Levin, Director, Delaware Economic Development Office (DEDO)
John McMahon, Secretary, Delaware Department of Labor
Collin O’Mara, Secretary, Delaware Department of Natural Resources and Environmental Control (DNREC)
Bernice Whaley, Deputy Director, Delaware Economic Development Office (DEDO)
Governor Markell’s Delaware STEM Council Co-Chairs, Dr. Teri Quinn Gray and Mr. Judson Wagner, played an
integral part in helping to increase support for and visibility of this labor market scan. CIRWA and Delaware Tech
extend their gratitude for the STEM Council’s commitment to helping the College complete this critical research
and looks forward to our continued collaboration on future projects.
CIRWA would also like to recognize and thank the many business leaders whose feedback and guidance
throughout the development of this report was critical to its successful completion. Their expertise, candor, and
active engagement is appreciated and valued. For a complete list of individuals that contributed to this report,
please see Appendix E.
Lastly, CIRWA would like to thank the many Delaware Technical Community College faculty and staff that
assisted with or participated in the development of this research.

9
Introduction
Engineering technology occupations are a diverse and somewhat misunderstood cluster of jobs. The ambiguity of
engineering technician job titles, responsibilities, and education, training, and skill requirements makes capturing
an accurate picture of workforce dynamics challenging. This challenge becomes even more daunting in a struggling
economy where “need” does not always equate to “demand”. This labor market scan stems from an energy
industry labor market scan conducted by CIRWA in 2012 which revealed that many of Delaware’s energy-related
jobs require a skill set fundamental to engineering technology. As a result, Delaware Tech saw a need to gain better
insight into how engineering technology jobs are distributed throughout the region, how they are defined by
industry, what types of job titles and responsibilities technicians hold, and how changes within industry are
affecting skill needs. This scan explores the following engineering technology occupations:
Mechanical Engineering Technicians
Electrical, Electronics, and Instrumentation Engineering Technicians
Electromechanical Engineering Technicians
Mechanical and Electrical Drafters and CAD Technicians
Engineering technology, as opposed to engineering, is defined as utilizing the principles and theories of science,
engineering, and mathematics to solve technical problems in research and development, manufacturing, sales,
construction, inspection, and maintenance. Engineering technologists’ and technicians’ work is more practically
oriented than that of scientists or engineers and focuses on existing technology rather than process or product
design and creation.1 Engineering technologists typically hold a bachelor’s degree from an ABET (Accreditation
Board for Engineering and Technology)-accredited engineering technology program at a 4-year college or
university. Engineering technicians often hold an associate’s degree from an ABET-accredited engineering
technology program at a community college or equivalent post-secondary training.
There are as many different disciplines of engineering technology as there are traditional engineering. When a
community college tries to determine where opportunities for job growth and development lie within this job
cluster, a number of industries, business sizes, and job titles must be explored. This scan examines engineering
technicians within a 13-county mid-Atlantic region that includes the three counties in the State of Delaware and ten
bordering counties where graduates of Delaware Tech might be likely to find employment. The purpose of this
scan is to determine how the region defines and values engineering technology, how these jobs are changing due to
advancing technology and the economic environment, and what Delaware Tech and other community colleges can
do to ensure that associate degree programs accurately reflect the skill needs of employers five years from now.
This scan primarily highlights data and information gleaned from a regional survey of employers. Given that
graduates of engineering technology programs can potentially find work under many different job titles within
many different industries, the survey broadly defined the occupations of focus so as not to exclude job titles that
require similar skill sets and educational preparation, but may be recognized by another job title within specific
firms. Extrapolations of specific data points based on survey data were conducted to provide readers with a more
comprehensive picture of current and projected workforce demographics and to perform a supply/demand gap
analysis for the region. In addition, executive interviews were held with 21 individuals from 11 firms and
organizations and existing sources were researched for secondary supporting data. This scan is designed to
provide an aggregate overview of all engineering technician occupations in the body of the document. To find
more data and information specific to each engineering technician occupation, please see Appendix A –
Occupational Profiles, which begin on page 28.
1 Bureau of Labor Statistics – Occupational Outlook Handbook, 2013

10
Regional Overview
CIRWA examined a regional area of 13 counties within 4 states in the mid-Atlantic region for this study. These
counties and states include:
Kent, New Castle, and Sussex Counties in Delaware;
Caroline, Cecil, Dorchester, Kent, Queen Annes, Wicomico, and Worcester Counties in Maryland;
Salem County in New Jersey;
and Chester and Delaware Counties in Pennsylvania
Figure 1. Residential Population by County2
Given Delaware’s small size and the fact that
many residents commute into and out of the
State for work every day, the 10 counties
bordering Delaware were included in order to
gain a more accurate picture of current and
future employment. This data will inform the
College’s educational programs and job
placement strategies.
While Delaware’s strategic location puts it within easy driving
distance of New York, Philadelphia, Baltimore, and Washington,
D.C., much of the state is immediately surrounded by rural,
sparsely populated counties with very low concentrations of
industry. Six of the 13 counties we examined in this study have a
residential population of less than 70,000 people. In contrast, the
northern region of our area of focus is heavily populated and
contains a high concentration of business and industry. Because of
this disparity, some data points within this scan will be reported
based on region (urban and rural) rather than county or state. The
“urban region” includes Chester and Delaware Counties in
Pennsylvania, New Castle County in Delaware, Cecil County in
Maryland, and Salem County in New Jersey. The “rural region”
will include all other counties included in this report.
Industry Overview
Delaware’s blue collar workforce is still struggling to regain momentum since the peak of the economic downturn
in early 2008. Total unemployment in Delaware since 2011 has essentially remained flat and the recent layoff of
1,200 workers at New Castle County-based Astra Zeneca reminds us that that state is still trying to cope with the
effects of economic instability.3 Delaware’s manufacturing industry, the industry with the largest number of
engineering technicians employed, has lost more than 20,000 jobs over the past 20 years – most notably, the closing
of the Chrysler and General Motors auto assembly plants in the northern part of the state.4
2 U.S. Census Bureau Annual Estimate of Residential Population April 1, 2010 to July 1, 2012 3 DECON First – Delaware Economic Review, June 2013 Edition, p. 9 4 DECON First – Delaware Economic Review, June 2013 Edition, p. 17
Caroline

11
However, despite the turbulent economy, many companies interviewed and surveyed for this research were
optimistic when it comes to future employment projections. Two companies interviewed even anticipate large-scale
growth and expansion of their businesses in the coming years. This section provides an overview of several
industries in the region that hire engineering technicians and examines how those industries define and value
technician-level occupations within their company culture.
Top Industries for Employment of Engineering Technicians – Survey Data
Five industries represented the majority of all survey responses. The Manufacturing industry provided the most
responses (n=45) followed by Professional, Scientific, and Technical Services (n=43), Wholesale Trade (n=26),
Construction (n=19), and Utilities (n=9). While manufacturing responses were distributed fairly evenly cross
subsectors of the industry, responses from the Professional, Scientific, and Technical Services industry came almost
entirely from Engineering Services and Drafting firms. A large number of responses from the Wholesale Trade
industry came from Electrical and Electronics Wholesalers, and nearly all responses from the Construction
industry came from HVAC firms. The remaining 8 responses were scattered across 5 other industry sectors, and
are heretofore referred to as “Other”. A breakdown of responses and overall employment of engineering
technicians (all positions) by region for each industry is provided below.
Table 1. Count of Regional Survey Responses and Technician Employment by Industry Sector
Manufacturing Prof, Scientific
& Technical Wholesale
Trade Construction Utilities Other TOTAL
Urban Region (n=94)
Responses 34 24 12 17 3 4 94
Technician Employment 193 129 86 63 18 17 506
Rural Region (n=56)
Responses 11 19 14 2 6 4 56
Technician Employment 46 68 52 9 25 18 218
Total Responses 45 43 26 19 9 8 150
Total Technician Employment
239 197 138 72 43 35 724
Urban Region – Delaware, Chester, New Castle, Salem, Cecil Counties
Rural Region – Kent (DE), Sussex, Kent (MD), Caroline, Dorchester, Queen Annes, Worcester, Wicomico
Defining Engineering Technology in the Region
Figure 2 on the next page demonstrates the career mobility and overlapping job responsibilities of engineering
technology and engineering. Despite the fact that the two disciplines have fundamental differences when it comes
to training and education, many engineers and engineering technology graduates may find their daily job tasks
very similar depending on the company and industry in which they work. Engineering education is primarily
calculus-based and emphasizes the theoretical aspects of engineering principles. A greater proportion of
curriculum content is dedicated to classroom lecture than lab exercises and practical application of engineering
concepts. Engineering technology, which is offered at both the associate’s and bachelor’s degree levels, focuses
heavily on applied engineering concepts for already existing technology and typically requires fewer math and
science courses. Similar to engineering, engineering technologists and technicians often specialize in specific
disciplines such as mechanical, electrical, etc. Technologists and technicians are often responsible for testing,
calibrating, troubleshooting, maintaining and repairing devices and systems. The American Society for Mechanical
Engineering finds that career mobility is more a function of the individual’s motivation, dedication, personal skills
and abilities then the degrees they earn.5
5 ASME, Pathways to Career in Mechanical Engineering Brochure, 2011

12
Figure 2. Career Mobility for Mechanical Engineering and Engineering Technology
ASME, Which Pathway Brochure, 2011
Survey respondents were asked an open-ended question related to how their company distinguishes engineering
technology from engineering. Sixty percent (60%), or 90 out of 149 total respondents, provided answers that reflect
accurate knowledge of the fundamental differences between engineering technology and engineering. However,
36% (51 respondents) indicated that they either make no distinction between the two within their company or
provided a skewed definition of how engineering technology is different than engineering. Figures 3 and 4 below
provide a visual of the words used by our respondents to describe the two disciplines with larger words
representing the descriptors that appeared most frequently.
Figure 3. Survey Response Descriptors Figure 4. Survey Response Descriptors for
for Engineering Technology General Engineering
The images above were created using the descriptors provided by the 60% of respondents that provided an
accurate description of both disciplines. Words such as “hands-on”, “application”, and “practical” were used to
describe engineering technologists and technicians while words like “design”, “theoretical”, and “licensed
professional” were used to describe general engineering. Of the 39 respondents that provided skewed or
misunderstood definitions of engineering technology, many defined engineering technologists and technicians as
having either less experience, no degree, or as workers whose role it is to support professional engineers. Several
respondents indicated that their company defines engineering technology as the positions reserved for workers
with little to no formal education or experience.
Reflective of our executive interviews, the survey revealed that some extremely small firms (less than 15 people)
make no distinction when it comes to defining engineering and engineering technology positions. They hire
interchangeably for both types of positions because, in most cases, the individual will be required to perform tasks

13
related to both disciplines while in the work setting. Smaller companies often have less capacity to hire technicians
that specialize in just one specific discipline. Job responsibilities of their workers are broader with less
specialization required.
Engineering and Engineering Technology Hiring Practices – Survey Data
One objective for this scan was to explore how frequently engineers and engineering technologists at the bachelor’s
prepared level are hired interchangeably for various positions. Table 2 below contains responses for three separate
hiring questions. Each question asked respondents to consider their hiring statistics from the past 5 years.
Table 2. Count of Survey Responses to Hiring Practices Questions
Within the past 5 years, has your company hired Professional Engineers to fill Engineering Technologist positions? (n=56)
YES NO
17 (30%) 39 (70%)
Within the past 5 years, has your company hired Engineering Technologists to fill Professional Engineering positions? (n=56)
YES NO
18 (32%) 38 (68%)
Within the past 5 years, has your company hired any Professional Engineers or Engineering Technologists to fill Engineering Technician positions? (n=150)
YES NO
51 (34%) 99 (66%)
The table above shows that, overall, the majority of respondents do not hire engineers and engineering
technologists interchangeably. However, approximately one-third (n=51) of respondents indicated that they have
hired professional engineers or engineering technologists to fill technician-level positions within the last 5
years. Our interviews with local employers support this finding. They point to the current job market as the
primary reason for this trend; a market where university graduates are struggling to find work as licensed
engineers and technologists. A related finding (though the questions did not receive as many total responses) is
that approximately one-third of companies surveyed have hired engineering technologists and professional
engineers interchangeably within the last five years.
Drivers of Employment Growth – Survey Data
Forty-six percent (46%) of firms (n=69 of 150) predict that the demand for both engineering technologists and
technicians will grow over the next five years. Several respondents identified more than one reason for projected
growth resulting in a total response count of n=96. These reasons, or “drivers”, were tallied and are listed below
from highest count to lowest count with the percentage of total responses provided:
Advancing Technology (n=33 or 34%) The rise in automated, computerized and security technology in
manufacturing and production will impact the demand for skilled technicians able to maintain and
troubleshoot these systems and devices.
Infrastructure Upgrades (n=16 or 17%) Aging buildings and equipment will spur demand for upgraded
infrastructure. In addition, as demand for alternative and renewable energy soars, infrastructure needed to
generate, transport, store, and distribute these technologies will require skilled technicians for installation,
maintenance, and repair.
Educational Affordability and Flexibility (n=14 or 15%) As more young people come to realize the
affordability of technical education and overall return on investment, respondents felt that enrollment in 2-
year programs will increase. Closely related, some firms felt that young people will recognize the benefits
of obtaining a technical degree right out of high school, finding gainful employment upon graduation, and

14
continuing their education towards their bachelor’s degree while working. Several firms noted that
technologists and technicians, as opposed to engineers, offer their company more flexibility because they
seem more willing to learn new technologies and concepts outside the realm of their specialization.
Economic Recovery (n=13 or 14%) Overall economic recovery will slowly restore the employment
numbers of technologists and technicians back to pre-recession levels.
Global Competitiveness (n=12 or 13%) The need for increased efficiency, innovation, and global
competitiveness will spur demand for technically skilled workers in all aspects of manufacturing and
research & development as manufacturing looks to re-shore back to the U.S.
Cost-effectiveness of Technologists/Technicians (n=8 or 8%) Eight respondents noted that demand may
increase due to the cost effectiveness of hiring technologists and technicians rather than engineers due to
the high salary engineers demand in this region.
Roughly 27% (n=40) of respondents predict demand for technologists and technicians to remain relatively flat over
the next 5 years, mostly due to the sluggish economic recovery. Overall, only 10 firms anticipate the demand for
technologists will decline and even fewer (3 firms) anticipate the demand for technicians will decline within the
next 5 years.
Occupational Overview
Current and Projected Employment by Region (Urban and Rural) – Survey Data
Among the technician level occupations examined for this study, drafting positions (particularly electrical and
electronics drafters) are the most highly concentrated position in the region with a national location quotient (LQ)
of 1.42. This high LQ value indicates that our region of study has a particularly high number of drafters when
compared to the rest of the nation. In contrast, the concentration of electromechanical engineering technicians is
significantly lower than that of the rest of the nation with a location quotient of just .44. 6 The regional survey asked
companies to consider a number of employment statistics in an attempt to identify the number of potential job
openings over the next 5 years for the occupations of interest. Tables 3 and 4 below and on the next page provide a
summary overview of survey responses for the 5-county urban region and the 8-county rural region within the
study geography. Annual and 5-YR openings were calculated based on current employment, projected growth, and
anticipated replacement needs due to retirements and turnover.
Table 3. Survey Employment Data – Urban Region (Delaware, Chester, New Castle, Salem, & Cecil Counties)
Current Employment
Projected Employment
in 5 years
5-year Projected Openings Total 5-yr Openings
incl. Growth
Avg. Annual Openings
over next 5 yrs.
Projected Job
Growth
Current Openings
Projected Retirements
Projected Turnover
Mechanical Engineering Technicians
119 152 33 14 27 6 80 16
Electrical, Electronic, Instrument Engineering Technicians
154 195 41 19 28 20 108 22
Electromechanical Engineering Technicians
68 87 19 6 5 11 41 8
Drafting/CAD Techs 165 193 28 27 23 16 94 19
SUBTOTAL 506 627 121
(24%) 66 83 (16%) 53 (10%) 323 65
6 EMSI Class of Worker QCEW Employees, 2013.4 Dataset – National location quotient is calculated by dividing the regional concentration of workers in an occupation by the national concentration. Any LQ above 1.0 is considered to be a higher than average concentration.

15
Current Employment
Projected Employment
in 5 years
5-year Projected Openings Total 5-yr Openings
incl. Growth
Avg. Annual Openings
over next 5 yrs.
Projected Job
Growth
Current Openings
Projected Retirements
Projected Turnover
Mechanical Engineering Technicians
40 45 5 7 12 2 26 5
Electrical, Electronic, Instrument Engineering Technicians
67 98 31 8 9 4 52 10
Electromechanical Engineering Technicians
8 12 4 1 3 1 9 2
Drafting/CAD Techs 103 118 15 15 11 20 61 12
SUBTOTAL 218 273 55 (25%) 31 35 (16%) 27 (12%) 148 30
TOTAL (both regions) 724 900 176
(24%) 97 118 (16%) 80 (11%) 471 94
Combined employment for all occupations in the 13-county region totals 724 jobs (known employment taken from
survey data). Seventy percent (70%) of technicians are employed in the urban region of the area examined. While
this region accounts for a majority of the total employment at 506 workers, it is expecting to experience relatively
the same retirement, turnover, and growth rates as the rural region, which employs roughly 30%, or 218
technicians. The survey data indicates that the region is projecting a 24% increase in employment over the next 5
years. Survey data revealed that although many engineering technicians may be reaching retirement age,
employers are only expecting roughly 16% of their workers to actually leave the workforce within the next five
years due to retirements. This indicates that workers eligible for retirement are expected to remain in the workplace
longer, possibly due to the current economic environment. Approximately 16%, or 118, of the technicians our
survey identified are anticipated to retire between now and 2019. Similarly, the anticipated turnover for
technician positions is relatively low at just 11%, or 80 positions. When added together, these numbers project a 5-
year replacement rate of approximately 27% (roughly 200 positions) and an annual replacement rate of 5.4%
(roughly 40 positions) across all disciplines of technicians throughout the region.
Given that the survey data represents only a small percentage of firms in the region that hire these occupations,
CIRWA was able to use the survey data to extrapolate estimates for many of the data points above in order to
provide a more comprehensive picture of current and projected workforce demographics. This extrapolated data
was also used to conduct the supply and demand gap analysis on page 19. CIRWA estimates that roughly 1,854
firms in the region have at least one of these engineering technician occupations on staff. Many firms have
more than one of these occupations on staff. This is a conservative estimate based on the survey’s qualifying
incidence rate (the percentage of firms in each industry that qualified to take the survey) and occupational
incidence rate (the percentage of qualified firms that hire each occupation). That being said, CIRWA estimates that
this survey data (n=150) is representative of approximately 8 percent of the total “universe of firms” (n=1,854).
Estimated current employment for the 13-county region could be as high as 7,713 technicians7. This is a
conservative, extrapolated estimate calculated by multiplying firms’ average current employment for each
occupation by the estimated universe of firms that hire that occupation. In addition, when examining survey
respondents’ average projected employment 5 years from now, the average can be multiplied by the estimated
universe of firms to determine the 5-year change (growth/decline). Using this formula, these occupations could
grow to roughly 9,675 jobs (1,962 jobs added) by 2019. This is a 5-year growth rate of approximately 25 percent.
7 See Appendix B for methodology of estimating occupational employment based on extrapolation of survey data

16
Position openings due to replacements were determined by multiplying firms’ adjusted 5-YR retirement and
turnover averages (taken from survey data) to the estimated universe of firms for each occupation. A summary of
extrapolations is provided below in Table 5.
Table 5. Extrapolated Estimates of Total Employment, Projected Change, and Openings
Estimated Universe of Firms
Current Employment
Projected Employment
in 5 years
5-year Projected Openings Total 5-yr Openings
incl. Growth
Annual Openings over next
5 yrs.
Projected Job
Growth
Projected Retirements
Projected Turnover
Mechanical Engineering Technicians
779 1650 1964 314 293 80 687 137
Electrical, Electronic, Instrument Engineering Technicians
927 2244 3075 831 209 144 1184 237
Electromechanical Engineering Technicians
315 724 1056 332 34 96 462 92
Drafting/CAD Techs 1279 3095 3579 484 237 299 1020 204
All Technicians 1854* 7713 9675 1962 (25%)
773 (8%) 619 (8%) 3353 671
* This is the number of firms in the region that have at least one of these occupations currently on staff. This number is NOT a sum of the
universe of firms by occupation since many firms have more than one type of technician on staff.
Educational Attainment Taken from Survey Data
The survey asked respondents to consider the education and training level of their current engineering technician
workforce. Figure 5 below demonstrates the distribution of educational attainment for each of the four occupations
examined. The vast majority of engineering technicians in the region have an associate’s degree or less. The only
occupation in which the number of workers without an associate’s degree outnumber those with a degree is
mechanical engineering technology, which was found to have the highest percentage of workers with less than an
associate’s degree of all of the disciplines studied.
Figure 5. Survey Data - Education Level of Engineering Technicians (n=252)
Companies were asked to indicate their minimum and preferred educational requirements and years of experience
for each of the engineering technician positions they currently employ. Of the 252 responses from 150 companies,
roughly 51% (123 responses) of engineering technician positions have a minimum educational requirement of a
high school diploma or less for employment as an engineering technician. However, when asked what their
42%
24%
36%
19%
33%
48%
47%
50%
13%
19%
9%
17%
11%
10%
8%
13%
Mechanical Engineering Technician
Electrical, Electronics, Instrumentation EngineeringTechnician
Electromechanical Engineering Technician
Drafting/CAD Technician
Less than Associate's Degree Associate's Degree Bachelor's Degree Unknown
17
preferred educational preparation is, 56% (141 responses) indicated that an associate’s degree is preferred.
Additionally, 37%, or 92 responses, indicated that they would prefer to have someone with a bachelor’s degree.
Regarding work experience, while 80% (67 responses) of respondents indicated a minimum requirement of 2 years
of experience or less, 41% (104 responses) prefer to have someone with at least 3-4 years of experience and 32% (81
responses) prefer that a job candidate have at least 5 or more years of experience.
Our executive interviews with employers support the findings above and reinforced the importance of strong
communication and math skills among young people exiting high school. These skills will enable students to move
through an associate’s degree program more quickly. When asked whether they believe that their technician-level
jobs are experiencing “degree creep”, meaning they are becoming so high-skilled that more companies may begin
to seek a bachelor’s degree, interviewees did not feel that these jobs will require a bachelor’s degree anytime in the
near future. However, they did feel that minimum educational requirements for many companies may soon shift
toward requiring an associate’s degree rather than a high school diploma. This shift is due to the integration of
advanced technology and the increased need for workers with strong communication and teamwork skills, which
are often gained through a postsecondary program.
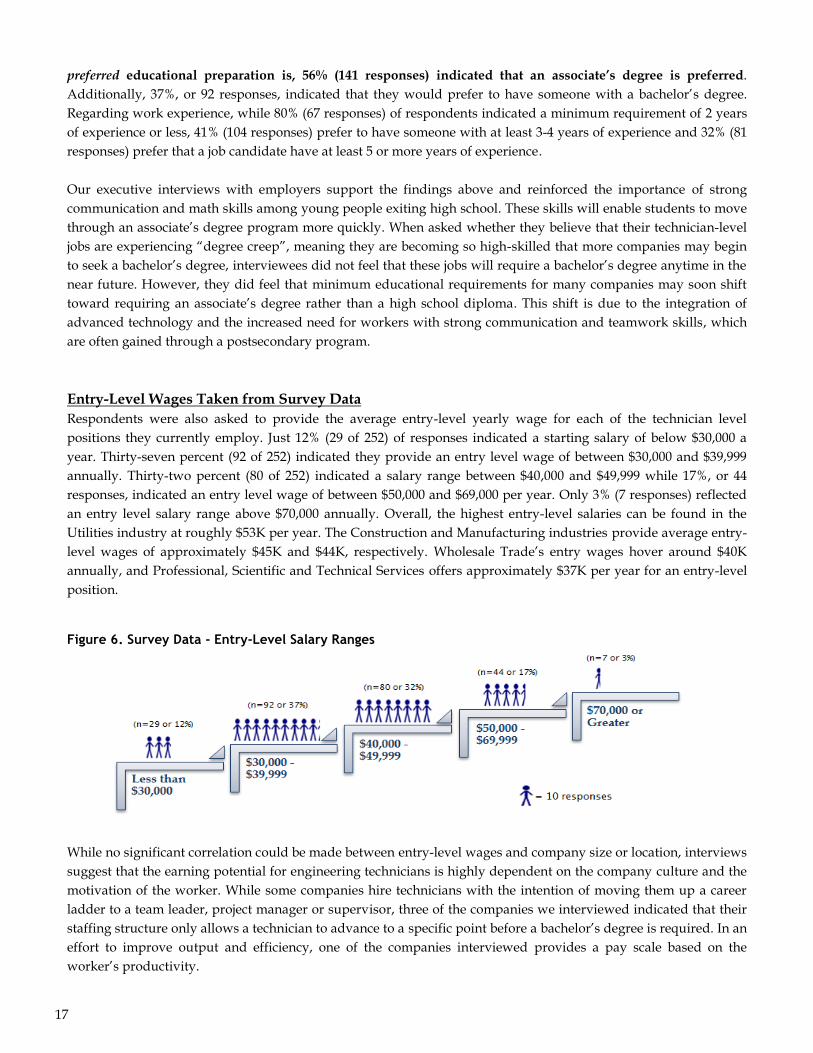
Entry-Level Wages Taken from Survey Data
Respondents were also asked to provide the average entry-level yearly wage for each of the technician level
positions they currently employ. Just 12% (29 of 252) of responses indicated a starting salary of below $30,000 a
year. Thirty-seven percent (92 of 252) indicated they provide an entry level wage of between $30,000 and $39,999
annually. Thirty-two percent (80 of 252) indicated a salary range between $40,000 and $49,999 while 17%, or 44
responses, indicated an entry level wage of between $50,000 and $69,000 per year. Only 3% (7 responses) reflected
an entry level salary range above $70,000 annually. Overall, the highest entry-level salaries can be found in the
Utilities industry at roughly $53K per year. The Construction and Manufacturing industries provide average entry-
level wages of approximately $45K and $44K, respectively. Wholesale Trade’s entry wages hover around $40K
annually, and Professional, Scientific and Technical Services offers approximately $37K per year for an entry-level
position.
Figure 6. Survey Data - Entry-Level Salary Ranges
While no significant correlation could be made between entry-level wages and company size or location, interviews
suggest that the earning potential for engineering technicians is highly dependent on the company culture and the
motivation of the worker. While some companies hire technicians with the intention of moving them up a career
ladder to a team leader, project manager or supervisor, three of the companies we interviewed indicated that their
staffing structure only allows a technician to advance to a specific point before a bachelor’s degree is required. In an
effort to improve output and efficiency, one of the companies interviewed provides a pay scale based on the
worker’s productivity.
18
Employer Skill Needs and Hiring Challenges
Nine out of ten employers surveyed indicated that they find it at
least “somewhat difficult” to find a highly-skilled job candidate to
fill their technician jobs. More than 50% of respondents find it
“difficult” or “very difficult” to find a skilled candidate. Roughly 8 out
of 10 employers of electromechanical technicians find it either “difficult”
or “extremely difficult” to find a skilled candidate for employment.
Adversely, only 4 out of 10 employers find it difficult to find skilled
drafters and/or CAD technicians. The top 3 items employers (n=223)
selected when asked to identify one or more of their biggest challenges
in finding a qualified applicant include:
Lack of position-related job skills (69% or 153)
Lack of minimum required work experience (65% or 145)
Lack of “soft skills” such as written and oral communication (59% or
132)
Employers were then asked to rank, by level of importance to the position requirements, several “soft” and
technical skills that cut across the different occupations. Given that technical skills vary for these occupations, the
question provided a variety of skills for employers to rank. Some skills were specific to that occupation and some
were universal to all 4 of the occupations being examined. Figure 8 below provides an overview of top skills that
are relevant to all occupations and that received a total of 252 responses. Figure 9 provides an overview of skills
that all firms, except for those responding for drafters or CAD technicians, were asked to rank.
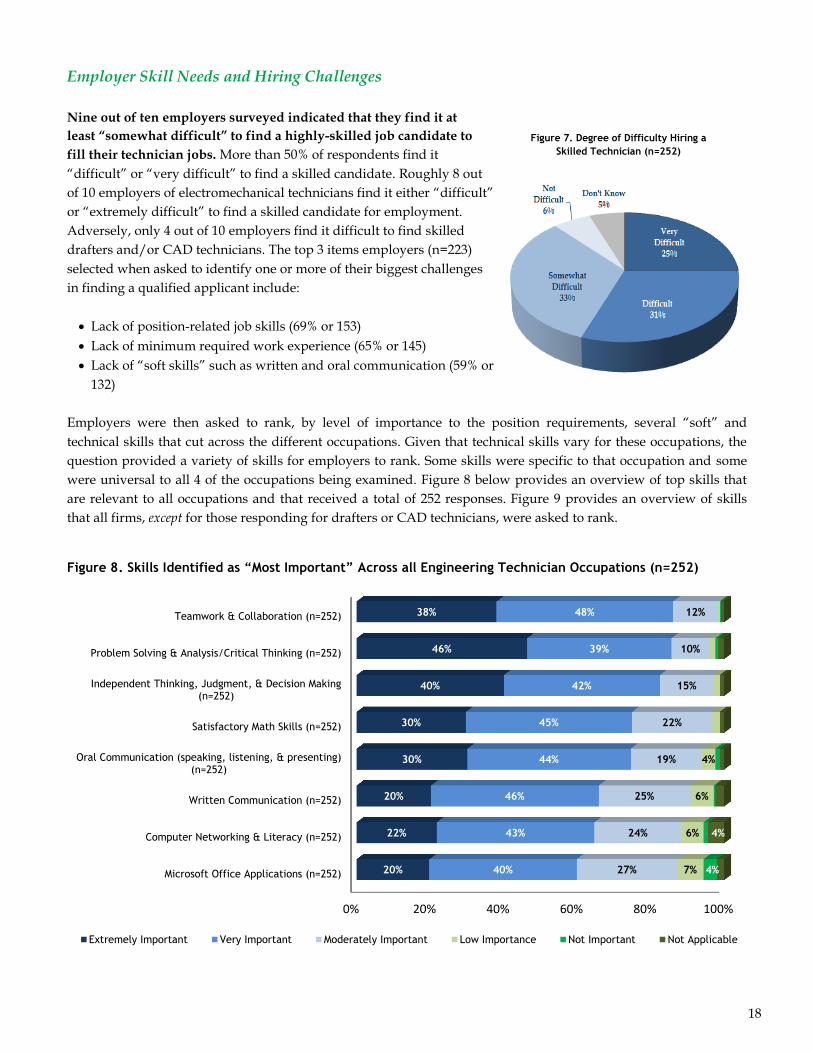
Figure 8. Skills Identified as “Most Important” Across all Engineering Technician Occupations (n=252)
0% 20% 40% 60% 80% 100%
Microsoft Office Applications (n=252)
Computer Networking & Literacy (n=252)
Written Communication (n=252)
Oral Communication (speaking, listening, & presenting)(n=252)
Satisfactory Math Skills (n=252)
Independent Thinking, Judgment, & Decision Making(n=252)
Problem Solving & Analysis/Critical Thinking (n=252)
Teamwork & Collaboration (n=252)
20%
22%
20%
30%
30%
40%
46%
38%
40%
43%
46%
44%
45%
42%
39%
48%
27%
24%
25%
19%
22%
15%
10%
12%
7%
6%
6%
4%
4%
4%
Extremely Important Very Important Moderately Important Low Importance Not Important Not Applicable
Figure 7. Degree of Difficulty Hiring a
Skilled Technician (n=252)
19
The skills in the table above are ranked from top to bottom according to the percentage of firms that identified the
skill as either “extremely” or “very important” to their positions. Four out of the top five skills are traditionally
considered soft skills. Teamwork & Collaboration received a combined 217 responses (86%) as being either
“extremely” or “very important”. Problem Solving & Analysis/Critical Thinking ranked very close behind with a
combined 216 responses. Independent Thinking, Judgment, and Decision Making, and Oral Communication also ranked
among the top five. Satisfactory Math Skills was considered the most important technical skill and was selected by
75% (189 responses) as either “extremely” or “very important”. Written Communication, Computer Networking &
Literacy and Microsoft Office Applications round out the top eight skills. These skills were identified by more than
60% of responding firms as being either “extremely” or “very important” to their positions.
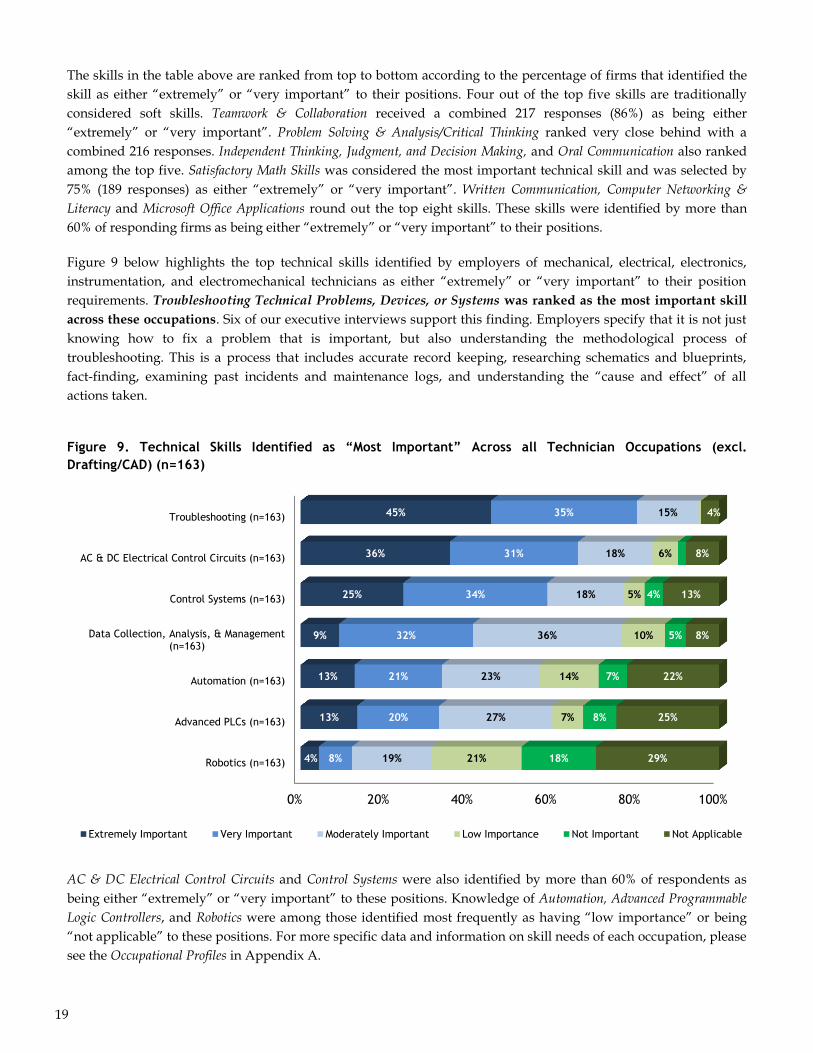
Figure 9 below highlights the top technical skills identified by employers of mechanical, electrical, electronics,
instrumentation, and electromechanical technicians as either “extremely” or “very important” to their position
requirements. Troubleshooting Technical Problems, Devices, or Systems was ranked as the most important skill
across these occupations. Six of our executive interviews support this finding. Employers specify that it is not just
knowing how to fix a problem that is important, but also understanding the methodological process of
troubleshooting. This is a process that includes accurate record keeping, researching schematics and blueprints,
fact-finding, examining past incidents and maintenance logs, and understanding the “cause and effect” of all
actions taken.
Figure 9. Technical Skills Identified as “Most Important” Across all Technician Occupations (excl.
Drafting/CAD) (n=163)
AC & DC Electrical Control Circuits and Control Systems were also identified by more than 60% of respondents as
being either “extremely” or “very important” to these positions. Knowledge of Automation, Advanced Programmable
Logic Controllers, and Robotics were among those identified most frequently as having “low importance” or being
“not applicable” to these positions. For more specific data and information on skill needs of each occupation, please
see the Occupational Profiles in Appendix A.
0% 20% 40% 60% 80% 100%
Robotics (n=163)
Advanced PLCs (n=163)
Automation (n=163)
Data Collection, Analysis, & Management(n=163)
Control Systems (n=163)
AC & DC Electrical Control Circuits (n=163)
Troubleshooting (n=163)
4%
13%
13%
9%
25%
36%
45%
8%
20%
21%
32%
34%
31%
35%
19%
27%
23%
36%
18%
18%
15%
21%
7%
14%
10%
5%
6%
18%
8%
7%
5%
4%
29%
25%
22%
8%
13%
8%
4%
Extremely Important Very Important Moderately Important Low Importance Not Important Not Applicable

20
Forty-two percent of firms (62 of 148) felt that the need for in-depth knowledge of computer systems,
particularly networking and programming, has been the biggest change to their technician positions over the
last 10 years. Closely related, 33% (49 firms) stated that modeling and design software programs such as AutoCAD,
CAM, BIM, Revit, SolidWorks, and Microstation are now a requirement for hire for many companies, which was
not the case 10 years ago. The increased need for customer service and communication skills and broader
interdisciplinary knowledge are also key changes mentioned by several respondents. Additional technical skills
mentioned most frequently as being the biggest change for these positions include: Troubleshooting, lean
manufacturing principles, energy efficiency, waste/stormwater management, and geographic information systems.
Supply/Demand Gap Analysis
In order to analyze the gap between the number of graduates regional educational institutions are producing and
the projected position openings, CIRWA pulled IPEDS (Integrated Postsecondary Education Data System) graduate
data for the following educational institutions: Delaware Technical Community College, Cecil Community College,
Chesapeake College, Delaware County Community College, Community College of Philadelphia, Penn Institute of
Technology, Salem Community College, and Wor-Wic Community College. Non-credit programs and programs
designated as “Pre-Engineering” or “Transfer” programs were not included in this analysis. Completions were
pulled according to CIP code rather than program name to accommodate programs that encompass the
engineering technology competencies of focus, but that may not be traditionally named. One example would be
manufacturing or industrial engineering technicians, which are similar to mechanical and electrical engineering
technicians and possess many of the same skills and abilities. Overall, only Delaware Technical Community
College, Chesapeake College, Delaware County Community College, Wor-Wic Community College, and Penn
Institute of Technology currently offer programs that fit our criteria for inclusion in this analysis. Graduate
numbers from the past three (3) years were pulled to determine a 3-YR average for each college’s programs.
Averages were then combined to determine the average number of graduates for the region. For a complete
breakdown by occupation for each school, please see Appendix A – Occupational Profiles.
Delaware Tech and the surrounding colleges could potentially produce roughly 685 engineering technician
graduates across these four disciplines between now and 2019. Delaware Tech produces roughly 53% (about 73 of
137) of the annual program graduates represented in Table 6 below. Please refer to Table 6 for a complete
overview of supply and demand projections for 2014 through 2019 based solely on survey data.
Table 6. IPEDS Regional Graduate Data versus Survey Data Projected Openings
Survey Sample Data for n=150
Projected Openings (n=150)
Average Regional Program Graduates
Supply/Demand Gap
Annual 5 -YR 3-YR Annual
Avg. 5-YR Annual 5-YR
Mechanical 21 106 27 135 +6 +29
Electrical, Electronics, Instrumentation 32 160 65 325 +33 +165
Electromechanical 10 50 4 20 -6 -30
Drafting/CAD 31 155 41 205 +10 +50
TOTAL 94 471 137 685 +43 +214

21
When compared to the survey’s projected openings data (taken from Tables 3 and 4), the IPEDS graduate data
shows that the region is over-producing a significant number of graduates each year. This annual surplus results in
roughly 214 more graduates than position openings over the next 5 years. However, remember that while
graduate data is relatively inclusive, the survey data captures only a small portion (roughly 8%) of employers in
the region and is not representative of total position openings throughout the region.
Table 7 below provides an overview of regional program graduates based on IPEDS data compared to CIRWA’s
extrapolated estimates of annual and 5-YR position openings for all technician occupations within the region.
Position openings due to growth were estimated by multiplying survey respondents’ adjusted average projected
employment in 5 years (taken from survey data at the occupational level) to the estimated universe of firms that
employ that occupation and subtracting current employment estimates to identify the change. Position openings
due to replacements were determined by multiplying firms’ adjusted 5-YR retirement and turnover averages (taken
from survey data) to the estimated universe of firms for each occupation. For more detail on extrapolation of
survey data to determine total employment and position openings, please see the Methodology section provided in
Appendix B. Supply and demand analyses for individual occupations are provided in the Occupational Profiles in
Appendix A.
Table 7. IPEDS Regional Graduate Data versus Extrapolated Estimates for Regional Position Openings
Extrapolated Estimates for
n=1854 (Universe of Firms)
Position Openings due to Growth
Position Openings due to
Replacements
Total Position Openings
Average Regional Program Graduates
Supply/Demand Gap
Annual 5-YR Total
Annual 5-YR Total
Annual 5-YR Total
3-YR Annual
Avg.
5 –YR Total
Annual Deficit
5-YR Deficit
Mechanical 63 293 75 373 137 687 27 135 (110) (552)
Electrical, Electronics, Instrumentation
166 831 71 353 237 1184 65 325 (172) (859)
Electromechanical 66 332 26 130 92 462 4 20 (88) (422)
Drafting/CAD 97 484 107 536 204 1020 41 205 (163) (815)
TOTAL 392 1962 278 1392 671 3353 137 685 (533) (2648)
Please note: While the graduates-to-position openings gap from may seem large, it is likely that the job growth
average on which “Openings due to Growth” extrapolations were based is slightly inflated due to the uncertainty
of a 5-year projection versus a 1 or 2-year projection of employment and the inherent optimistic bias of self-
reported data provided by firms. In addition, large firms (greater than 100 employees) represented roughly 7
percent of our adjusted database of firms; however large firms represented roughly 10 percent of survey responses.
This may have slightly skewed the average growth rate toward the high end since a greater percentage of large
firms responded than was represented in the database. It is also important to keep in mind that a large percentage
of these workers do not currently possess a formal degree and there are no industry standards requiring that job
candidates have or obtain one to hold these positions. Finally, completion data does not include graduates of any
programs that do not receive federal financial aid since those programs do not report to IPEDS. Regardless of the
possibility of slightly inflated growth rates, if we examine supply versus demand based solely on replacement
data, programs are still not producing enough graduates to meet the replacement needs of these occupations
over the next 5 years.
22
Delaware Tech Response and Challenge
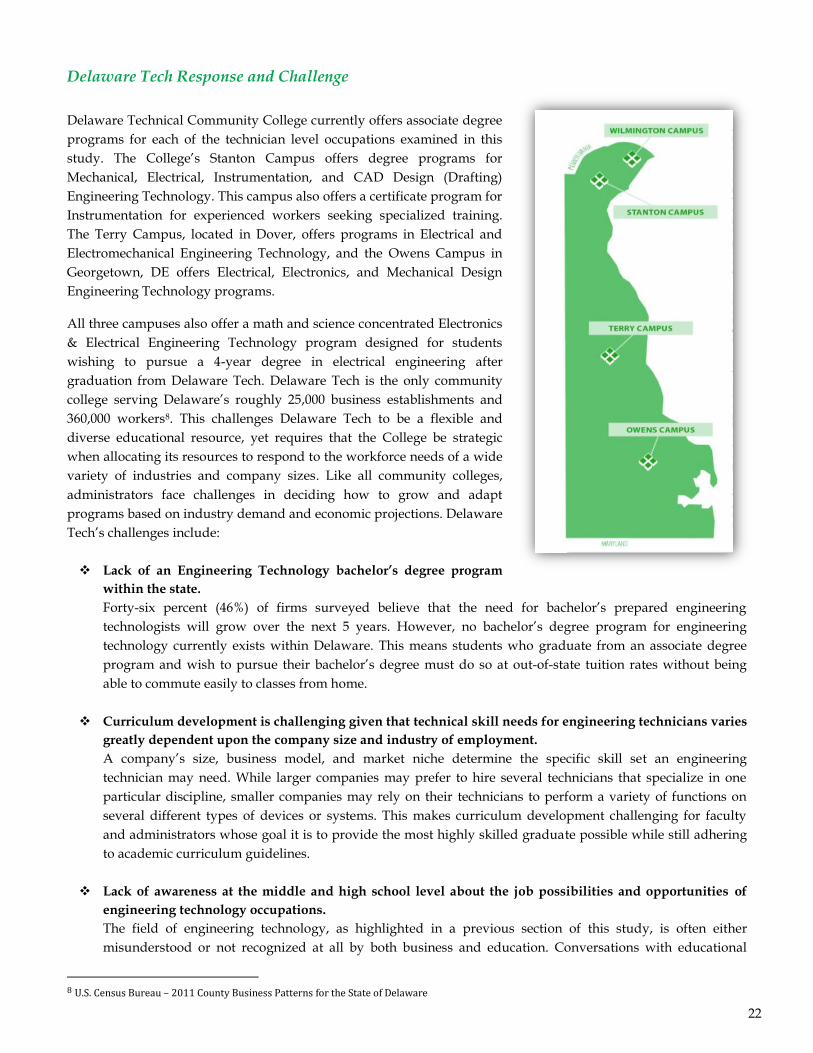
Delaware Technical Community College currently offers associate degree
programs for each of the technician level occupations examined in this
study. The College’s Stanton Campus offers degree programs for
Mechanical, Electrical, Instrumentation, and CAD Design (Drafting)
Engineering Technology. This campus also offers a certificate program for
Instrumentation for experienced workers seeking specialized training.
The Terry Campus, located in Dover, offers programs in Electrical and
Electromechanical Engineering Technology, and the Owens Campus in
Georgetown, DE offers Electrical, Electronics, and Mechanical Design
Engineering Technology programs.
All three campuses also offer a math and science concentrated Electronics
& Electrical Engineering Technology program designed for students
wishing to pursue a 4-year degree in electrical engineering after
graduation from Delaware Tech. Delaware Tech is the only community
college serving Delaware’s roughly 25,000 business establishments and
360,000 workers8. This challenges Delaware Tech to be a flexible and
diverse educational resource, yet requires that the College be strategic
when allocating its resources to respond to the workforce needs of a wide
variety of industries and company sizes. Like all community colleges,
administrators face challenges in deciding how to grow and adapt
programs based on industry demand and economic projections. Delaware
Tech’s challenges include:
Lack of an Engineering Technology bachelor’s degree program
within the state.
Forty-six percent (46%) of firms surveyed believe that the need for bachelor’s prepared engineering
technologists will grow over the next 5 years. However, no bachelor’s degree program for engineering
technology currently exists within Delaware. This means students who graduate from an associate degree
program and wish to pursue their bachelor’s degree must do so at out-of-state tuition rates without being
able to commute easily to classes from home.
Curriculum development is challenging given that technical skill needs for engineering technicians varies
greatly dependent upon the company size and industry of employment.
A company’s size, business model, and market niche determine the specific skill set an engineering
technician may need. While larger companies may prefer to hire several technicians that specialize in one
particular discipline, smaller companies may rely on their technicians to perform a variety of functions on
several different types of devices or systems. This makes curriculum development challenging for faculty
and administrators whose goal it is to provide the most highly skilled graduate possible while still adhering
to academic curriculum guidelines.
Lack of awareness at the middle and high school level about the job possibilities and opportunities of
engineering technology occupations.
The field of engineering technology, as highlighted in a previous section of this study, is often either
misunderstood or not recognized at all by both business and education. Conversations with educational
8 U.S. Census Bureau – 2011 County Business Patterns for the State of Delaware

23
administrators have led CIRWA to believe that while high school students are exploring their options for
entry into a STEM occupation, teachers and guidance counselors lack a clear understanding of the job
opportunities and educational pathways for engineering technology. As a result, students interested in
engineering-related concepts and principles are usually pointed in the direction of general engineering rather
than engineering technology.
Need for a unified vision and marketing strategy for engineering technology programs.
Delaware Tech currently offers more than 15 different engineering technology programs focused on
disciplines such as environmental, computer networking, fire protection, surveying & geomatics, and
architecture, just to name a few. At their core, these programs all focus on the application of engineering
principles and theories to existing technology or infrastructure. However, when combined, enrollment in all
these programs only accounts for about 8% of overall College enrollment despite the obvious niche Delaware
Tech has carved out in educating and placing engineering technicians within the region. Although there have
been efforts recently to promote these programs as a unit of high-skilled, in demand occupations, there is a
feeling that more could be done to expose both high school and non-traditional students to all of the options
available to them within engineering technology.
While there are several challenges listed above, it is important to remember that these challenges create
opportunities for action based on the data gathered for this labor market scan. The next section will outline some of
the key conclusions and findings from this data and provide recommendations for Delaware Tech and other
educational providers to consider when assessing the region’s engineering technology programs.
Conclusion and Recommendations
Considering the data compiled from the regional survey and already existing sources, and taking into account the
feedback from multiple local employers, the conclusions and recommendations outlined below are provided as a
means of guiding Delaware Tech, fellow educational institutions, and local businesses in their decision-making
processes. The conclusions below are prioritized based on their level of importance to the current economy and the
degree to which Delaware Tech and other educational institutions can influence the finding through program
growth and improvement.
Conclusions
1. The region is not producing enough technicians to fill the replacement or growth need projected through
2019. Employment projections can be volatile in times of economy instability, but the one certainty is that the
population of baby-boomers reaching retirement age is a concern for many local employers. As workers with
35+ years of experience begin to exit the workforce, replacing their skills, knowledge, and abilities is a daunting
challenge. Employers are faced with trying to find qualified candidates that have hands-on knowledge and
experience balanced with strong computer and technological skills. Local employers’ difficulty will only
increase as the supply of qualified candidates lags behind the projected need for replacements workers based
on regional IPEDS completion data for the region.

24
2. There is recognized value in the skills and abilities of associate degree-prepared engineering technicians,
but not enough awareness of Delaware Tech’s program offerings. Delaware’s small size and close proximity
to several other states makes it a feeder state for workers looking to find employment across state lines. While
nearly all firms interviewed are highly supportive of the college and its graduates, several Delaware-based
firms were unaware of the broad range of engineering technology options the college offers across all four
campuses. Several of the employers we spoke with in interviews felt that the College should put more focus on
marketing the creation of recently developed programs along with emphasizing the skills and abilities of
graduates to a broader audience of employers both inside and outside the state.
3. Computer technology is rapidly advancing the skill requirements of these jobs. The advancement of
automation, computer software, programming, and networking has greatly impacted industries that hire
engineering technicians. Technicians with strong computer skills are becoming a “must have” for local firms as
production schedules and processes become fully reliant on computer-controlled equipment, devices, and data.
This is a challenge for the existing workforce more so than the incoming workforce since younger workers
were raised with computer technology. Sixty-two percent (62%) of survey respondents feel that computer
technology is the most significant change to these jobs over the last 10 years and our interviews confirm that
this is a need that will only be compounded by increasing global competitiveness.
4. Troubleshooting, particularly the methodological process of troubleshooting, is a critical skill need among
engineering technician employers in the region. Eighty-three percent (83%) of survey respondents (n=163)
chose troubleshooting as either “extremely” or “very important” to their engineering technician positions.
Interviews indicate that while troubleshooting is an extremely important skill, it is a clear understanding and
familiarity with the methodology of troubleshooting that workers must possess, not just the ability to solve the
problem. Reviewing blueprints and schematics, researching previous incidents, thorough note-taking and
record keeping, and identifying root cause and effect are all fundamental steps of the troubleshooting process
that workers should have knowledge of and experience with prior to hire.
5. Soft skills (particularly teamwork and collaboration, problem solving, and communication) are a high skill
need throughout the region across all industries. Soft skills continue to be a challenge for a majority of the
survey sample (59%) as well as those firms interviewed one-on-one. Four of the top five most important skills
for technicians are classified as soft skills and interviews indicate that as technology advances and the range of
social media outlets expands, the younger generation has become increasingly difficult to engage in face-to-face
communication while in the workplace. Workers with the ability to draft comprehensive, thorough reports,
develop and present projects within a team settings, and problem solve as part of a collaborative decision-
making process are greatly needed, but extremely challenging to find.
6. A majority of the industry acknowledges the technical and conceptual differences between engineering and
engineering technology. However, hiring practices and preferences are interchangeable dependent on the
company. Roughly 30% of all survey respondents indicated that they hire engineers and engineering
technologists interchangeably or they hire engineers and technologists to fill technician-level positions. This
indicates that the highly dynamic job market and the preferences of the company greatly impact hiring
decisions. Our interviews revealed that while larger firms may have the ability to hire several technicians that
specialize in one specific discipline, smaller firms may search for technicians that possess a broader, more
interdisciplinary skill set. In a job market where 4-year engineering graduates are unable to find work and a
lack of industry standards for hiring of engineering technicians, employers are free to select new hires from an
extremely wide net of possible candidates. The challenge of securing a job is heightened for associate degree
graduates when they are competing against graduates of 4-year universities or against candidates that may not
possess a degree but have several years of experience.

25
Recommendations
The recommendations below are listed so as to correspond to the conclusions listed above and can be generalized
into two broad objectives:
Closing the Gap in Projected Demand; and
Improving Engineering Technology Programs to Better Meet Employer Skill Needs.
Recommendations #1 and #2 aim to help the College increase enrollment in engineering technology programs and
raise awareness of the educational and career pipeline opportunities available in the field of engineering
technology. Recommendations #3, #4, and #5 seek to help Delaware Tech improve current educational
programming so as to better meet the skill needs of local employers and ensure that graduates are entering the
workforce ready and able to succeed in today’s competitive job market.
1. Promote involvement and partnerships with K-12 and other related organizations in an effort to increase
teachers’, counselors’, parents’, and middle and high school students’ awareness of engineering technology
options available to them. Addressing a shortage of workers to meet demand begins with targeted efforts to
boost awareness, interest, and enrollment in these programs. These efforts can be bolstered by developing
statewide and regional strategies that engage not only K-12 education, but also organizations such as the
Delaware STEM Council, trade associations, and other business and economic development agencies. Several
survey respondents indicated that one of the drivers for increased technician employment will be greater
recognition of the affordability and return on investment of 2-year degrees. The College would be well-served
to emphasize these aspects to individuals looking to enter into a STEM occupation or who are currently in the
process of choosing a career path.
2. Explore strategies and opportunities for a more targeted and cohesive marketing strategy for engineering
technology programs based on the success of the College’s allied health department. The engineering
technology programs at Delaware Tech resemble, in number and variety, the selection of program offerings in
the College’s allied health department. However, the engineering technology programs have yet to experience
sustained momentum when it comes to enrollment, graduation, and placement. It is because of the College’s
reputation for its successful allied health programs that enrollment, graduation, and placement is consistently
strong in this department. While the various disciplines of engineering technology are significantly different,
the core principles of these fields coincide. Developing a more targeted and cohesive marketing strategy could
create an excellent opportunity for the college to highlight its niche offerings such as electromechanical,
instrumentation, and surveying/geomatics to wider array of employers that are currently hiring graduates
from more well-known programs, but are unaware of the broad range of programs available collegewide.
3. Consider adopting a cooperative workplace education experience as a requirement for graduation in the
engineering technology programs. Many interviewees were surprised that this is not already a requirement
for Delaware Tech graduates given that many employers are moving away from hiring graduates without
relevant experience. This requirement would help Delaware Tech accomplish the following:
a. Expand the College’s network of companies that hire program graduates;
b. Expose a greater number of companies to the variety of programs offered at the college;
c. Demonstrate the skills and abilities of Delaware Tech program graduates over other hiring options
available to companies;
d. Provide students with relevant, real-life workplace experiences and situations that will enable them to
be more competitive and attractive to local employers upon graduation; and
26
e. Open students up to the possibility of securing employment prior to graduation which may, in effect,
provide increased incentive to complete the program and improve graduation and placements rates for
the College.
4. Consider expanding engineering technology programs’ focus on troubleshooting methodology and
computer networking and programming competencies to better meet the skill needs of employers.
Programs may be well-served to integrate more exercises that focus on the troubleshooting process and the
steps students should consider when approaching a maintenance or repair problem out in the field. In
addition, options for computer programming and networking courses that expose students to software they
may see in the field could be explored for students interested in improving or expanding their current
knowledge base. Given that many employers indicated the importance of teamwork and collaborative
decision-making in the workplace, programs may want to consider offering these opportunities in the context
of teambuilding and cooperative learning. Emphasizing the importance of oral and written communication in
the context of a workplace setting and common workplace practices is also a key component to addressing the
fundamental soft skill needs of employers within the region.
5. Further explore the data from the regional survey to determine significant outcomes related to 4-year
engineering technologists. Further exploration of this data will help determine the need for a 2-year pre-
engineering technology program at Delaware Tech. In addition, it will guide the College’s efforts to articulate
its 2-year programs to relevant bachelor’s degree programs in engineering and engineering technology.

27

28
Appendix A – Occupational Profiles
A-1. Mechanical Engineering Technicians (SOC 17-3027)
Occupational Definition
Mechanical engineering technicians apply theory and principles of mechanical engineering to modify, develop,
test, or calibrate machinery and equipment. They may help mechanical engineers design, develop, test, and
manufacture industrial machinery, consumer products, and other equipment. They may make sketches and rough
layouts, record and analyze data, make calculations and estimates, and report their findings.9
Sample Job Titles
Mechanical Designer, R&D Technician, Engineering Lab Technician, Equipment Engineer, Process Technician, or
Engineering Technical Analyst, Industrial Engineering Technician
Skill Demand based on Survey Data
Survey respondents for were asked to rate the following
technical skills by degree of importance to their
company’s mechanical engineering technician positions.
The figure to the right illustrates the skills most
frequently selected as “Extremely Important” or “Very
Important” on a 5-point scale with an option for “Not
applicable”. Larger circles reflect higher response
counts. Of the 63 companies that responded to this
question, 47 participants chose “troubleshooting” as an
“Extremely Important” or “Very Important” skills for
their employees to have as a Mechanical Engineering
Technician. Other important skills include computer
applications and networking, control systems, and AC
& DC control circuits.
Supply and Demand Analysis based on Survey Data
Tables A–1.1 and 1.2 provide data on regional program completions for Mechanical Engineering Technicians. A 3-
year average was calculated by pulling program (CIP CODE) completion numbers from the IPEDS database for
2010, 2011, and 2012 for all schools within the region that offer these programs and report completions to IPEDS.
These annual completions were added together to produce a total annual completion number for the programs.
Table A-1.1 Regional Annual Program Completions (3-YR Avg.)
Regional Educational Programs
CIP Codes & Descriptions
Delaware Technical Community College
Delaware County Community College
Penn Institute of Technology
15.0805 – Mechanical Engineering/Technology/Technician
11 5 -
15.0899 – Mechanical Engineering Related Technologies/Technicians
- - 11
9 Bureau of Labor Statistics – Occupational Outlook Handbook, 2013
Troubleshooting
n=47
Computer
Applications &
Networking
n=39
Control
Systems
n=30
AC & DC
Control
Circuits
n=28
Data
Collection,
Analysis, and
Management
n=23
Automation
n=18 Advanced
PLCs
n=15
Robotics
n=4

29
Program completions were then weighed against the projected openings data taken from survey data. The data
reflects a 5-year surplus of 29 technicians or about six (6) more workers per year than there are position openings.
However, the demand data taken from the survey is representative of only a small percentage of regional
employers and possible position openings meaning that this surplus could potentially be a gap if complete 5-year
demand data for the region were known for mechanical engineering technicians. While EMSI projection data
provided in Table A–1.4 shows relatively little job growth through 2018, our survey data projects a much stronger
growth rate for these jobs at 25% change through 2019.
Table A-1.2 Position Openings (SURVEY DATA) versus Regional Completions (Mechanical)
Employment Change Position Openings Degree Completions Supply/Demand
Surplus
Current Employment
Employment in 5 Years
5-YR Annual 5-YR Annual 5-YR Annual 5-YR Annual
159 197 38 (25%) 8 (5%) 106 21 135 27 29 6
Table A-1.3 below provides an overview of extrapolated estimates for mechanical engineering technology
occupations throughout the 13-county region. These estimates are based on rates and percentages taken from
survey data at the occupational level. Outliers were eliminated to determine averages, but the sum of all outliers
was added to final totals given that this data is known. For further detail on the methodology of extrapolating these
estimates, please see the Methodology section in Appendix B.
Table A–1.3 Extrapolated Employment Estimates and Projections versus Supply (Mechanical)
Position Openings Supply/Demand Gap
Current Employment
Employment in 5 Years
5-YR Growth
5-YR Retirements
5-YR Turnover
Total 5-YR Openings
5-YR Completions
5-YR Shortage
Annual Shortage
1650 1964 314
(19%) 293 (17.7%) 80 (4.8%) 687 135 (552) (110)
Comparing the extrapolated estimates to the average annual completions reveals that the region could potentially
be facing a shortage of approximately 110 workers annually. However, it is important to remember that a large
percentage of firms (42%) currently employ mechanical technicians without an associate’s degree. This possible
shortage could force employers to continue to hire workers without a formal degree for the foreseeable future. In
addition, growth projections may be slightly inflated due to inherent bias of self-reported data.
Table A-1.4 EMSI Employment Data for Mechanical Engineering Technicians
Description 2013 Jobs 2018 Jobs 5-Year Change Median Hourly
Earnings 2013 National
Location Quotient
Industrial Engineering Technicians 432 449 17 $28.00 0.83
Mechanical Engineering Technicians 307 301 (6) $25.04 0.86
Total 739 751 12 $26.76
EMSI 2013.4 Class of Worker – QCEW Employees

30
A-2. Electrical & Electronics, and Instrumentation Engineering Technicians (SOC 17-3023)
Occupational Definition
Electrical engineering technicians test or modify development or operational machinery or electrical control
equipment and circuitry in industrial or commercial plants or laboratories. Electronics engineering technicians
apply principles and theories of electronics, electrical circuitry, mathematics and physics to lay out, build, test,
troubleshoot, and modify developmental and production electronic components, parts, equipment, and systems
such as computers, control instrumentation, and machine tool numerical controls. Instrumentation engineering
technicians specialize in electrical or electronic instrumentation systems with a focus on the design, installation,
calibration, and maintenance of digital and pneumatic equipment, and control systems.10
Sample Job Titles
Electrical or Electronics Technician, Instrumentation & Control (I&C) Technician, Test Technician, Relay Tester,
Instrument Technician, Results Technician, Equipment Assembler, Equipment Installer/Repairer.
Skill Demand based on Survey Data
Survey respondents for were asked to rate
several technical skills by degree of importance
to their company’s electrical, electronics, and/or
instrumentation engineering technician
positions. The figure to the right illustrates the
skills most frequently selected as “Extremely
Important” or “Very Important” on a 5-point
scale with an option for “Not applicable”. Larger
circles reflect higher response counts. Of the 75
companies that responded to this question, 63
participants chose “troubleshooting” as an
“Extremely Important” or “Very Important” skill
for their employees to have as electrical,
electronic, or instrumentation technicians. Other
important skills include AC & DC control
circuits, installation and calibration of electrical
and electronic instruments, computer
applications and networking, and control
systems.
Supply and Demand Analysis based on Survey Data
Tables A–2.1 and 2.2 provide data on regional program completions for electrical, electronics, and instrumentation
engineering technicians. A 3-year average was calculated by pulling program (CIP CODE) completion numbers
from the IPEDS database for 2010, 2011, and 2012 for all technical schools within the region that offer these
programs and report completions to IPEDS. Annual completions were added together to produce a total annual
completion number for region. That number was then weighed against the projected openings taken from survey
data. Worth noting is that while three other schools in the region offer programs for electrical and electronics
engineering technology, Delaware Tech is the only community college in the region to offer an associate degree
10 Bureau of Labor Statistics – Occupational Outlook Handbook, 2013
Troubleshooting
n=63 AC & DC
Electrical Control
Circuits
n=61
Installation &
Calibration of
Electrical and
Electronic
Instruments
n=50
Computer
Applications &
Networking
n=49
Control
Systems
n=48
Data
Collection,
Analysis &
Management
n=33
Component &
Circuit Level
Maintenance &
Repair
n=43
Advanced
PLCs
n=27
Robotics
n=10
Automation
n=26
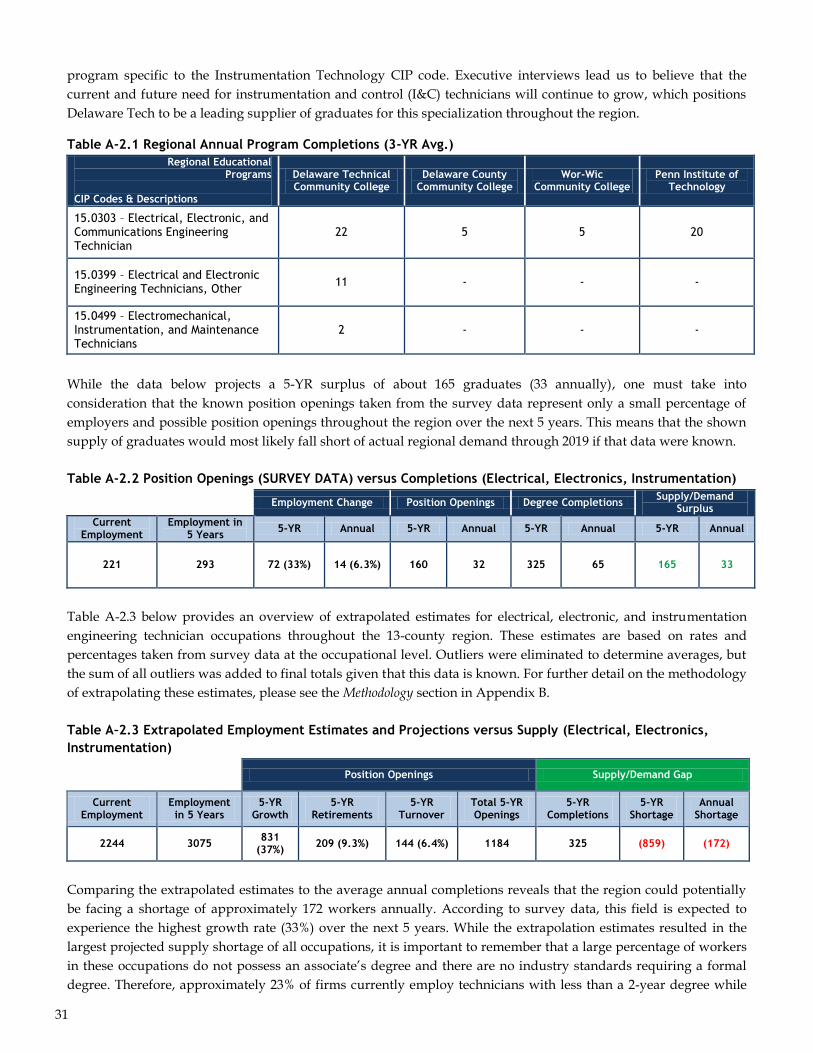
31
program specific to the Instrumentation Technology CIP code. Executive interviews lead us to believe that the
current and future need for instrumentation and control (I&C) technicians will continue to grow, which positions
Delaware Tech to be a leading supplier of graduates for this specialization throughout the region.
Table A-2.1 Regional Annual Program Completions (3-YR Avg.)
Regional Educational Programs
CIP Codes & Descriptions
Delaware Technical Community College
Delaware County Community College
Wor-Wic Community College
Penn Institute of Technology
15.0303 – Electrical, Electronic, and Communications Engineering Technician
22 5 5 20
15.0399 – Electrical and Electronic Engineering Technicians, Other
11 - - -
15.0499 – Electromechanical, Instrumentation, and Maintenance Technicians
2 - - -
While the data below projects a 5-YR surplus of about 165 graduates (33 annually), one must take into
consideration that the known position openings taken from the survey data represent only a small percentage of
employers and possible position openings throughout the region over the next 5 years. This means that the shown
supply of graduates would most likely fall short of actual regional demand through 2019 if that data were known.
Table A-2.2 Position Openings (SURVEY DATA) versus Completions (Electrical, Electronics, Instrumentation)
Employment Change Position Openings Degree Completions Supply/Demand
Surplus
Current Employment
Employment in 5 Years
5-YR Annual 5-YR Annual 5-YR Annual 5-YR Annual
221 293 72 (33%) 14 (6.3%) 160 32 325 65 165 33
Table A-2.3 below provides an overview of extrapolated estimates for electrical, electronic, and instrumentation
engineering technician occupations throughout the 13-county region. These estimates are based on rates and
percentages taken from survey data at the occupational level. Outliers were eliminated to determine averages, but
the sum of all outliers was added to final totals given that this data is known. For further detail on the methodology
of extrapolating these estimates, please see the Methodology section in Appendix B.
Table A–2.3 Extrapolated Employment Estimates and Projections versus Supply (Electrical, Electronics,
Instrumentation)
Position Openings Supply/Demand Gap
Current Employment
Employment in 5 Years
5-YR Growth
5-YR Retirements
5-YR Turnover
Total 5-YR Openings
5-YR Completions
5-YR Shortage
Annual Shortage
2244 3075 831
(37%) 209 (9.3%) 144 (6.4%) 1184 325 (859) (172)
Comparing the extrapolated estimates to the average annual completions reveals that the region could potentially
be facing a shortage of approximately 172 workers annually. According to survey data, this field is expected to
experience the highest growth rate (33%) over the next 5 years. While the extrapolation estimates resulted in the
largest projected supply shortage of all occupations, it is important to remember that a large percentage of workers
in these occupations do not possess an associate’s degree and there are no industry standards requiring a formal
degree. Therefore, approximately 23% of firms currently employ technicians with less than a 2-year degree while
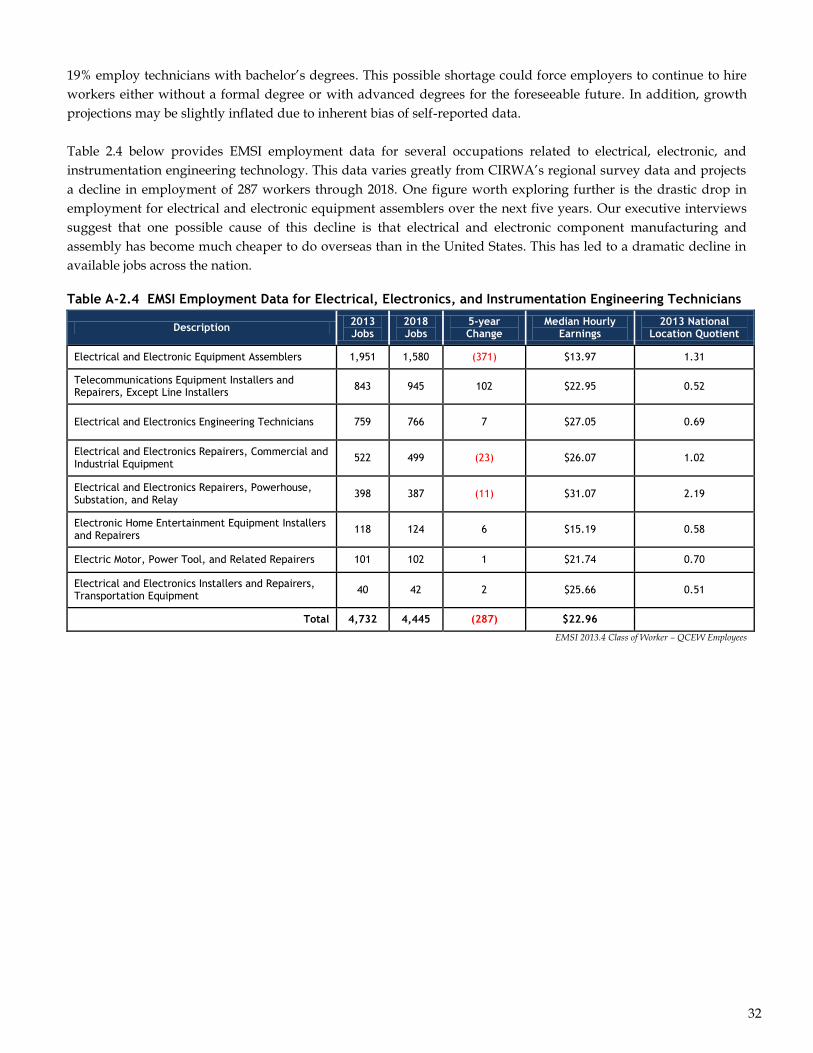
32
19% employ technicians with bachelor’s degrees. This possible shortage could force employers to continue to hire
workers either without a formal degree or with advanced degrees for the foreseeable future. In addition, growth
projections may be slightly inflated due to inherent bias of self-reported data.
Table 2.4 below provides EMSI employment data for several occupations related to electrical, electronic, and
instrumentation engineering technology. This data varies greatly from CIRWA’s regional survey data and projects
a decline in employment of 287 workers through 2018. One figure worth exploring further is the drastic drop in
employment for electrical and electronic equipment assemblers over the next five years. Our executive interviews
suggest that one possible cause of this decline is that electrical and electronic component manufacturing and
assembly has become much cheaper to do overseas than in the United States. This has led to a dramatic decline in
available jobs across the nation.
Table A-2.4 EMSI Employment Data for Electrical, Electronics, and Instrumentation Engineering Technicians
Description 2013 Jobs
2018 Jobs
5-year Change
Median Hourly Earnings
2013 National Location Quotient
Electrical and Electronic Equipment Assemblers 1,951 1,580 (371) $13.97 1.31
Telecommunications Equipment Installers and Repairers, Except Line Installers
843 945 102 $22.95 0.52
Electrical and Electronics Engineering Technicians 759 766 7 $27.05 0.69
Electrical and Electronics Repairers, Commercial and Industrial Equipment
522 499 (23) $26.07 1.02
Electrical and Electronics Repairers, Powerhouse, Substation, and Relay
398 387 (11) $31.07 2.19
Electronic Home Entertainment Equipment Installers and Repairers
118 124 6 $15.19 0.58
Electric Motor, Power Tool, and Related Repairers 101 102 1 $21.74 0.70
Electrical and Electronics Installers and Repairers, Transportation Equipment
40 42 2 $25.66 0.51
Total 4,732 4,445 (287) $22.96
EMSI 2013.4 Class of Worker – QCEW Employees

33
A-3. Electromechanical Engineering Technicians (SOC 17-3024)
Occupational Definition
Electro-mechanical technicians combine knowledge of mechanical technology with knowledge of electrical and
electronic circuits. They install, troubleshoot, repair, and upgrade electronic and computer-controlled mechanical
systems, such as robotic assembly machines.11
Sample Job Titles
E/M Technician, Test Technician, Electrical Technician, Electromechanical Equipment Assemblers, Mechanical
Technician, Product Test Specialist, Electronic Instrument Technician, Maintenance Technician, or Lab Technician.
Skill Demand based on Survey Data
Survey respondents for were asked to rate the following
technical skills by degree of importance to their company’s
electromechanical engineering technician positions. The
figure to the right illustrates the skills most frequently
selected as “Extremely Important” or “Very Important” on
a 5-point scale with an option for “Not applicable”. Larger
circles reflect higher response counts. Of the 25 companies
that responded to this question, 19 participants chose
“Troubleshooting” as an “Extremely Important” or “Very
Important” skills for their employees to have as an
electromechanical engineering technician. Other
important skills include advanced programmable logic
controllers (PLCs), computer applications and networking,
and control systems.
Supply and Demand Analysis based on Survey Data
Tables A–3.1 and 3.2 provide data on regional program completions for electromechanical technicians. A 3-year
average was calculated by pulling program (CIP CODE) completion numbers from the IPEDS database for 2010,
2011, and 2012 for all schools within the region that offer this program and report completions to IPEDS. These
annual completions were added together to produce a total annual completion number for the program. That
number was then weighed against the projected openings taken from survey data.
Table A-3.1 Regional Annual Program Completions (3-YR Avg.)
Regional Educational Programs
CIP Codes & Descriptions
Delaware Technical Community College
15.0403 – Electromechanical Technology/Engineering 2
15.0499 - Electromechanical, Instrumentation, and Maintenance Technicians
2
11 Bureau of Labor Statistics – Occupational Outlook Handbook, 2013
Troubleshooting
n=19
Control
Systems
n=18
Advanced
PLCs
n=18
Computer
Applications &
Networking
n=18
AC & DC
Control
Circuits
n=15
Automation
n=12
Data
Collection,
Analysis, &
Management
n=11
Robotics
n=4

34
Delaware Tech is the only community college in the region that offers an associate’s degree in Electromechanical
Engineering Technology. Mechanical, electrical, and drafting technicians outnumber electromechanical technicians
nearly 10 to 1 in the region suggesting that this discipline may still be an emerging occupation throughout
Delaware and the surrounding counties.
Table A-3.2 Position Openings (SURVEY DATA) versus Regional Completions (Electromechanical)
Employment Change Position Openings Degree
Completions Supply/Demand
Gap
Current Employment
Employment in 5 Years
5-YR Annual 5-YR Annual 5-YR Annual 5-YR Annual
76 99 23 (30%) 5 (6.6%) 50 10 20 4 (30) (6)
The supply data shows that Delaware Tech is currently not producing enough graduates to meet the 5-YR
projected position openings taken from the survey data. What makes this projected shortage more critical is that
this data represents only known position openings taken from the survey data. The data is reflective of only a small
percentage of employers and possible position openings throughout the region over the next 5 years. Therefore, the
actual shortage could be much greater.
Table A-3.3 below provides an overview of extrapolated estimates for electromechanical engineering technology
occupations throughout the 13-county region. These estimates are based on rates and percentages taken from
survey data at the occupational level. Outliers were eliminated to determine averages, but the sum of all outliers
was added to final totals given that this data is known. For further detail on the methodology of extrapolating these
estimates, please see the Methodology section in Appendix B.
Table A–3.3 Extrapolated Employment Estimates and 5-YR Projections versus Supply (Electromechanical)
Position Openings Supply/Demand Gap
Current Employment
Employment in 5 Years
5-YR Growth
5-YR Retirements
5-YR Turnover
Total 5-YR Openings
5-YR Completions
5-YR Shortage
Annual Shortage
724 1056 332
(46%) 34 (4.7%) 96 (13.3%) 462 20 (442) (88)
Comparing the extrapolated estimates to the average annual completions reveals that the region could potentially
be facing a shortage of approximately 88 workers annually. According to survey data, this field is expected to
experience a very high growth rate (roughly 30%) over the next 5 years. As mentioned earlier, this could be due to
the fact that electromechanical positions are still emerging and growing in number throughout the region. It is
possible that the recent creation of a 2-year electromechanical technology program at Delaware Tech has helped to
fuel this increase in demand. In addition, growth projections may be slightly inflated due to inherent bias of self-
reported data. Although the EMSI employment projections provided in Table A–3.4 indicate a decline in
electromechanical technician positions between now and 2018, our survey data contradicts this with a projected
growth rate of 30% over the next 5 years.
Table A-3.4 EMSI Employment Data for Electromechanical Engineering Technicians
Description 2013 Jobs 2018 Jobs 5-Year Change
Median Hourly Earnings
2013 National Location Quotient
Electromechanical Equipment Assemblers
266 260 (6) $17.14 0.69
Electro-Mechanical Technicians 58 62 4 $27.29 0.44
Total 324 321 (3) $18.97
EMSI 2013.4 Class of Worker – QCEW Employees

35
CAD Software
n=77
Computer
Applications &
Networking
n=61
Knowledge of
material
substitutions or
methods to solve
problems
n=38
CAM
Software
n=25
SolidWorks
Software
n=23
Revit
Software
n=20
Parametric
Modeling
n=22
Material
Static &
Strength
n=19
Stress &
Strain
Analysis
n=16
A-4. Drafters/CAD Technicians (SOC 17-3012 & SOC 17-3013)
Occupational Definition
Drafters, or Computer Aided Design (CAD) Technicians, use software to convert the designs of engineers and
architects into technical drawings and plans. Drafters prepare working diagrams of machinery, mechanical, and
electrical devices including dimensions, fastening methods, and other engineering details.12
Sample Job Titles
Mechanical or Electrical Drafter, Design Drafter, Mechanical or Electrical Designer, CAD Designer, CAD Operator,
CAD/CAM Specialist, Project Designer, or Installation Drafter
Skill Demand based on Survey Data
Survey respondents for were asked to rate several
technical skills by degree of importance to their
company’s drafting and CAD technician positions. The
figure to the right illustrates the skills most frequently
selected as “Extremely Important” or “Very
Important” on a 5-point scale with an option for “Not
applicable”. Larger circles reflect higher response
counts. As expected, of the 89 companies that
responded to this question, 77 participants chose
“CAD Software” as an “Extremely Important” or
“Very Important” skills for their employees to have as
a drafter or CAD technician. However, other
important skills include computer applications and
networking, knowledge of material substitutions or
methods to solve problems, and CAM software.
Supply and Demand Analysis based on Survey Data
Tables A–4.1 and 4.2 provide data on regional program completions for Drafting and CAD Technicians. A 3-year
average was calculated by pulling program (CIP CODE) completion numbers from the IPEDS database for 2010,
2011, and 2012 for all schools within the region that offer this program and report completions to IPEDS. These
annual completions were added together to produce a total annual completion number for the program. That
number was then weighed against the projected openings taken from survey data.
Table A-4.1 Regional Annual Program Completions (3-YR Annual Avg.)
Regional Educational Programs CIP Codes & Description
Delaware Technical
Community College
Chesapeake College
Community College of
Philadelphia
Delaware County Community College
Wor-Wic Community
College
15.13 – Drafting/Design Engineering Technicians
25 1 2 11 2
12 Bureau of Labor Statistics – Occupational Outlook Handbook, 2013

36
Table A-4.2 Position Openings (SURVEY DATA) versus Completions (Drafting/CAD)
Employment Change Position Openings Degree Completions Supply/Demand Gap
Current Employment
Employment in 5 Years
5-YR Annual 5-YR Annual 5-YR Annual 5-YR Annual
268 311 43 (16%) 9 (3.4%) 155 31 205 41 50 10
The survey data shows that this region is poised to graduate approximately 50 more drafters and CAD technicians
than there are projected positions openings between 2014 and 2019. Annually, the region anticipates graduating
about 10 more workers than there are open positions. Given that the known position openings taken from the
survey data represents only a small percentage of possible position openings throughout the region over the next 5
years, the surplus of graduates is to be expected. However, Table A-4.3 below provides an overview of
extrapolated estimates for drafting and CAD technician occupations throughout the 13-county region. These
estimates are based on rates and percentages taken from survey data at the occupational level. Outliers were
eliminated to determine averages, but the sum of all outliers was added to final totals given that this data is known.
For further detail on the methodology of extrapolating these estimates, please see the Methodology section in
Appendix B.
Table A–4.3 Extrapolated Employment Estimates and 5-YR Projections versus Supply (Drafting/CAD)
Position Openings Supply/Demand Gap
Current Employment
Employment in 5 Years
5-YR Growth
5-YR Retirements
5-YR Turnover
Total 5-YR Openings
5-YR Completions
5-YR Shortage
Annual Shortage
3095 3579 484
(15.6%) 237 (7.7%) 299 (9.7%) 1020 205 (815) (163)
Comparing the extrapolated estimates to the average annual completions reveals that the region could potentially
be facing a shortage of approximately 163 workers annually. Both mechanical and electrical drafters have a strong
national location quotient meaning that, compared to the rest of the nation, these jobs have a higher than average
concentration in the region and are expected to experience a growth rate of roughly 16%, according to survey data.
This growth rate contradicts EMSI workforce projections (provided below), which do not predict significant growth
through 2018. However, growth projections taken from survey data may be slightly inflated due to inherent bias of
self-reported data provided by responding firms.
Table A-4.4 EMSI Employment Data for Drafting/CAD Engineering Technicians
Description 2013 Jobs 2018 Jobs 5-Year Change Median Hourly
Earnings 2013 National
Location Quotient
Mechanical Drafters 495 501 6 $25.51 1.01
Electrical and Electronics Drafters 304 306 2 $27.73 1.42
Total 799 807 8 $26.36
EMSI 2013.4 Class of Worker – QCEW Employees
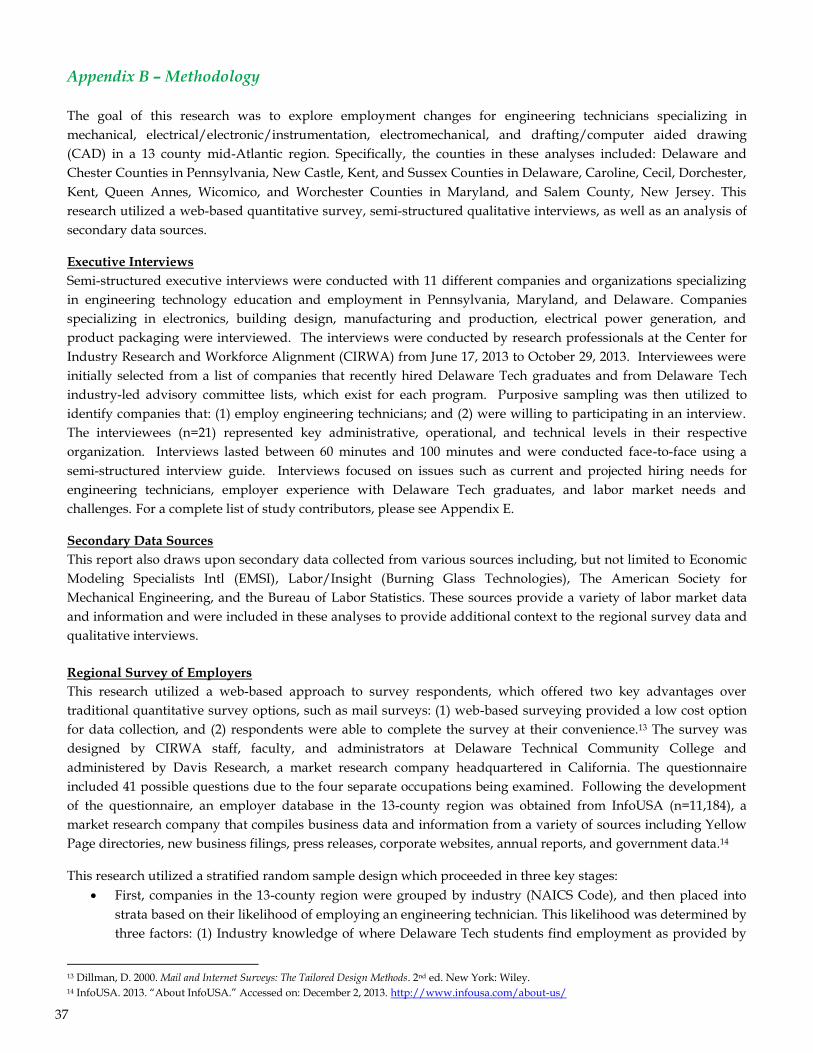
37
Appendix B – Methodology
The goal of this research was to explore employment changes for engineering technicians specializing in
mechanical, electrical/electronic/instrumentation, electromechanical, and drafting/computer aided drawing
(CAD) in a 13 county mid-Atlantic region. Specifically, the counties in these analyses included: Delaware and
Chester Counties in Pennsylvania, New Castle, Kent, and Sussex Counties in Delaware, Caroline, Cecil, Dorchester,
Kent, Queen Annes, Wicomico, and Worchester Counties in Maryland, and Salem County, New Jersey. This
research utilized a web-based quantitative survey, semi-structured qualitative interviews, as well as an analysis of
secondary data sources.
Executive Interviews
Semi-structured executive interviews were conducted with 11 different companies and organizations specializing
in engineering technology education and employment in Pennsylvania, Maryland, and Delaware. Companies
specializing in electronics, building design, manufacturing and production, electrical power generation, and
product packaging were interviewed. The interviews were conducted by research professionals at the Center for
Industry Research and Workforce Alignment (CIRWA) from June 17, 2013 to October 29, 2013. Interviewees were
initially selected from a list of companies that recently hired Delaware Tech graduates and from Delaware Tech
industry-led advisory committee lists, which exist for each program. Purposive sampling was then utilized to
identify companies that: (1) employ engineering technicians; and (2) were willing to participating in an interview.
The interviewees (n=21) represented key administrative, operational, and technical levels in their respective
organization. Interviews lasted between 60 minutes and 100 minutes and were conducted face-to-face using a
semi-structured interview guide. Interviews focused on issues such as current and projected hiring needs for
engineering technicians, employer experience with Delaware Tech graduates, and labor market needs and
challenges. For a complete list of study contributors, please see Appendix E.
Secondary Data Sources
This report also draws upon secondary data collected from various sources including, but not limited to Economic
Modeling Specialists Intl (EMSI), Labor/Insight (Burning Glass Technologies), The American Society for
Mechanical Engineering, and the Bureau of Labor Statistics. These sources provide a variety of labor market data
and information and were included in these analyses to provide additional context to the regional survey data and
qualitative interviews.
Regional Survey of Employers
This research utilized a web-based approach to survey respondents, which offered two key advantages over
traditional quantitative survey options, such as mail surveys: (1) web-based surveying provided a low cost option
for data collection, and (2) respondents were able to complete the survey at their convenience.13 The survey was
designed by CIRWA staff, faculty, and administrators at Delaware Technical Community College and
administered by Davis Research, a market research company headquartered in California. The questionnaire
included 41 possible questions due to the four separate occupations being examined. Following the development
of the questionnaire, an employer database in the 13-county region was obtained from InfoUSA (n=11,184), a
market research company that compiles business data and information from a variety of sources including Yellow
Page directories, new business filings, press releases, corporate websites, annual reports, and government data.14
This research utilized a stratified random sample design which proceeded in three key stages:
First, companies in the 13-county region were grouped by industry (NAICS Code), and then placed into
strata based on their likelihood of employing an engineering technician. This likelihood was determined by
three factors: (1) Industry knowledge of where Delaware Tech students find employment as provided by
13 Dillman, D. 2000. Mail and Internet Surveys: The Tailored Design Methods. 2nd ed. New York: Wiley. 14 InfoUSA. 2013. “About InfoUSA.” Accessed on: December 2, 2013. http://www.infousa.com/about-us/

38
program faculty and placement data. Companies that were thought to be “most likely” to hire engineering
technicians were placed in strata one, followed by stratum two and three, respectively. (2) Inverse staffing
patterns were obtained through a search for engineering technicians using Economic Modeling Specialists
Intl (EMSI) online search tool, which was used to identify industries to be placed in strata one. (3) The size
of companies also played a role in strata placement. Specifically, companies with 1-4 employees were
excluded from strata two and companies with 1-10 employees were excluded from strata three. CIRWA
anticipated a higher qualifying rate for companies in stratum one and two than strata three, as was the case
in the survey response sample.
Second, Davis research initially contacted a random sample of companies in stratum one, two, and three.
After several weeks of calling, the decision was made to cease calling new companies in strata three and
focus calling efforts on stratum one and two since these strata had achieved higher qualification and
response rates. This resulted in all companies in stratum one and two being contacted at least once and 180
companies in strata three not being called at all.
Third, after one week, occupations that had achieved a lower response rate compared to other occupations
were over-sampled in order to obtain (to the extent possible) an even distribution of responses for each
occupation.
The survey was deployed on September 17, 2013 and concluded on October 10, 2013. The population database
included 11,184 firms in the 13-county region. However, 4,239 firms from this database were excluded due to
duplicate, wrong, fax machine, and disconnected phone numbers, resulting in an adjusted sample of 6,945 firms
(3,035 in tier one; 1,141 in tier two; 2,769 in tier three). A total of 6,765 firms were contacted of the total adjusted
sample. Of the 6,765 companies called, Davis Research spoke with 1,564 (23.1% of the adjusted sample of firms). In
total, 753 firms agreed to be screened for qualification resulting in 317 qualified firms that agreed to take the survey
(4.7% of the adjusted sample of firms). In order to qualify to participate in the survey, companies must have had at
least one engineering technician on staff and be located in our region of study. A total of 150 companies completed
the online survey (47% of those that qualified). The average time to complete the survey was 35-45 minutes. In an
effort to increase responses, companies were offered incentives ranging from $25-$100 for their participation. The
monetary incentive increased the longer the survey was deployed.
Companies indicating that they employ multiple types of technicians were asked to respond to the survey for up to
three different types of technicians. Therefore, if a company responded that they employ all four types of
technicians that the survey examines, the survey program selected only three of those occupations based on a “least
full” quota system. The “least full” method of selection helped to ensure that responses for each type of technician
remained as even as possible. Eighty-one (81) companies completed the survey for a single occupation. Thirty-six
(36) companies completed the survey for two occupations, and 33 companies completed the survey for three
occupations. This resulted in a total firm-level response count of 150 and an occupation-level response count of 252.
Overview of Survey Sample
A total of 150 companies completed the online regional survey. Descriptive statistics by state, firm size, and
industry, including response counts and percent of total responses, are provided in Tables B-1 and B-2.
Table B-1. Counts and Percentage of Survey Responses by State and Firm Size (n=150)
Delaware Pennsylvania Maryland New Jersey Total
Small Firms (1-24 employees) 36 (24%) 32 (21.3%) 30 (20%) 4 (2.7%) 102 (68%)
Medium Firms (25-99 employees) 17 (11.3%) 12 (8%) 4 (2.6%) 0 33 (22%)
Large Firms (100+ employees) 5 (3.3%) 9 (6%) 1(0.6%) 0 15 (10%)
TOTAL 58 (38.7%) 53 (35.3%) 35 (23.3%) 4 (2.7%) 150 (100%)

39
Table B-2. Counts and Percentage of Survey Responses by State and NAICS code (n=150)
Manufacturing
Prof, Scientific & Technical
Wholesale Trade
Construction Utilities Other TOTALS
Delaware 15 (10%) 20 (13.3%) 8 (5.3%) 7 (4.7%) 3 (2%) 5 (3.3%) 58 (38.7%)
Pennsylvania 21 (14%) 12 (8%) 8 (5.3%) 8 (5.3%) 2 (1.3%) 2 (1.3%) 53 (35.3%)
Maryland 7 (4.7%) 10 (6.6%) 10 (6.6%) 3 (2%) 4 (2.7%) 1 (0.6%) 35 (23.3%)
New Jersey 2 (1.3%) 1(0.6%) 0 1 (0.6%) 0 0 4 (2.7%)
TOTAL 45 (30%) 43 (28.7%) 26 (17.3%) 19 (12.7%) 9 (6%) 8 (5.3%) 150 (100%)
Estimating Universe of Firms to Extrapolate Total Technician Employment by Occupation
Utilizing the survey’s qualifying incidence rate by industry, the universe of firms within the region that employ all
engineering technicians examined in this research was estimated by examining CIRWA’s adjusted database of
firms (excluding all wrong and disconnected phone numbers) and applying each industry’s qualifying incidence
rate to the total number of firms in that industry. To avoid overestimating total firms, conservative estimates were
taken for this analysis. With the exception of the utilities sector which, according to inverse staffing patterns, is one
of the largest regional employers of technicians, industries that received fewer than 30 qualifiers were excluded
from the employment database. In addition, for the Construction industry, Building Equipment Contractors
(NAICS 2382) constituted 62 of the 65 qualifying companies. As a result, only NAICS 2382 was included in the
adjusted employment database to avoid inflation of total firms across the entire Construction industry. This
resulted in an adjusted employment database of 3,904 firms. Each industry’s incidence rate was then applied to the
number of firms for that industry within the database to determine the number of firms that employ technicians.
These numbers added together constitute our “universe” of 1,854 firms. The occupational incidence rate
(percentage of qualifiers that hire each type of technician) was then applied to the universe of firms to determine
total firms employing each occupation. Table B-4 below provides a breakdown of the “universe of firms” by
occupation.
Table B-3. Universe Estimates for Firms Employing Engineering Technicians
2-Digit NAICS Code & Industry Description
(based on survey incidence rate)
Number of All Establishments in
Adjusted Employment Database
% of Businesses that Qualified (Employ
Engineering Technicians)
Estimated Number of Businesses Employing
Engineering Technicians
22 Utilities (all) 82 71.4% 59
23 Construction (2382 Building Equipment Contractors)
1695 41.1% 697
31-33 Manufacturing (all) 1091 49.0% 535
42 Wholesale Trade (all) 600 49.5% 297
54 Professional, Scientific, and Technical Services (all)
436 60.9% 266
TOTAL 3904
1854
Table B-4. Universe of Firms Employing Technicians by Occupation
Occupational Incidence Rate
(n=150)
Universe of Firms by Occupation (Universe of Total Firms (1854) x
Incidence Rate)
Mechanical .42 779
Electrical, Electronics, & Instrumentation .50 927
Electromechanical .17 315
Drafting/CAD .69 1279
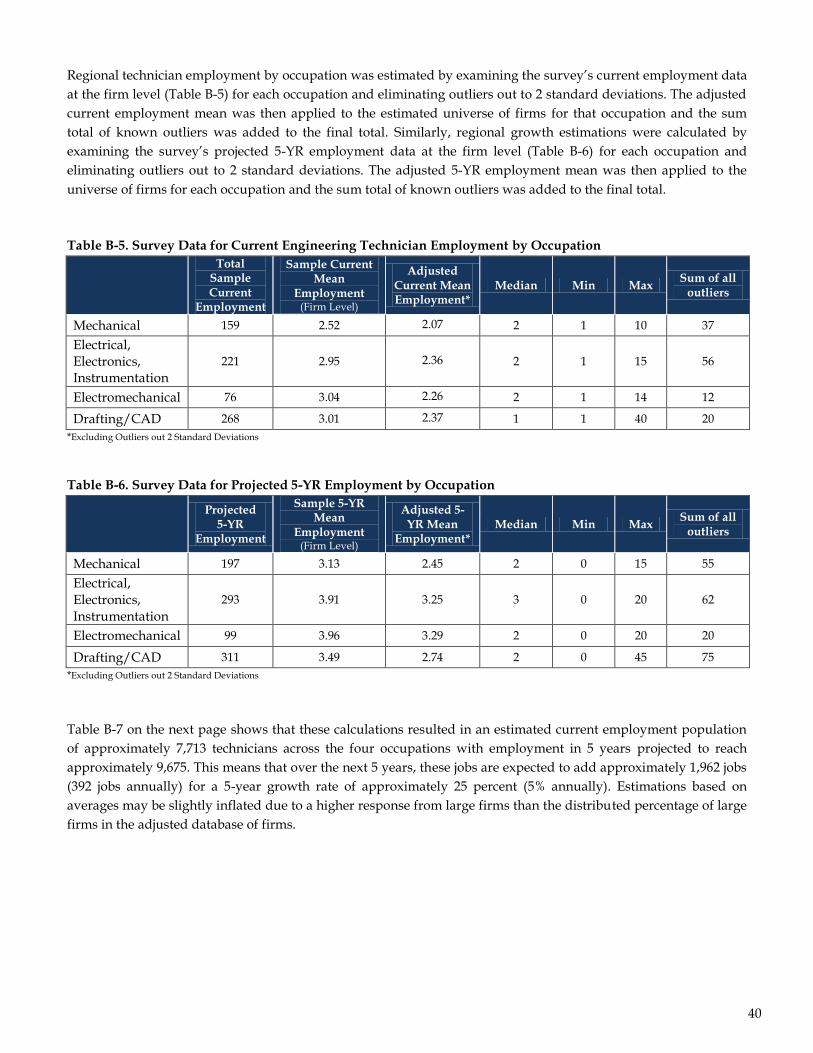
40
Regional technician employment by occupation was estimated by examining the survey’s current employment data
at the firm level (Table B-5) for each occupation and eliminating outliers out to 2 standard deviations. The adjusted
current employment mean was then applied to the estimated universe of firms for that occupation and the sum
total of known outliers was added to the final total. Similarly, regional growth estimations were calculated by
examining the survey’s projected 5-YR employment data at the firm level (Table B-6) for each occupation and
eliminating outliers out to 2 standard deviations. The adjusted 5-YR employment mean was then applied to the
universe of firms for each occupation and the sum total of known outliers was added to the final total.
Table B-5. Survey Data for Current Engineering Technician Employment by Occupation
Total Sample Current
Employment
Sample Current Mean
Employment (Firm Level)
Adjusted Current Mean Employment*
Median Min Max Sum of all
outliers
Mechanical 159 2.52 2.07 2 1 10 37
Electrical, Electronics, Instrumentation
221 2.95 2.36 2 1 15 56
Electromechanical 76 3.04 2.26 2 1 14 12
Drafting/CAD 268 3.01 2.37 1 1 40 20
*Excluding Outliers out 2 Standard Deviations
Table B-6. Survey Data for Projected 5-YR Employment by Occupation
Projected 5-YR
Employment
Sample 5-YR Mean
Employment (Firm Level)
Adjusted 5-YR Mean
Employment* Median Min Max
Sum of all outliers
Mechanical 197 3.13 2.45 2 0 15 55
Electrical, Electronics, Instrumentation
293 3.91 3.25 3 0 20 62
Electromechanical 99 3.96 3.29 2 0 20 20
Drafting/CAD 311 3.49 2.74 2 0 45 75
*Excluding Outliers out 2 Standard Deviations
Table B-7 on the next page shows that these calculations resulted in an estimated current employment population
of approximately 7,713 technicians across the four occupations with employment in 5 years projected to reach
approximately 9,675. This means that over the next 5 years, these jobs are expected to add approximately 1,962 jobs
(392 jobs annually) for a 5-year growth rate of approximately 25 percent (5% annually). Estimations based on
averages may be slightly inflated due to a higher response from large firms than the distributed percentage of large
firms in the adjusted database of firms.

41
Table B-7. Extrapolated Regional Employment and Growth based on Adjusted Sample Means
*Excluding Outliers out 2 Standard Deviations
Table B-8. Extrapolated Regional Openings Due to Growth by Occupations
Estimated openings due to retirements and turnover were calculated at the occupational level by multiplying
firms’ adjusted 5-YR retirement and turnover means for each occupation to the estimated universe of firms for that
occupation. The sum of outliers was added to each occupational total. Extrapolations for projected openings due to
retirements are provided in Tables B-9 and 10. Extrapolations for projected openings due to turnover are provided
in Tables B-11 and 12
Table B-9. Survey Data for Projected 5-YR Retirements by Occupation
Projected 5-YR
Retirements
Sample Mean 5-YR
Retirements (Firm Level)
Adjusted 5-YR Mean
Retirements* Median Min Max
Sum of all outliers
Mechanical 39 .62 .35 0 0 5 20
Electrical, Electronics, Instrumentation
37 .49 .20 0 0 5 24
Electromechanical 8 .32 .09 0 0 2 6
Drafting/CAD 34 .38 .17 0 0 4 20
*Excluding Outliers out 2 Standard Deviations
Universe of Firms
Adjusted Current
Employment Mean*
Estimated Current
Employment (firms x mean)
Current Estimated
Employment incl. outliers (n)
5-YR Employment
Adjusted Mean
Estimated 5-YR Employment incl.
outliers (n)
Mechanical 779 2.07 1613 1650 (n=37) 2.45 1964 (n=55)
Electrical, Electronics, Instrumentation
927 2.36 2188 2244 (n=56) 3.25 3075 (n=62)
Electromechanical 315 2.26 712 724 (n=12) 3.29 1056 (n=20)
Drafting/CAD 1279 2.37 3031 3095 (n=20) 2.74 3579 (n=75)
TOTAL 7544 7713 (n=169) 9675 (=212)
Universe of Firms
Current Estimated Employment incl.
outliers (n)
Estimated 5-YR Employment incl.
outliers (n)
Estimated 5-YR Employment
Growth
Estimated Annual Employment
Growth
Mechanical 779 1650 (n=37) 1964 (n=55) 314 (19%) 63 (3.8%)
Electrical, Electronics, Instrumentation
927 2244 (n=56) 3075 (n=62) 831 (37%) 166 (7.4%)
Electromechanical 315 724 (n=12) 1056 (n=20) 332 (46%) 66 (9.2%)
Drafting/CAD 1279 3095 (n=20) 3579 (n=75) 484 (16%) 97 (3.1%)
TOTAL 7713 (n=169) 9675 (=212) 1962(25%) 392 (5.1%)

42
Table B-10. Extrapolated Regional Openings Due to Retirements
*Excluding Outliers out 2 Standard Deviations
Table B-11. Survey Data for Projected 5-YR Turnover by Occupation
Projected 5-YR
Turnover
Sample Mean 5-YR Turnover
(Firm Level)
Adjusted 5-YR Mean Turnover*
Median Min Max Sum of all
outliers
Mechanical 8 .13 .10 0 0 2 2
Electrical, Electronics, Instrumentation
24 .32 .14 0 0 5 14
Electromechanical 12 .48 .29 0 0 5 5
Drafting/CAD 36 .40 .22 0 0 4 18
*Excluding Outliers out 2 Standard Deviations
Table B-12. Extrapolated Regional Openings Due to Turnover
*Excluding Outliers out 2 Standard Deviations
These occupations are projected to experience an average annual retirement rate of approximately 2% (155 jobs)
and an average annual turnover rate of approximately 1.6% (124 jobs). This results in approximately 279 annual job
openings due to replacement needs versus job growth (jobs added to the economy). Mechanical engineering
technology is expected to experience the highest 5-YR retirement rate by far (17.7%) as shown in Table B-13 on the
next page. A summary of total position openings due to replacements and job growth is provided on the next page
in Tables B-13 and 14.
Universe of Firms
Current Estimated
Employment incl. outliers (n)
Adjusted 5-YR Mean
Retirements* (Firm Level)
Estimated 5-YR Retirements (Firms x Mean)
Estimated 5-YR Openings due to
Retirements incl. outliers (n)
Estimated Annual
Openings due to
Retirements
Mechanical 779 1650 (n=37) .35 273 293 (n=20) 59 (3.5%)
Electrical, Electronics, Instrumentation
927 2244 (n=56) .20 185 209 (n=24) 42 (1.9%)
Electromechanical 315 724 (n=12) .09 28 34 (n=6) 7 (0.9%)
Drafting/CAD 1279 3095 (n=20) .17 217 237 (n=20) 47 (1.5%)
TOTAL 7713 (n=169) 703 773 (n=70) 155 (2.0%)
Universe of Firms
Current Estimated
Employment incl. outliers (n)
Adjusted 5-YR Mean
Turnover* (Firm Level)
Estimated 5-YR Turnover
(Firms x Mean)
Estimated 5-YR Openings due to
Turnover incl. outliers (n)
Estimated Annual
Openings due to
Turnover
Mechanical 779 1650 (n=37) .10 78 80 (n=2) 16 (1%)
Electrical, Electronics, Instrumentation
927 2244 (n=56) .14 130 144 (n=14) 29 (1.3%)
Electromechanical 315 724 (n=12) .29 91 96 (n=5) 19 (2.7%)
Drafting/CAD 1279 3095 (n=20) .22 281 299 (n=18) 60 (1.9%)
TOTAL 7713 (n=169) 580 619 (n=39) 124 (1.6%)

43
Table B-13. Summary of Extrapolated Regional Openings by Occupation due Growth and Replacements
*Excluding Outliers out 2 Standard Deviations
Table B-14. Extrapolated Combined Regional Openings
.
Current
Estimated Employment
Estimated Openings due to
Employment Growth
Estimated Openings due to
Retirements
Estimated Openings due to Turnover
5-YR Annual 5-YR Annual 5-YR Annual
Mechanical 1650 314 (19%) 63 (3.8%) 293 (17.7%) 59 (3.5%) 80 (4.8%) 16 (1%)
Electrical, Electronics, Instrumentation
2244 831 (37%) 166 (7.4%) 209 (9.3%) 42 (1.9%) 144 (6.4%) 29 (1.3%)
Electromechanical 724 332 (46%) 66 (9.2%) 34 (4.7%) 7 (0.9%) 96 (13.3%) 19 (2.7%)
Drafting/CAD 3095 484 (16%) 97 (3.1%) 237 (7.7%) 47 (1.5%) 299 (9.7%) 60 (1.9%)
TOTAL 7713 1962 (25%) 392 (5.1%) 773 (10%) 155 (2.0%) 619 (8%) 124 (1.6%)
Current
Estimated Employment
Estimated 5-YR Openings due to
Growth
Estimated 5-YR Openings due to Replacements
(Retirements + Turnover)
5-YR Total Estimated Openings
Annual Estimated Openings
Mechanical 1650 314 (19%) 373 (22.6%) 687 137
Electrical, Electronics, Instrumentation
2244 831 (37%) 353 (15.7%) 1184 237
Electromechanical 724 332 (46%) 130 (18%) 462 92
Drafting/CAD 3095 484 (16%) 536 (17.3%) 1020 204
TOTAL 7713 1962 (25%) 1392 (18%) 3353 671

44
Appendix C - Data Limitations
The ability to generalize data from this survey was limited due to the quality of the sample frame.15 Specifically,
this research utilized a database of employers in a 13-county region that was obtained from InfoUSA (n=11,184).
InfoUSA is a market research company that compiles data from a variety of sources including Yellow Page
directories, new business filings, press releases, corporate websites, annual reports, and government data.16 Despite
the large target population, 4,239 contacts from this database needed to be excluded due to disconnected phone
numbers, fax machines, and wrong numbers. Thus, the adjusted population size was significantly smaller (6,945
companies; 62.1% of original population) than initially anticipated prior to beginning this research. The inaccurate
target sample made it difficult to determine the sample size needed to obtain the necessary level of confidence
(p=.05).
The fact that this research examined several different occupations resulted in the development of a lengthy and
complex survey instrument that may have influenced survey attrition.17 The average time of completion for
respondents was 35-45 minutes. Despite offering incentives of $25-$100 for participation, respondents declined to
participate in this survey due to time constraints. In addition, potential participants were initially contacted by
phone to gauge their interest in participating in the study and were then emailed an online survey to complete at
their convenience. Future research will consider creating a survey that takes less time to complete (10 to 20
minutes) as well as conducting telephone surveys instead of solely relying upon follow up web-based surveys in an
effort to increase response counts.
Data taken from the national IPEDS database is subject to limitations as outlined on the IPEDS website and may not
be inclusive of every CIP code relevant to the occupations listed in this document. Graduate data is self-reported
into IPEDS, and educational institutions may opt to input completion data under a CIP code not traditional to these
disciplines. Additionally, while care was taken to verify all Delaware Tech graduate completion data, verification
of all completion data from all colleges was not conducted. Programs designated as “pre-engineering” or “transfer”
programs were not included in this analysis and may be considered a limitation. In addition, data taken from
EMSI, the Bureau of Labor Statistics, and other secondary sources is subject to several limitations as outlined within
their datasets.
Although these limitations do not preclude the publication of this report, CIRWA has not generalized the study’s
survey findings beyond the sample population. While CIRWA did provide extrapolated estimates for hypothetical
purposes, we recommend careful consideration prior to making generalized statistical inferences based upon the
findings and conclusions of this labor market scan.
15 Kalton, G. H. 1983. Introduction to Survey Sampling. Newbury Park, CA: Sage. 16 InfoUSA. 2013. “About InfoUSA.” Accessed on: December 2, 2013. http://www.infousa.com/about-us/ 17 Olsen, R. J. 2005. “The Problem of Respondent Attrition: Survey Methodology is Key.” Monthly Labor Review 2:63 – 70.
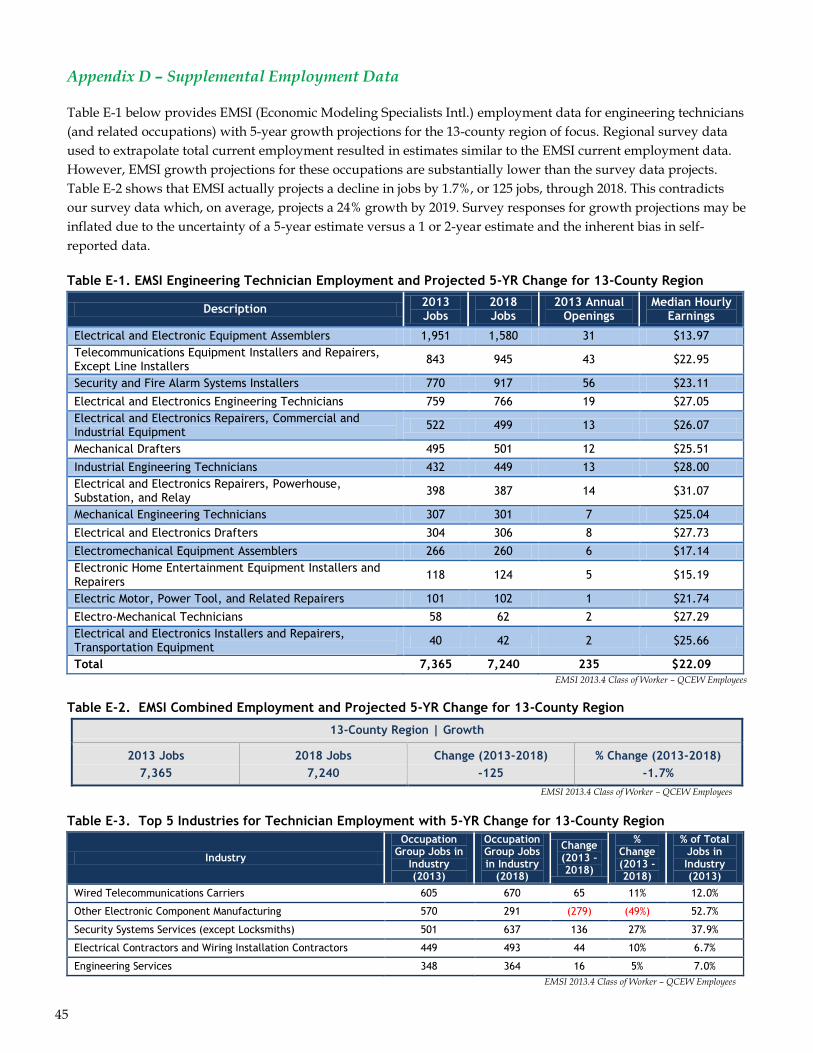
45
Appendix D – Supplemental Employment Data
Table E-1 below provides EMSI (Economic Modeling Specialists Intl.) employment data for engineering technicians
(and related occupations) with 5-year growth projections for the 13-county region of focus. Regional survey data
used to extrapolate total current employment resulted in estimates similar to the EMSI current employment data.
However, EMSI growth projections for these occupations are substantially lower than the survey data projects.
Table E-2 shows that EMSI actually projects a decline in jobs by 1.7%, or 125 jobs, through 2018. This contradicts
our survey data which, on average, projects a 24% growth by 2019. Survey responses for growth projections may be
inflated due to the uncertainty of a 5-year estimate versus a 1 or 2-year estimate and the inherent bias in self-
reported data.
Table E-1. EMSI Engineering Technician Employment and Projected 5-YR Change for 13-County Region
Description 2013 Jobs
2018 Jobs
2013 Annual Openings
Median Hourly Earnings
Electrical and Electronic Equipment Assemblers 1,951 1,580 31 $13.97
Telecommunications Equipment Installers and Repairers, Except Line Installers
843 945 43 $22.95
Security and Fire Alarm Systems Installers 770 917 56 $23.11
Electrical and Electronics Engineering Technicians 759 766 19 $27.05
Electrical and Electronics Repairers, Commercial and Industrial Equipment
522 499 13 $26.07
Mechanical Drafters 495 501 12 $25.51
Industrial Engineering Technicians 432 449 13 $28.00
Electrical and Electronics Repairers, Powerhouse, Substation, and Relay
398 387 14 $31.07
Mechanical Engineering Technicians 307 301 7 $25.04
Electrical and Electronics Drafters 304 306 8 $27.73
Electromechanical Equipment Assemblers 266 260 6 $17.14
Electronic Home Entertainment Equipment Installers and Repairers
118 124 5 $15.19
Electric Motor, Power Tool, and Related Repairers 101 102 1 $21.74
Electro-Mechanical Technicians 58 62 2 $27.29
Electrical and Electronics Installers and Repairers, Transportation Equipment
40 42 2 $25.66
Total 7,365 7,240 235 $22.09
EMSI 2013.4 Class of Worker – QCEW Employees
Table E-2. EMSI Combined Employment and Projected 5-YR Change for 13-County Region
13-County Region | Growth
2013 Jobs
7,365
2018 Jobs
7,240
Change (2013-2018)
-125
% Change (2013-2018)
-1.7%
EMSI 2013.4 Class of Worker – QCEW Employees
Table E-3. Top 5 Industries for Technician Employment with 5-YR Change for 13-County Region
Industry
Occupation Group Jobs in
Industry (2013)
Occupation Group Jobs in Industry
(2018)
Change (2013 - 2018)
% Change (2013 - 2018)
% of Total Jobs in Industry (2013)
Wired Telecommunications Carriers 605 670 65 11% 12.0%
Other Electronic Component Manufacturing 570 291 (279) (49%) 52.7%
Security Systems Services (except Locksmiths) 501 637 136 27% 37.9%
Electrical Contractors and Wiring Installation Contractors 449 493 44 10% 6.7%
Engineering Services 348 364 16 5% 7.0%
EMSI 2013.4 Class of Worker – QCEW Employees

46
Real-Time Labor Market Data
Figures E-1 through E-5 were constructed with data compiled from Labor/Insight (Burning Glass Technologies), a
real-time labor market intelligence tool used to analyze online job postings over a given period of time and
geography. All data for these figures was accessed on December 18, 2013 and was analyzed for the period of Nov.
30, 2012 – Nov 30, 2013. All data was pulled for the 13-county region of focus for this labor market scan.
Figure E-1. Top 10 Engineering Technician
Job Postings in 13-County Region (n=175)
(Nov. 30, 2012 – Nov. 30, 2013)
Figure E-3. Skills in Greatest Demand as Listed in Engineering Technician Online Job Postings in 13-County
Region (n=166) (Nov. 30, 2012 – Nov. 30, 2013)
Maintenance And Repair Workers,General
Mechanical Drafters
Electromechanical EquipmentAssemblers
Manufacturing ProductionTechnicians
First-Line Supervisors OfMechanics, Installers, And…
Mechanical EngineeringTechnicians
Electronics EngineeringTechnicians
Engineering Technicians, ExceptDrafters, All Other
Electric Motor, Power Tool, AndRelated Repairers
First-Line Supervisors OfProduction And Operating Workers
Job Openings
76
32 29 27 24 23 21 21 20 20 20 19 18 17 15 15 14 14 14 14 11 11 10 10 10 10
Job Openings
Company Name # Postings
Lennox 12
The Boeing Company 8
Baltimore Gas & Electric 6
Kensey Nash Corporation 6
E.I. DuPont De Nemours & Co. 5
General Electric Company 4
Public Service Enterprise Group Inc. 4
Constellation Energy Group 3
Flowers Foods Incorporated 3
Sunoco Corporation 3
Johnson & Johnson 3
Figure E-2. Top Employers Posting
Engineering Technician Positions in 13-
County Region (n=107)
(Nov. 30, 2012 – Nov. 30, 2013)
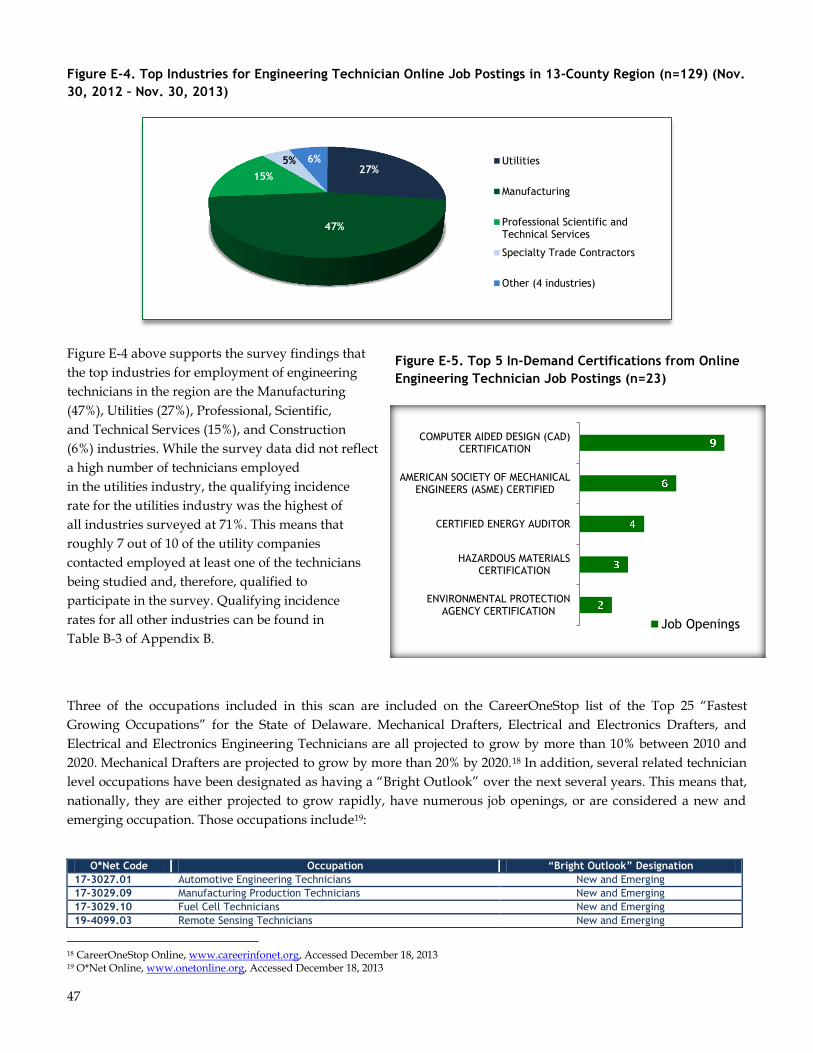
47
Figure E-5. Top 5 In-Demand Certifications from Online
Engineering Technician Job Postings (n=23)
COMPUTER AIDED DESIGN (CAD)CERTIFICATION
AMERICAN SOCIETY OF MECHANICALENGINEERS (ASME) CERTIFIED
CERTIFIED ENERGY AUDITOR
HAZARDOUS MATERIALSCERTIFICATION
ENVIRONMENTAL PROTECTIONAGENCY CERTIFICATION
Job Openings
Figure E-4. Top Industries for Engineering Technician Online Job Postings in 13-County Region (n=129) (Nov.
30, 2012 – Nov. 30, 2013)
Figure E-4 above supports the survey findings that
the top industries for employment of engineering
technicians in the region are the Manufacturing
(47%), Utilities (27%), Professional, Scientific,
and Technical Services (15%), and Construction
(6%) industries. While the survey data did not reflect
a high number of technicians employed
in the utilities industry, the qualifying incidence
rate for the utilities industry was the highest of
all industries surveyed at 71%. This means that
roughly 7 out of 10 of the utility companies
contacted employed at least one of the technicians
being studied and, therefore, qualified to
participate in the survey. Qualifying incidence
rates for all other industries can be found in
Table B-3 of Appendix B.
Three of the occupations included in this scan are included on the CareerOneStop list of the Top 25 “Fastest
Growing Occupations” for the State of Delaware. Mechanical Drafters, Electrical and Electronics Drafters, and
Electrical and Electronics Engineering Technicians are all projected to grow by more than 10% between 2010 and
2020. Mechanical Drafters are projected to grow by more than 20% by 2020.18 In addition, several related technician
level occupations have been designated as having a “Bright Outlook” over the next several years. This means that,
nationally, they are either projected to grow rapidly, have numerous job openings, or are considered a new and
emerging occupation. Those occupations include19:
18 CareerOneStop Online, www.careerinfonet.org, Accessed December 18, 2013 19 O*Net Online, www.onetonline.org, Accessed December 18, 2013
27%
47%
15%
5% 6% Utilities
Manufacturing
Professional Scientific andTechnical Services
Specialty Trade Contractors
Other (4 industries)
O*Net Code Occupation “Bright Outlook” Designation
17-3027.01 Automotive Engineering Technicians New and Emerging
17-3029.09 Manufacturing Production Technicians New and Emerging
17-3029.10 Fuel Cell Technicians New and Emerging
19-4099.03 Remote Sensing Technicians New and Emerging

48
Appendix E – Study Contributors
Delaware Tech and the Center for Industry Research & Workforce Alignment would like to recognize and thank
the following individuals and companies for their contributions to this workforce research and their commitment
to helping connect Delawareans to jobs within the region:
Interviewee Business/Organization City, State
Terry Speicher Penn State – Berks Campus Reading. PA
Walter Fullam Penn State - Berks Campus Reading, PA
Howard Krinsky Delaware Engineering & Design Corp. Newark, DE
Jim Mancini DuPont Engineering Wilmington, DE
Eric Binder DuPont Engineering Wilmington, DE
Tom Spiezio Playtex/Energizer Personal Care Dover, DE
Joe Konrad Playtex/Energizer Personal Care Dover. DE
Frederica Hughes Exelon Generation Kennett Square, PA
John Belardo Exelon Generation Eddystone, PA
Stuart Glenn Exelon Generation Fort Worth, TX
John Everett Exelon Generation Conowingo Dam, PA
Kevin Sartell Kraft Foods Dover, DE
Darren Harmon Kraft Foods Dover, DE
John Williams API Technologies/Spectrum Microwave Delmar, DE
Brian Zigmond Studio JAED Bear, DE
Bob Blyman Studio JAED Bear, DE
Tom Meehan TA Instruments New Castle, DE
Bryan Markiewicz Testing Machines, Inc New Castle, DE
Nick Sisofo W.L. Gore Elkton, MD
Darren Silvestri W.L. Gore Elkton, MD
Dominic Casarino W.L. Gore Elkton, MD

49
Delaware Technical
Community College
established the Center
for Industry Research &
Workforce Alignment
(CIRWA) in October
2011 as part of a U.S.
Department of Labor
Trade Adjustment
Assistance Community
College Career Training
Grant.
For more information about
CIRWA, please visit our
website at:
www.dtcc.edu/cirwa
or contact:
Veronica S. Buckwalter,
Director of CIRWA at:
100 Campus Drive
Dover, DE 19904
(302) 857-1599
© 2014 Center for Industry Research & Workforce Alignment
Delaware Technical Community College