Embed Size (px)
Citation preview
ANCORD | Sao Paulo, Brazil | March 2015
Market Structure TrendsBrazil and Abroad
Presented by
Larry Tabb (Founder & CEO)
2
Agenda
Trading trends US/Europe Competition Electronification HFT Institutional trading
Brazil Local challenges New competition What to expect How to prepare How Brazil will be different
Conclusion 2
3
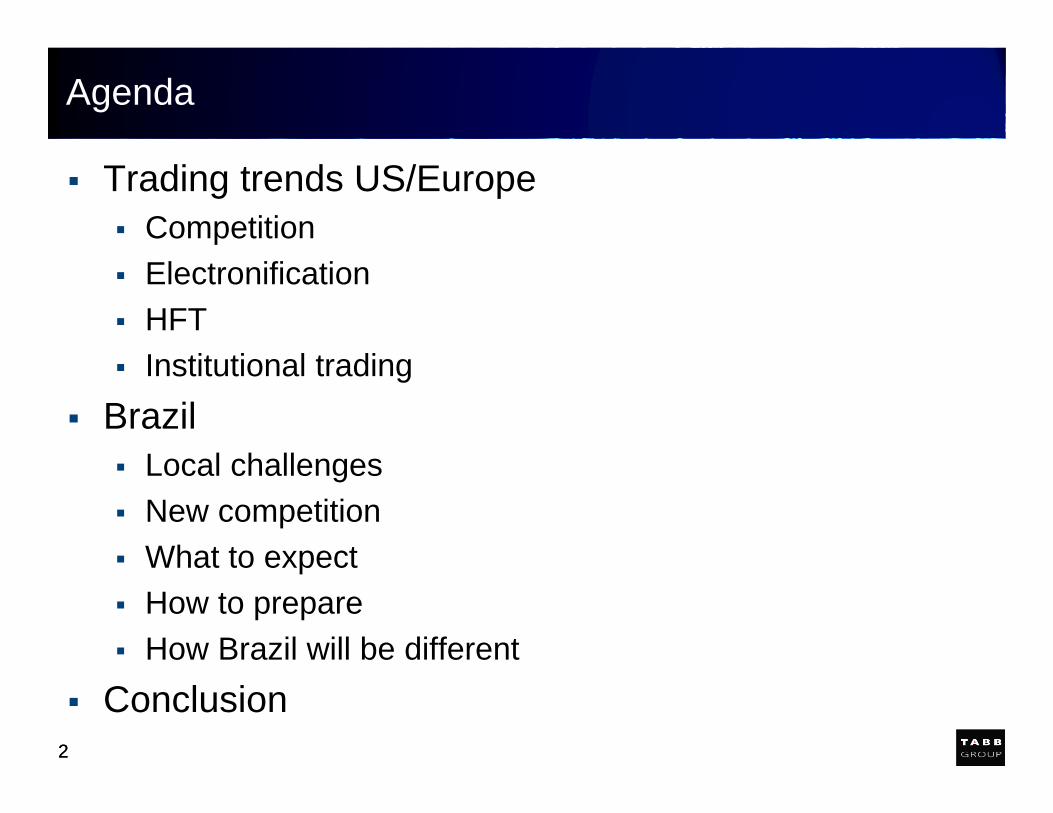
NYSE
NYSE had a physical floor with the specialist acting as a monopolist market maker
InvestorsBroker
Specialist
Floor Brokers
4
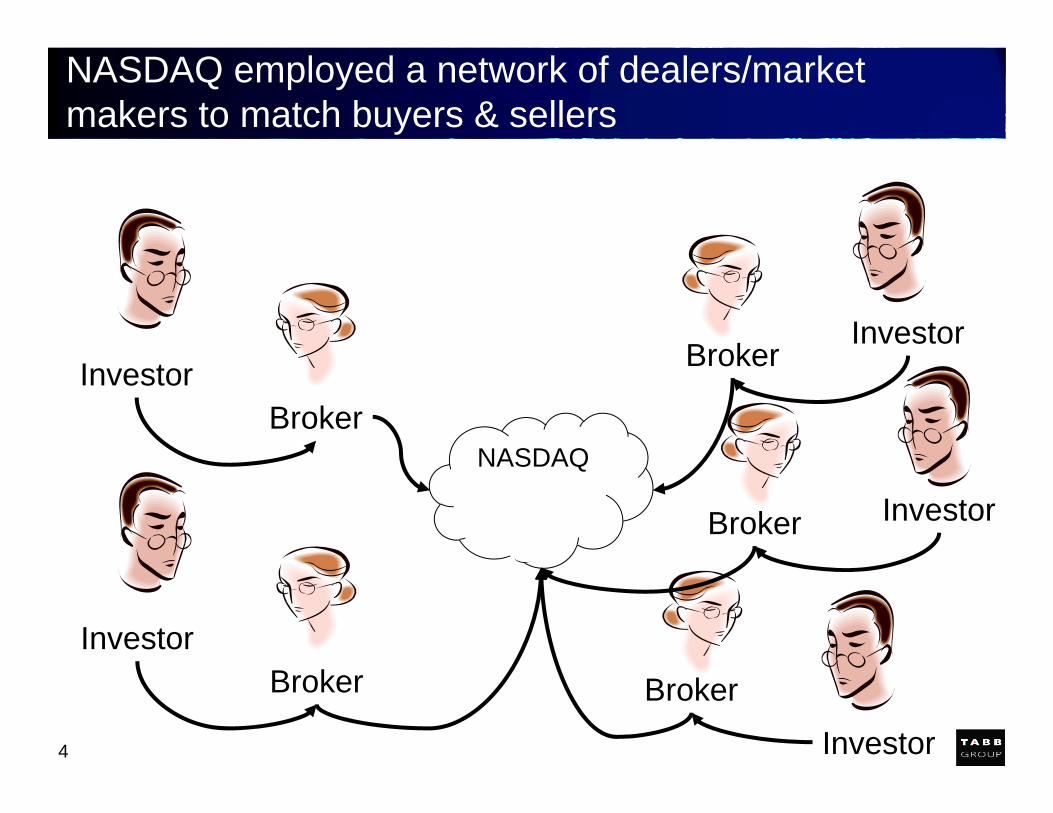
NASDAQ employed a network of dealers/market makers to match buyers & sellers
InvestorBroker
InvestorBroker
Investor
Investor
Investor
Broker
Broker
Broker
NASDAQ
5
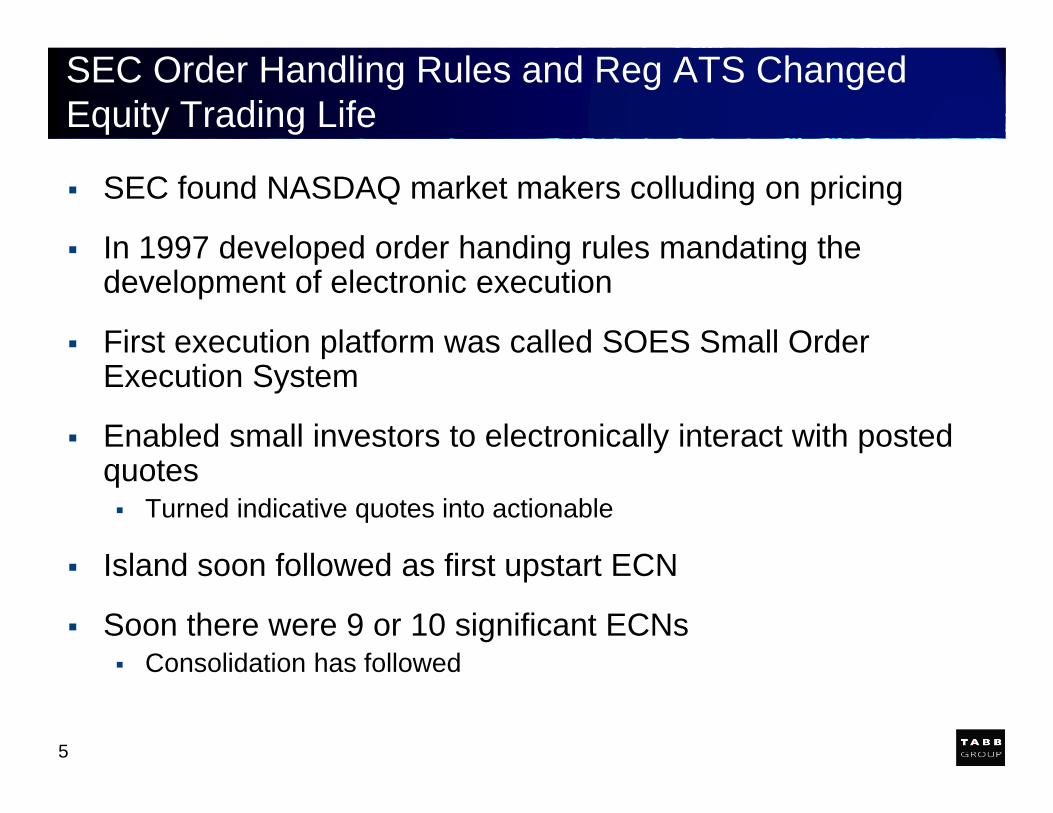
SEC Order Handling Rules and Reg ATS Changed Equity Trading Life
SEC found NASDAQ market makers colluding on pricing
In 1997 developed order handing rules mandating the development of electronic execution
First execution platform was called SOES Small Order Execution System
Enabled small investors to electronically interact with posted quotes Turned indicative quotes into actionable
Island soon followed as first upstart ECN
Soon there were 9 or 10 significant ECNs Consolidation has followed

6
Decimals is the second major market structure change that has radically changed equity trading
0
.10
.15
.20
.25
1/4
1/8
1/16
3/16
0 From 16 price points to 100
Less liquidity at any one point
Less expensive to jump bids
More need for specialist to bridge liquidity
Less profitability for dealers
Market structure change to agency model
More expensive for large investors
Fractions
Decimals
1
2
3
4
5
10
15
20
25
.05
7
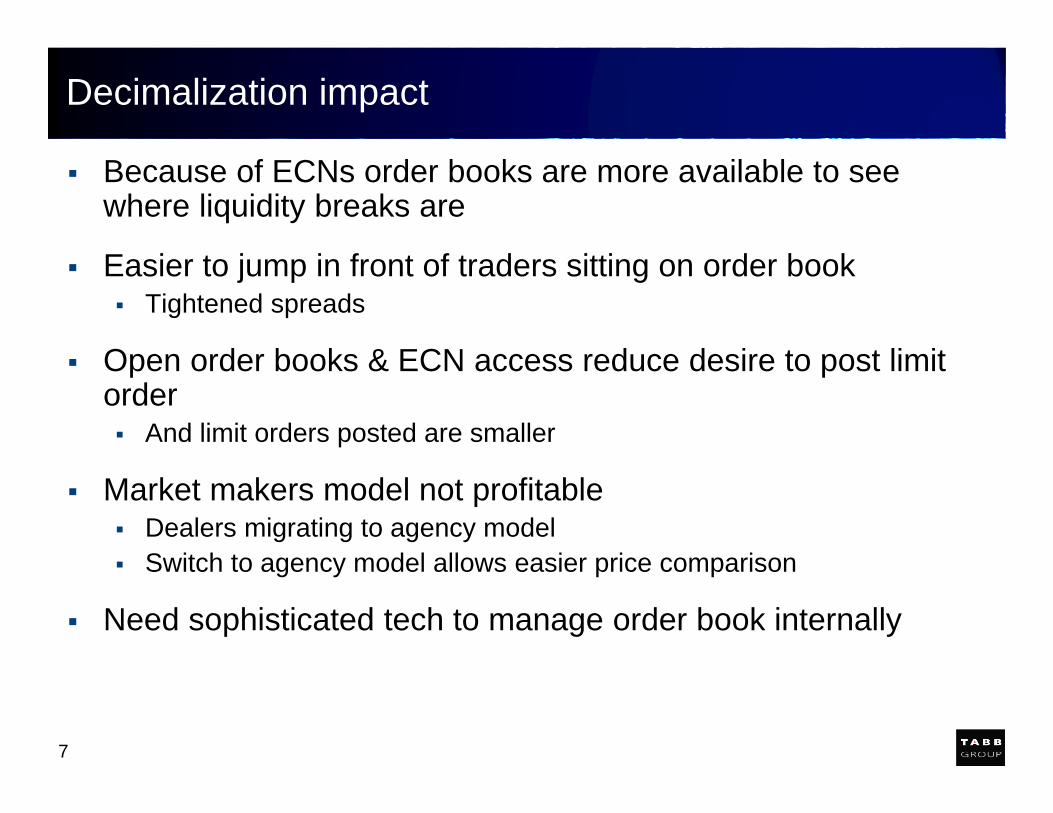
Decimalization impact
Because of ECNs order books are more available to see where liquidity breaks are
Easier to jump in front of traders sitting on order book Tightened spreads
Open order books & ECN access reduce desire to post limit order And limit orders posted are smaller
Market makers model not profitable Dealers migrating to agency model Switch to agency model allows easier price comparison
Need sophisticated tech to manage order book internally
8
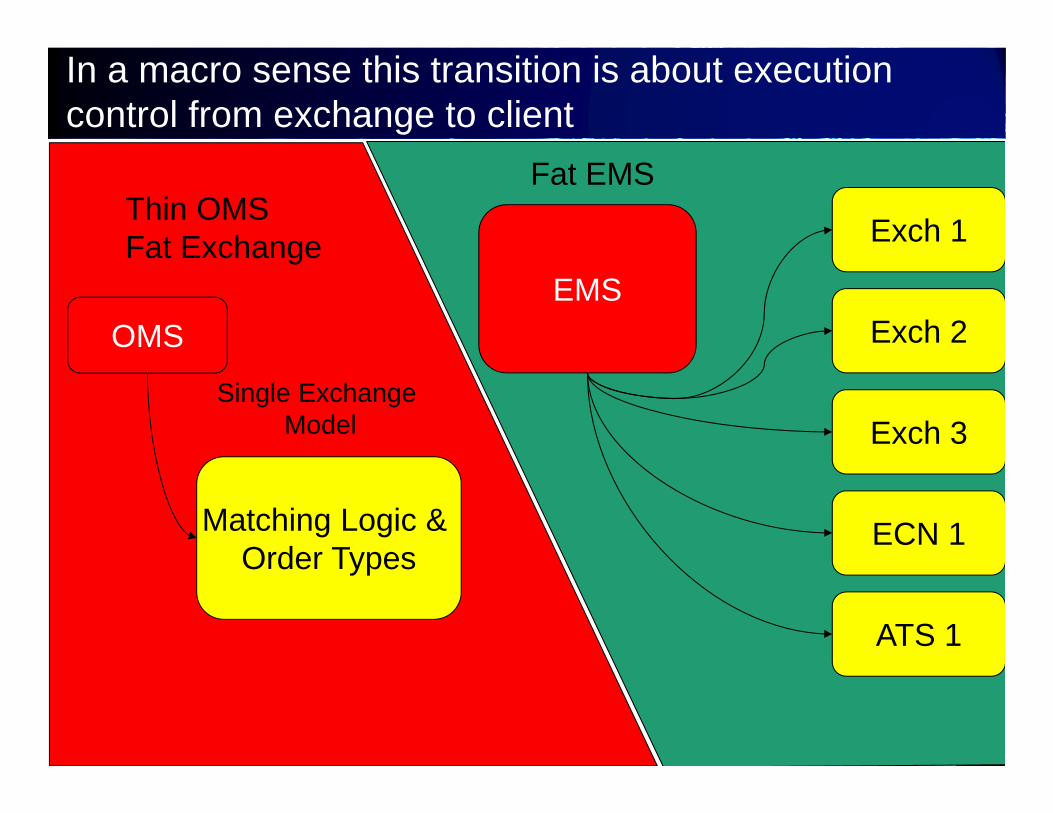
In a macro sense this transition is about execution control from exchange to client
Matching Logic & Order Types
OMS
Single Exchange Model
Thin OMS Fat Exchange
EMS
Exch 1
Exch 2
Exch 3
ECN 1
ATS 1
Fat EMS
9
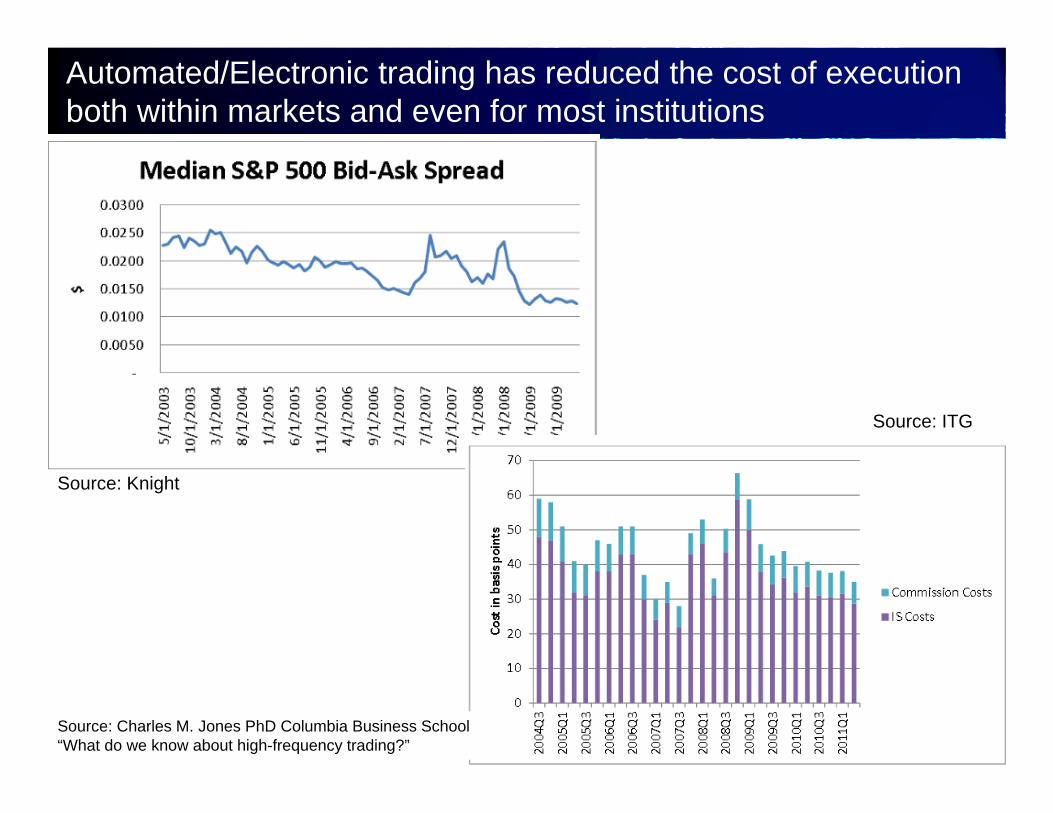
Automated/Electronic trading has reduced the cost of execution both within markets and even for most institutions
Source: Charles M. Jones PhD Columbia Business School “What do we know about high-frequency trading?”
Source: Knight
Source: ITG

10
Most academic studies say that competition / HFT overall reduces spreads & lowers transaction costs
Foresight Report: The Future of Computer Trading in Financial Markets (2012) Improved liquidity, lower transaction cost, and more efficient pricing
Hagströmer, Björn and Norden (2012) - The Diversity of High Frequency Traders Market making and opportunistic HFT strategies mitigate intraday price volatility
Hasbrouck, Saar "Low--‐Latency Trading", May 2011 Low latency automated trading was associated with lower quoted and effective spreads, lower
volatility and greater liquidity
Angel,Harris &Spatt: "Equity trading in the 21st century", February 2010 Trading costs have declined, bid‐ask spreads narrowed and available liquidity has increased
Chaboud, Hjalmarsson, Vega and Chiquoine “Rise of the Machines: Algorithmic Trading in the Foreign Exchange Market”, October 2009 Automated trades increased liquidity and may have lowered volatility
Hendershott, Riordan “Algorithmic Trading and Information”, August 2009 Automated trades made prices more efficient and did not contribute to higher volatility
10

1111
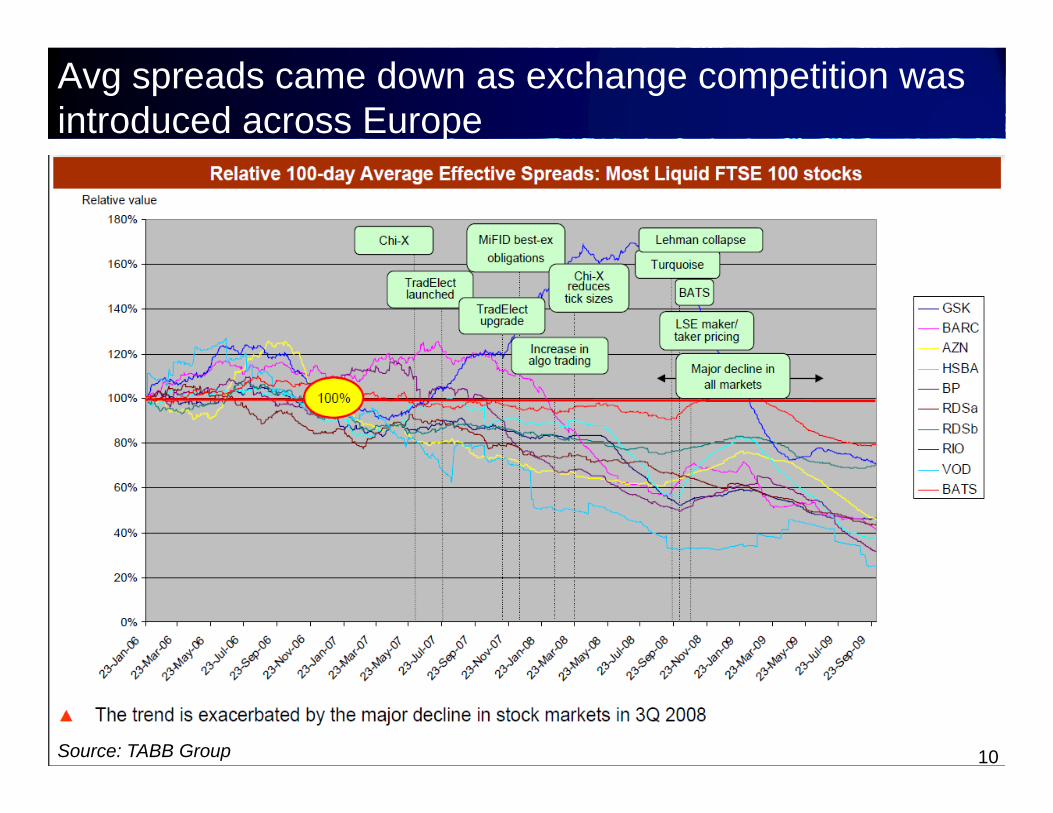
Across Europe effective spread has declined in 92% of 60 most liquid stocks (20 each in FTSE, DAX & CAC)
Source: TABB Group 9
1212
Avg spreads came down as exchange competition was introduced across Europe
Source: TABB Group 10

1313
Despite drop in volume, competition has kept pressure on effective spreads even during height of crisis
Source: TABB Group 11

14
Too much of a good thing
14

15
LavaFlow
DirectEdge
Instinet
Brut
These regulations opened up a floodgate of competition. This is just the early stage competitors
Island
Attain
Strike
TradeBook
Redi
NextTrade
Arca
BATS
Brut
NASDAQ Knight
Citi
Instinet
NASDAQ Arca
NYSE
Track

16
US Market structure has spun out of control. Trading venues have proliferated. The US has 11 exchanges & 41 ATSs, but starting to consolidate
16
ExchangesNYSENYSE ArcaNYSE AmexNASDAQNASDAQ BXNASDAQ PSXBATS BZXBATS BYXDirectEdge EdgeADirectEdge EdgeXCBSXCBSX / NSXCSX
ATSs
AQUA Credit Suisse CrossFinder ITG POSITMorgan Stanley (MS Pool)
Barclays (3) Credit Suisse Light PoolJ.P. MORGAN SECURITIES LLC
Morgan Stanley (Trajectory Cross)
Barclays DirectEx Cross StreamJEFFERIES EXECUTION SERVICES, INC. PDQ
Barclays LX Dealer Web Knight Link by KCG RiverCross
BIDS Deutsche Bank SuperX LavaFlow ECNPro Securities SpeedRoute
BLOOMBERG TRADEBOOK LLC
FOLIOFN INVESTMENTS, INC. LeveL State Street (Block Cross)
Citadel Apogee Goldman Sachs Sigma X Liquidnet H2O UBS
Citi Cross IEX Liquidnet Negotiated Weeden XE
Citi LIQUIFI Instinet CBX Merrill Lynch (2)
ConvergEx Group Millennium Instinet Crossing Merrill Lynch (MLXN)
17
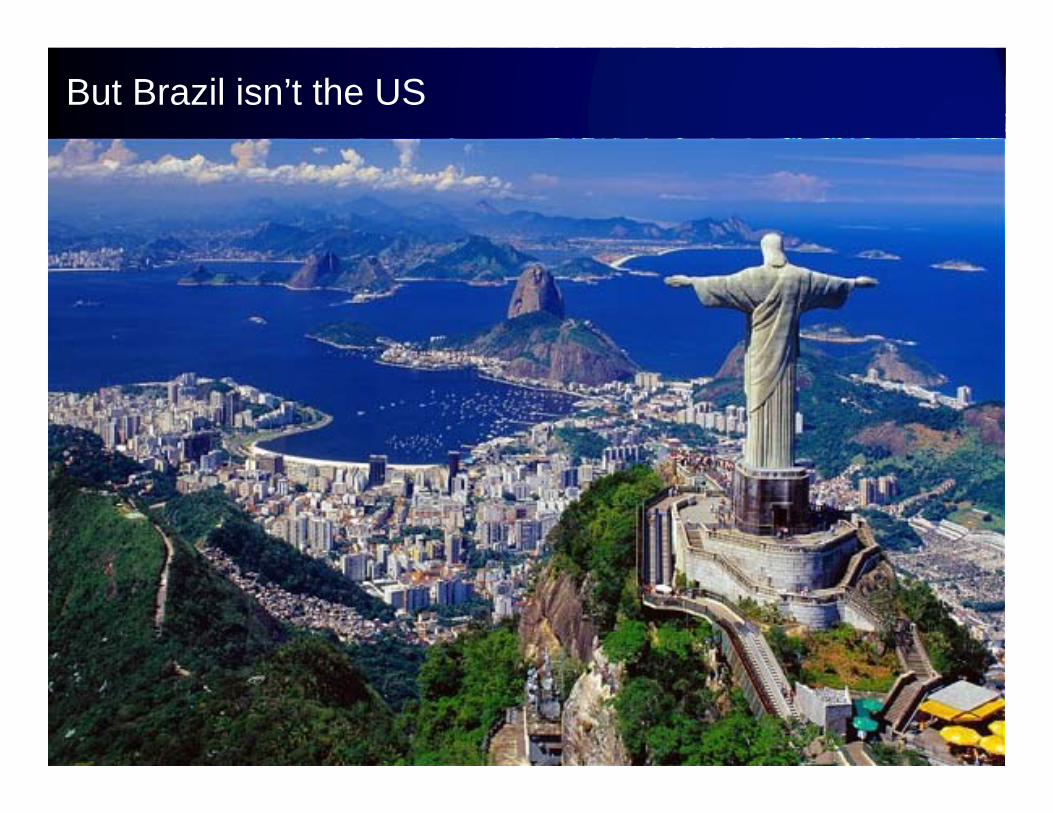
But Brazil isn’t the US
17
18
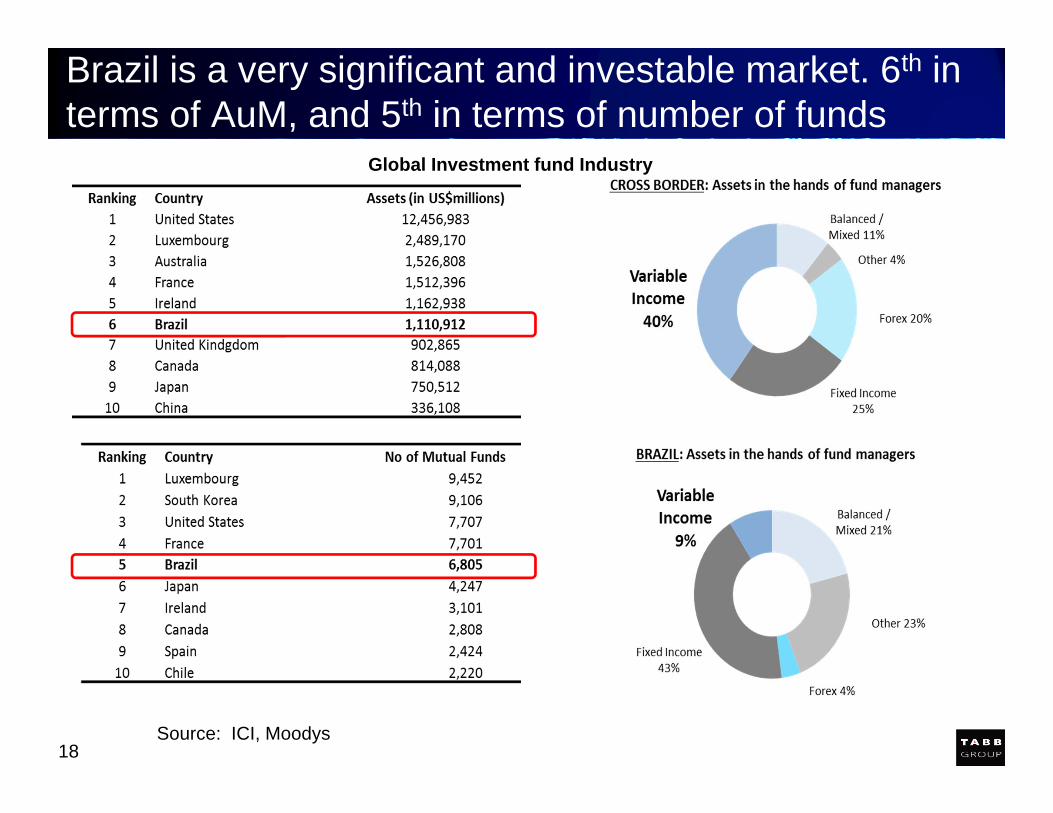
Brazil is a very significant and investable market. 6th in terms of AuM, and 5th in terms of number of funds
Source: ICI, Moodys
Global Investment fund Industry
19
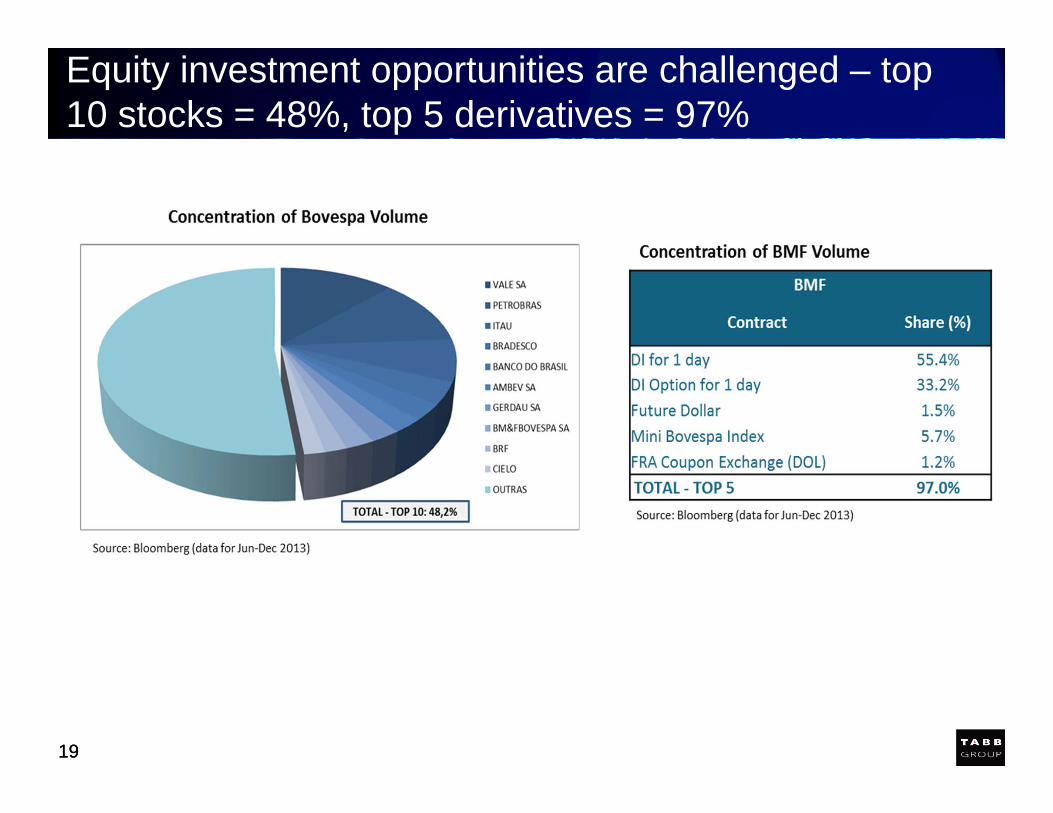
Equity investment opportunities are challenged – top 10 stocks = 48%, top 5 derivatives = 97%
19

20
And IPO market is pretty much nonexistent with only one IPO in 2014
IPOs US, UK, & EU vs. Brazil 2014
BR
L in
Bill
ions
BRL 0.00
BRL 50.00
BRL 100.00
BRL 150.00
BRL 200.00
BRL 250.00
BRL 300.00
2004 2005 2006 2007 2008 2009 2010 2011 2012 2013 2014
Brazil US UK Euro Australia
21
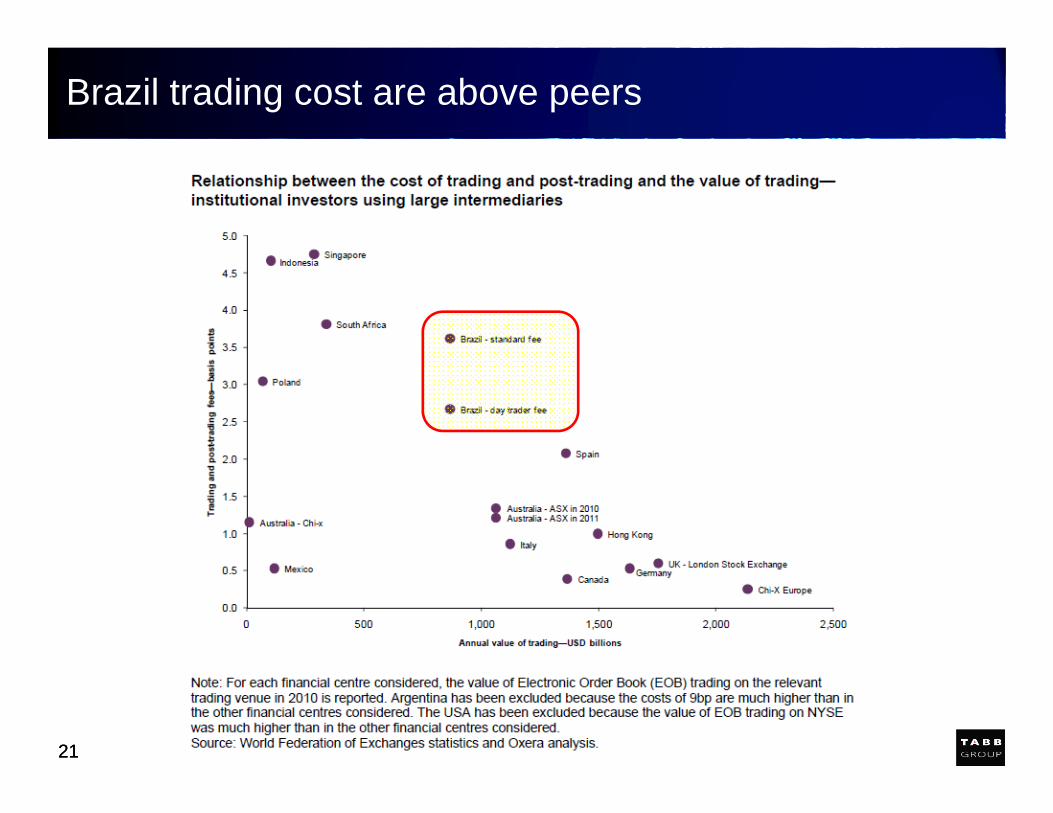
Brazil trading cost are above peers
21

22
0
1
2
3
4
5
6
7
8
User 1 - Intermediary 1 User 2- Intermediary 2User 3 - Intermediary 3 User 4-Intermediary 4
4X Expense vs USA
The cost of trading in Brazil is significantly higher than that of many smaller markets
Source: CVM Brazil
Cost of Trading (bps) & Distribution of Costs in each Financial Center
23
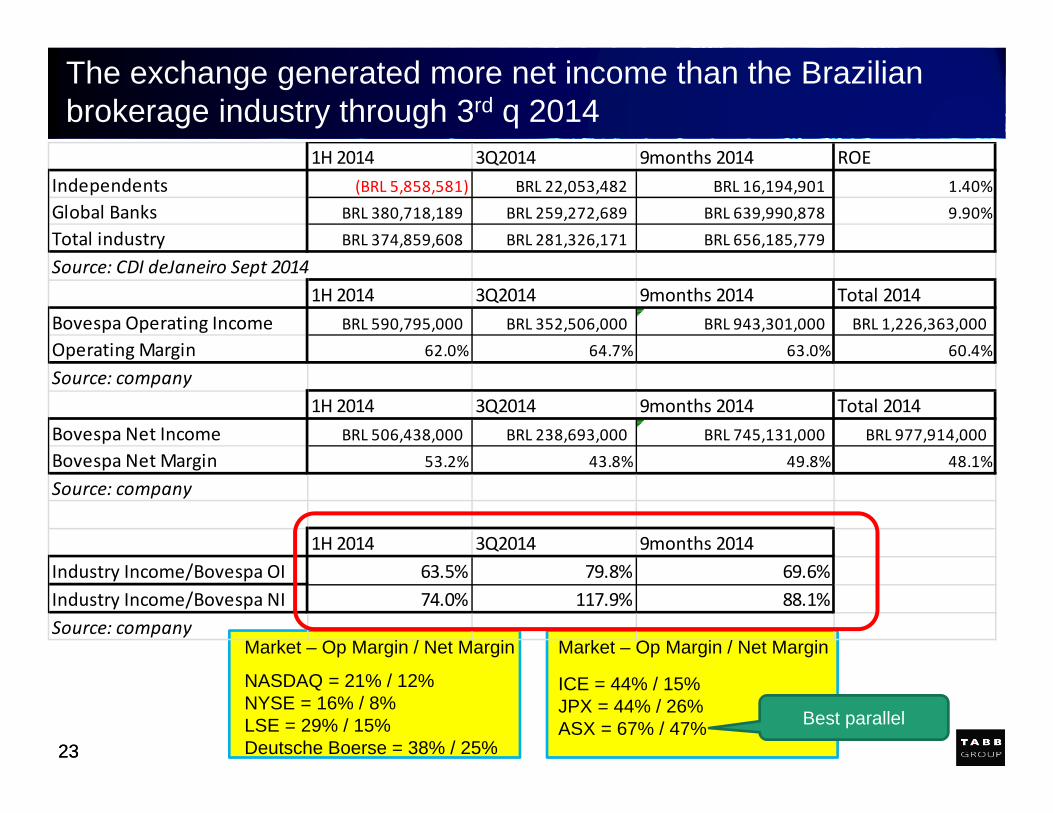
The exchange generated more net income than the Brazilian brokerage industry through 3rd q 2014
23
1H 2014 3Q2014 9months 2014 ROEIndependents (BRL 5,858,581) BRL 22,053,482 BRL 16,194,901 1.40%Global Banks BRL 380,718,189 BRL 259,272,689 BRL 639,990,878 9.90%Total industry BRL 374,859,608 BRL 281,326,171 BRL 656,185,779
Source: CDI deJaneiro Sept 20141H 2014 3Q2014 9months 2014 Total 2014
Bovespa Operating Income BRL 590,795,000 BRL 352,506,000 BRL 943,301,000 BRL 1,226,363,000Operating Margin 62.0% 64.7% 63.0% 60.4%
Source: company1H 2014 3Q2014 9months 2014 Total 2014
Bovespa Net Income BRL 506,438,000 BRL 238,693,000 BRL 745,131,000 BRL 977,914,000Bovespa Net Margin 53.2% 43.8% 49.8% 48.1%
Source: company
1H 2014 3Q2014 9months 2014Industry Income/Bovespa OI 63.5% 79.8% 69.6%Industry Income/Bovespa NI 74.0% 117.9% 88.1%Source: company
Market – Op Margin / Net Margin
NASDAQ = 21% / 12%NYSE = 16% / 8%LSE = 29% / 15%Deutsche Boerse = 38% / 25%
Market – Op Margin / Net Margin
ICE = 44% / 15%JPX = 44% / 26%ASX = 67% / 47% Best parallel
24
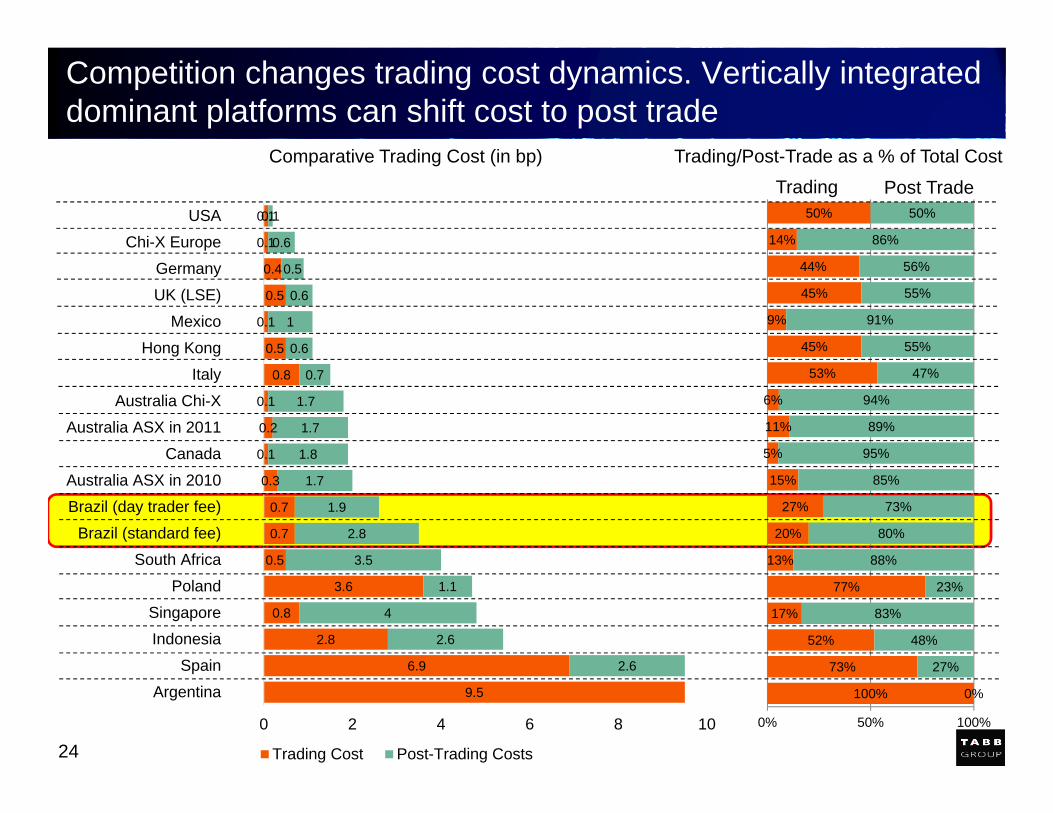
Competition changes trading cost dynamics. Vertically integrated dominant platforms can shift cost to post trade
9.5
6.9
2.8
0.8
3.6
0.5
0.7
0.7
0.3
0.1
0.2
0.1
0.8
0.5
0.1
0.5
0.4
0.1
0.1
2.6
2.6
4
1.1
3.5
2.8
1.9
1.7
1.8
1.7
1.7
0.7
0.6
1
0.6
0.5
0.6
0.1
0 2 4 6 8 10
ArgentinaSpain
IndonesiaSingapore
PolandSouth Africa
Brazil (standard fee)Brazil (day trader fee)Australia ASX in 2010
CanadaAustralia ASX in 2011
Australia Chi-XItaly
Hong KongMexico
UK (LSE)Germany
Chi-X EuropeUSA
Trading Cost Post-Trading Costs
100%
73%
52%
17%
77%
13%
20%
27%
15%
5%
11%
6%
53%
45%
9%
45%
44%
14%
50%
0%
27%
48%
83%
23%
88%
80%
73%
85%
95%
89%
94%
47%
55%
91%
55%
56%
86%
50%
0% 50% 100%
Trading Post Trade
Comparative Trading Cost (in bp) Trading/Post-Trade as a % of Total Cost

25
In a vertical model the Exchange, CCP and possibly the depository are affiliated
BrokersExchange CCP Depository
AlternativePlatforms
BarriersOperational,Technological,and/or Cost
26
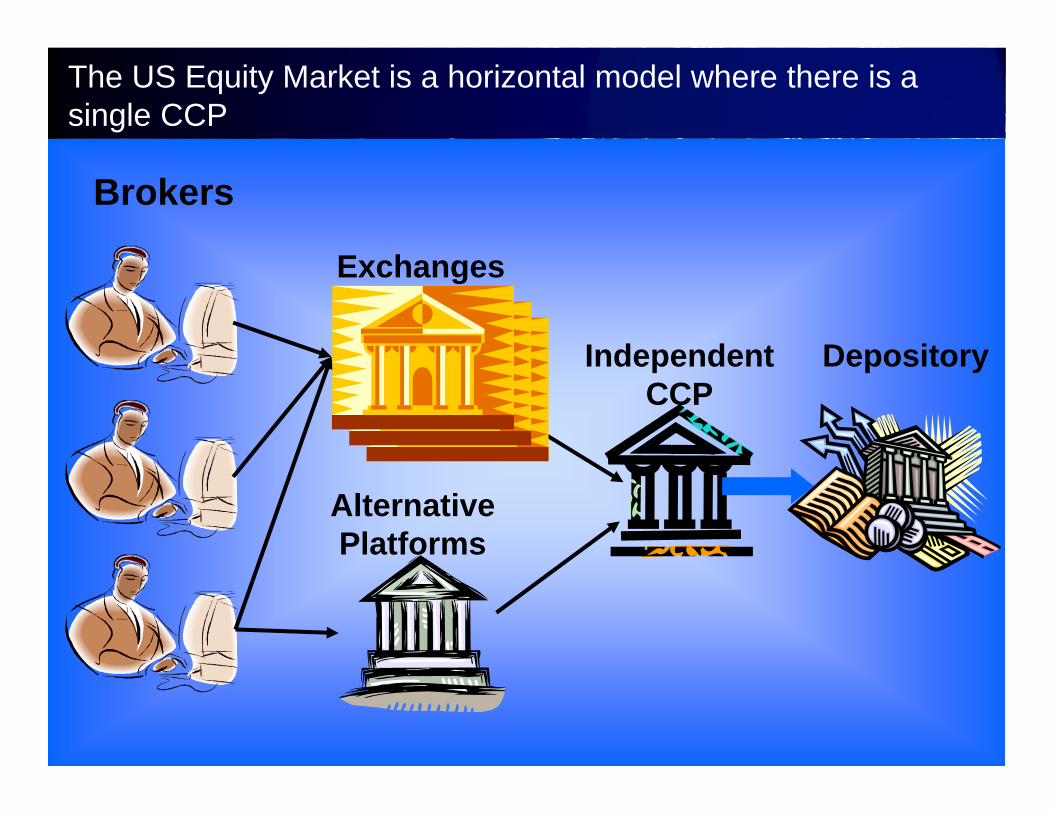
The US Equity Market is a horizontal model where there is a single CCP
Brokers
Exchanges
IndependentCCP
Depository
AlternativePlatforms
27
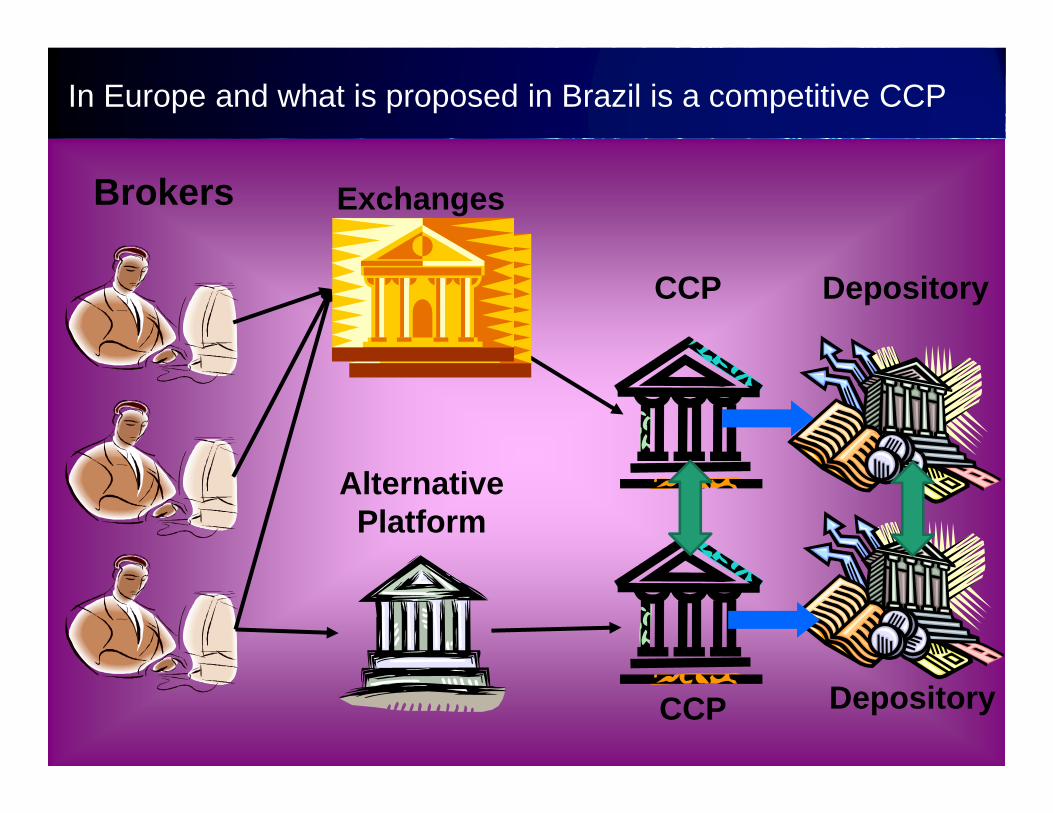
In Europe and what is proposed in Brazil is a competitive CCP
Brokers Exchanges
CCP Depository
AlternativePlatform
CCP Depository

28
DMA volume on Bovespa is gradually increasing – from 39% to 46% in Sept 2014
0%
10%
20%
30%
40%
50%
60%
70%
80%
90%
100%
DMA Non-DMASource ATB Brazil, TABB Group
DMA vs. Non-DMA Volumes (Bovespa)Monthly BM&F BOVESPA DMA percentage
46%4242394242444145374543413943384038423739%

29
Increasing DMA will increase buy-side algo usage to implement strategies, capture spreads, and provide liquidity
Source ATB Brazil, TABB Group
Estimated Buy Side Algorithm Usage in Brazil
30
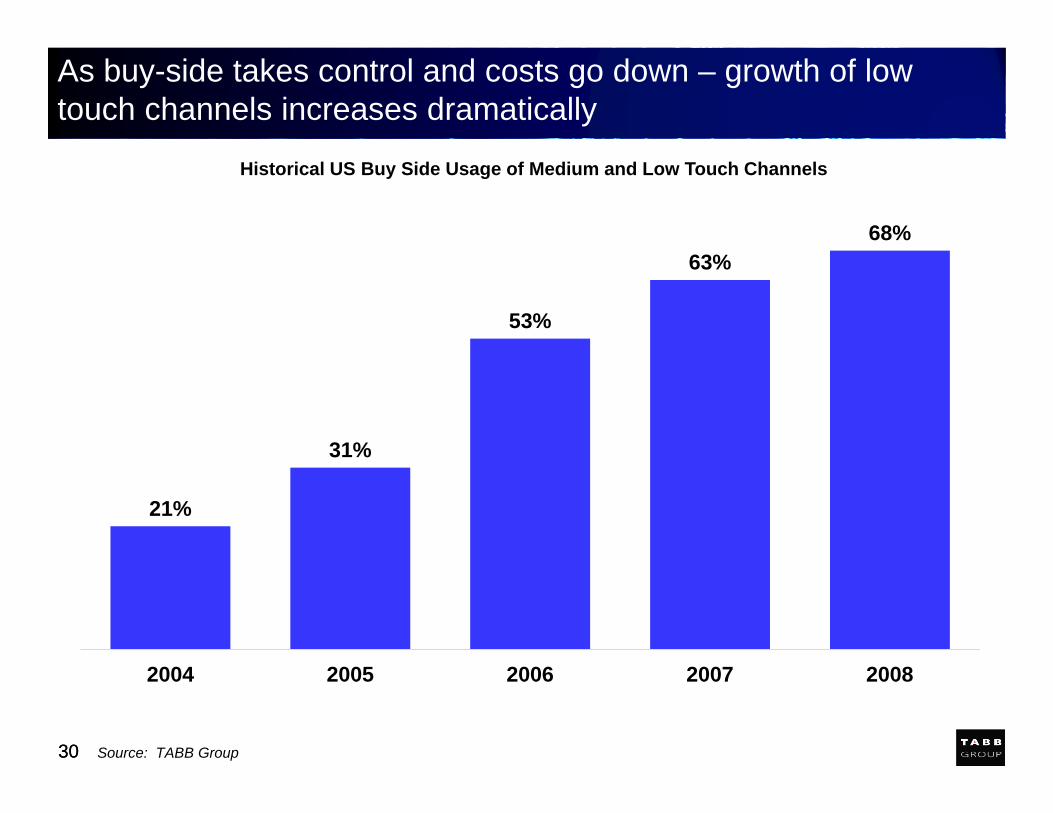
As buy-side takes control and costs go down – growth of low touch channels increases dramatically
30
21%
31%
53%
63%68%
2004 2005 2006 2007 2008
Source: TABB Group
Historical US Buy Side Usage of Medium and Low Touch Channels
31
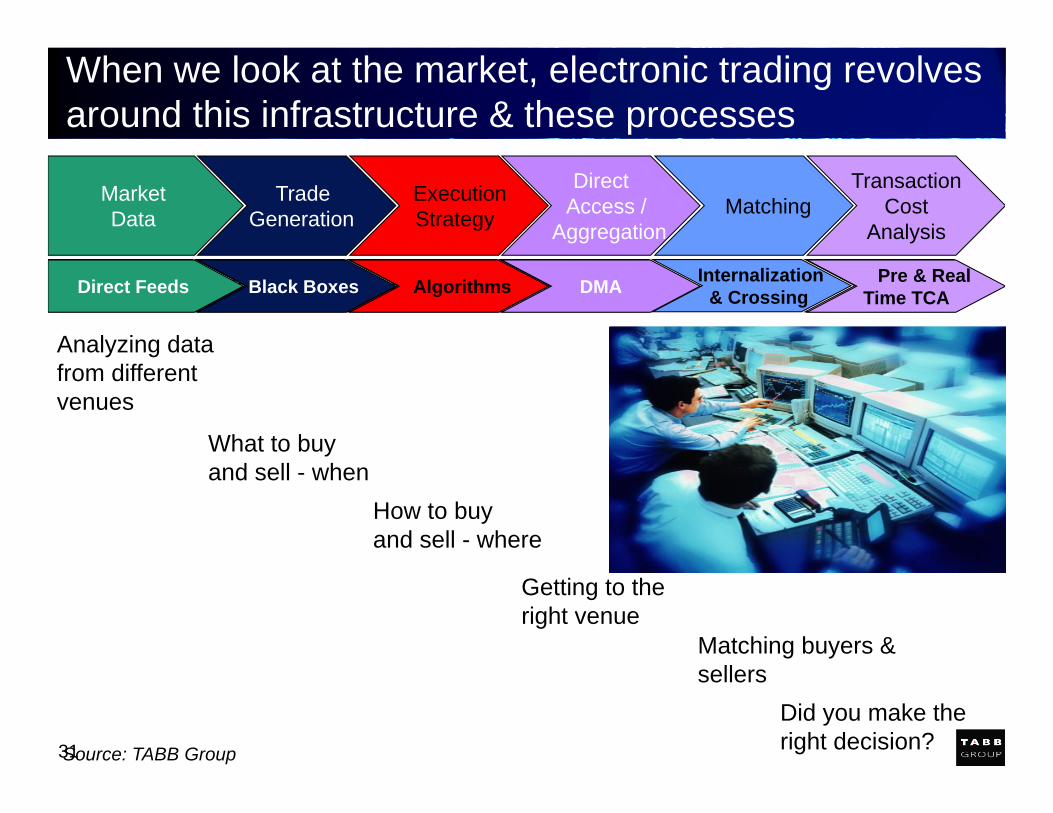
Direct Feeds Black Boxes Algorithms DMA Internalization& Crossing
Pre & RealTime TCA
When we look at the market, electronic trading revolves around this infrastructure & these processes
Source: TABB Group
MarketData
Analyzing data from different venues
Direct Feeds
Trade Generation
What to buy and sell - when
Black Boxes
ExecutionStrategy
How to buy and sell - where
Algorithms
DirectAccess /
Aggregation
Getting to theright venue
DMA
Matching
Matching buyers & sellers
TransactionCost
Analysis
Did you make the right decision?
Pre & RealTime TCA
32
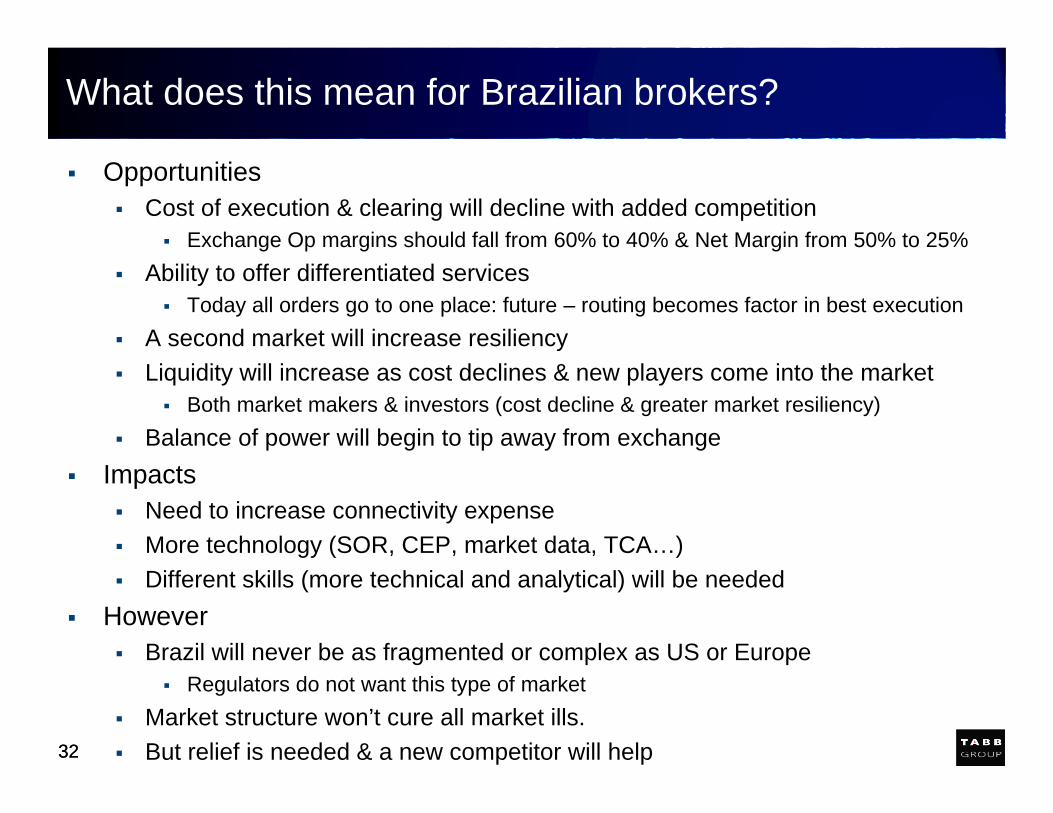
What does this mean for Brazilian brokers?
Opportunities Cost of execution & clearing will decline with added competition
Exchange Op margins should fall from 60% to 40% & Net Margin from 50% to 25% Ability to offer differentiated services
Today all orders go to one place: future – routing becomes factor in best execution A second market will increase resiliency Liquidity will increase as cost declines & new players come into the market
Both market makers & investors (cost decline & greater market resiliency) Balance of power will begin to tip away from exchange
Impacts Need to increase connectivity expense More technology (SOR, CEP, market data, TCA…) Different skills (more technical and analytical) will be needed
However Brazil will never be as fragmented or complex as US or Europe
Regulators do not want this type of market Market structure won’t cure all market ills. But relief is needed & a new competitor will help32
33
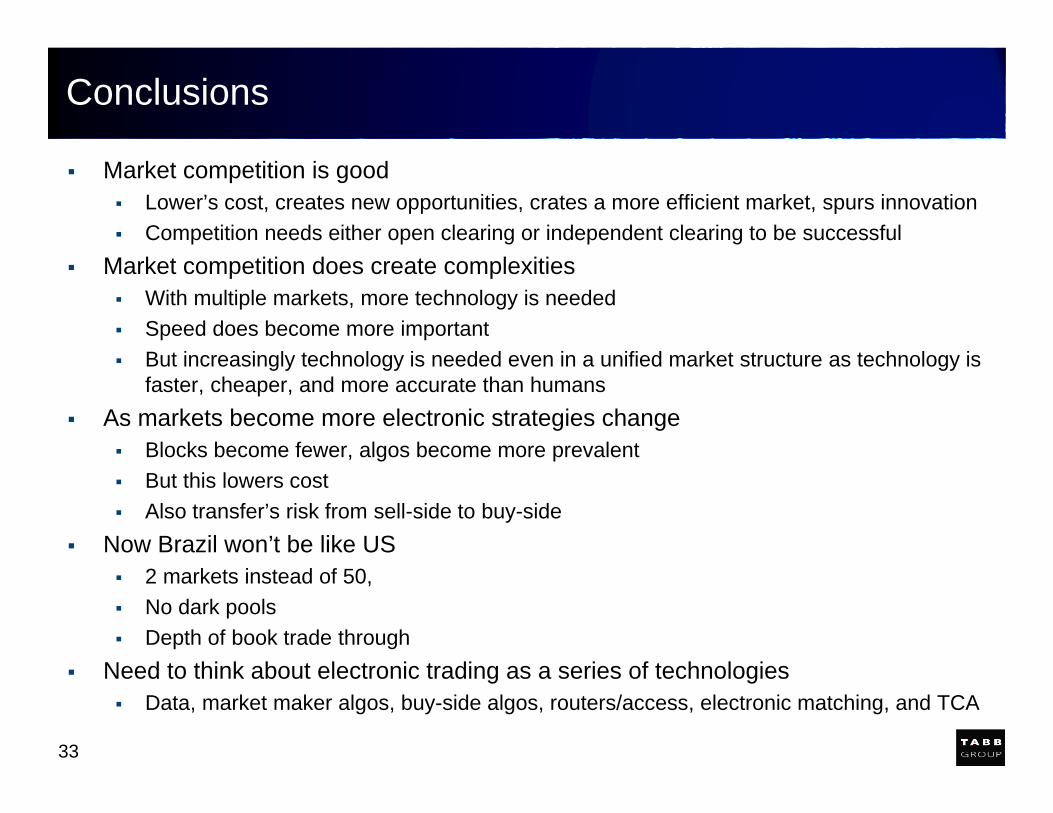
Conclusions
Market competition is good Lower’s cost, creates new opportunities, crates a more efficient market, spurs innovation Competition needs either open clearing or independent clearing to be successful
Market competition does create complexities With multiple markets, more technology is needed Speed does become more important But increasingly technology is needed even in a unified market structure as technology is
faster, cheaper, and more accurate than humans As markets become more electronic strategies change
Blocks become fewer, algos become more prevalent But this lowers cost Also transfer’s risk from sell-side to buy-side
Now Brazil won’t be like US 2 markets instead of 50, No dark pools Depth of book trade through
Need to think about electronic trading as a series of technologies Data, market maker algos, buy-side algos, routers/access, electronic matching, and TCA

ANCORD | Sao Paulo, Brazil | March 2015
Market Structure TrendsBrazil and Abroad
Presented by
Larry Tabb (Founder & CEO)