Embed Size (px)
Citation preview

Competition and the Structure of Vertical Relationships in
Capital Markets * †
John Asker Alexander Ljungqvist Stern School of Business Stern School of Business New York University New York University and CEPR
April 1, 2008
Abstract
We document that firms appear disinclined to share underwriters with other firms in the same industry. We show that this disinclination is evident only when firms engage in product-market competition. This leads us to suggest that concerns about information leakage may motivate the patterns we see in the data. We discuss how these effects help us understand how the investment banking industry is structured, how banks compete, and how prices are set. At each step we exploit sources of exogenous variation that correspond to specific margins on which the effects of interest directly influence incentives and choices.
Key words: Investment banking; Securities underwriting; Competition; Bank deregulation; Bank entry; Glass-Steagall Act; Commercial banks.
JEL classification: G21, G24, G28, K22, L11, L14, L84.
* A very early draft of this paper was circulated as “Sharing Underwriters with Rivals: Implications for Competition in Investment Banking”. We are grateful to Bruno Biais (the Editor), three anonymous referees, Robert Daines, Darrell Duffie, William Greene, Joy Ishii, Victoria Ivashina, Terrence Odean, Glenn Okun, Paul Pfleiderer, Johan Waldén, Nancy Wallace, Ivo Welch, Lawrence White, and Jeffrey Zwiebel for useful suggestions, and to seminar audiences at Stanford University, the University of California at Berkeley, the University of Southern California, Northwestern University, the Australian National University, Melbourne Business School, the University of Amsterdam, RSM Erasmus University, and the European Central Bank/CFS Joint Lunch Seminar for helpful comments. All errors are our own. † NYU Stern School of Business, 44 West Fourth Street, New York NY 10012. Asker: Phone 212-998-0062; fax 212-995-4218; [email protected]. Ljungqvist: Phone 212-998-0304; fax 212-995-4220; [email protected].

2
Competition and the Structure of Vertical Relationships in
Capital Markets
April 1, 2008
Abstract
We document that firms appear disinclined to share underwriters with other firms in the same industry. We show that this disinclination is evident only when firms engage in product-market competition. This leads us to suggest that concerns about information leakage may motivate the patterns we see in the data. We discuss how these effects help us understand how the investment banking industry is structured, how banks compete, and how prices are set. At each step we exploit sources of exogenous variation that correspond to specific margins on which the effects of interest directly influence incentives and choices.
Key words: Investment banking; Securities underwriting; Competition; Bank deregulation; Bank entry; Glass-Steagall Act; Commercial banks.
JEL classification: G21, G24, G28, K22, L11, L14, L84.

1. Introduction
Investment banks act as gatekeepers to the capital markets. Understanding how enterprises and
banks interact is thus a crucial component in understanding how the wider economy operates. When
a firm wishes to sell securities, it engages an investment bank to provide distribution services which
include underwriting, promotion, and certification. Thus, borrowing from the industrial organization
literature, firms and banks operate in a vertical market, with firms upstream and banks downstream.1
The finance literature documents that companies issuing securities tend to hire the same
investment banks over and over again, both in the bond market (Yasuda (2005)) and in the equity
market (Ljungqvist, Marston, and Wilhelm (2006)). Rather than employing long-term contracts or
vertical integration, which are commonly observed in other industries, the vertical structure of
investment banking is thus characterized by relationships.2 These relationships are often viewed as a
barrier to entry into investment banking.
We show that relationships endure in large part due to a desire to avoid sharing bankers with
one’s product-market competitors and present evidence that this affects pricing, and hence,
competition, among banks. Consider Figure 1, which establishes a new stylized fact, namely that
banks rarely serve more than one large firm in an industry. Using underwriting data from Thomson
Financial going back to 1975, Figure 1a shows that the fraction of U.S. underwriters with multiple
equity clients among the three, five, or ten largest firms in a four-digit SIC industry (ranked by
annual Compustat net sales) rarely exceeds 5-10%. In other words, over the past three decades, few
banks had more than one client among the largest firms in an industry. Debt underwriting
relationships, shown in Figure 1b, appear similarly exclusive (though the level of exclusivity is
somewhat lower than in the equity market).
1 Tirole (1987) and Rey and Tirole (2007) provide introductions to the theory of vertical markets. 2 For work on how contracting affects competition, see Gilbert and Hastings (2005), Asker (2004), Ho (2007), and Hortacsu and Syverson (2007).

2
Anecdotal evidence confirms that banks often refrain from working for competing firms. Hahn
(2003) reports a CEO telling a banker during a pitch, “If you talk to my competitors, you are no
longer welcome here.” The banker abandoned the pitch because he had a strong relationship with a
competitor, commenting, “Effectively, you have to pick your horse.”
What accounts for the observed patterns of vertical relationships shown in Figure 1? The null
hypothesis is that they reflect random matching between banks and firms; with sufficiently many
banks and industries, banks might randomly serve few competing clients. We test, and reject, the
null of such random matching in every piece of econometric analysis we conduct, at any
significance level. Hence, we investigate the alternative that the patterns may be a response to more
fundamental economic incentives. We consider three such possibilities.
First, a bank that works for two clients in the same industry uses the same resources to serve
both clients’ needs, as investment banking teams typically specialize by industry. If resources are
scarce, or time is of the essence, the bank may prioritize one client to the detriment of the other
client. While concerns about such capacity constraints may explain why two firms in the same
industry avoid sharing investment bankers, the reasons for doing so would be unrelated to actual
product-market contact between the firms. For example, prior to energy-market deregulation in the
U.S., two utilities in separate regional markets would be just as concerned about capacity
constraints as two firms in direct competition, such as Coca-Cola and Pepsi.3
Second, working for two clients in the same industry may give rise to conflicts of interest. A
prominent example is the bank’s conflicted role in situations where one of its clients launches a
takeover bid for the other client. Ivashina et al. (2005), for example, show that the likelihood of an
unsolicited takeover bid increases with the number of firms in a four-digit SIC industry a bank lends
to. If managers dislike becoming takeover targets, perhaps because they fear a loss of private 3 Our empirical investigation focuses on horizontal competitors. It is possible that a similar aversion to sharing underwriters extends to firms that are vertically related.
3
benefits of control, they have an incentive to avoid sharing investment bankers. Again, this
argument does not require any product-market contact.
Third, firms may be concerned that privileged information which the bank obtains in the course
of due diligence or other client contact is passed on to a competitor, whether explicitly, implicitly,
or accidentally.4 To return to the previous example, Coca-Cola has every incentive to prevent Pepsi
from learning about Coke’s production plans, product development, or distribution strategy. The
two regional utilities, on the other hand, would be less concerned about information leakage, at least
prior to deregulation. Thus, in contrast to the cases of capacity constraints and conflicts of interest,
product-market contact is a necessary condition for information leakage concerns.
Our empirical findings suggest that product-market competition is an important determinant of
the apparent exclusivity in issuer-bank relationships. Along with other evidence, this leads us to
suggest that firms’ reluctance to share underwriters is primarily due to concerns about information
leakage concerns. Such concerns have been modeled in the banking literature (see Boot (2000) for a
review). Raising capital from investors requires disclosure, to overcome adverse selection.
Bhattacharya and Chiesa (1995) model the choice between revealing confidential information to a
bank and public disclosure to the capital markets. Public disclosure suffers from a “two-audiences”
signaling problem: It lowers the cost of capital but could benefit product-market competitors. A
necessary condition for dealing with the bank then is that the bank not allow any sensitive
information to leak to rivals. If the bank cannot precommit to keeping information confidential, or is
unable to prevent accidental information leakage, competing issuing firms may seek to contain
information leakage by avoiding sharing banks with rivals.5
Anecdotal evidence supports this view. In a submission to a Competition Commission inquiry
4 We view information leakage as distinct from conflicts of interest. Information could leak accidentally or in ways that cannot be coordinated by the bank. 5 For related theory models, see Anand and Galetovic (2000, 2006), Baccara (2005), Baccara and Razin (2004), and Zabojnik (2002). An interesting empirical study of similar issues in the pharmaceutical industry is Azoulay (2004).

4
into equity underwriting in the UK (Competition Commission (1999)), the London Investment
Banking Association acknowledged that “Firms were understandably reluctant to make sensitive
information more widely known than necessary” and thus had an incentive to restrict their dealing
to a very limited number of investment banks. In the same inquiry, the submissions of Barclays
Global Investors and Prudential Portfolio Managers, on the investor side, and the Ladbroke Group
and CISCO, on the client side, raised the issue of information leakage in the context of underwriting
relationships.
In 1987, Citicorp, a frequent debt issuer, asked First Boston, its investment bank, to resign from
the underwriting syndicate of one of Citicorp’s competitors, Manufacturers Hanover. Eccles and
Crane (1988, p. 59) recount that “First Boston denied a conflict of interest, but Citicorp apparently
felt it was not worth the risk of having information […] in the hands of its competitor.” Similarly,
several disputes about information leakage have arisen in the M&A advisory context. Stuart (2006)
reports market rumors that Goldman Sachs resigned from an advisory role after being accused of
leaking confidential information from a previous engagement for the target to the bidder. Hahn
(2003) reports similar allegations arising in a lawsuit against UBS filed by a former client.
Consistent with the notion that exclusivity is more prevalent in industries where the demand for
secrecy may be higher, the data reveal greater exclusivity in relatively more concentrated industries,
in industries that are relatively more dependent on intangibles, and in industries characterized by
“soft” information (see Petersen and Rajan (2002) and Berger et al. (2005))). As Table 1 shows,
these patterns hold both in the equity and in the debt markets.
Prompted by these preliminary findings, our empirical strategy proceeds as follows. Using a
large set of equity and debt deals completed by large (and therefore strategically relevant) U.S.
firms in 1975-2003, we examine firms’ choices on margins that allow us to control for the costs and
benefits of sharing an investment bank. The costs may arise from either capacity constraints,

5
conflicts of interest, or the risk of information leakage. The benefits take the form of a bank’s
accumulated industry expertise: A bank serving other large firms likely has more experience of the
issuer’s industry, and thus greater credibility with investors, than a bank that has no other clients in
the industry. Identification requires that we vary the costs while holding the benefits constant.
To unravel these effects, we begin by using plausibly exogenous variation from mergers among
banks (Section 2). This enables us to hold industry expertise constant while varying the risk of
sharing an underwriter. We find that both equity and debt issuers are more likely to switch away
from their relationship bank if the merger increases the risk of sharing an underwriter than if it does
not change that risk or if the bank has not been involved in a merger. The effect is to increase a
client’s switching probability by around thirty percentage points from the unconditional mean.
The results from the bank-merger test indicate that far from being random, the patterns in Figure
1 are the result of deliberate actions by firms to avoid sharing investment banks with other firms in
their industry. In Section 3, we use industry deregulations as a source of exogenous variation in the
extent of product-market contact among firms within industries. If capacity constraints or conflicts
of interest account for the reluctance to share underwriters, firms without product-market rivals
should be just as averse to their investment bankers serving other large firms in their industry as
firms with product-market rivals, and deregulation should make no difference to their underwriter
choices. If, on the other hand, choices reflect concerns about information leakage, we expect firms
without product-market rivals to be indifferent to sharing underwriters prior to deregulation but to
exhibit increased reluctance as their industry is deregulated. We find that reluctance to share
underwriters is present only when firms have direct product-market rivals. Specifically, as an
industry deregulates and competition increases, issuers start avoiding banks with ties to their rivals.
The evidence from the deregulation test suggests that the patterns in Figure 1 are most
consistent with concerns about information leakage. To get a sense of the magnitude of this effect,

6
Section 4 exploits firms’ responses to a rival switching relationship banks. Our identifying
assumption is that when a rival client ends its banking relationship for exogenous reasons, the bank
continues to benefit from superior knowledge of the rival’s operations for a while but no longer
poses a risk that information might be leaked to the rival. Such a bank should thus be more
attractive to other companies in the industry. We find that issuers avoid banks with ties to their
product market rivals while showing a preference for banks that have recently lost clients in their
industry. An equity issuer, for instance, is around 55% less likely to choose a bank that presents a
risk of information leakage than one that does not.
These results suggest that leaving an existing bank carries the potential cost that the ex-
relationship bank’s incentive to contain information spillovers is diminished. If so, banks gain a
measure of hold-up power over their clients, which could help explain why underwriting
relationships tend to endure. This leads to the prediction that banks, appreciating that firms’
reluctance to share underwriters reduces the pool of competing banks, will charge higher fees. In
Section 5, we again exploit deregulations to show that banks increase their fees as product-market
contact among firms in an industry – and so concerns about sharing banks – increases. This suggests
that the vertical structure of the investment banking market has an impact on the fees banks charge.
Firms’ aversion to sharing underwriters appears important in understanding the dynamics of
vertical relationships in investment banking. In Section 6, we suggest that entry by commercial
banks appears to have played a role in relaxing the constraint on issuers’ underwriter choices since
1987 when the Federal Reserve began deregulating Glass-Steagall Act restrictions on commercial
banks’ underwriting activities. Entry has enabled large firms to establish relationships with multiple
banks, while banks continue to serve at most one large client per industry. These trends are
consistent with falling underwriting fees documented in the finance literature (see Gande et al.
(1997), Gande, Puri, and Saunders (1999), or Song (2004)).

7
2. Evidence from Bank Merger Activity
Is the apparently low incidence of large firms sharing underwriters, shown in Figure 1, random
or deliberate? In this section, we show how firms react to plausibly exogenous changes in the risk of
sharing an underwriter with another firm in the industry. The consolidation of investment banking
over the sample period provides the necessary exogenous shock.
2.1 Identification
Consider two banks, each serving one client firm in an industry. At some point the banks merge
and the clients find themselves potentially sharing an underwriter. Under the null that matches are
random, the firms don’t care, so the merger will have no effect. However, if the prospect of sharing
an underwriter generates some significant disutility, the merger will lead to one of the client firms
switching banks (though we cannot predict which).
We implement this as a difference-in-differences test. First, we compare the switching behavior
of firms whose relationship bank has, since their last securities issue, merged with a bank serving
other large clients in the industry (the treatment group) to the switching behavior of firms whose
relationship bank has merged with a bank lacking such relationships (control group 1). If sharing an
underwriter generates significant disutility, we expect greater switching in the treatment group.
Second, we compare both groups to firms whose relationship bank has not undergone a recent
merger (control group 2). This allows evaluation of the extent to which mergers induce switching
for reasons unrelated to concerns about sharing underwriters.
Difference-in-differences tests are commonly used to remove biases due to omitted variables or
endogeneity concerns (Ashenfelter and Card (1985)). In our setting, the underwriter’s industry
expertise, skill in executing the transaction, or some other unobserved quality variable may be
positively correlated with the presence of a rival firm among its clients. This would negatively bias
estimates that do not exploit sources of variation that are independent of industry expertise or

8
similar unobservable factors. The test structure proposed avoids such biases because the industry
expertise of the population of banks, other than the merging banks themselves, is unaffected by the
merger and, thus, is held constant. Likewise, it allows us to eliminate the effect of not controlling
adequately for a bank’s skill in executing the transaction or some other quality variable. If these
were driving a firm’s lead manager choice, we should find no difference, following a bank merger,
in the switching behavior of firms in those industries where the banks have competing clients (the
treatment group) and those where they do not (control group 1).6
2.2 Are Bank Mergers Plausibly Exogenous?
There were 202 mergers involving sample banks over the 1970-2003 period, with some banks
being serial acquirers. Figure 2 shows three distinct merger waves, with the last one, beginning in
1994 and ending in 2001, the most active. Our identification strategy requires a bank not just to
merge, but to merge with a bank that has clients in the same industry. As it turns out, this is rarely
the case. Among the 202 mergers, only 12 and 19 involve overlaps in the two banks’ large equity
and debt clients, respectively. Generally, when a merger involves overlap, the extent of overlap is
small. On average, only 6.7% (12%) of the combined number of industries in which the merging
banks served large equity (debt) clients overlap. Conditional on overlap, the average merger
involves 3.9 industries in which both banks have large equity clients (47 industries in total) and 6.3
industries in which both banks have large debt clients (119 industries in total).
Our experiment requires that banks merge for reasons that are unrelated both to the existence of
overlap among their large clients and to those clients’ anticipated switching decisions. Scanning
news sources available through Factiva for the merger reasons we find no mention of client overlap
considerations. Instead, banks appear to motivate their mergers in strategic and synergistic terms.
6 A merger may change a bank’s underwriting capability. Control group 1 allows us the control for this, since any change in such capability should have an equivalent effect on both the treatment group and control group 1. That is, the difference between the effects on these two groups nets out any change in the bank’s underwriting capability.

9
As Figure 2 shows, many mergers involve acquisitions of investment banks by commercial
banks, such as the 1999 acquisition of investment banking boutique Hambrecht & Quist by Chase
Manhattan. Due to Glass-Steagall constraints, commercial banks traditionally had few large
investment banking clients on the debt side and even fewer (or none) on the equity side, which
contributes to the low degree of industry overlap we find in our data. Acquisitions of (mostly niche-
oriented) investment banks were seen as a way to expand market share as Glass-Steagall constraints
were relaxed throughout the 1990s (see, for instance, Weidner (1999)).
In several other cases, investment banks with a primarily institutional focus acquired investment
banks with extensive retail franchises, reputedly in an attempt to expand their distribution
capabilities. Examples include the 1997 acquisition of Salomon Brothers by Travelers Group,7
owner of retail brokerage firm Smith Barney; Morgan Stanley’s 1997 acquisition of retail brokerage
firm Dean Witter; and UBS’s 2000 acquisition of PaineWebber.8
Occasionally, investment banks were acquired after being weakened by idiosyncratic shocks.
For example, Kidder Peabody was acquired by PaineWebber in 1994 after it emerged that Kidder’s
head of government trading had created phantom trades to increase his bonus (see Siconolfi (1994)),
while BT Alex. Brown was acquired by Deutsche Bank in 1999 after reportedly losing $850 million
in the Long-Term Capital Management crisis in 1998 (see Leander (1999)).
A rare example of a “voluntary” merger between two banks with similar strengths and thus
material client overlap is the acquisition of Donaldson, Lufkin & Jenrette by CS First Boston, which
overlapped in 23 industries for debt clients and 11 industries for equity clients. Why did they
nonetheless merge? According to Sikora (2000), “DLJ brings First Boston a market-leadership
position in high-yield bond [trading], a merchant banking portfolio, a middle market M&A practice,
7 Reportedly, CEO “[Sandy] Weill […] emphasized that the primary reason for the Salomon [Brothers] acquisition is to expand Smith Barney’s global reach.” See Investment Dealers Digest, Nov. 10, 1997. 8 Sikora (2000) notes that “PaineWebber largely was coveted by Swiss-based UBS for its retail securities network and its lucrative business of providing investment services for high net worth people.”

10
and an Internet-based securities trading arm while also gaining the chance to expand in Europe.”
While we have found no anecdotal support for the existence of unobservables that correlate both
with banks’ merger reasons and their clients’ anticipated switching decisions, our empirical
specifications include bank-specific effects in an effort to mitigate potential omitted variable biases.
Another potential concern is reverse causality. It is possible that a bank acquires another bank
for defensive reasons, because it anticipates the loss of a key client.9 If so, we would erroneously
attribute increased switching in overlapping industries to companies’ reluctance to share
underwriters rather than the bank’s desire to make up for a client loss it knew was going to happen
anyway. If such reverse causality were a feature of the data, it would imply that acquirers lose more
clients than targets. Controlling for whether a company’s previous underwriter was the target or
acquirer in the bank merger, we find no support for this implication.
Finally, instead of switching, firms could choose not to raise external finance when their usual
underwriter begins to serve a rival client following a bank merger. This selection effect would lead
to downward bias in the estimation of the coefficient of interest.
2.3 Data
To implement the difference-in-differences test, we estimate the probability that an issuer
switches lead managers in consecutive equity or debt deals. Following the literature, a switch is
defined as an equity (debt) issuer hiring as lead manager any bank other than the lead manager of its
most recent equity (debt) deal (or, if that bank has since been acquired, its successor).10,11
Throughout the paper, we focus on underwritten transactions by non-financial and non-
governmental U.S. issuers completed between 1975 and 2003 (though we include 1970-1974 data to
construct certain lagged variables). As Table 2 shows, there were 19,331 equity and 30,797 debt 9 We thank a referee for alerting us to this possibility. 10 In the case of multiple lead managers, we code as a switch any failure to retain every lead manager from the previous deal. This is the most logical way to code the data, but our results are not sensitive to this coding choice. 11 Many banks specialize either in equity or debt underwriting, so we follow the literature in modeling equity and debt underwriting choices separately. See, for instance, Yasuda (2005) or Ljungqvist, Marston, and Wilhelm (2006).

11
offerings by U.S. non-financial issuers between 1975 and 2003, according to Thomson Financial.
For estimation purposes, we require that each deal was lead-managed by one of the 50 largest
underwriters ranked by market share in the year of the offering and discard deals underwritten by
smaller banks. The 50 largest banks account for at least 85% of equity and 95% of debt capital
raised in any given year. Furthermore, we focus on the ten largest firms (by Compustat net sales) in
each four-digit SIC industry; only large firms have sufficient issuing volumes for capacity
constraints to be a significant concern and large enough market shares to expect interactions in the
product market to have a strategic element.12,13,14 To avoid biased inferences if issuers pre-select
their lead managers for a program of debt deals spaced some months apart, we also exclude so
called debt “shelf registrations.”15 This leaves 12,016 deals by 3,353 companies in 418 four-digit
SIC industries raising $1.3 trillion in constant 1996 dollars. These deals account for 24% of the
deals completed and 27.9% of the amount raised by U.S. non-financial companies in underwritten
offerings over the period 1975-2003. As Table 2 shows, nonconvertible bond and common stock
offerings account for the majority of deals and proceeds.
For the purpose of implementing the difference-in-differences test, we further exclude first-time
deals, which cannot involve a switch (though we include 1970-1974 data when identifying first-
time deals). This leaves 3,198 equity deals and 4,341 debt deals over the 1975-2003 sample period.
2.4 Bivariate Results
On average, large firms switch lead managers in 52.4% of the equity deals and 62.0% of the
12 This is based on a firm’s primary SIC code. To the extent that firms operate in multiple industries, this is a potential source of measurement error which would tend to bias our estimates towards zero. We have repeated each of our tests in a restricted sample of single-segment firms. This reduces the available sample by more than 90%. Where tests can still be estimated, we find results that are both qualitatively and quantitatively similar to those reported in the paper. 13 The product-market share of the tenth largest Compustat firm in the average industry between 1975 and 2003 is 1.5%, with a range from nearly zero to 6.1%. This puts an upper bound on the market shares of excluded firms. 14 If, instead, it is the small players that avoid sharing underwriters, our approach biases us against finding that reluctance to share underwriters has an impact on lead manager choice. 15 See Foster (1989); Denis (1991) documents that equity issuers virtually never make use of shelf registrations.

12
debt deals.16 Of the 3,198 equity deals, 630 follow a merger involving the bank lead-managing the
issuer’s previous deal. In 49 of these, the previous lead manager merged with a bank that had a
relationship with another top 10 firm (defined as having lead-managed at least one equity issue for
another firm ranked in the top 10 in the prior five years); focusing on firms ranked in the top 3,
there are 18 cases. These events are clearly associated with increased switching: 17 of the 18 issuers
(94.4%) and 38 of the 49 issuers (77.6%) switch in response to their relationship bank merging with
the relationship bank of a top 3 or top 10 firm, respectively. For comparison, mergers with banks
lacking relationships in the industry (control group 1) are followed by a 63.3% switching rate while
issuers whose relationship bank has not undergone a recent merger (control group 2) switch 49.5%
of the time. Statistically, the switching rates of the two control groups are significantly lower than
those of the treatment groups (at the 2% level or better), and they are not significantly different
from each other. This provides evidence against the null of random matching: Issuers are no more
or less likely to switch underwriters if their relationship bank has undergone a merger, unless the
merger resulted in sharing an underwriter with another large firm in the industry.
The corresponding results for debt issuers are statistically weaker. Of the 4,341 debt deals, 296
follow a merger. In the 23 (14) cases involving a target bank with relationships among the ten
(three) largest firms in the issuer’s industry, switching occurs 78.3% (85.7%) of the time. The
switching rate for the two control groups is 61.8% if the merger involved no overlap and 63.3% in
the absence of a merger. The switching rate in the 14 treatment cases is marginally significantly
higher than in the two control groups (p=0.089 and p=0.066, respectively).
2.5 Multivariate Results
The bivariate results provide preliminary support for the hypothesis that issuers derive disutility
from sharing an underwriter. However, they make no attempt to control for other determinants of 16 For comparison, Ljungqvist and Wilhelm (2005) report a 35.9% switching rate between a company’s IPO and its first seasoned equity offering. Thus, firms appear to switch lead managers more frequently as they mature.

13
the switching decision. Prior literature suggests that firms have a tendency to stick with their
previous underwriter (Ljungqvist, Marston, and Wilhelm (2006)), to prefer prestigious banks
(Krigman, Shaw, and Womack (2001)), and to switch the more time has elapsed since their last deal
(Fernando, Gatev, and Spindt (2005)). We thus control for the strength of the firm’s relationship
with its previous underwriter, four proxies for the previous underwriter’s reputation which we
borrow from prior work, the size of the firm (using log real sales), and the log time since the firm’s
previous deal. Table 3 summarizes the construction of each control variable and lists relevant
sources. In addition, we control for lead manager-specific random effects17 and year fixed effects.
The latter control for the possibility that mergers involving banks with competing clients might
cluster in certain years which might also happen to be years with high frequencies of switching.
Table 4 reports the results of probit models of switching.18 The control variables confirm prior
evidence. Issuers are less likely to switch the stronger their relationship with the bank, the larger the
bank’s debt market share, if its bank is highly regarded by its peers (as measured by eigenvector
centrality, a standard measure of social networking), and if the bank’s clients tend to be more loyal.
Switching propensity also increases with firm size and time since the previous deal. We also include
a dummy variable indicating if the issuer’s pre-merger lead manager was the target in the merger. If
the target bank bears the brunt of post-merger layoffs and firms switch in response to the resulting
organizational upheaval, then the coefficient on the target dummy should be positive and
significant. Under the reverse causality argument outlined in Section 2.2, the coefficient should be
negative and significant. The insignificant coefficients suggest that neither story appears to be an
important component of the data generating process.
Controlling for these factors, we find a higher switching propensity among both equity and debt 17 We use random effects as fixed-effects probit (or logit) suffers from an incidental parameters problem. In unreported robustness tests using bank fixed effects in a linear probability model, we find that the results are unaffected. 18 Results are robust to alternative assumptions about the distribution of the error term, including: Random-effects logit; probit or logit without lead manager-specific random effects or without year effects; fixed-effects linear probability models; complementary log-log (extreme value) distribution; and Gompertz distribution (results available on request).

14
issuers following mergers involving a bank serving a top 3 firm (the treatment group). In column
(1), equity issuers in the treatment group are more prone to switching, both compared to mergers
that involve no client overlap (control group 1; p=0.043) and when there has been no merger
(control group 2, the base category in column (1); p=0.042); there is no difference in switching
between control groups 1 and 2 (p=0.860). In column (3), debt issuers in the treatment group switch
more often than firms in control group 1 (p=0.076) and those in control group 2 (p=0.010).
Economically, the treatment effects are very large. The average switching rate in the equity
treatment group is 31.1 and 31.4 percentage points greater than in control groups 1 and 2,
respectively, holding all other covariates in col. (1) at their sample means. The corresponding
numbers for the debt treatment group shown in col. (3) are 27.5 and 34.7 percentage points,
respectively. These differences are in line with those reported earlier for the bivariate comparison,
indicating that the control variables included in Table 4 have little effect on this result. Like the
bivariate difference-in-differences test, the probit results provide evidence against the null of
random matching: Issuing firms do switch underwriters following mergers that upset the
equilibrium match between banks and firms in their industry.
The evidence regarding sharing underwriters with smaller firms (those ranked 4th through 10th)
is more mixed. While the coefficients are positive for both equity and debt issuers, we find a
statistically significant effect only in the debt sample (see column (3)).
In columns (2) and (4) we exclude control group 2 to focus on firms whose previous lead
manager has undergone a merger since the issuer’s last deal. The positive coefficients estimated for
firms in the treatment group confirm that it is a merger with a bank that has relationships with other
large firms in the industry, rather than a merger per se, that induces greater switching. This provides
additional evidence suggesting that firms do not switch underwriters simply to avoid any upheaval
accompanying mergers.

15
3. Evidence from Deregulation
The results of the bank-merger test support the interpretation that firms are reluctant to share
underwriters. What accounts for this reluctance? As we outlined in the introduction, three plausible
explanations are concerns about capacity constraints, conflicts of interest (for example, in takeover
contests), or information leakage. As we argued, product-market contact is a necessary condition
only for the information leakage story. Firms in the same industry that are shielded from
competition by statute should be just as concerned about capacity constraints and conflicts of
interest as firms that compete with each other in the product-market. If capacity constraints and
conflicts of interest lead to disutility from sharing underwriters, product-market deregulation should
make no difference to their underwriter choices. However, if choices reflect concerns about
information leakage, we expect firms without product-market rivals to be indifferent to sharing
underwriters prior to deregulation, because such leakage would not put them at a strategic
disadvantage absent competition, while their reluctance should increase following deregulation.
3.1 Identification and Modeling
To test this prediction, we focus on transactions from those four-digit SIC codes that are subject
to a significant deregulatory (competition-increasing) shock over the sample period, as identified by
Viscusi, Harrington, and Vernon (2005), a standard textbook on regulation and antitrust. We list
these in Table A1 in the Appendix. Examples include the 1978 Airline Deregulation Act, the partial
deregulation of the trucking industry in the 1980 Motor Carrier Reform Act, and the 1992 Energy
Policy Act which introduced wholesale competition in electrical power. Twenty-three of the
deregulating industries identified by Viscusi et al. are represented in our sample.
Under the null that capacity constraints or conflicts of interest account for issuers’ reluctance to
share underwriters, we expect issuers to avoid choosing underwriters that serve other large firms in
their industry, both before and after deregulation. Under the alternative hypothesis of information
16
leakage, we expect issuers to be indifferent to a bank’s other relationships before deregulation but to
avoid their rivals’ relationship banks after deregulation.
Due to the small number of cases in the intersection of bank mergers and deregulating
industries, we cannot adapt the difference-in-differences approach of Section 2. Instead, we estimate
a standard model of underwriter choice (see, for instance, Bharat et al. (2007), Yasuda (2005), or
Ljungqvist, Marston, and Wilhelm (2006, 2007)). The unit of observation is a potential firm-bank
pairing. The firm, having decided on the form of financing (i.e., debt or equity), chooses one or
more banks to act as lead manager. Following Ljungqvist, Marston, and Wilhelm (2007), we take
the issuer’s choice set to be the 50 largest banks by market share.19 Their combined market share
averages 96.5% in the equity market and 99.5% in the debt market.
Identification should come from the deregulation events and not some unobserved confounding
events. Ideally, therefore, we would want to restrict the sample to a narrow window before and after
each deregulation event. Sample size considerations lead us choose a ten-year window centered on a
deregulation event. This leaves us with 126 equity and 570 debt transactions.
Each issuing firm k is modeled as having a utility kjtjtkjtjtkjt xRu εηνβα ++++= associated
with giving each of the 50 competing banks j a lead manager mandate, where Rjt = 1 if bank j
already has another large client in the issuer’s four-digit SIC industry, the xkj are other determinants
of lead manager choice, tν and jη are year and bank-specific effects, respectively, and εkj is an
observation-specific idiosyncratic shock that is assumed to have a normal distribution. Faced with
these utilities over choices, each firm chooses the bank associated with the greatest utility. The
resulting model is estimated as a standard multivariate probit.20
As in the bank-merger test, we control for the strength of the firm’s relationship with the 19 By construction, a commercial bank is treated as competing for a lead-management mandate prior to the repeal of the Glass-Steagall Act only if it had a so called Section 20 subsidiary with the relevant securities underwriting authority. 20 Our results are robust to alternative assumptions about the distribution of the error term, including random-effects logit and fixed-effects linear probability models. These results are available on request.
17
candidate bank, the four proxies for bank’s reputation, log firm sales, and lead manager and year
effects. Unlike in the bank-merger test, we cannot rely on a difference-in-differences argument to
remove biases due to omitted variables. A likely omitted variable is a bank’s industry expertise,
which correlates both with serving other large firms in the industry and with a higher selection
probability. We therefore include a proxy for industry expertise, measured as the combined
concurrent product-market share of a bank’s clients in the issuer’s four-digit SIC industry. Product-
market shares are computed from annual Compustat net sales data.
3.2 Results
To test the hypothesis that exposure to competition makes firms more reluctant to share
underwriters, we allow the slope coefficients to vary between deals completed before the year of the
first deregulatory shock (“pre”) and those completed afterwards (“post”).21 The results shown in
Table 5 support this hypothesis. In deals completed pre-deregulation, the effect of a bank having
served one of the three largest firms in the issuer’s industry is insignificant, suggesting that issuers
were indifferent to whether a bank serves other large clients in the industry with whom they had no
product-market contact. Post-deregulation, in contrast, the coefficient is significantly negative in the
equity market (p=0.009). In the debt market, it is large and negative but somewhat imprecisely
estimated (p=0.114). Moreover, we find evidence that debt issuers avoid underwriters serving
smaller rivals (those ranked fourth through tenth in their industry) post-deregulation. A Wald test
rejects the equality of the rival-client coefficients pre- and post-deregulation in the equity sample
(p=0.058)22 though not in the debt sample (p=0.284). This suggests that product-market contact
contributes to firms’ apparent reluctance to share underwriters with other large firms in their
industry, particularly in the equity market.
21 In some instances, industries were deregulated in phases. It is reasonable for everyone to assume that once deregulation starts, it will continue. We therefore focus on the first significant deregulation event in each industry. 22 The bank-specific effects are insignificant. Dropping them, this Wald test is significant with a p-value of 0.013.

18
Might this result be driven by omitted variables? Deregulation events may, to some extent,
coincide with banking deregulation. This could mechanically drive our result if entry into the
securities underwriting market reduces a bank’s likelihood of serving multiple large clients. While
our specifications include year and bank-specific effects, these may not be sufficient to completely
remove potential omitted variable biases. We therefore turn to a Monte Carlo simulation.
Under the information leakage hypothesis, we expect a change in the degree of reluctance to
hire a bank that serves a large rival only among issuers whose industries are being deregulated. In
non-deregulating industries, we expect no significant change around the deregulation dates, unless
those dates coincide with other, unobserved developments that affect all industries to some extent.
To test this counterfactual, we draw 500 random samples of 13 non-deregulating industries each
(without replacement), match each industry randomly to one of the six deregulation dates shown in
Table A1 that are relevant for the equity sample, and then test whether the “pre” and “post”
coefficients estimated for the rival-client variable are different when we re-estimate the Table 5
specification for equity issuers in these non-deregulating industries. Using a Wald test as above, we
reject the null of equal coefficients at the 5% level in 28 of 500 simulations (5.6%). This indicates
the test has near-perfect size.
In sum, based on the Table 5 results, we are “94.2% confident” (1-0.058) that there is a change
in the reluctance to share underwriters among equity issuers from deregulating industries, and based
on the simulation evidence, we are “94.4% confident” (1-0.056) that there is no corresponding,
contemporaneous change in the reluctance to share underwriters in non-deregulating industries.
Economically, the effects in Table 5 are large. Post-deregulation, a relationship with an issuer’s
top 3 rival reduces a bank’s chances of lead-managing an equity deal by 32.8%, from the one in 50
unconditional likelihood, holding all other covariates at their sample means. Compared to the two
variables identified in prior work as the main determinants of underwriter choice, the effect of rival

19
relationships is larger than that of a one-standard-deviation increase in bank-issuer relationships
(+13.7%) or the bank’s reputation (+20.3%, as measured by eigenvector). The pattern is similar
though economically smaller for debt issuers.
Summarizing the effects of the controls, we find that a candidate bank’s chances of becoming
lead manager improve significantly, the stronger its prior underwriting relationship with the issuer;
the greater its market share and reputational standing; and the greater its industry expertise. These
findings mirror those in the bank-merger test presented in Section 2.
4. Evidence from Client Switching
The evidence in Section 3 is most consistent with the hypothesis that firms avoid sharing banks
due to concerns that confidential information might be leaked to rivals. If the information leakage
hypothesis is true, information concerns may be offset not only by greater industry expertise as
argued before, but also by the potential for a firm to benefit from sharing a bank because it might
learn useful information about a rival. That is, there are both costs and benefits to information
leakage. We now attempt to disentangle these costs and benefits, and in so doing, estimate the
economic magnitude of the costs under the maintained assumption of information leakage.
4.1 Identification
Identification exploits firms’ responses to a rival discontinuing a banking relationship. Our
identifying assumption is that a rival’s switch away from its former relationship bank presents an
attractive opportunity for other firms in the industry. This bank has both general industry expertise
and specific knowledge of the rival, both of which are beneficial to an issuer, but following the end
of the relationship with the rival, there is no longer a risk of information leakage. In contrast, banks
that continue to serve rivals have general industry expertise and offer both an information benefit
(in the form of specific knowledge of the rival) and an information cost (in the form of possible
information leakage). By comparing the propensity of firms to match with these two types of

20
underwriters, we can isolate the cost of information leaking to a rival via a shared underwriter.
This identification strategy makes three assumptions:
1) A bank’s industry expertise and other unobserved quality attributes are unaffected by the
switch, at least within the timeframe after the switch we consider.
2) The information benefit is unaffected by the switch.
3) The client switch is orthogonal to any bank unobservables, i.e., the switch is exogenous.
Assumption 3) would be violated if firms switch underwriters when quality of service has
deteriorated. Thus, we run the risk of our treated banks being poor quality relative to the untreated
set, which would decrease the estimated magnitude of the cost of information leakage. Conversely,
a firm may switch because it knows that its usual underwriter will soon work for a competitor,
reducing its capacity. Or having lost a client, a bank may cut its fees in an effort to keep its industry
desk occupied.23 In either case, a positive correlation between the probability that a given bank is
chosen as lead manager and the fact that it has recently lost a client would be unrelated to
information leakage, and so we would overestimate the information leakage effect.
To address possible biases introduced by these sorts of stories, we use merger activity among
issuing firms to identify plausibly exogenous switches, in addition to a more data-driven definition
of a discontinued relationship. We discuss the precise nature of these two approaches below.
4.2 Discontinued Relationships
We focus on two types of discontinued relationships. First, we consider a firm’s rival to have
switched relationship banks if the rival was acquired by another firm at some point in the five years
preceding the deal for which an issuing company is selecting a lead manager. We use CRSP
delisting codes 200 and 300 to identify acquisitions. Our maintained assumption is that the (rival)
merged firm’s CFO will most likely use the bank with which he has an existing relationship, leaving 23 However, coding lost clients as in Section 4.2 below, we find no evidence that banks cut fees after losing clients, controlling for other common determinants of fees as in Section 5 below.

21
the target’s relationship bank in the position of having lost an important (rival) client.
The second type of switch exploits variation in the duration of relationships. We deem a firm’s
rival to have switched if it has awarded no underwriting business to its previous relationship bank
for T years. T is arbitrary, and we report results for T=3 and T=5. Within T years of its most recent
deal, a rival firm is coded as an active client of the bank’s. After T years, it is coded as a former or
inactive client. We assume the bank’s information about the rival client to decay following a switch,
and so code the bank as having an inactive rival client for only one year following the switch (i.e.,
in year T+1). Beyond that, the bank is coded as no longer having a rival client in the industry.
4.3 Estimation
We implement the client-switching identification strategy by adapting the probit model of the
previous section. Specifically, we adjust the reduced-form utility of a company k choosing bank j,
kjtjtkjtjtkjt xRu εηνβα ++++= (where Rjt = 1 if the bank has a rival client in k’s industry), so that
kjtjtkjtsjt
nsjtkjt xRRu εηνβγα +++++=
where nsjtR = 1 if bank j has a large rival client in the issuer’s industry and that client has not
switched (i.e., it remains an active rival client) and sjtR = 1 if the bank had a large rival client that
has recently switched (i.e., an inactive rival client). We estimate this model in the whole sample
(not just for deregulating industries). This sample is described in block (2) of Table 2.
To see where identification is coming from, we decompose α̂ and γ̂ . Let
α̂ = industry expertise + information benefit + information cost
γ̂ = industry expertise + information benefit
so that γα ˆˆ − = information cost
The function γα ˆˆ − can be constructed from estimated parameters; standard errors are computed
using the delta method (see Greene (2003, p. 916)). Under the hypothesis that firms avoid sharing

22
underwriters to minimize the risk of information leakage, the sign of γα ˆˆ − should be negative.
4.4 Results
Table 6 reports the three probit specifications, using firm mergers and client switches with T=3
and T=5, respectively, to identify active and inactive rival clients. To conserve space, we report
only the coefficients estimated for the active and inactive rival relationship dummies and the
difference between the two. As per the above decomposition, this difference measures the net effect
of concerns about information leakage. The control variables behave in line with those shown in the
deregulation models in Table 5.24
The results provide support for the hypothesis that information spillover concerns have a first-
order effect on firms’ choice of lead manager. The function γα ˆˆ − is consistently negative and
significant in five of the six specifications for the case of top 3 rivals. The economic magnitude of
the information cost, shown in the columns labeled dF/dx, is very large. An equity issuer, for
instance, is around 55% less likely to choose a bank that presents a risk of information leakage than
one that does not. Debt issuers have a zero probability of choosing such a bank.
Relationships with smaller rivals (those ranked fourth through tenth in an industry) also have a
negative effect on a bank’s chances of being hired as lead manager, though this effect is both
statistically and economically weaker.
Finally, note that γ̂ is not only mostly positive and significant but also frequently large
economically. Depending on the specification, a bank is between 42% and 132% more likely to be
chosen if it used to have relationships with one of the issuer’s main rivals. This suggests that
industry expertise and an intimate knowledge of key rivals do play a key role in underwriter
selection, consistent with our identification strategy.
24 Our results are robust to alternative assumptions about the distribution of the error term, including random-effects logit and fixed-effects linear probability models. These results are available on request.

23
5. The Price of Exclusivity
Deregulation allows us to explore possible pricing consequences of a reluctance to share banks.
If such a reluctance is well-founded (reflecting, say, information spillover concerns), it reduces an
issuer’s effective choice set and thus competition. Depending on the magnitude of information
leakage concerns, it may even give the bank hold-up power because ending a relationship may
increase the risk that the bank will spill its knowledge of the issuer to future clients.25 As a result,
banks may charge higher underwriting fees after deregulation.
So far, we have implicitly modeled fees as a component of unobserved bank characteristics, for
the simple reason that we cannot observe fees in the entire choice set: Fees quoted by banks that
didn’t win an underwriting mandate are not publicly disclosed. But we can exploit the deregulation
events to test whether banks exploit their increased bargaining power by increasing fees as firms in
deregulating industries begin to have concerns about sharing underwriters.
We estimate standard fee regressions, where the dependent variable is the fee (or “gross
spread”) paid to the underwriter or underwriting syndicate, measured as a fraction of issue proceeds
times 100. The main variable of interest is an indicator identifying deals from deregulating
industries completed after a competition-increasing deregulation event. We control for economies
of scale in underwriting by including issue proceeds and log issue proceeds (see Ljungqvist,
Jenkinson, and Wilhelm (2003)) and for issuer and offer characteristics. We also include lead
manager fixed effects and year effects. Collectively, these controls account for between 31.2% and
73.2% of the variation in fees in Table 7.
Column (1) shows that average fees increased by 91 basis points in the equity sample post-
deregulation.26 In column (2), we restrict the sample to deals occurring in a ten-year window
25 For an analysis of hold-up in lending relationships, see Sharpe (1990), Rajan (1992), and Petersen and Rajan (1995). 26 To the extent that regulated industries are more transparent, it may be that deregulation raised underwriting costs as risk discovery and disclosure became more burdensome. If so, this may introduce an upward bias to our estimates.

24
centered on each industry’s first deregulatory event. This reduces the estimated fee increase, post-
deregulation, to 52 basis points. Debt offerings display similar patterns, with fees estimated to
increase post-deregulation by 38 basis points in the full sample (see column (3) or by 83 basis
points when we impose the ten-year window (see column (4)). The evidence from both equity and
debt fees thus supports the view that a reluctance to share underwriters enables banks to charge
higher fees for their services.27 Monte Carlo simulations along the lines of Section 3.2 again confirm
that there are no corresponding changes in fees in non-deregulating industries.
6. Implications for Vertical Relationships in Investment Banking
Our evidence indicates that large firms, when issuing securities, are reluctant to share a bank
with a product-market rival, contributing to the low incidence of banks working for multiple large
clients in an industry as shown in Fig. 1. The deregulation test suggests that a likely driving force is
concerns about possible information leakage. We now explore how these findings affect how we
interpret the changing structure of vertical relationships in the U.S. investment banking industry.
The most notable force shaping the structure of the investment banking industry over the last
two decades has been deregulation of the Glass-Steagall separation of commercial and investment
banking. In a series of steps beginning in 1987, commercial banks were allowed to enter securities
underwriting, culminating in the repeal of the Glass-Steagall Act in 1999.
From the point of view of an issuing firm, entry expands the set of banks that are unencumbered
by a prior relationship with a rival. This makes the entrant an attractive choice relative to many
incumbents. Assuming firms felt constrained in their underwriter choices, we would expect that the
effects documented in the paper have made entry easier, as commercial banks unencumbered by
existing relationships were in a relatively good position to gain market share as Glass-Steagall
27 Fees may increase post-deregulation simply because deregulation itself increases demand for external capital while the supply of underwriting services in the short-run is fixed. In unreported regressions, we include the amount of capital raised in the same year or quarter by other firms in the same industry but find no systematic evidence that fees are impacted by this. Similarly, controlling for the number of deals done by firms in the same industry has no effect.

25
constraints were relaxed. A specific prediction that follows is that we should observe an increased
propensity for firms to establish multiple banking relationships, as entry increases the number of
banks toward the point where firms can maintain multiple relationships without having to share
bankers. In this section, we present evidence that is consistent with this prediction.
Figures 3a and 3b show the annual number of commercial banks active in equity and debt
underwriting in the U.S., respectively, as well as their combined market share. Entry by commercial
banks appears to have been very successful, especially after 1999. As a group, commercial banks
captured 70% of the debt underwriting market and 38% of the equity underwriting market by 2004.
A handful of commercial banks, including Citigroup and JP Morgan Chase, emerged as substantial
competitors to the incumbent investment banks.
Figures 4a and 4b show the extent to which issuing firms have tended to concentrate their
underwriting business with a single bank. We measure this by calculating the total amount raised by
each issuing firm in a given window and then looking at how this was shared among the one or
more banks acting as lead manager. (For the purposes of the figures, we use one-, two-, and three-
year windows.) From this we construct a Herfindahl index of the concentration of each issuer’s
bank relationships. A Herfindahl of one indicates an exclusive bank relationship. We then take a
weighted average over firms in a quarter, weighting by the total proceeds raised by each firm over
the relevant window. Weighting has the effect of reducing average exclusivity, indicating that larger
issuers are more likely to have more than one relationship bank.
The patterns in Figures 4a and 4b are striking. Prior to the mid 1990s, bank relationships were
nearly all exclusive. They have since become considerably less exclusive. For the average equity
issuer, concentration has fallen from around 0.95 to between 0.62 and 0.7 in 2003Q4, depending on
the window used, suggesting that by the end of the sample period, the dominant model is no longer
an exclusive-bank relationship but a set of multiple relationships around a core bank that is awarded

26
a disproportionate share of the average issuer’s underwriting business. This may be the result of
efforts to engender competition among banks.28 In the debt market, the decline in exclusivity has
been even steeper. By the end of the sample period, average relationship concentration had fallen to
between 0.39 and 0.47, depending on the window, a level consistent with a stable two- or three-
bank relationship. These data are consistent with the prediction that increased entry makes it easier
for firms to establish multiple investment banking relationships.
7. Conclusions
This paper presents evidence suggesting that firms seek to avoid sharing investment bankers
with their product-market rivals when possible. To establish this finding, the paper uses a range of
novel sources of identification aimed at isolating margins on which any such disinclination would
have a meaningful economic effect.
What might cause such behavior? The results best support the hypothesis that firms seek to
avoid sharing underwriters in order to avoid commercially sensitive information leaking to rival
firms. Unlike alternatives, this hypothesis predicts that the propensity to avoid sharing underwriters
appears important only when firms have direct product-market contact with other large firms in
their industry. Evidence using deregulation events is consistent with this view.
Whatever the reason for the reluctance to share underwriters, we find that banks appear to set
higher prices as firms become more concerned about the risk of sharing underwriters. This suggests
that a desire to avoid sharing underwriters limits firms’ choice set and, hence, effective competition.
It constrains competition because, with a limited number of banks capable of executing large or
complex deals, there may simply be too few banks to allow each firm to have multiple relationships
while at the same time avoiding sharing banks with a major rival. At the very least, this constrains
the issuer’s choice set of underwriters. However, paradoxically, the same phenomenon may also act 28 Alternatively, it is possible that commercial banks leaned on their borrowers to share their underwriting business in return for preferential loan terms (Drucker and Puri (2005)).

27
as an aid to entry: An entering bank benefits from being unencumbered by existing relationships
that would otherwise prejudice a firm’s underwriter choice.
.

28
References
Anand, Bharat, and Alexander Galetovic, 2000, Information, non-excludability and financial market structure, Journal of Business 73, 357-402.
Anand, Bharat, and Alexander Galetovic, 2006, Relationships, competition, and the structure of the investment banking market, Journal of Industrial Economics 54, 151-199.
Ashenfelter, Orley, and David Card, 1985, Using the longitudinal structure of earnings to estimate the effect of training programs, Review of Economics and Statistics 67, 648-660.
Asker, John, 2004, Diagnosing vertical foreclosure due to exclusive dealing, NYU Stern Working Paper EC-04-36.
Azoulay, Pierre, 2004, Capturing knowledge across and within firm boundaries: Evidence from clinical development, American Economic Review 94, 1591-1612.
Baccara, Mariagiovanna, 2005, Outsourcing, information leakage, and consulting firms, RAND Journal of Economics, forthcoming.
Baccara, Mariagiovanna, and Ronny Razin, 2004, From thought to practice: Appropriation and endogenous market structure with imperfect intellectual property rights, CEPR DP No. 4419.
Berger, Allen N., Nathan H. Miller, Mitchell A. Petersen, Raghuram G. Rajan, and Jeremy C. Stein, 2005, Does function follow organizational form? Evidence from the lending practices of large and small banks, Journal of Financial Economics 76, 237-269.
Bharat, Sreedhar, Sandeep Dahiya, Anthony Saunders, and Anand Srinivasan, 2007, So what do I get? The bank’s view of lending relationships, Journal of Financial Economics 85, 368-419.
Bhattacharya, Sudipto, and Chiesa Gabriella, 1995, Proprietary information, financial intermediation, and research incentives, Journal of Financial Intermediation, 4, 328-357.
Bonacich, Philip, 1972, Factoring and weighting approaches to status scores and clique identification, Journal of Mathematical Sociology 2, 113-120.
Boot, Arnoud W.A., 2000, Relationship banking: What do we know?, Journal of Financial Intermediation 9, 7-25.
Competition Commission, 1999, Underwriting services for share offers: A report on the supply in the UK of underwriting services for share offers, Competition Commission Report, HM Govt.
Denis, David J., 1991, Shelf registration and the market for seasoned equity offerings, Journal of Business 64, 189-212.
Drucker, Steven, and Manju Puri, 2005, On the benefits of concurrent lending and underwriting, Journal of Finance 60, 2763-2799.

29
Eccles, Robert G., and Dwight B. Crane, 1988, Doing Deals: Investment Banks at Work, Harvard Business School Press.
Ellis, Katrina, Roni Michaely, and Maureen O’Hara, 2005, Competition in investment banking: Proactive, reactive, or retaliatory?, Unpublished working paper, Cornell University.
Fernando, Chitru S., Vladimir A. Gatchev, and Paul A. Spindt, 2005, Wanna dance? How firms and underwriters choose each other, Journal of Finance 60, 2437-2470.
Foster, F. Douglas, 1989, Syndicate size, spreads, and market power during the introduction of shelf registration, Journal of Finance 44, 195-204.
Gande, Amar, Manju Puri, and Anthony Saunders, 1999, Bank entry, competition and the market for corporate securities underwriting, Journal of Financial Economics 54, 165-195.
Gande, Amar, Manju Puri, Anthony Saunders, and Ingo Walter, 1997, Bank underwriting of debt securities: Modern evidence, Review of Financial Studies 10, 1175-1202.
Gilbert, Richard J., and Justine S. Hastings, 2005, Market power, vertical integration, and the wholesale price of gasoline, Journal of Industrial Economics 53, 469-492.
Greene, William H., 2003, Econometric Analysis, Prentice Hall.
Hahn, Avital L., 2003, Playing both sides: Settlement aside, banks – and even clients – still have trouble staying with one horse, Investment Dealers Digest, 18 August.
Ho, Katherine, 2007, Insurer-provider networks in the medical care market, NBER Working Paper 11822.
Hortascu, Ali, and Chad Syverson, 2007, Cementing relationships: Vertical integration, foreclosure, productivity, and prices, Journal of Political Economy 115, 250-301.
Ivashina, Victoria, Vinay B. Nair, Anthony Saunders, Nadia Massoud, and Roger Stover, 2005, The role of banks in takeovers, Unpublished working paper, New York University.
Krigman, Laurie, Wayne H. Shaw, and Kent L. Womack, 2001, Why do firms switch underwriters? Journal of Financial Economics 60, 245–284.
Landier, Augustin, Vinay Nair, and Julie Wulf, 2006, Trade-offs in staying close: Corporate decision-making and geographic dispersion, Review of Financial Studies, forthcoming.
Leander, Tom, 1999, The best mergers, Global Finance, February 1.
Ljungqvist, Alexander, Tim Jenkinson, and William J. Wilhelm, 2003, Global integration in primary equity markets, Review of Financial Studies 16, 63-99.
Ljungqvist, Alexander, Felicia Marston, and William J. Wilhelm, 2006, Competing for securities underwriting mandates, Journal of Finance 61, 301-340.

30
Ljungqvist, Alexander, Felicia Marston, and William J. Wilhelm, 2007, Scaling the hierarchy: How and why investment banks compete for syndicate co-management appointments, Unpublished working paper, New York University.
Ljungqvist, Alexander, and William J. Wilhelm, 2005, Does prospect theory explain IPO market behavior?, Journal of Finance 60, 1759-1790.
Megginson, William L., and Kathleen A. Weiss, 1991, Venture capitalist certification in initial public offerings, Journal of Finance 46, 879-903.
Petersen, Mitchell A., and Raghuram G. Rajan, 1995, The effect of credit market competition on lending relationships, Quarterly Journal of Economics 110, 407–443.
Petersen, Mitchell A., and Raghuram G. Rajan, 2002, Does distance still matter? The revolution in small business lending, Journal of Finance 57, 2533–2570.
Rajan, Raghuram G., 1992, Insiders and outsiders: The choice between informed and arm’s-length debt, Journal of Finance 47, 1367-1400.
Rey, Patrick, and Jean Tirole, 2007, A primer on foreclosure, in: Mark Armstrong and Robert Porter (eds.), Handbook of Industrial Organization, Vol. 3, North-Holland.
Sharpe, Steven A., 1990, Asymmetric information, bank lending, and implicit contracts: A stylized model of customer relationships, Journal of Finance 45, 1069-1087.
Siconolfi, Michael, 1994, Saga of Kidder’s Jett: Sudden downfall of an aggressive Wall Street trader, Wall Street Journal, April 19.
Sikora, Martin, 2000, Premier investment banks form global giants, Mergers and Acquisitions (October 1, 2000).
Song, Wei-ling, 2004, The industrial organization of bond underwriting market with bank entry: Evidence from underwriting fees, Unpublished working paper, Louisiana State University.
Stuart, Alix. N., 2006, Are your secrets safe?, CFO Magazine, October 2006.
Tirole, Jean, 1987, The Theory of Industrial Organization, The MIT Press.
Viscusi, W. Kip, Joseph E. Harrington, and John M. Vernon, 2005, Economics of Regulation and Antitrust, The MIT Press.
Weidner, David, 1999, Deal for middle-tier broker seen as cautious move for third-biggest bank, American Banker, September 29.
Yasuda, Ayako, 2005, Do bank relationships affect the firm’s underwriter choice in the corporate-bond underwriting market?, Journal of Finance 60, 1259-1292.
Zabojnik, Jan, 2002, A theory of trade secrets in firms, International Economic Review 43, 831-855.

Figure 1a. Exclusivity of Bank-firm Equity Relationships The graphs show the quarterly fraction of equity or debt underwriters with multiple clients among the three, five, or ten largest firms in a four-digit SIC industry (ranked by Compustat net sales), conditional on having at least one such client. We code a bank as having a client in industry i in quarter t if it has lead managed one or more securities issues for a firm in that industry over the five years ending in quarter t-1. The variables are constructed using underwriting data from Thomson Financial going back to 1970.
0%
10%
20%
30%
40%
50%
60%
70%
80%
90%
100%
1975
Q1
1977
Q1
1979
Q1
1981
Q1
1983
Q1
1985
Q1
1987
Q1
1989
Q1
1991
Q1
1993
Q1
1995
Q1
1997
Q1
1999
Q1
2001
Q1
2003
Q1
Top 3 clientsTop 5 clientsTop 10 clients
Figure 1b. Exclusivity of Bank-firm Debt Relationships
0%
10%
20%
30%
40%
50%
60%
70%
80%
90%
100%
1975
Q1
1977
Q1
1979
Q1
1981
Q1
1983
Q1
1985
Q1
1987
Q1
1989
Q1
1991
Q1
1993
Q1
1995
Q1
1997
Q1
1999
Q1
2001
Q1
2003
Q1
Top 3 clientsTop 5 clientsTop 10 clients
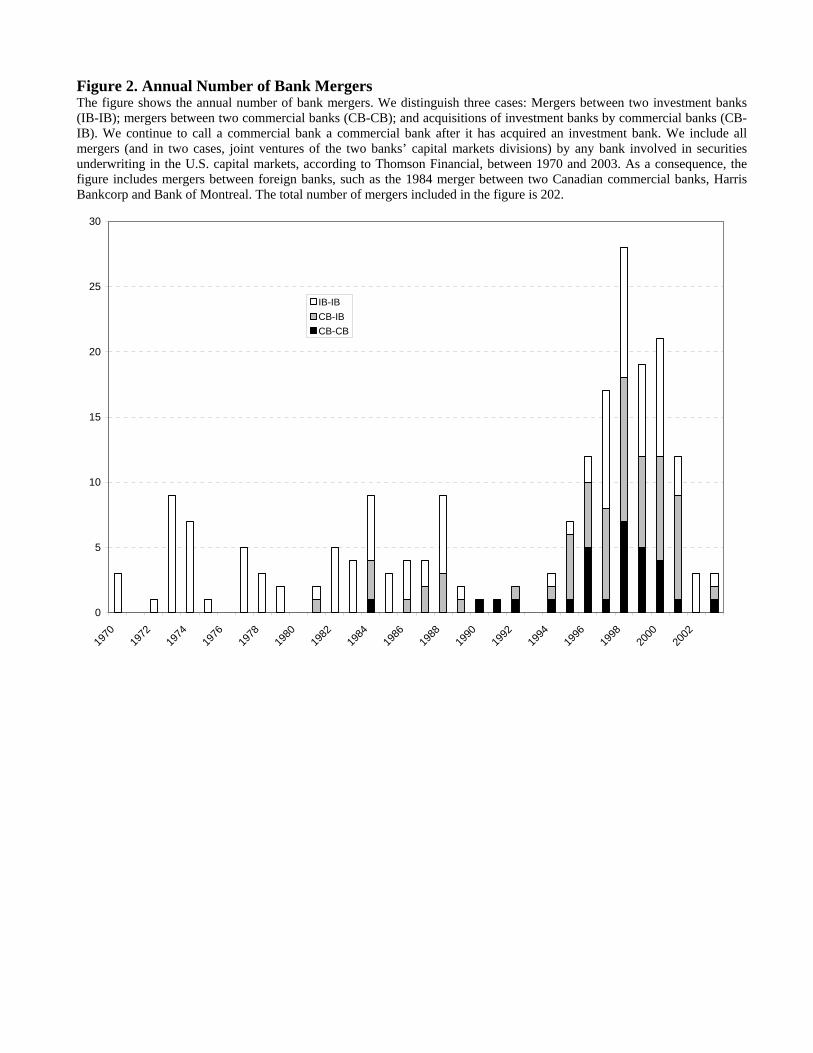
Figure 2. Annual Number of Bank Mergers The figure shows the annual number of bank mergers. We distinguish three cases: Mergers between two investment banks (IB-IB); mergers between two commercial banks (CB-CB); and acquisitions of investment banks by commercial banks (CB-IB). We continue to call a commercial bank a commercial bank after it has acquired an investment bank. We include all mergers (and in two cases, joint ventures of the two banks’ capital markets divisions) by any bank involved in securities underwriting in the U.S. capital markets, according to Thomson Financial, between 1970 and 2003. As a consequence, the figure includes mergers between foreign banks, such as the 1984 merger between two Canadian commercial banks, Harris Bankcorp and Bank of Montreal. The total number of mergers included in the figure is 202.
0
5
10
15
20
25
30
1970
1972
1974
1976
1978
1980
1982
1984
1986
1988
1990
1992
1994
1996
1998
2000
2002
IB-IBCB-IBCB-CB

Figure 3a. Number and Combined Equity Market Share of Commercial Banks The graphs show the combined equity (in 3a) and debt (in 3b) market share of commercial banks (on the right-hand axis) and the number of commercial banks that have positive market share in each year (on the left-hand axis). Deregulation began in 1987 and the Glass-Steagall Act was repealed in 1999. There is underwriting by commercial banks prior to 1987 as some banks had grandfathered underwriting rights; due to the inclusion of foreign banks active in the U.S. capital markets; and because we include private placements, which fell outside the Glass-Steagall restrictions.
0
10
20
30
40
50
60
70
80
90
100
1970
1972
1974
1976
1978
1980
1982
1984
1986
1988
1990
1992
1994
1996
1998
2000
2002
2004
0.0
0.1
0.2
0.3
0.4
0.5
0.6
0.7
0.8
0.9
1.0
Figure 3b. Number and Combined Debt Market Share of Commercial Banks
0
10
20
30
40
50
60
70
80
90
100
1970
1972
1974
1976
1978
1980
1982
1984
1986
1988
1990
1992
1994
1996
1998
2000
2002
2004
0.0
0.1
0.2
0.3
0.4
0.5
0.6
0.7
0.8
0.9
1.0

Figure 4a. Concentration of Bank-firm Equity Relationships The graphs show the Herfindahl concentration index of bank-firm relationships, measured over the prior one, two, or three years, of the average U.S. issuer (weighted by each issuer’s cumulative proceeds over the relevant window).
0.00
0.10
0.20
0.30
0.40
0.50
0.60
0.70
0.80
0.90
1.00
1975
Q1
1977
Q1
1979
Q1
1981
Q1
1983
Q1
1985
Q1
1987
Q1
1989
Q1
1991
Q1
1993
Q1
1995
Q1
1997
Q1
1999
Q1
2001
Q1
2003
Q1
One-year concentrationTwo-year concentrationThree-year concentration
Figure 4b. Concentration of Bank-firm Debt Relationships
0.0
0.1
0.2
0.3
0.4
0.5
0.6
0.7
0.8
0.9
1.0
1975
Q1
1977
Q1
1979
Q1
1981
Q1
1983
Q1
1985
Q1
1987
Q1
1989
Q1
1991
Q1
1993
Q1
1995
Q1
1997
Q1
1999
Q1
2001
Q1
2003
Q1
One-year concentrationTwo-year concentrationThree-year concentration

Table 1. Exclusivity of Bank-firm Relationships and Proxies for Secrecy This table provides descriptive statistics consistent with the notion that exclusivity is more prevalent in industries where the demand for secrecy may be a higher. As in Figures 1a and 1b, we compute the quarterly fraction of equity or debt underwriters with multiple clients among the three largest firms in a four-digit SIC industry (ranked by Compustat net sales), conditional on having at least one such client. A larger fraction implies less client exclusivity. We then compute the time-series average such fraction for each of three sample splits, and test for equality of fractions for each sample split using a standard Z-test. To proxy for the demand for secrecy, we split four-digit SIC industries a) at the median Herfindahl concentration index, b) at the median asset tangibility, and c) according to whether information is predominantly “hard” or “soft” in the industry. The Herfindahl concentration index is computed as the sum of the squared market shares of firms in the industry, based on Compustat net sales. The median value in the sample of industries with securities issuers in our sample is 0.332. An industry’s asset tangibility is defined as the industry’s median ratio of property, plant, and equipment (Compustat item #8) divided by total assets (Compustat item #6). The definitions of hard and soft information follow Landier, Nair, and Wulf (2006) who compare two snapshots (1987 and 1998) of the mean distance between firms and bank lenders per industry at the 2-digit SIC level. In industries that are predominantly characterized by hard information, they expect mean distance to have increased as banks have begun to rely more on impersonal means to collect information, whereas in soft-information industries, banks need to stay closer to their corporate borrowers and so it is harder to increase geographic distance. A hard-information industry is then defined as one whose percentage increase in mean distance between 1987 and 1998 is above the median such increase across industries. The measure of distance to nearest bank is computed using data from the National Survey of Small Business Finances (1987 and 1998) conducted by the Federal Reserve. A small business is defined as a for-profit, non-financial, non-farm, non-subsidiary business enterprise that had fewer than 500 employees and was in operation at the time of the survey. Where a business was served by more than one bank, the average distance across all relevant banks was computed for that business. Averages across businesses were computed taking into account the sampling weights from the survey. Observations where the distance was not recorded were omitted. We use ***, **, and * to denote significance at the 1%, 5%, and 10% level (two-sided), respectively.
Equity Debt Industry Herfindahl “concentrated”
(above-median Herfindahl) 1.5% 4.5%
“unconcentrated” (below-median Herfindahl)
3.1% 12.2%
Z-statistic 9.95*** 34.60***
Asset tangibility “predominantly intangible”
(below-median PPE/total assets) 2.0% 4.2%
“predominantly tangible” (above-median PPE/total assets)
2.6% 11.4%
Z-statistic 4.13*** 29.81***
Information “soft” (below-median distance increase)
2.2% 6.9%
“hard” (above-median distance increase)
2.6% 9.0%
Z-statistic 2.06** 9.44***

Table 2. The Sample of Capital-raising Transactions The first block of columns shows a breakdown of all capital-raising transactions listed in Thompson Financial’s SDC database completed between January 1975 and December 2003, after excluding non-underwritten issues; transactions by financial firms (SIC code 6) and government issuers (SIC code 9); and offerings by non-U.S. corporations. The second and third blocks of columns show the samples used in the econometric analyses. These samples are limited to deals lead-managed by one of the 50 largest underwriters active that year involving the ten largest firms (by Compustat net sales) in each four-digit SIC industry and exclude debt shelf offerings conducted under Rule 415. In addition, the third block screens out first-time deals. All currency amounts are in 1996 constant dollars, deflated using the quarterly GNP deflator.
Deals by the ten largest firms per industry underwritten by 50 largest banks
All underwritten transactions completed in 1975 – 2003 (1)
Excluding shelf offers (2)
Excluding first-time deals and shelf offers (3)
No. of deals
% of deals
Aggregate amount
raised ($m, real)
% of amt.
No. of deals
Aggregate amount
raised ($m, real)
No. of deals
Aggregate amount
raised ($m, real)
Equity offerings Common stock 16,752 33.4 1,156,827 24.6 5,012 570,972 2,977 375,960 Private common 2,579 5.1 63,488 1.3 260 11,199 221 9,102
Debt offerings Non-convertible bonds 13,278 26.5 2,316,863 49.2 1,900 344,554 1,243 203,236 Convertible bonds 1,287 2.6 160,850 3.4 524 65,338 277 44,149 Private non-conv. bonds 12,248 24.4 764,347 16.2 3,739 261,410 2,446 173,066 Private conv. bonds 481 1.0 11,162 0.2 77 3,397 27 1,843 Non-conv. preferred 1,002 2.0 95,214 2.0
161 18,590
132 15,493
Convertible preferred 551 1.1 78,615 1.7 164 25,719 113 17,034 Private non-conv. pref. 747 1.5 22,337 0.5 78 3,776 49 2,398 Private conv. preferred 1,203 2.4 40,739 0.9 101 9,777 54 6,659 All deals 50,128 100.0 4,710,441 100.0 12,016 1,314,732 7,539 848,940

Table 3. Main Variable Definitions
Bank-rival relationships equity/debt relationship with a top 3 firm =1 if the bank has lead-managed at least one equity or debt issue for a
firm ranked among the 3 largest firms in a four-digit SIC industry (ranked by Compustat net sales), excluding the issuer itself, in the prior five years.
equity/debt relationship with a top 4-10 firm =1 if the bank has lead-managed at least one equity or debt issue for a firm ranked among the 4-10 largest firms in a four-digit SIC industry, excluding the issuer itself, in the prior five years.
Strength of bank-firm relationships bank’s share of issuer’s equity/debt deals Following Ljungqvist, Marston, and Wilhelm (2006), let d
tkjP ,, denote the aggregate proceeds company k raised in deals lead-managed by bank j over the four quarters preceding quarter t in deals of type d = {equity, debt}. The strength of company k’s type-d relationship with bank j is ∑=
jd
tkjd
tkjd
tkj PPR ,,,,,,. This ranges from zero (no
relationship) to 100% (if the company maintained an exclusive bank relationship). Constructed from Thomson Financial/SDC data.
Bank reputation proxies equity/debt market share A bank’s share of the equity/debt underwriting market during the
prior calendar year; see Megginson and Weiss (1991). Following a merger, the surviving bank is credited with both predecessors’ market shares. Underwriting data come from Thomson Financial/SDC. These variables are constructed using data for all issuers (not just the ten largest firms in each industry).
eigenvector centrality Measures a bank’s standing based on data on its syndication relationships with other banks; see Ljungqvist, Marston, and Wilhelm (2007). Assuming that status and influence derive, in part, from being networked to others who themselves are well-networked (Bonacich (1972)), we weight a bank’s ties to others by the importance of the banks it is tied to. Formally, eigenvector ∑=≡
idti
dtji
dtj
dtj EpE ,,,,,
. The
weights are the reciprocal of the principal eigenvector dtp of a square
and symmetric matrix dtjiA ,, whose cells (i,j) record whether or not
banks i and j syndicated one or more transactions of type d = {equity, debt} in the preceding year. Constructed using data for all issuers (not just the ten largest firms in each industry).
loyalty index Measures how often a bank retains its clients in consecutive deals as a control for unobserved factors such as execution capability that affect an issuer’s choice: Banks whose clients are generally loyal likely have more desirable characteristics; see Ellis, Michaely, and O’Hara (2005). Let Ick and Irk = 1 if bank j managed k’s penultimate and most recent deals, respectively, in prior five years, and 0 otherwise. Then j’s loyalty index = Σk Ick Irk / Σk Ick (the number of retained clients over the total number of clients). The loyalty index varies between zero and 100%. Constructed using data for all issuers (not just the ten largest firms in each industry).
Expertise bank’s industry expertise Measures a bank’s industry expertise as the combined concurrent
product-market share of its clients in the issuer’s four-digit SIC industry. Product-market shares are computed from annual Compustat net sales data.

Table 4. Lead Manager Switches Following Bank Mergers We estimate the probability that an issuing company switches lead managers in consecutive equity or debt deals. A switch is defined as an equity (debt) issuer hiring as lead manager any bank other than the lead manager of its most recent equity (debt) deal (or, if that bank has since been acquired, its successor). In the case of multiple lead managers on a deal, we code as a switch any failure to retain every lead manager from the previous deal. We focus on deals involving a firm ranked among the ten largest by Compustat net sales in its four-digit SIC industry that year. All variables are defined in Table 3, except log real sales which is based on Compustat net sales deflated using the 1985=100 quarterly GDP deflator. The bank variables refer to characteristics of the lead manager in the previous deal measured as of the time of the current deal. The models are estimated using probit with lead manager-specific random effects and year fixed effects. Results are robust to alternative assumptions about the distribution of the error term, including: Random-effects logit; probit or logit without lead manager-specific random effects or without year fixed effects; fixed-effects linear probability models; complementary log-log (extreme value) distribution; and Gompertz distribution. Intercept and year fixed effects are not shown. Heteroskedasticity-consistent standard errors are shown in italics. We use ***, **, and * to denote significance at the 1%, 5%, and 10% level (two-sided), respectively.
Equity Debt (1) (2) (3) (4) Treatment groups =1 if since previous deal, bank has merged with another bank that has 0.978** 1.068** 1.679*** 0.770 one or more clients among the 3 largest firms in issuer’s industry 0.481 0.506 0.651 0.684 =1 if since previous deal, bank has merged with another bank that has 0.382 0.285 1.293* 0.889 one or more clients among 4-10 largest firms in issuer’s industry 0.296 0.305 0.759 0.777 Control group 1 =1 if bank involved in merger since previous deal but merger partner 0.015 0.710* has no relationships in issuer’s industry 0.085 0.381 Bank-firm relationships bank’s share of issuer’s debt deals as lead in prior four quarters -0.498*** -1.318*** -0.298*** -0.328 0.104 0.379 0.053 0.357 bank’s share of issuer’s equity deals as lead in prior four quarters -0.342*** -0.601** -0.183** 0.422 0.073 0.267 0.089 0.567 Bank characteristics bank’s equity market share in prior calendar year -0.187 -0.022 0.447 -1.191 0.693 1.970 0.424 5.309 bank’s debt market share in prior calendar year -2.436*** -1.384 -0.685 2.158 0.747 1.716 0.588 4.688 bank’s eigenvector centrality -1.148*** -1.157 -0.460* 0.104 0.294 0.738 0.239 1.660 bank’s loyalty index -0.985*** -0.851** -0.727*** -2.014** 0.118 0.364 0.126 0.800 =1 if previous lead was target in bank merger 0.052 -0.093 -0.272 -0.442 0.122 0.140 0.220 0.274 Firm characteristics ln (1+ real sales in $m) 0.099*** 0.044 0.115*** 0.211*** 0.016 0.040 0.015 0.070 ln (1+ years since previous deal) 0.401*** 0.386*** 0.252*** 0.334 0.049 0.104 0.040 0.254 Diagnostics Pseudo R2 17.6 % 17.7 % 6.4 % 25.9 % Wald test: all coefficients = 0 (χ2) 559.4*** 112.2*** 317.0*** 67.1** Wald test: coefficient on rival 3 = coefficient on control group 1 (χ2) 4.1** n.a. 3.2* n.a. LR test: ρ = 0 (χ2) 5.1** 1.5 8.3*** 0.0 No. of observations 3,198 630 4,341 296

Table 5. Lead Manager Choice in Deregulating Industries We estimate the probability that a given bank is chosen to lead-manage a particular securities transaction over the period 1975 to 2003. We focus on transactions involving a firm ranked among the ten largest by Compustat net sales in its four-digit SIC industry that year, and treat the 50 largest underwriters by market share that year as being in competition for each deal. (Note there were only 35 banks active in equity underwriting in 1975 and there were fewer than 50 banks active in debt underwriting in 1975-1980 and in 2002.) The unit of observation is a bank-deal pair. The dependent variable equals 1 if the bank won the lead-management mandate and 0 otherwise. We restrict the sample to deals from four-digit SIC codes that are subject to a significant deregulatory (competition-increasing) shock between 1975 and 2003, as identified by Viscusi, Harrington, and Vernon (2005). Twenty-three of these deregulating industries have equity or debt transactions in the sample; see Table A1 in the Appendix for a list of deregulation events. The debt sample also excludes shelf registrations. To test the hypothesis that exposure to competition makes firms more reluctant to share underwriters, we allow the slope coefficients to vary between deals completed in the five years before the year of the first deregulatory shock (“Pre”) and those completed in the following five years (“Post”). All variables are defined in Table 3, except log real sales which is based on Compustat net sales deflated using the 1985=100 quarterly GDP deflator. The models are estimated using probit with lead manager-specific random effects and year and industry fixed effects. Results are robust to alternative assumptions about the distribution of the error term. Intercept and fixed effects are not shown. Standard errors are shown in italics. We use ***, **, and * to denote significance at the 1%, 5%, and 10% level (two-sided), respectively. Equity Debt
Pre Post Pre Post Bank-rival relationships =1 if bank has one or more clients among the 3 largest firms in ind. 0.072 -1.060*** -0.058 -0.248 0.447 0.406 0.086 0.157 =1 if bank has one or more clients among the 4-10 largest firms in ind. 0.163 -0.079 -0.102 -0.327** 0.425 0.220 0.080 0.146 Bank-firm relationships bank’s share of issuer’s debt deals as lead in prior four quarters 1.161* 1.794*** 0.987*** 1.357*** 0.632 0.293 0.195 0.113 bank’s share of issuer’s equity deals as lead in prior four quarters 1.999*** 1.383*** 3.370*** 0.443** 0.493 0.327 0.612 0.215 Bank characteristics bank’s equity market share in prior calendar year -3.737 -0.855 -1.064 1.371*** 2.766 1.507 0.937 0.522 bank’s debt market share in prior calendar year 5.465* 5.179*** 1.023 1.342* 2.354 1.365 1.425 0.796 bank’s eigenvector centrality 1.127 1.596*** 0.797 1.208*** 0.783 0.594 0.543 0.393 bank’s loyalty index -0.408 0.164 0.553*** 0.653*** 0.293 0.252 0.198 0.130 bank’s industry expertise 3.806** 3.277*** 5.133*** 2.483*** 1.813 0.745 0.549 0.313 Firm characteristics ln (1+ real sales in $m) 0.023 -0.062 0.005 -0.008 0.072 0.065 0.051 0.047 Diagnostics Pseudo R2 30.2 % 30.7 % Wald test: all coefficients = 0 (χ2) 229.6*** 683.6*** Wald test: effect of top 3 rival equal pre and post-deregulation (χ2) 3.6* 1.2 LR test: random effects = 0 (χ2) 1.0 97.9*** No. of transactions 126 570 No. of observations (# transactions · # competing banks) 5,655 25,790

Table 6. Lead Manager Choice Following Rival Client Switches The models shown here are identical to the specifications shown in Table 5, except that we 1) include all non-shelf deals (not just those in deregulating industries) and 2) split the effect of rival relationships into those that are “active” as of the time of the deal in question and those that are “inactive”. We consider three definitions of active and inactive. The first (labeled “mergers”) considers a candidate bank’s rival client to be inactive if it has been acquired by another firm during the previous five years (based on CRSP delisting codes 200 and 300). The second and third (labeled “switches”) consider a candidate bank’s rival client to be inactive if the firm has awarded no underwriting business to the bank for five or three years, respectively. We assume the bank’s information about the rival client to decay following a switch, and so code the bank as having an inactive rival client for only one year following the switch (i.e., years 6 and 4, respectively). Beyond that, the bank is coded as no longer having a rival client (active or inactive). Choosing a bank that has an active rival client runs the risk of information leakage to one of the issuer’s product-market competitors, though there are two potential offsetting benefits in the form of the bank having greater industry expertise or disclosing information about the rival client to the issuer. Choosing a bank that has an inactive rival client runs no corresponding risk but still offers both potential benefits. Therefore, the difference between the coefficients estimated for active and inactive rival clients isolates the effect of concerns about information leakage on underwriter choice. The models are estimated using probit with lead manager-specific random effects and year and industry fixed effects. Results are robust to alternative assumptions about the distribution of the error term. The unit of observation is a bank-deal pair. The estimation dataset consists of 5,272 equity deals and 6,744 debt deals completed by firms ranked among the ten largest in their four-digit SIC industries (based on Compustat net sales) between 1975 and 2003, for each of which the 50 largest banks are deemed to compete to become lead manager (except where fewer than 50 banks were active in the market at the time). This gives a sample of 262,580 bank-deal pairs for equity and 325,780 for debt. To conserve space, we report only the coefficients estimated for active and inactive rival relationships, and the difference between the two (as a measure of the net effect of concerns about information disclosure). Standard errors are shown in italics. The standard errors for the difference between each pair of coefficients are calculated using the delta method. We also report marginal effects (denoted dF/dx; the units are percentage points). For comparison, the unconditional likelihood of a bank becoming lead manager is about 2.2%. We use ***, **, and * to denote significance at the 1%, 5%, and 10% level (two-sided), respectively. Equity Transactions Debt Transactions
Mergers Switches (T=5) Switches (T=3) Mergers Switches (T=5) Switches (T=3)
Coeff. s.e. dF/dx
Coeff. s.e. dF/dx
Coeff. s.e. dF/dx
Coeff. s.e. dF/dx
Coeff. s.e. dF/dx
Coeff. s.e. dF/dx
= 1 if bank has active top 3 rival -0.129*** -0.3% -0.117*** -0.3% -0.080** -0.2% -0.205*** -0.4% -0.202*** -0.4% -0.129*** -0.3% 0.034 0.034 0.038 0.021 0.021 0.021
= 1 if bank has inactive top 3 rival 0.172 0.6% 0.251*** 0.9% 0.240*** 0.9% -0.135 -0.3% 0.584*** 2.8% 0.401*** 1.6% 0.152 0.093 0.072 0.143 0.101 0.066 Difference ( γα ˆˆ − ) -0.301** -0.9% -0.368*** -1.2% -0.321*** -1.1% -0.070 -0.1% -0.786*** -3.2% -0.530*** -1.8% 0.155 0.099 0.079 0.144 0.103 0.068
= 1 if bank has active top 4-10 rival 0.155*** 0.5% 0.151*** 0.5% 0.143*** 0.5% 0.081*** 0.2% 0.090*** 0.2% 0.082*** 0.2% 0.026 0.026 0.030 0.019 0.019 0.021
= 1 if bank has inactive top 4-10 rival 0.154 0.5% 0.357*** 1.5% 0.378*** 1.6% 0.103 0.3% 0.206* 0.6% 0.446*** 1.8% 0.105 0.076 0.057 0.118 0.110 0.060 Difference ( γα ˆˆ − ) 0.001 0.0% -0.206** -1.0% -0.235*** -1.1% -0.021 -0.1% -0.117 -0.4% -0.364*** -1.6% 0.109 0.081 0.065 0.119 0.111 0.064

Table 7. Determinants of Underwriter Fees In this table, we explore the conjecture that after deregulation, the underwriter’s hold-up power increases, leading to an increase in fees. The dependent variable is the fee (or “gross spread”) paid to the underwriter or underwriting syndicate, measured as a fraction of gross proceeds the issuer raises, times 100. We estimate ordinary least squares regressions with lead manager and year fixed effects. The sample includes either all transactions from four-digit SIC industries subject to competition-increasing deregulatory shocks (in columns (1) and (3)) or those deals completed within a ten-year window centered on the deregulation event (in columns (2) and (4)). See Table A1 in the Appendix for a definition of these events. The main variable of interest is a dummy identifying deals completed after a deregulation event. We control for economies of scale in underwriting by including issue proceeds and log issue proceeds and for issuer and offer characteristics. Intercepts, lead manager fixed effects, and year fixed effects are not shown. Heteroskedasticity-consistent standard errors, clustered on lead manager, are shown in italics. We use ***, **, and * to denote significance at the 1%, 5%, and 10% level (two-sided), respectively.
Fees in equity deals
(in %) Fees in debt deals
(in %) (1) (2) (3) (4) Deregulation events =1 if transaction completed post-deregulation 0.914*** 0.519** 0.379*** 0.825*** 0.236 0.222 0.107 0.267 Issue characteristics real issue proceeds (in $bn) 0.283** 3.420 0.200 0.088 0.127 2.429 0.261 0.289 ln real issue proceeds (in $m) -0.621*** -0.737*** -0.117*** -0.012 0.109 0.209 0.039 0.048 Issuer and offer characteristics ln (1+ real sales in $m) -0.252*** -0.348*** -0.095** -0.133*** 0.040 0.078 0.041 0.046 =1 if private placement 0.787*** 1.214*** 0.185* 0.505*** 0.189 0.246 0.100 0.121 =1 if convertible security 1.023*** 1.533*** 0.207 0.435 Diagnostics Adjusted R2 60.2 % 73.2 % 31.2 % 47.9 % Wald test: all coefficients = 0 (F) 470.8*** 240.7*** 212.9*** 37.3*** No. of transactions 529 126 1,719 570

Table A1. Deregulation Events This table lists deregulation events relevant to the construction of Tables 5 and 7. The main source is Viscusi, Harrington, and Vernon (2005). Additional industry-specific details are taken from: http://www.cato.org/pubs/regulation/reg18n2f.html, http://www.corp.att.com/history/history3.html, http://www.sec.gov/rules/concept/s72899/buck5.htm#P471_99506, http://www.centennialofflight.gov/essay/Commercial_Aviation/Dereg/Tran8.htm, and http://www.Lawdog.com/transport/tp1.htm. We omit deregulation events affecting the financial sector (e.g., the Gramm-Leach-Bliley Act 1999), those impacting product mix rather than competition (e.g., the elimination of the Fairness Doctrine by the FCC in 1987), and those that were simple asset sales (e.g., the sale of Conrail in 1987). Where the same industry is affected by multiple deregulation events, we take as the relevant date for the construction of Tables 5 and 7 the first such event, since further deregulation events will likely be anticipated well in advance. Superscript “e” indicates that the industry is in the equity sample used in Tables 5 and 7, while superscript “d” indicates inclusion in the debt sample (using in each case only the first deregulatory event for each industry).
Year of event
Relevant legislative or executive action Description
Four-digit SIC codes impacted
1977 Air Cargo Deregulation Act Deregulation of air cargo industry 4512e,d, 4522d 1978 Airline Deregulation Act First stage of deregulation of Airlines (gradually
implemented between 1978 and 1982) 4512, 4522
Natural Gas Policy Act Partial deregulation of natural gas prices 1311e,d, 4922e,d, 4925 1979 Deregulation of satellite earth
stations Deregulation of satellite earth stations 4841d, 4899
Urgent-mail exemption (Postal Services)
Allows competition with the US Postal Service on urgent mail, charging more that a certain amount
4513e,d, 4311, 4215, 7389e,d
1980 Motor Carrier Reform Act Partial Deregulation of Trucking 4213d, 4212, 4142, 4131 Household Goods Transportation Act Apply deregulatory measures in Motor Carrier
Reform Act to household moving services 4212, 4214
Staggers Rail Act Deregulated Railroads 4011d, 4741, 4789, 4013 International Air Transportation
Competition Act Second stage of deregulation of Airlines (gradually implemented between 1978 and 1982)
4512, 4522
Deregulation of cable television (FCC)
Precursor to 1984 Cable Television Deregulation Act
4841
Deregulation of customer premises equipment and enhanced services (FCC)
Precursor to 1984 Cable Television Deregulation Act
4841, 4899
1981 Decontrol of crude oil and refined petroleum products (executive order)
Oil price controls lifted by Reagan 4612, 1311, 1381e,d, 2911e,d, 2992, 2869, 5171d, 5411e,d, 2865, 5172d
Deregulation of Radio (FCC) Lifts requirement that radio stations have to provide news content - lowers costs and facilitates entry and diversity of service
4832
1982 Bus Regulatory Reform Act Partial Deregulation of bus and trucking industries - entry and exit of bus services facilitated and pricing controls eased. Trans-border trucking deregulated.
4111, 4151, 4142
AT&T Settlement (Breakup of AT&T)
AT&T has to split, divesting the local exchange service providers. An earlier consent decree (1956) restricting AT&T's scope of business is lifted.
4813e,d, 4812e,d, 4899, 3661e,d, 4822d
1984 Cable Television Deregulation Act Barred regulation in communities where there was "effective competition," which was defined by the FCC to be more than three broadcast stations
4841
Shipping Act Deregulated ocean shipping 4412d, 4491 1986 Trading of Airport Landing Rights Trading of Airport Landing Rights 4581d, 4512, 4522 1989 Natural Gas Wellhead Decontrol Act
of 1989 Removed natural gas price controls 4925, 1311, 4922
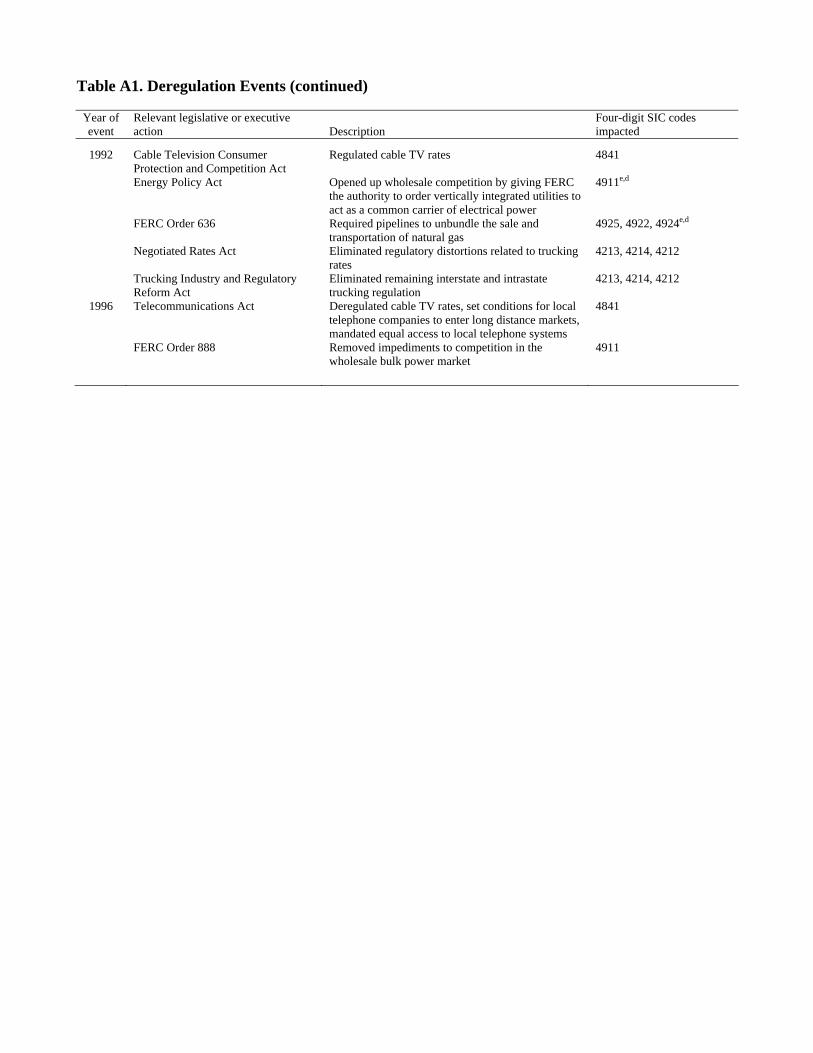
Table A1. Deregulation Events (continued)
Year of event
Relevant legislative or executive action Description
Four-digit SIC codes impacted
1992 Cable Television Consumer Protection and Competition Act
Regulated cable TV rates 4841
Energy Policy Act Opened up wholesale competition by giving FERC the authority to order vertically integrated utilities to act as a common carrier of electrical power
4911e,d
FERC Order 636 Required pipelines to unbundle the sale and transportation of natural gas
4925, 4922, 4924e,d
Negotiated Rates Act Eliminated regulatory distortions related to trucking rates
4213, 4214, 4212
Trucking Industry and Regulatory Reform Act
Eliminated remaining interstate and intrastate trucking regulation
4213, 4214, 4212
1996 Telecommunications Act Deregulated cable TV rates, set conditions for local telephone companies to enter long distance markets, mandated equal access to local telephone systems
4841
FERC Order 888 Removed impediments to competition in the wholesale bulk power market
4911