Embed Size (px)
Citation preview

Market Statistics 2016Page
1. Records Set in 2016 1
2. Securities Market Statistics 2 - 14
3. China Dimension 15 - 19
4. Derivatives Market Statistics 20 - 23
5. CCASS Statistics 24 - 25
6. LME Statistics 26 - 28
7. Participant Statistics 29

1
RECORDS SET IN 2016
Securities Market
(HK$)
Debt securities turnover $21.3 bil $9.4 bil (Year 2015)Real Estate Investment Trusts turnover $91.1 bil $82.4 bil (Year 2013)
Derivatives Market
Trading Turnover (Contracts)
Total Futures 73,462,212 (Year 2015)
Hang Seng Index Futures 23,085,833 (Year 2011)
Mini Hang Seng Index Futures 10,294,537 (Year 2011)
HSCEI Dividend Point Index Futures 240,572 (Year 2014)
RMB Currency Futures - USD/CNH Futures 262,433 (Year 2015)
Mini Hang Seng Index Options 1,230,997 (Year 2012)
H-shares Index Options 15,304,245 (Year 2015)
After-Hours Trading Session 5,255,464 (Year 2015)
HSCEI Dividend Point Index Futures (13 Dec 2016) 101,430 (30 Dec 2015)
RMB Currency Futures - USD/CNH Futures (30 Dec 2016) 23,887 (14 Feb 2014)
H-shares Index Options (28 Dec 2016) 2,618,350 (25 Sep 2015)
184,626
Open Interest
3,276,956
9,212,328
45,635
84,100,129
589,188
538,594
19,475,726
32,313,994
1,424,379
12,477,552
(Contracts)
As at 30 Dec 2016 Pre-2016 Record
As at 30 Dec 2016 Pre-2016 Record

2
SECURITIES MARKET (Main Board and GEM)Market Performance
2015 year end % Change
Market capitalisation (HK$bil) 24,761.3 24,683.7 0.31
Number of listed companies * 1,973 1,866 5.73
Number of newly listed companies for the year * 126 ** 138 ^ -8.70
Total equity funds raised (HK$mil) 486,708.2 1,115,642.7 -56.37 - IPO funds raised 194,796.7 263,089.2 -25.96 - Post IPO funds raised 291,911.5 852,553.5 -65.76
Average daily turnover (HK$mil) 66,924 105,630 -36.64
The figures represent the total market capitalisation of all equity securities and exclude other listed securities such as REITs and bonds.
* Excludes listed securities other than equities such as REITs and bonds
** Includes 6 companies which moved their listings from GEM to the Main Board ^ Includes 14 companies which moved their listings from GEM to the Main Board
Funds raised in 2016 are provisional figures
Percentage changes are calculated based on rounded figuresIndividual figures for Main Board and GEM are on page 3 and page 4
2016 year endAs at

3
SECURITIES MARKETMarket Performance
2016 year end 2015 year end % Change 2016 year end 2015 year end % Change
Market capitalisation (HK$bil) 24,450.4 24,425.6 0.10 310.9 258.2 20.41
Number of listed companies * 1,713 1,644 4.20 260 222 17.12
Number of newly listed companies for the year * 81 ** 104 ^ -22.12 45 34 32.35
Number of delistings 12 8 50.00 7 ** 16 ^ -56.25
Number of listed securities 8,330 8,792 -5.25 261 223 17.04 - Equities 1,724 1,653 4.30 260 222 17.12 - Warrants ▪ Equity warrants 8 12 -33.33 1 1 0.00 ▪ Derivative warrants 3,705 4,590 -19.28 N/A N/A - - Callable Bull / Bear Contracts 1,844 1,630 13.13 N/A N/A - - Debt securities 892 762 17.06 N/A N/A - - Unit trusts and mutual funds ▪ Exchange Traded Funds (ETFs) + 133 133 0.00 N/A N/A - ▪ Leveraged and Inverse Products (L&I) ++ 12 - - N/A N/A - ▪ REITs 11 11 0.00 N/A N/A - ▪ Others 1 1 0.00 N/A N/A -
The figures represent the total market capitalisation of all equity securities and exclude other listed securities such as REITs and bonds
* Excludes listed securities other than equities such as REITs and bonds
** Includes 6 companies which moved their listings from GEM to the Main Board ^ Includes 14 companies which moved their listings from GEM to the Main Board + Excludes 2 iShares of ETFs under pilot programmes++ Trading commenced on 13 June 2016
Percentage changes are calculated based on rounded figures
Main BoardAs at
GEMAs at

4
Market Performance (continued)
2016 year end 2015 year end % Change 2016 year end 2015 year end % ChangeTotal funds raised (HK$mil) 1,712,095.5 2,510,205.2 -31.79 18,793.7 22,091.3 -14.93 Total equity funds raised (HK$mil) 467,914.5 1,093,551.5 -57.21 18,793.7 22,091.3 -14.93 - IPO funds raised 190,205.9 260,348.4 -26.94 4,590.7 2,740.8 67.49 - Post IPO funds raised 277,708.6 833,203.1 -66.67 14,202.9 19,350.4 -26.60
Funds raised by other newly listed securities (HK$mil) - Warrants ▪ Equity warrants 0 0 - 0 0 - ▪ Derivative warrants 105,835 182,370 -41.97 N/A N/A - - Callable Bull / Bear Contracts 363,738 483,527 -24.77 N/A N/A - - Debt securities 774,608 750,757 3.18 N/A N/A - - Unit trusts and mutual funds ▪ Exchange Traded Funds (ETFs) NA ^ NA ^ - N/A N/A - ▪ REITs 0 0 - N/A N/A -
Total turnover (HK$mil) 16,279,975 25,835,958 -36.99 116,449 254,663.3 -54.27 - Equities 11,056,704 17,227,618 -35.82 116,407 254,618 -54.28 - Warrants ▪ Equity warrants 311 3,936 -92.09 42.7 45.7 -6.47 ▪ Derivative warrants 2,726,996 4,504,079 -39.45 N/A N/A - - Callable Bull / Bear Contracts 1,371,573 1,836,854 -25.33 N/A N/A - - Debt securities 21,278 9,381 126.83 N/A N/A - - Unit trusts and mutual funds ▪ Exchange Traded Funds (ETFs) 1,011,413 2,170,959 -53.41 N/A N/A - ▪ Leveraged and Inverse Products (L&I) * 505 - - N/A N/A - ▪ REITs 91,086 82,028 11.04 N/A N/A - ▪ Others 109 1,104 -90.09 N/A N/A -Average daily turnover (HK$mil) 66,449 104,599 -36.47 475 1,031 -53.90Number of trading days 245 247 245 247 ̂ Figure is not available as the ETFs were not issued through IPOs
* Trading commenced on 13 June 2016Funds raised in 2016 are provisional figures
Includes non-HKD securities. Fundraising and turnover figures have been converted into HKD
Percentage changes are calculated based on rounded figures. Numbers may not add up to the totals due to rounding
GEM Main Board
5
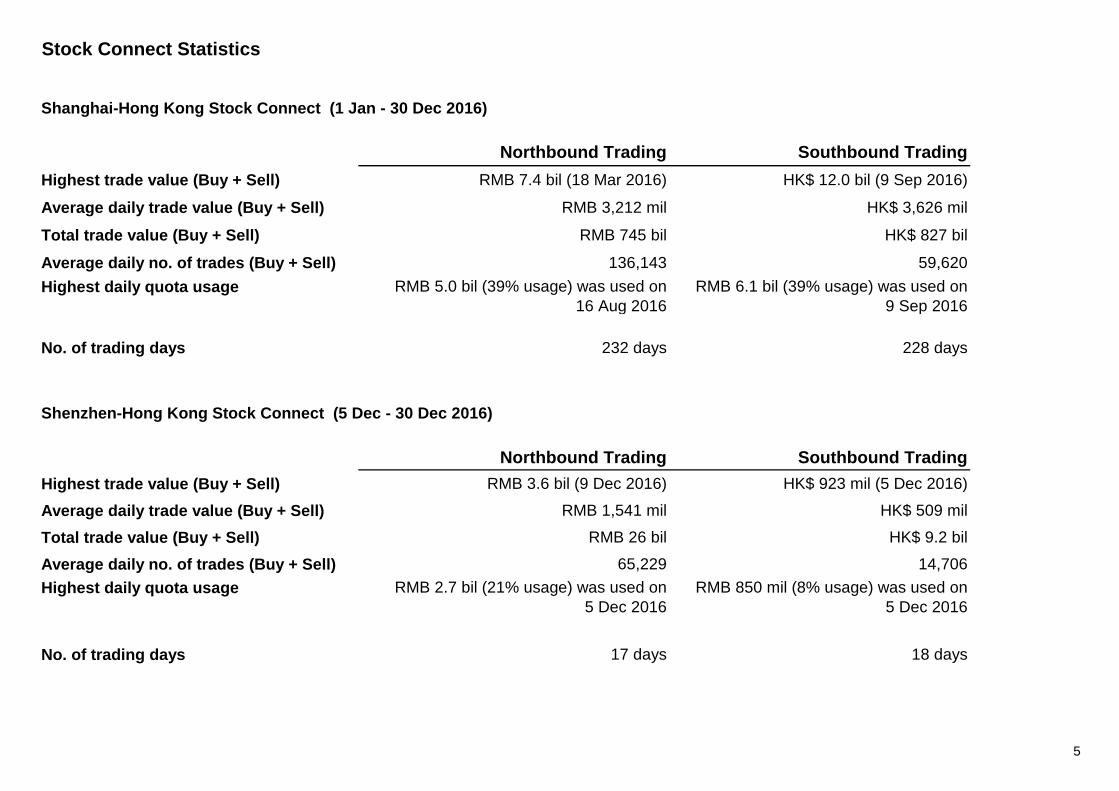
Stock Connect Statistics
Shanghai-Hong Kong Stock Connect (1 Jan - 30 Dec 2016)
Northbound Trading Southbound TradingHighest trade value (Buy + Sell) RMB 7.4 bil (18 Mar 2016) HK$ 12.0 bil (9 Sep 2016)
Average daily trade value (Buy + Sell) RMB 3,212 mil HK$ 3,626 mil
Total trade value (Buy + Sell) RMB 745 bil HK$ 827 bil
Average daily no. of trades (Buy + Sell) 136,143 59,620Highest daily quota usage RMB 5.0 bil (39% usage) was used on
16 Aug 2016RMB 6.1 bil (39% usage) was used on
9 Sep 2016
No. of trading days 232 days 228 days
Northbound Trading Southbound TradingHighest trade value (Buy + Sell) RMB 3.6 bil (9 Dec 2016) HK$ 923 mil (5 Dec 2016)
Average daily trade value (Buy + Sell) RMB 1,541 mil HK$ 509 mil
Total trade value (Buy + Sell) RMB 26 bil HK$ 9.2 bil
Average daily no. of trades (Buy + Sell) 65,229 14,706Highest daily quota usage RMB 2.7 bil (21% usage) was used on
5 Dec 2016RMB 850 mil (8% usage) was used on
5 Dec 2016
No. of trading days 17 days 18 days
Shenzhen-Hong Kong Stock Connect (5 Dec - 30 Dec 2016)

6
Closing Indices
30 Dec 2016 31 Dec 2015 % Change
Hang Seng Index 22000.56 21914.40 0.39
Hang Seng China Enterprises Index (H Shares) 9394.87 9661.03 -2.75
Hang Seng China-Affiliated Corporations Index (Red Chips) 3587.99 4052.12 -11.45
S&P/HKEX LargeCap Index 27926.13 27007.12 3.40
S&P/HKEX GEM Index 358.53 476.79 -24.80
CES China 120 Index 5052.40 5044.06 0.17
CES China A80 Index 5911.41 6296.47 -6.12
CES China HK Mainland Index 5515.90 5418.21 1.80
As at

7
IPO Equity Funds Raised (Jan - Dec 2016)
Rank Exchange
1 HKEX 25,1352 Shanghai Stock Exchange 16,2923 NYSE 14,6934 Nasdaq - US 10,8925 Japan Exchange Group Inc 10,6636 LSE 7,8567 Shenzhen Stock Exchange 7,7758 Nasdaq - Copenhagen 5,8909 Deutsche Boerse 5,78710 Korea Exchange 5,593
Source : HKEX and Bloomberg
Figures are provisional
IPO Equity Funds Raised(US$ million)

8
Total Equity Funds Raised (Jan - Nov 2016)
Rank Exchange
1 Shenzhen Stock Exchange 144,739.52 Euronext 132,081.63 Shanghai Stock Exchange 114,490.04 NYSE 106,380.05 HKEX 53,698.86 TMX Group 42,795.37 LSE Group 30,981.18 BME Spanish Exchanges 28,071.79 Australian Securities Exchange 26,128.7
10 Japan Exchange Group Inc 21,662.0
Source : World Federation of Exchanges (WFE) Monthly Statistics (not including exchanges for which statistics are not available)
Figures are provisional
Total Equity Funds Raised(US$ million)

9
Market Value of Shares of Domestic-listed Companies (Main and Parallel Markets)
November 2016 December 2015Exchange Rank Market value Rank Market value % Change
(US$ million) (US$ million)
NYSE 1 18,992,349.9 1 17,786,787.4 6.8Nasdaq - US 2 7,686,225.3 2 7,280,752.2 5.6Japan Exchange Group Inc 3 4,987,478.2 3 4,894,919.1 1.9Shanghai Stock Exchange 4 4,281,986.1 4 4,549,288.0 -5.9Shenzhen Stock Exchange 5 3,412,904.5 6 3,638,731.3 -6.2Euronext 6 3,311,994.5 7 3,305,901.4 0.2LSE Group 7 3,294,827.5 5 3,878,774.2 -15.1HKEX 8 3,291,144.8 8 3,184,874.2 3.3TMX Group 9 1,961,397.8 10 1,591,928.6 23.2Deutsche Boerse 10 1,616,278.1 9 1,715,800.5 -5.8
Source : World Federation of Exchanges (WFE) Monthly Statistics (not including exchanges for which statistics are not available)
Market value excludes investment funds
TMX Group includes TSX Venture market cap
Percentage changes are calculated based on rounded figures
10
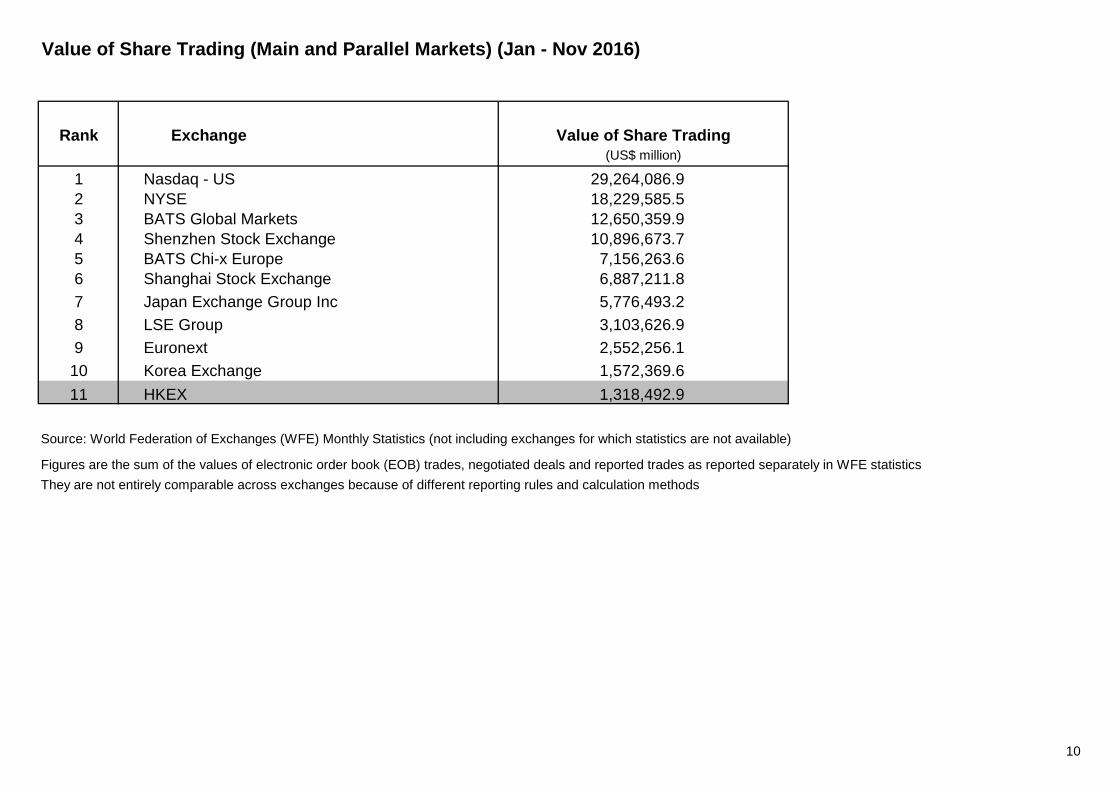
Value of Share Trading (Main and Parallel Markets) (Jan - Nov 2016)
Rank Exchange
1 Nasdaq - US 29,264,086.92 NYSE 18,229,585.53 BATS Global Markets 12,650,359.94 Shenzhen Stock Exchange 10,896,673.75 BATS Chi-x Europe 7,156,263.66 Shanghai Stock Exchange 6,887,211.87 Japan Exchange Group Inc 5,776,493.28 LSE Group 3,103,626.99 Euronext 2,552,256.1
10 Korea Exchange 1,572,369.611 HKEX 1,318,492.9
Source: World Federation of Exchanges (WFE) Monthly Statistics (not including exchanges for which statistics are not available)
Figures are the sum of the values of electronic order book (EOB) trades, negotiated deals and reported trades as reported separately in WFE statisticsThey are not entirely comparable across exchanges because of different reporting rules and calculation methods
Value of Share Trading(US$ million)

11
Total Turnover of Securitised Derivatives, including Warrants and CBBCs (Jan - Nov 2016)
Rank Exchange
1 HKEX 494,878.3 2 Deutsche Boerse 37,772.0 3 Tel-Aviv Stock Exchange 31,778.3 4 LSE Group 24,131.8 5 The Stock Exchange of Thailand 17,416.2 6 Korea Exchange 16,828.2 7 SIX Swiss Exchange 14,002.0 8 Taiwan Stock Exchange 12,312.8 9 Euronext 9,722.8
10 Singapore Exchange 4,722.7
Source: World Federation of Exchanges (WFE) Monthly Statistics (not including exchanges for which statistics are not available)
Due to different reporting rules & calculation methods, turnover figures are not entirely comparable
Figures include the turnover of structured products such as derivative warrants, equity warrants, callable bull/bear contracts and equity linked instruments
Turnover(US$ million)

12
Total Turnover of ETFs (Jan - Nov 2016)
Rank Exchange
1 Nasdaq - US 7,583,321.22 NYSE 4,846,873.73 Japan Exchange Group Inc 533,809.94 LSE Group 476,279.55 Deutsche Boerse 167,979.16 Korea Exchange 155,627.77 Euronext 147,676.78 HKEX 121,247.59 Shenzhen Stock Exchange 99,057.510 Shanghai Stock Exchange 86,280.5
Source: World Federation of Exchanges (WFE) Monthly Statistics (not including exchanges for which statistics are not available)
Due to different reporting rules & calculation methods, turnover figures are not entirely comparable
Turnover(US$ million)

13
Ten Largest IPO Funds Raised by Newly Hong Kong Listed Companies in 2016
Rank Company Name
1 Postal Savings Bank of China Co Ltd - H Shares (1658) 59.15
2 China Resources Pharmaceutical Group Ltd (3320) 15.06
3 China Zheshang Bank Co Ltd - H Shares (2016) 15.03
4 China Merchants Securities Co Ltd - H Shares (6099) 10.70
5 Everbright Securities Co Ltd - H Shares (6178) 8.93
6 BOC Aviation Ltd (2588) 8.74
7 DFZQ - H Shares (3958) 8.37
8 CSC Financial Co Ltd - H Shares (6066) 7.70
9 Bank of Tianjin Co Ltd - H Shares (1578) 7.68
10 China Development Bank Financial Leasing Co Ltd - H Shares (1606) 6.28
IPO Funds Raised(HK$ billion)

14
Ten Largest IPO Funds Raised by Newly Hong Kong Listed Companies since 1986
Rank Company Name
1 AIA Group Ltd (1299) 159.08
2 Industrial and Commercial Bank of China Ltd - H Shares (1398) 124.95
3 Agricultural Bank of China Ltd - H Shares (1288) 93.52
4 Bank of China Ltd - H Shares (3988) 86.74
5 Glencore International plc (805) 77.75
6 China Construction Bank Corporation - H Shares (939) 71.58
7 Postal Savings Bank of China Co Ltd - H Shares (1658) 59.15
8 China Unicom (Hong Kong) Ltd (762) 43.61
9 Huatai Securities Co Ltd - H Shares (6886) 38.76
10 China CITIC Bank Corporation Ltd - H Shares (998) 32.92
IPO Funds Raised(HK$ billion)

15
CHINA DIMENSION
Mainland Enterprises refer to the following:
H-Share Companies
Red Chip Companies
Mainland Private Enterprises
H-share companies are enterprises that are incorporated in the Mainland which are either controlled by Mainland Government entities or individuals.
Red chip companies are enterprises that are incorporated outside of the Mainland and are controlled by Mainland Government entities.
Mainland private enterprises are companies that are incorporated outside of the Mainland and are controlled
by Mainland individuals.

16
MAIN BOARD and GEM
Performance of Mainland Enterprises
% ChangeNumber of listed companies 1,002 (51 %) 951 (51 %) 5
Number of newly listed companies for the year 57 # (45 %) 75 ^ (54 %) -24
Market capitalisation (HK$bil) 15,663.89 (63 %) 15,319.82 (62 %) 2
% Change
Average daily equity turnover (HK$mil) 32,191.0 (71 %) 51,439.4 (73 %) -37
Total equity funds raised (HK$bil) 347.2 * (71 %) 658.1 (59 %) -47
▪ IPO funds raised (HK$bil) 182.4 * (94 %) 242.8 (92 %) -25
▪ Post IPO funds raised (HK$bil) 164.8 * (56 %) 415.3 (49 %) -60
Total equity funds raised since Jan 1993 (HK$bil) 5,442.8 * (61 %) 5,095.6 (60 %) 7
The share of Mainland enterprises of the equity market total is presented as a percentage in brackets# Includes 15 H-share companies, 3 red chips and 39 Mainland private enterprises (Among which 3 Mainland private enterprises moved their listings from GEM to the Main Board)^ Includes 31 H-share companies, 2 red chips and 42 Mainland private enterprises (Among which 5 Mainland private enterprises moved their listings from GEM to the Main Board)
* Provisional figuresPercentage changes are calculated based on rounded figuresNumbers may not add up to the totals due to rounding
As at
31 Dec 201530 Dec 2016
31 Dec 201530 Dec 2016
As of

17
MAIN BOARD and GEM
Market Capitalisation of Mainland Enterprises
% of Mainland Enterprises of Total Market Capitalisation
2007 5,079.52 5,524.44 1,445.06 12,049.01 582008 2,731.74 2,875.90 553.27 6,160.91 602009 4,713.48 3,868.69 1,861.58 10,443.75 582010 5,230.48 4,385.97 2,319.32 11,935.77 572011 4,101.27 4,002.52 1,619.95 9,723.75 552012 4,896.00 4,839.06 2,862.72 12,597.78 572013 4,912.54 4,828.40 3,949.63 13,690.57 572014 5,729.66 5,228.02 4,119.94 15,077.62 602015 5,164.64 5,150.70 5,004.48 15,319.82 622016 5,323.12 4,912.35 5,428.43 15,663.89 63
* Revised methodology for classification of listed companies took effect from 1 January 2012 (Mainland private enterprises were classified as Non-H Share Mainland Private Enterprises before revision).
(HK$ billion) (HK$ billion) (HK$ billion) (HK$ billion)
As atYear-end
Market Capitalisation of H Shares
Market Capitalisationof Red Chips
Market Capitalisation of Mainland Private
Enterprises*Total Market Capitalisation of
Mainland Enterprises

18
MAIN BOARD and GEM
Number of Issuers of Mainland Enterprises
No. of Issuers (H Shares)
No. of Issuers(Red Chips)
No. of Issuers (Mainland Private
Enterprises)*Total No. of Issuers
(Mainland Enterprises)
% of Mainland Enterprises of Total Number of Listed
Companies in the Equity Market
2007 146 93 200 439 352008 150 93 222 465 372009 156 97 271 524 402010 163 102 327 592 422011 168 107 365 640 432012 176 108 437 721 472013 182 122 493 797 492014 202 133 541 876 502015 229 145 577 951 512016 241 153 608 1002 51
* Revised methodology for classification of listed companies took effect from 1 January 2012 (Mainland private enterprises were classified as Non-H Share Mainland Private Enterprises before revision).
As atYear-end

19
MAIN BOARD and GEM
Total Annual Trading Turnover of Mainland Enterprises
Year
% of Mainland Enterprises of Total Annual Equity
Turnover
2007 7,772.53 2,736.44 1,040.43 11,549.41 692008 6,138.45 2,285.07 553.77 8,977.30 712009 5,168.31 1,938.05 1,230.20 8,336.55 722010 4,717.78 1,931.03 1,787.32 8,436.13 682011 4,666.86 1,700.15 1,599.61 7,966.62 662012 3,682.20 1,460.30 1,485.93 6,628.42 702013 4,221.56 1,711.58 2,103.48 8,036.62 722014 4,401.99 1,902.23 2,628.98 8,933.20 712015 6,890.68 2,420.40 3,394.45 12,705.53 732016 3,988.85 1,566.14 2,331.82 7,886.80 71
* Revised methodology for classification of listed companies took effect from 1 January 2012 (Mainland private enterprises were classified as Non-H Share Mainland Private Enterprises before revision).
Total Annual Trading Turnover of H Shares
Total Annual Trading Turnover of Red Chips
Total Annual Trading Turnover of
Mainland Private Enterprises*
Total Annual Trading Turnover of Mainland
Enterprises (HK$ billion) (HK$ billion) (HK$ billion) (HK$ billion)

20
DERIVATIVES MARKETDerivatives Market Statistics of Key Products
Volume Period-end Volume Period-end(Contracts) Open Interest (Contracts) Open Interest
Futures and Options 188,150,672 9,296,110 189,824,363 7,266,980
Futures 84,100,129 625,456 73,462,212 617,026
Hang Seng Index Futures 32,313,994 123,004 21,239,775 97,118
Mini-Hang Seng Index Futures 12,477,552 9,572 10,046,556 7,556
H-shares Index Futures 33,031,130 322,024 33,379,310 384,767
Mini H-shares Index Futures 4,870,262 4,399 7,506,543 6,088
HSI Dividend Point Index Futures 16,886 4,621 9,573 2,581
HSCEI Dividend Point Index Futures 589,188 109,112 205,269 75,426
HSI Volatility Index Futures 87 0 464 1
CES China 120 Index Futures 642 16 27,427 5
CES Gaming Top 10 Index Futures* 0 0 - -
Hang Seng Mainland Oil & Gas Index Futures* 6 1 - -
Hang Seng Mainland Banks Index Futures* 285 8 - -
Hang Seng Mainland Healthcare Index Futures* 0 0 - -
Hang Seng Mainland Properties Index Futures* 5 0 - -
Hang Seng IT Hardware Index Futures* 0 0 - -
Hang Seng Software & Services Index Futures* 0 0 - -
Stock Futures 225,978 5,365 729,013 20,088
Three-month HIBOR Futures 52 40 90 0
One-month HIBOR Futures 0 0 6 0
* Trading commenced on 9 May 2016
Up to 31 Dec 2015Up to 30 Dec 2016

21
DERIVATIVES MARKETDerivatives Market Statistics of Key Products (continued)
Volume Period-end Volume Period-end(Contracts) Open Interest (Contracts) Open Interest
Futures and Options
RMB Currency Futures - USD/CNH Futures 538,594 45,635 262,433 23,046
RMB Currency Futures - EUR/CNH Futures^ 952 98 - -
RMB Currency Futures - JPY/CNH Futures^ 390 6 - -
RMB Currency Futures - AUD/CNH Futures^ 88 8 - -
RMB Currency Futures - CNH/USD Futures^ 4,867 1,494 - -
London Aluminium Mini Futures 1,829 2 11,554 75
London Zinc Mini Futures 12,394 17 16,654 109
London Copper Mini Futures 3,354 3 27,388 16
London Lead Mini Futures† 7 0 0 0
London Nickel Mini Futures† 11,550 31 155 150
London Tin Mini Futures† 37 0 2 0
Options 104,050,543 8,670,654 116,362,151 6,649,954
Hang Seng Index Options 9,353,749 249,699 7,515,466 172,564
Mini-Hang Seng Index Options 1,424,379 11,917 1,033,813 4,945
Flexible Hang Seng Index Options 560 0 5,300 2,975
H-shares Index Options 19,475,726 2,066,340 15,304,245 1,625,661
Mini H-shares Index Options†† 197,399 3,265 - -
Flexible H-shares Index Options 16,616 11,930 39,848 16,131
Stock Options 73,582,114 6,327,503 92,463,479 4,827,678
^ Trading commenced on 30 May 2016† Trading commenced on 14 Dec 2015
†† Trading commenced on 5 Sep 2016
Up to 30 Dec 2016 Up to 31 Dec 2015

22
Turnover in the Derivatives Markets (Jan - Nov 2016)
Rank Exchange
1 National Stock Exchange of India 1,252.02 EUREX 1,072.53 BM&FBOVESPA 813.44 Chicago Board Options Exchange 731.95 CME Group 710.56 Korea Exchange 519.67 Moscow Exchange 487.98 Nasdaq - US 474.79 NYSE 342.3
10 Japan Exchange Group Inc 301.5•••
•••
•••
14 HKEX 169.2
Source: World Federation of Exchanges (WFE) Monthly Statistics (not including exchanges for which statistics are not available)
Figures include turnover in stock options, single stock futures and stock index options and futures.
It should be noted that contracts vary in size
Figures are provisional
Contracts (million)

23
Notional Turnover in the Derivatives Markets (Jan - Nov 2016)
Rank Exchange
1 CME Group 77,192,700.02 Korea Exchange 37,459,102.13 EUREX 34,076,338.04 National Stock Exchange of India 11,488,280.05 Japan Exchange Group Inc 9,500,570.06 HKEX 8,731,956.17 ICE Futures Europe 8,415,564.28 TAIFEX 4,234,391.19 ICE Futures US 3,938,879.010 Euronext 3,020,973.8
Source: World Federation of Exchanges (WFE) Monthly Statistics (not including exchanges for which statistics are not available)
Some exchanges provide information regarding turnover in terms of number of contracts traded only but the corresponding turnover in terms of notional value is not available. Readers should exercise caution when comparing performance
Figures include turnover in stock options, single stock futures and stock index options and futures.
The notional value of derivatives is the number of contracts traded multiplied by the contracts’ underlying value. The contracts’ underlying value is calculated by multiplying the market price of the underlying asset for each contract times the contract’s multiplier. It is an approximate measure of the underlying value of the number of contracts traded.
Figures are provisional
Notional Turnover
(US$ million)

24
CCASS STATISTICS
2016 2015
Average Daily Exchange Trades Handled by CCASS
- Number of Trades 1,081,017 1,397,853
- Value of Trades $66.9 billion $102.8 billion
- Share Quantity Involved 186.2 billion 216.8 billion
Average Daily Settlement Instructions (SIs) Settled by CCASS
- Number of SIs 83,194 101,029
- Value of SIs $181.9 billion $254.7 billion
- Share Quantity Involved 46.8 billion 55.9 billion
Average Daily Investor Settlement Instructions (ISIs) Settled by CCASS
- Number of ISIs 277 443
- Value of ISIs $136.5 million $199.8 million
- Share Quantity Involved 87.3 million 134.4 million
Up to year-end

25
CCASS STATISTICS
2016 2015
Average Daily Settlement Efficiency of CNS Stock Positions on Due Day (T+2)
99.91% 99.91%
Average Daily Settlement Efficiency of CNS Stock Positions on the Day following the Due Day (T+3)
99.99% 99.99%
Average Daily Buy-ins Executed on T+3
- Number of Brokers Involved 3 5
- Number of Buy-ins 3 5
- Value of Buy-ins $2.32 million $3.7 million
Shares Deposited in the CCASS Depository
- Number of Shares 5,878.9 billion 5,467.2 billion
- Percentage of Total Issued Share Capital of the Admitted Securities 75% 75%
- Value of Shares $15,685.8 $15,071.2 billion
- Percentage of the Total Market Capitalisation of the Admitted Securities
57% 57%
Up to year-end

26
London Metal Exchange Statistics
AH Aluminium High GradeAA Aluminium AlloyCA Copper A GradePB LeadNI Primary NickelSN TinZS Special High Grade ZincNA North American Special Aluminium AlloyMX LMEXFM Steel Mediterranean BilletCO CobaltMO MolybdenumMC LMEmini Copper A GradeMA LMEmini Primary AluminiumMZ LMEmini Special High Grade ZincOA Primary Aluminium Monthly Average FutureOL Aluminium Alloy Monthly Average FutureOC Copper Monthly Average FutureOP Lead Monthly Average FutureON Nickel Monthly Average FutureOS Tin Monthly Average FutureOZ Zinc Monthly Average FutureOM NASAAC Monthly Average FutureAE Aluminium Premium Future East AsiaAN Aluminium Premium Future Extended USAS Aluminium Premium Future South East AsiaAW Aluminium Premium Future Western EuropeSC Steel ScrapSR Steel Rebar
Grand Total
Number of trading days 253 253
56,082,746 62,541,050 -10.3%128,006 217,503 -41.1%
Turnovers in Lots
Futures & Options
2016 2015 % Change
20,690,179 20,699,745 0.0%1,360,010 1,469,389 -7.4%
38,739,654 41,048,609 -5.6%10,936,361 12,971,442 -15.7%
- -- 28 -100.0%
28,123,804 30,037,039 -6.4%364,967 546,355 -33.2%
- -- -
7,894 8,668 -8.9%144 356 -59.6%
- -3,083 4,496 -31.4%
- -12,488 9,466 31.9%
960 304 215.8%2,571 1,957 31.4%
1,283 968 32.5%752 363 107.2%
- -
92 - 100.0%- -
Average daily volume 618,627 670,189
Product
8,637 69 12417.4%156,512,730 169,557,846 -7.7%
- -49,099 39 125794.9%
- -

27
London Metal Exchange Statistics
AH Aluminium High GradeAA Aluminium AlloyCA Copper A GradePB LeadNI Primary NickelSN TinZS Special High Grade ZincNA North American Special Aluminium AlloyMX LMEXFM Steel Mediterranean BilletCO CobaltMO MolybdenumMC LMEmini Copper A GradeMA LMEmini Primary AluminiumMZ LMEmini Special High Grade ZincOA Primary Aluminium Monthly Average FutureOL Aluminium Alloy Monthly Average FutureOC Copper Monthly Average FutureOP Lead Monthly Average FutureON Nickel Monthly Average FutureOS Tin Monthly Average FutureOZ Zinc Monthly Average FutureOM NASAAC Monthly Average FutureAE Aluminium Premium Future East AsiaAN Aluminium Premium Future Extended USAS Aluminium Premium Future South East AsiaAW Aluminium Premium Future Western EuropeSC Steel ScrapSR Steel Rebar
Totals
Turnovers in Lots
Futures
2016 2015 % ChangeProduct
36,947,881 38,557,831 -4.2%10,571,590 12,522,608 -15.6%
53,073,441 59,880,649 -11.4%128,006 217,503 -41.1%
26,942,407 28,751,185 -6.3%358,797 540,645 -33.6%
19,947,714 19,959,729 -0.1%1,353,350 1,463,139 -7.5%
7,894 8,668 -8.9%144 356 -59.6%
- - -- 28 -100.0%
- - -12,488 9,466 31.9%
- - -- - -
1,283 968 32.5%752 363 107.2%
- - -3,083 4,496 -31.4%
92 - 100.0%- - -
960 304 215.8%2,571 1,957 31.4%
- - -49,099 39 125794.9%
- - -- - -
8,637 69 12417.4%149,410,189 161,920,003 -7.7%

28
London Metal Exchange Statistics
AH Aluminium High GradeAA Aluminium AlloyCA Copper A GradePB LeadNI Primary NickelSN TinZS Special High Grade ZincNA North American Special Aluminium Alloy
Totals
ProductAH Aluminium High GradeAA Aluminium AlloyCA Copper A GradePB LeadNI Primary NickelSN TinZS Special High Grade ZincNA North American Special Aluminium Alloy
Totals
2016 2015 % Change
Turnovers in Lots
Options
Product2,915,725 2,608,985 11.8%
- - -1,762,967 2,485,153 -29.1%
364,451 447,282 -18.5%726,373 0.8%
6,660 6,250 6.6%732,523
TAPOS#
2016 2015 % Change93,580 51,416 82.0%
- -28,806 5,625 412.1%
320 1,552 -79.4%9,942 13,643 -27.1%
- -
6,947,861 7,561,774 -8.1%
1,159,365 1,284,521 -9.7%6,170 3,210 92.2%
154,680 76,069 103.3%
22,032 1,333 1552.8%- 2,500 -100.0%
# Traded Average Price Options - the settlement price of this kind of options is based on the average settlement price of the month.

29
PARTICIPANT STATISTICS
As at year-end As at year-end2016 2015 2016 2015
Exchange Participants 592 550 180 179Trading 556 515 180 179Non-trading 36 35 N/A N/A
Clearing Participants
CCASS End of 2016 End of 2015Direct Clearing Participants 533 492General Clearing Participants 9 10Clearing Agency Participants 2 2Custodian Participants 35 36Stock Pledgee Participants 5 5
HKCCClearing Participants 152 151General Clearing Participants 9 9
SEOCHDirect Clearing Participants 65 69General Clearing Participants 9 9
Notes:CCASSA Direct Clearing Participant must be an Exchange Participant of SEHK A General Clearing Participant is entitled to clear securities trades concluded by itself, where applicable, and on behalf of non-clearing Participants with which it has entered into a Clearing AgreementA Clearing Agency Participant must be a body operating the central securities clearing and settlement system or central securities depository systemA Custodian Participant must be an authorised institution under the Banking Ordinance, a trust company under the Trustee Ordinance or a licensed corporation under the Securities and Futures OrdinanceA Stock Pledgee Participant must be an authorised institution under the Banking Ordinance or a licensed money lender under the Money Lenders Ordinance
HKCCBoth a Clearing Participant and a General Clearing Participant must be an Exchange Participant of HKFE A Clearing Participant is entitled to clear Futures Contracts and/or Options Contracts concluded by itselfA General Clearing Participant is entitled to clear Futures Contracts and/or Options Contracts concluded by itself and on behalf of non-clearing Participants with which it has entered into a Clearing Agreement
SEOCHA Direct Clearing Participant and a General Clearing Participant must be an Options Trading Exchange Participant of SEHK A Direct Clearing Participant is entitled to clear Stock Options Contracts concluded by itselfA General Clearing Participant is entitled to clear Stock Options Contracts concluded by itself and on behalf of non-clearing Participants with which it has entered into a Clearing Agreement
Stock Exchange Futures Exchange