Embed Size (px)
Citation preview
Market Speculation and Energy Prices:
A Congressional Perspective
Presentation to UH-GEMI Energy Trading Conference
January 25, 2007
Dan M. BerkovitzCounsel
Permanent Subcommittee on InvestigationsUnited States Senate(Senator Carl Levin)
2
Outline of Presentation
• I. What is the Senate Permanent Subcommittee on Investigations?
• II. PSI Report (2006) on Speculation and Energy Prices
• III. Prospects for Legislation Affecting Energy Trading
3
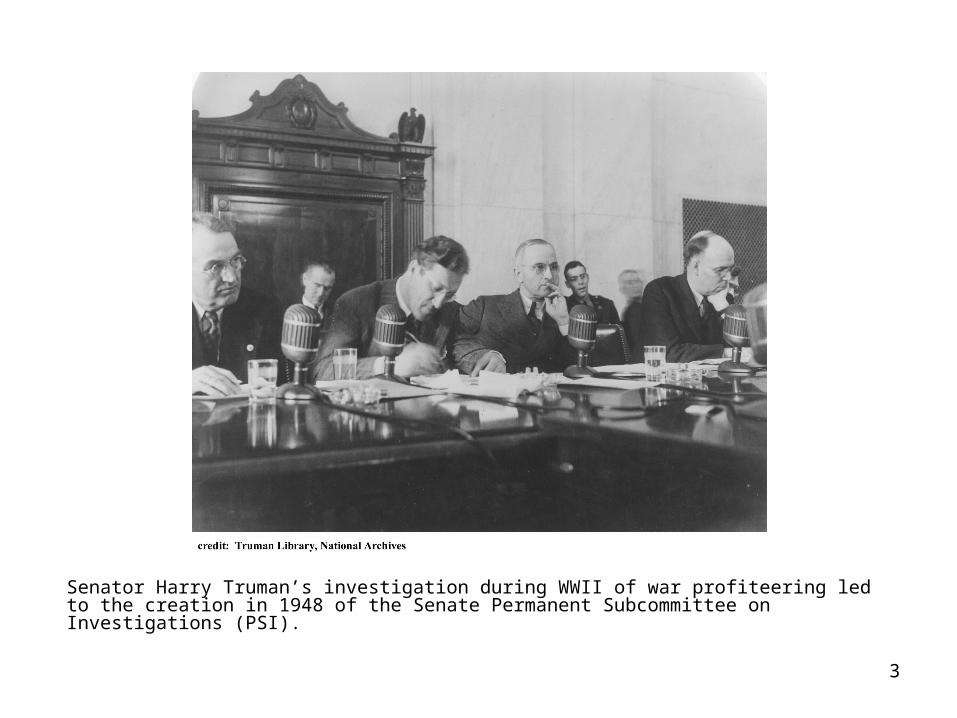
Senator Harry Truman’s investigation during WWII of war profiteering led to the creation in 1948 of the Senate Permanent Subcommittee on Investigations (PSI).
4
PSI Energy Price Investigations
• In the mid-1970s, PSI jurisdiction expanded to include energy supplies and prices under chairmanship of Senator “Scoop” Jackson.– Investigated national security implications of Arab oil embargo– Investigated structure of the oil industry and role of oil majors in pricing
• Recent investigations under Chairman and Ranking Minority Member Carl Levin: – Gasoline price report and hearings (2002).
– Report on oil prices and regulation of energy markets (2003).
-- Report on the role of speculation in rising energy prices (2006).
5
2006 Report: Findings on Speculation
1. There has been a large increase in the amount of financial speculation in energy markets.
2. This increase in speculation contributed to increased prices.
3. This increase in speculation shifted traditional price-inventory relationships.
4. Electronic markets involve the trading of standardized, cleared contracts that are functionally equivalent to futures and perform a price discovery function.
5. The disparity in regulation of various energy markets (Designated Contract Markets vs. Exempt Commercial Markets) impedes market oversight and the ability to prevent price manipulation.
6
What is Speculation?
• A speculator “does not produce or use the commodity, but risks his or her own capital trading futures in that commodity in hopes of making a profit on prices changes.” --CFTC.
• Potential benefits of speculation: – Increases liquidity.– Commercial entities are able to transfer risk of price changes.– Finances storage.
• Potential disadvantages:– Excessive speculation can cause prices to deviate from the
fundamentals of supply and demand. – Increased volatility increases costs of hedging and makes it
more difficult for commercial participants to determine when to hedge.
7
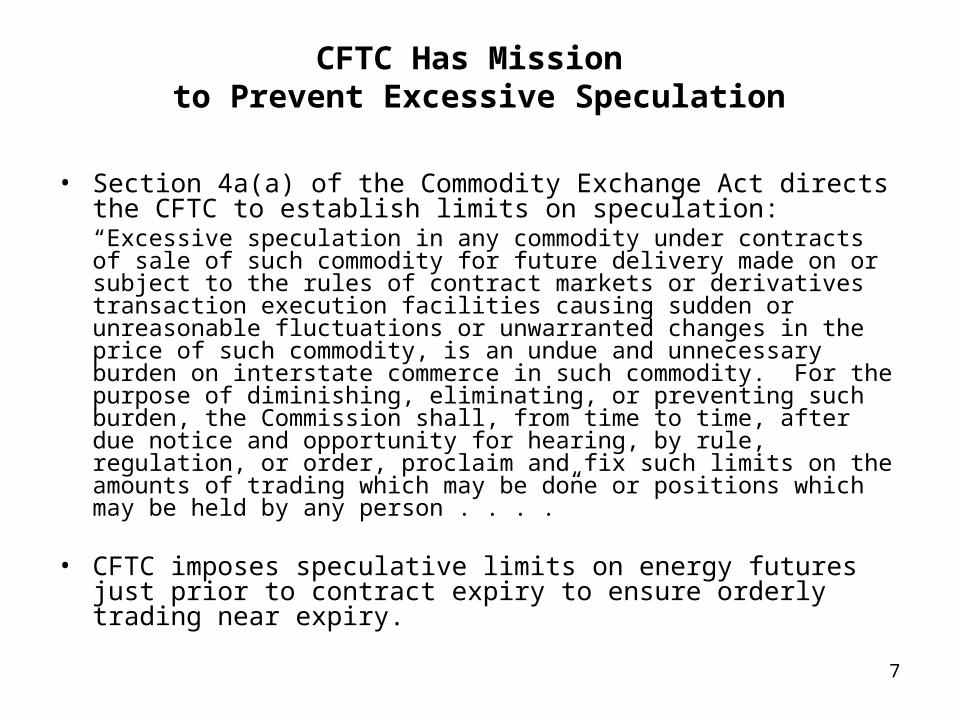
CFTC Has Mission to Prevent Excessive Speculation
• Section 4a(a) of the Commodity Exchange Act directs the CFTC to establish limits on speculation:“Excessive speculation in any commodity under contracts of sale of such commodity for future delivery made on or subject to the rules of contract markets or derivatives transaction execution facilities causing sudden or unreasonable fluctuations or unwarranted changes in the price of such commodity, is an undue and unnecessary burden on interstate commerce in such commodity. For the purpose of diminishing, eliminating, or preventing such burden, the Commission shall, from time to time, after due notice and opportunity for hearing, by rule, regulation, or order, proclaim and fix such limits on the amounts of trading which may be done or positions which may be held by any person . . . .”
• CFTC imposes speculative limits on energy futures just prior to contract expiry to ensure orderly trading near expiry.
8
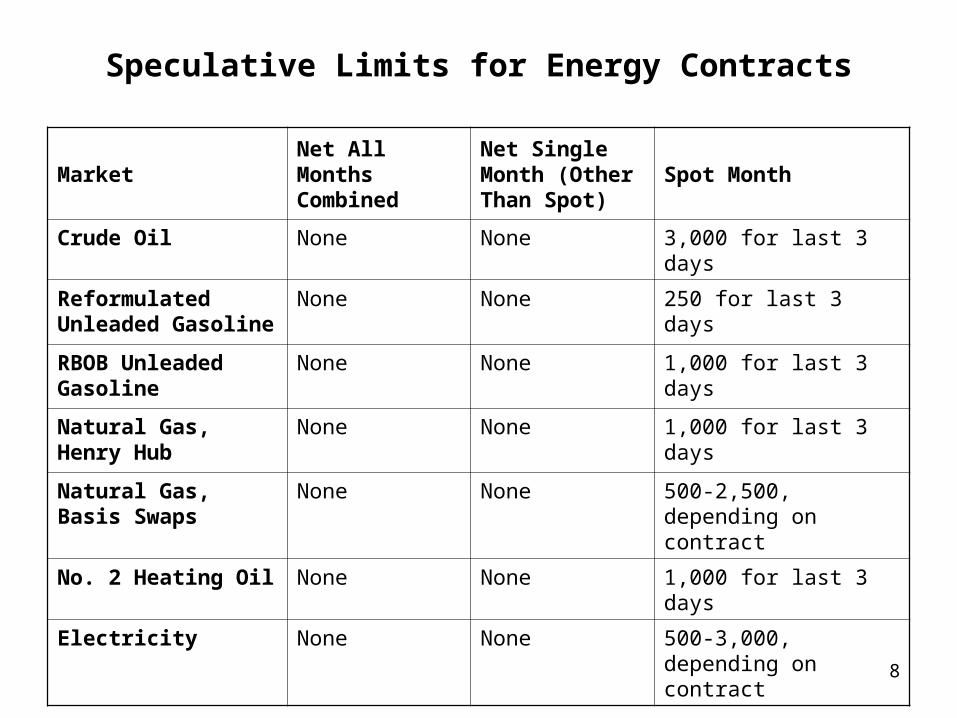
Speculative Limits for Energy Contracts
MarketNet All Months Combined
Net Single Month (Other Than Spot)
Spot Month
Crude Oil None None 3,000 for last 3 days
Reformulated Unleaded Gasoline
None None 250 for last 3 days
RBOB Unleaded Gasoline
None None 1,000 for last 3 days
Natural Gas, Henry Hub
None None 1,000 for last 3 days
Natural Gas, Basis Swaps
None None 500-2,500, depending on contract
No. 2 Heating Oil None None 1,000 for last 3 days
Electricity None None 500-3,000, depending on contract
9
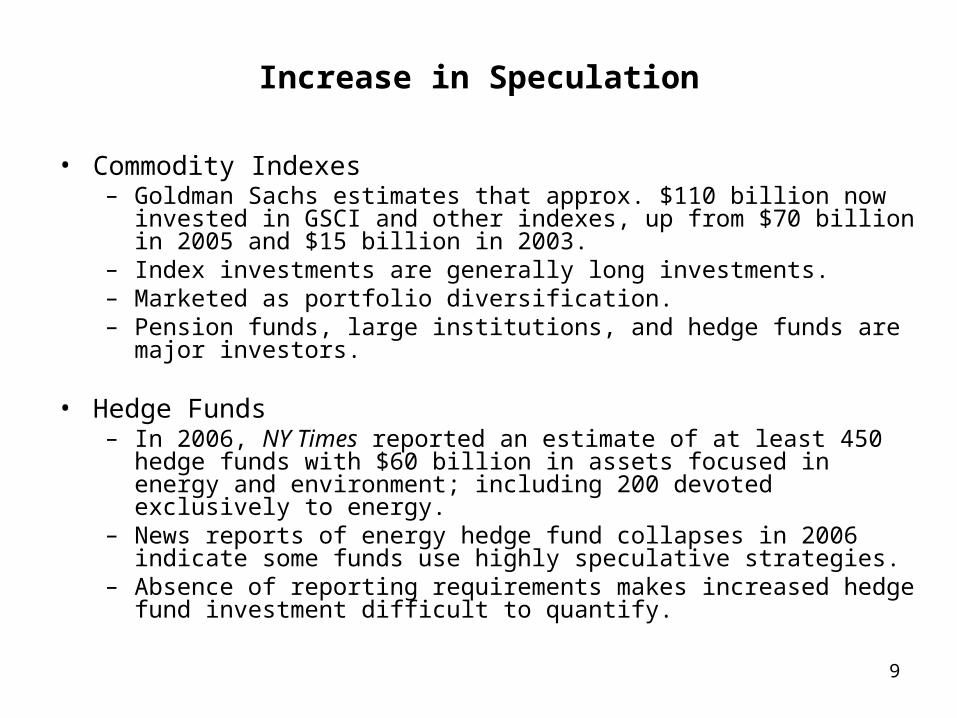
Increase in Speculation
• Commodity Indexes– Goldman Sachs estimates that approx. $110 billion now invested in GSCI
and other indexes, up from $70 billion in 2005 and $15 billion in 2003. – Index investments are generally long investments.– Marketed as portfolio diversification. – Pension funds, large institutions, and hedge funds are major investors.
• Hedge Funds– In 2006, NY Times reported an estimate of at least 450 hedge funds with
$60 billion in assets focused in energy and environment; including 200 devoted exclusively to energy.
– News reports of energy hedge fund collapses in 2006 indicate some funds use highly speculative strategies.
– Absence of reporting requirements makes increased hedge fund investment difficult to quantify.
10
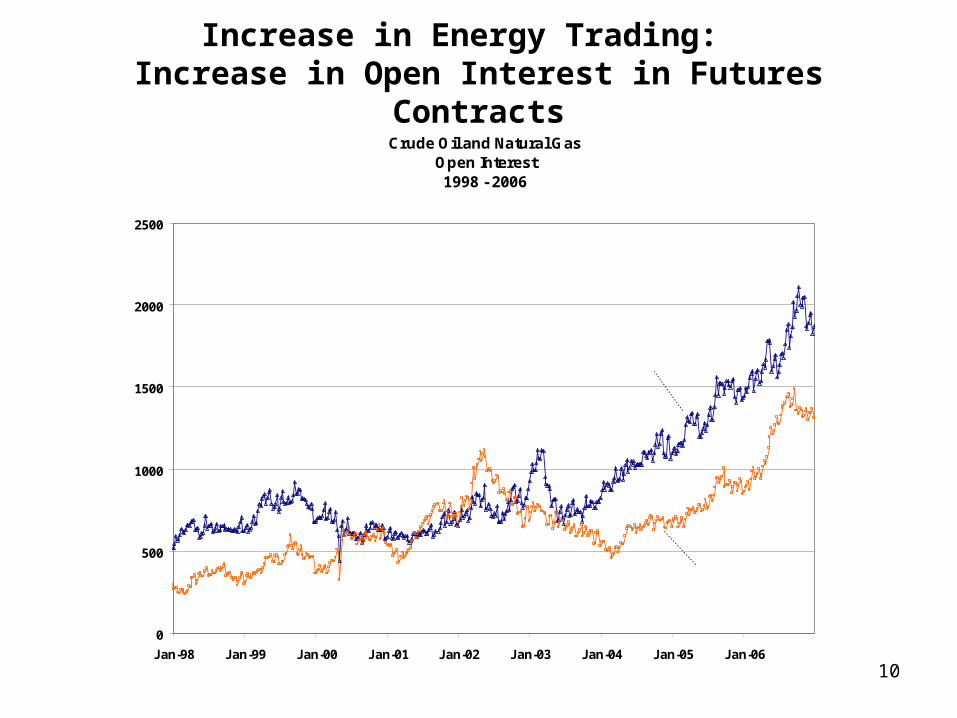
Increase in Energy Trading: Increase in Open Interest in Futures Contracts
Crude Oil and Natural Gas Open Interest1998 - 2006
0
500
1000
1500
2000
2500
Jan-98 Jan-99 Jan-00 Jan-01 Jan-02 Jan-03 Jan-04 Jan-05 Jan-06
Number of Contracts (thousands)
Crude Oil
Natural Gas
11
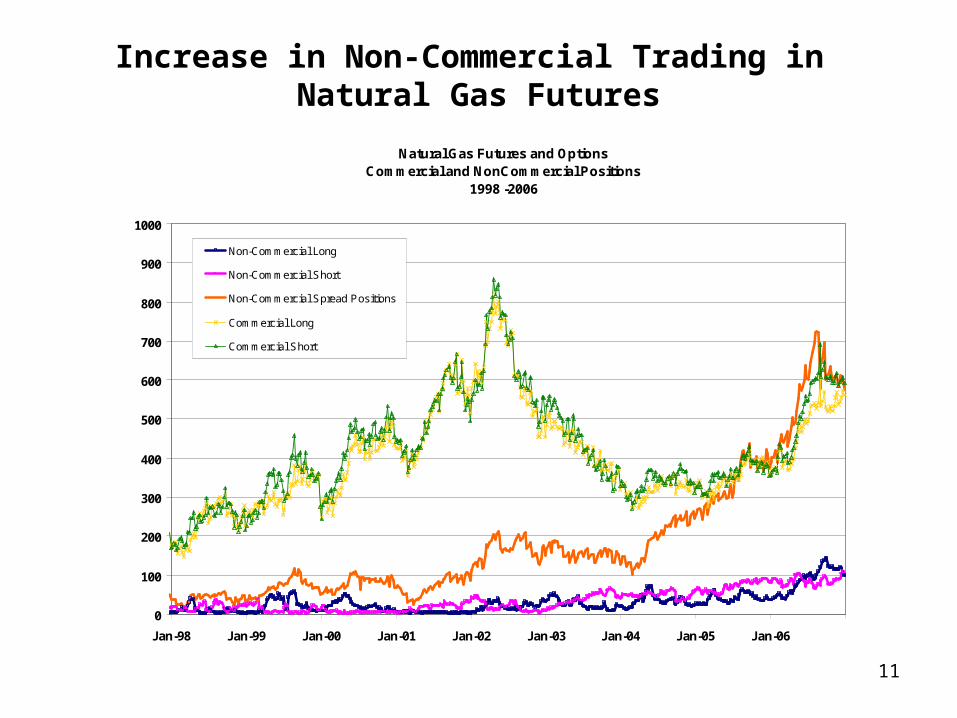
Increase in Non-Commercial Trading in Natural Gas Futures
Natural Gas Futures and OptionsCommercial and NonCommercial Positions
1998 -2006
0
100
200
300
400
500
600
700
800
900
1000
Jan-98 Jan-99 Jan-00 Jan-01 Jan-02 Jan-03 Jan-04 Jan-05 Jan-06
Non-Commercial Long
Non-Commercial Short
Non-Commercial Spread Positions
Commercial Long
Commercial Short
Number of contracts (thousands)
12
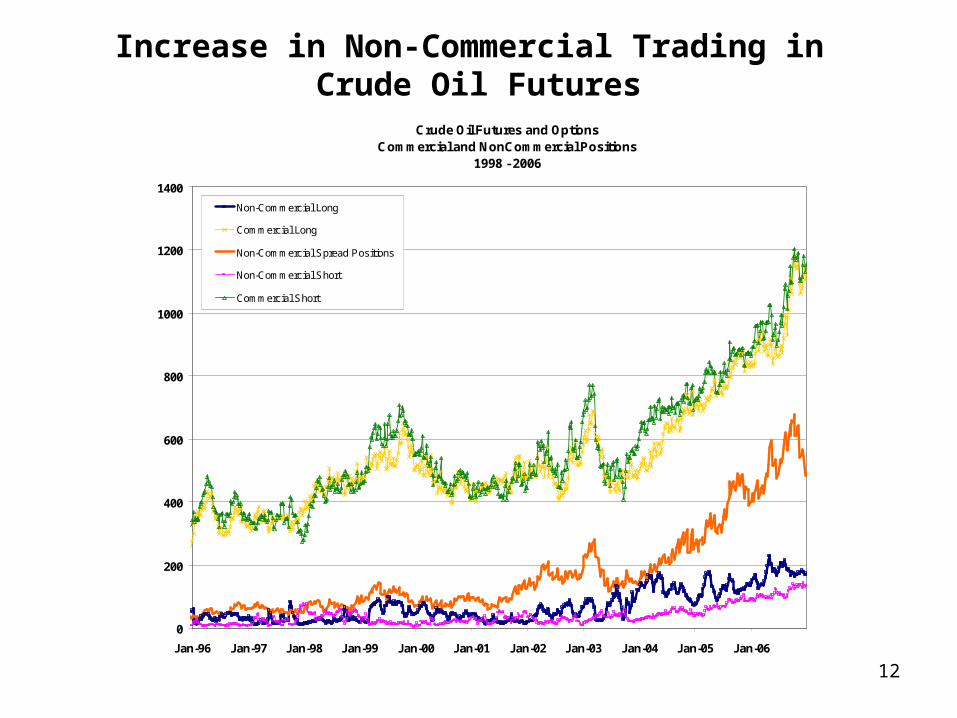
Increase in Non-Commercial Trading in Crude Oil Futures
Crude Oil Futures and OptionsCommercial and NonCommercial Positions
1998 - 2006
0
200
400
600
800
1000
1200
1400
Jan-96 Jan-97 Jan-98 Jan-99 Jan-00 Jan-01 Jan-02 Jan-03 Jan-04 Jan-05 Jan-06
Non-Commercial Long
Commercial Long
Non-Commercial Spread Positions
Non-Commercial Short
Commercial Short
Number of contracts (thousands)
13
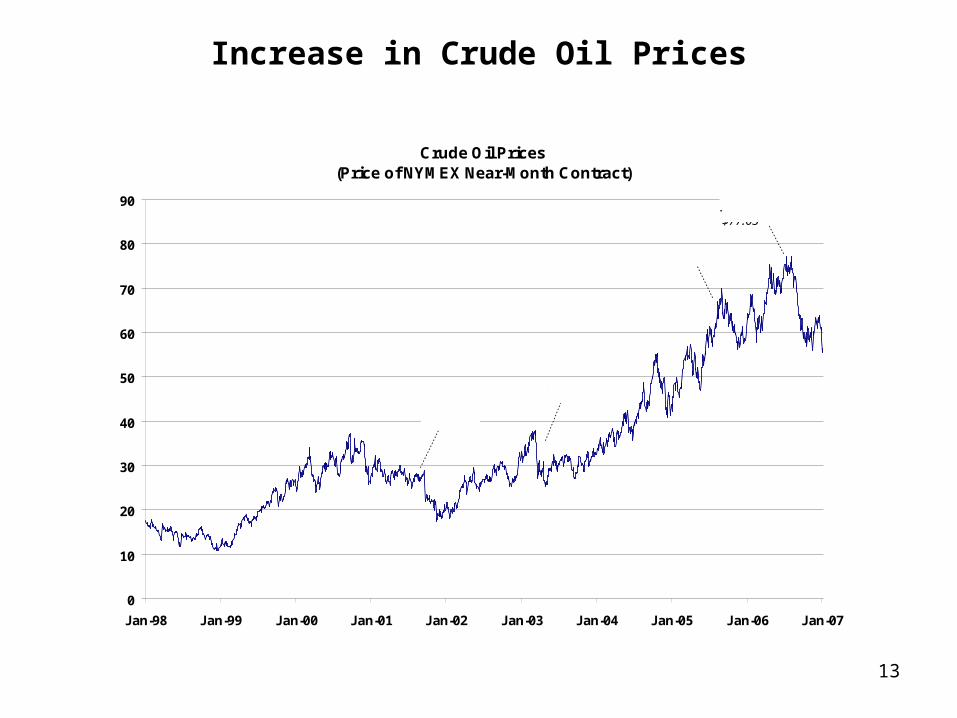
Increase in Crude Oil Prices
Crude Oil Prices(Price of NYMEX Near-Month Contract)
0
10
20
30
40
50
60
70
80
90
Jan-98 Jan-99 Jan-00 Jan-01 Jan-02 Jan-03 Jan-04 Jan-05 Jan-06 Jan-07
$/barrel
Iraq war begins
9-11-01
Katrina
July 14, 2006$77.03
14
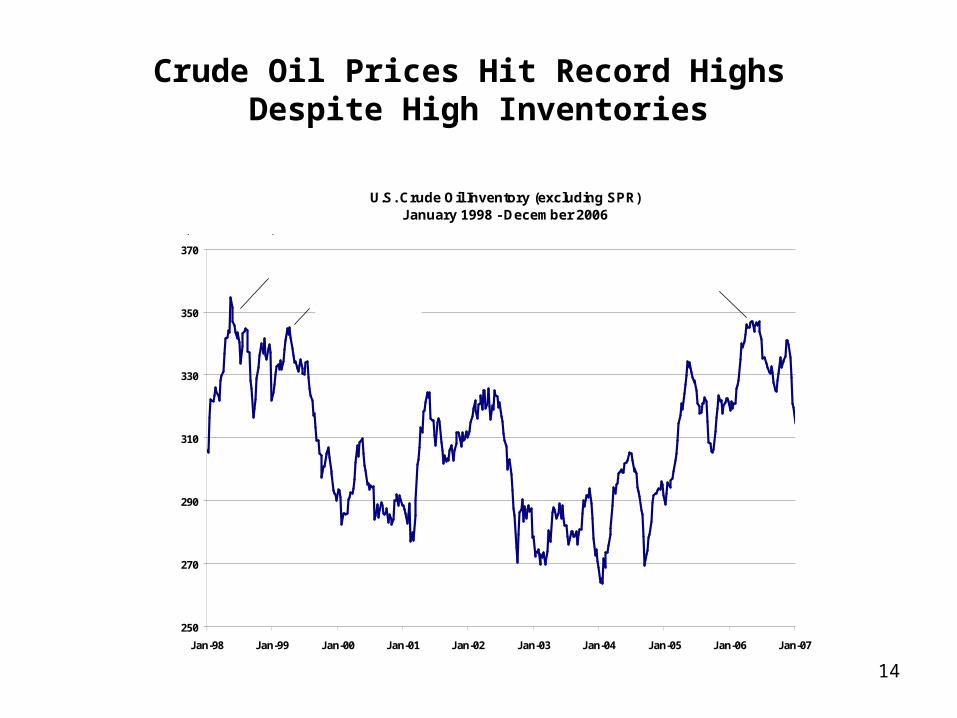
Crude Oil Prices Hit Record Highs Despite High Inventories
U.S. Crude Oil Inventory (excluding SPR)January 1998 - December 2006
250
270
290
310
330
350
370
Jan-98 Jan-99 Jan-00 Jan-01 Jan-02 Jan-03 Jan-04 Jan-05 Jan-06 Jan-07
crude oil inventory(millions of barrels)
May 29, 1998347 million barrels$15
April 9 1999345 million barrels$16.45
May 12, 2006347 million barrels$72
15
Speculation: A Contributor to High Oil Prices
• “With the demand from the investment community, oil prices have moved up sooner than they would have otherwise.” –Former Federal Reserve Chairman Alan Greenspan (2006)
• “Senator, the facts are—and I’ve said this publicly for a long time—the oil prices have been moving steadily up for the last two years. And I think I have been very clear in saying that I don’t think that the fundamentals of supply and demand—at least as we have traditionally looked at it, have supported the price structure that’s there.” --Lee Raymond, Chairman and CEO, ExxonMobil (2005).
• “There has been no shortage and inventories of crude oil and products continue to rise. The increase in price has not been driven by supply and demand.” --Lord Browne, Chief Executive of BP (2006).
• “In summary, increased purchases of long-dated crude lift the forward price curve. The rise in prices is reflected back to contracts maturing in a few months. . . . [T]he impact of increasing stocks has been overwhelmed by the strong demand for forward crude, which has added as much as $24 per barrel to prices.” --Philip Verleger, Petroleum Economist
16
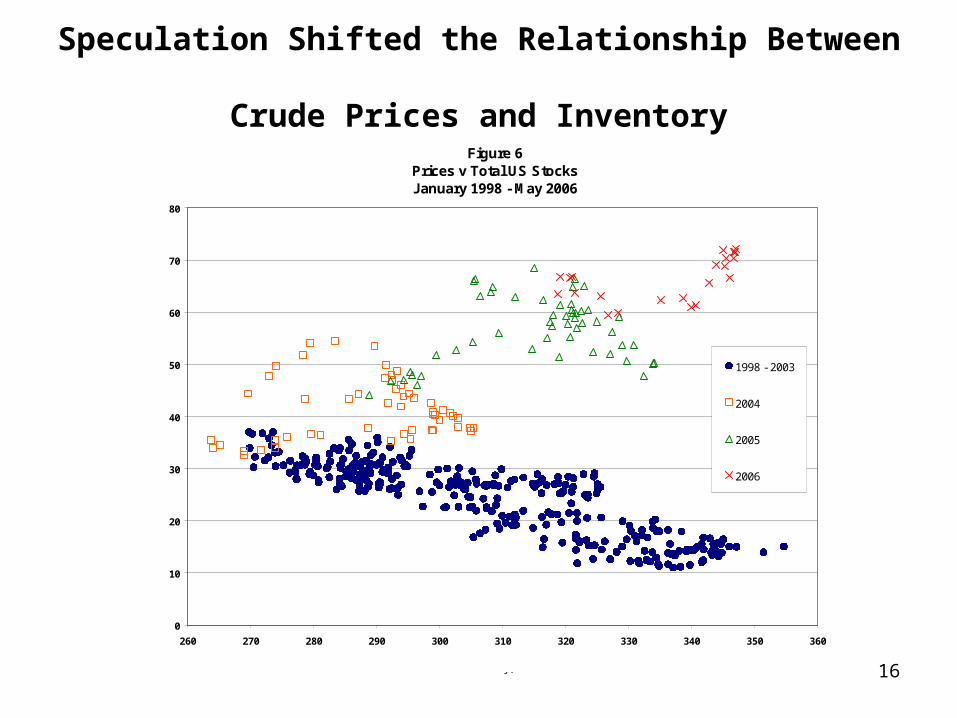
Speculation Shifted the Relationship Between Crude Prices and Inventory
Figure 6Prices v Total US StocksJanuary 1998 - May 2006
0
10
20
30
40
50
60
70
80
260 270 280 290 300 310 320 330 340 350 360
1998 - 2003
2004
2005
2006
Price of U.S. crude oil, $/barrel
Total U.S. Crude Oil Inventory, Millions of Barrels
17
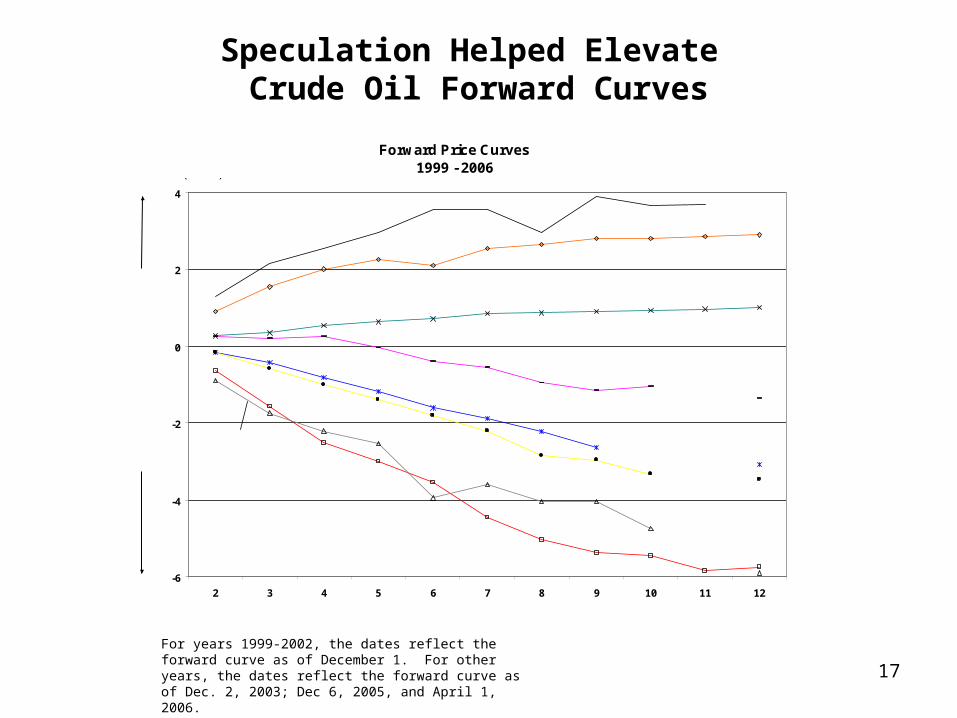
Speculation Helped Elevate Crude Oil Forward Curves
Forward Price Curves1999 - 2006
-6
-4
-2
0
2
4
2 3 4 5 6 7 8 9 10 11 12
1999
2000
2002
2003
2004
2000
2004
2001
2006
2006
2005
Co
nta
ng
oB
ackw
ard
atio
n
Difference in Price from First Month Contract (dollars)
Number of Months in the Future
1999
2002
2001
2003
2005
For years 1999-2002, the dates reflect the forward curve as of December 1. For other years, the dates reflect the forward curve as of Dec. 2, 2003; Dec 6, 2005, and April 1, 2006.
18
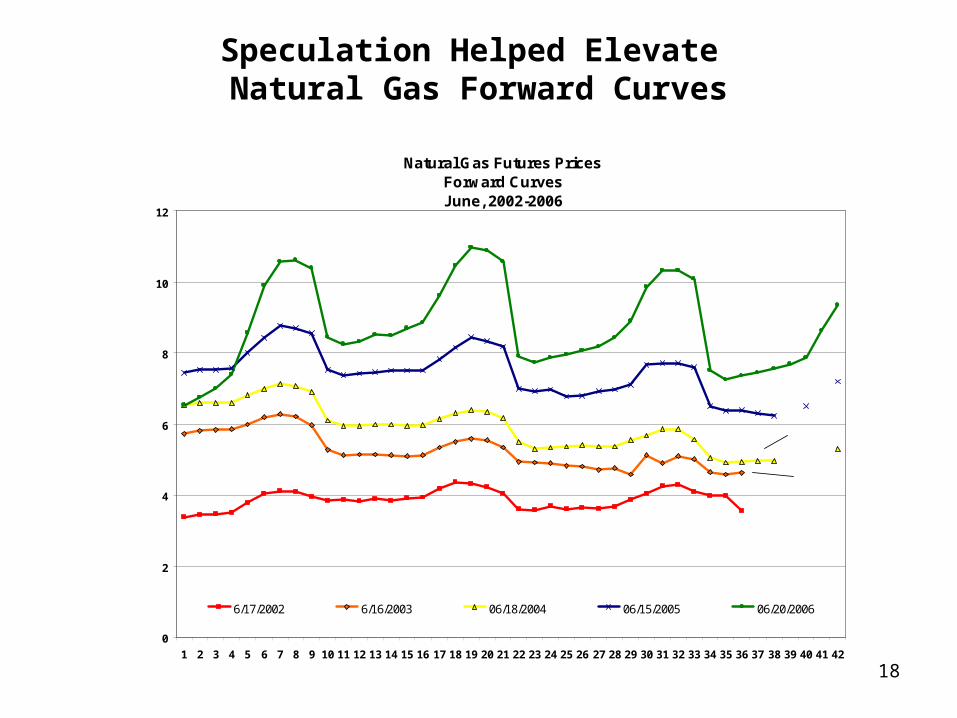
Speculation Helped Elevate Natural Gas Forward Curves
Natural Gas Futures PricesForward CurvesJune, 2002-2006
0
2
4
6
8
10
12
1 2 3 4 5 6 7 8 9 10 11 12 13 14 15 16 17 18 19 20 21 22 23 24 25 26 27 28 29 30 31 32 33 34 35 36 37 38 39 40 41 42
6/17/2002 6/16/2003 06/18/2004 06/15/2005 06/20/2006
dollars per MMBTU
months forward
2006
2005
2004
2003
2002
19
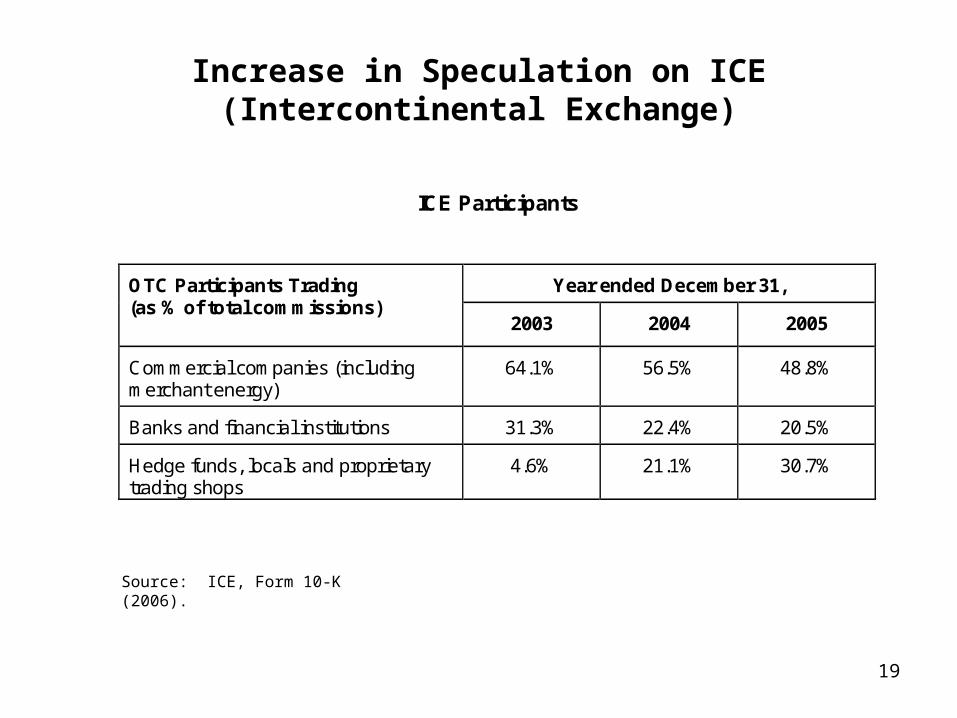
Increase in Speculation on ICE(Intercontinental Exchange)
ICE Participants
Year ended December 31, OTC Participants Trading (as % of total commissions)
2003 2004 2005
Commercial companies (including merchant energy)
64.1% 56.5% 48.8%
Banks and financial institutions 31.3% 22.4% 20.5%
Hedge funds, locals and proprietary trading shops
4.6% 21.1% 30.7%
Source: ICE, Form 10-K (2006).
20
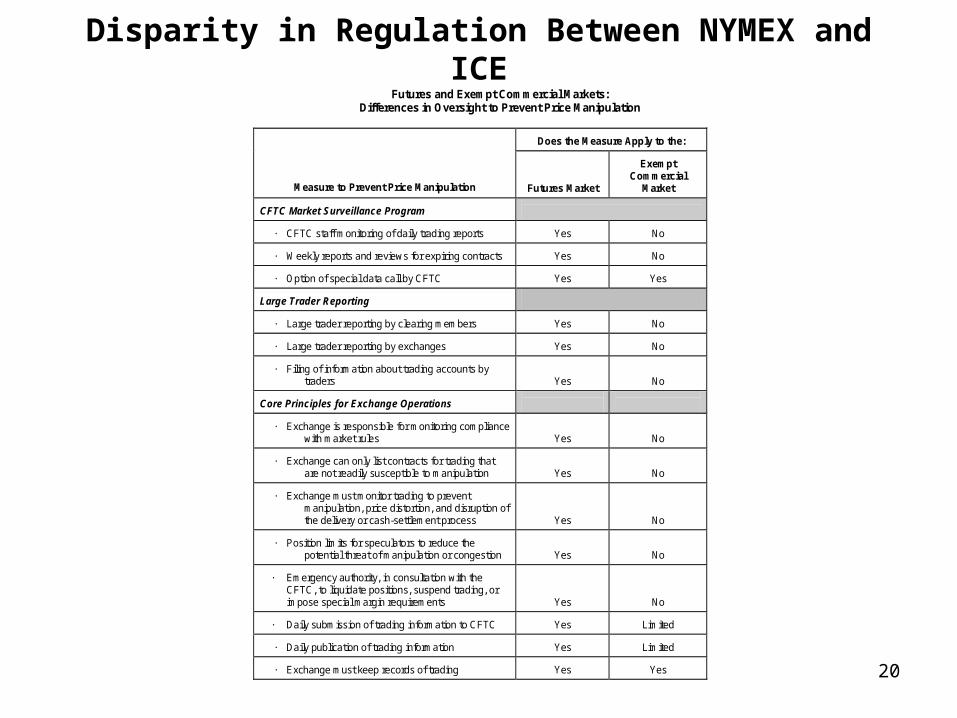
Disparity in Regulation Between NYMEX and ICEFutures and Exempt Commercial Markets:
Differences in Oversight to Prevent Price Manipulation
Does the Measure Apply to the:
Measure to Prevent Price Manipulation
Futures Market
Exempt
Commercial Market
CFTC Market Surveillance Program
· CFTC staff monitoring of daily trading reports
Yes
No
· Weekly reports and reviews for expiring contracts
Yes
No
· Option of special data call by CFTC
Yes
Yes
Large Trader Reporting
· Large trader reporting by clearing members
Yes
No
· Large trader reporting by exchanges
Yes
No
· Filing of information about trading accounts by
traders
Yes
No Core Principles for Exchange Operations
· Exchange is responsible for monitoring compliance
with market rules
Yes
No · Exchange can only list contracts for trading that
are not readily susceptible to manipulation
Yes
No · Exchange must monitor trading to prevent
manipulation, price distortion, and disruption of the delivery or cash-settlement process
Yes
No
· Position limits for speculators to reduce the
potential threat of manipulation or congestion
Yes
No · Emergency authority, in consultation with the
CFTC, to liquidate positions, suspend trading, or impose special margin requirements
Yes
No
· Daily submission of trading information to CFTC
Yes
Limited
· Daily publication of trading information
Yes
Limited
· Exchange must keep records of trading
Yes
Yes
21
PSI Report Recommendations
• Require Large Trader Reports for futures “look-alike” trades (e.g., ICE Henry Hub natural gas swaps) on electronic exchanges.
• Require Large-Trader Reports for U.S. energy commodities traded from a domestic terminal on a foreign board of trade (e.g., WTI on ICE Futures).
• CFTC should issue regulations to increase dissemination of daily trading from the ICE electronic exchange. – CEA §2(h)(4)(D) requires CFTC to issue regulations to provide for public
dissemination of trading data (e.g., volume, open interest, price data) for electronic trading facilities that perform a price discovery function in the cash market for the commodity.
• Close “Enron loophole”.
22
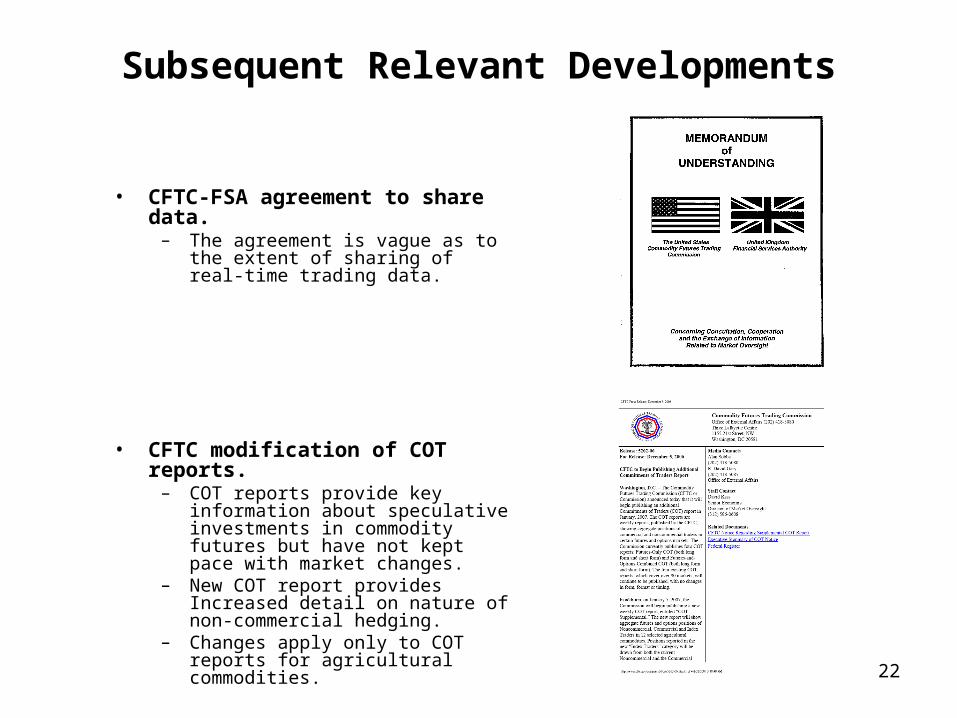
Subsequent Relevant Developments
• CFTC-FSA agreement to share data.– The agreement is vague as to the
extent of sharing of real-time trading data.
• CFTC modification of COT reports.– COT reports provide key information
about speculative investments in commodity futures but have not kept pace with market changes.
– New COT report provides Increased detail on nature of non-commercial hedging.
– Changes apply only to COT reports for agricultural commodities.
23
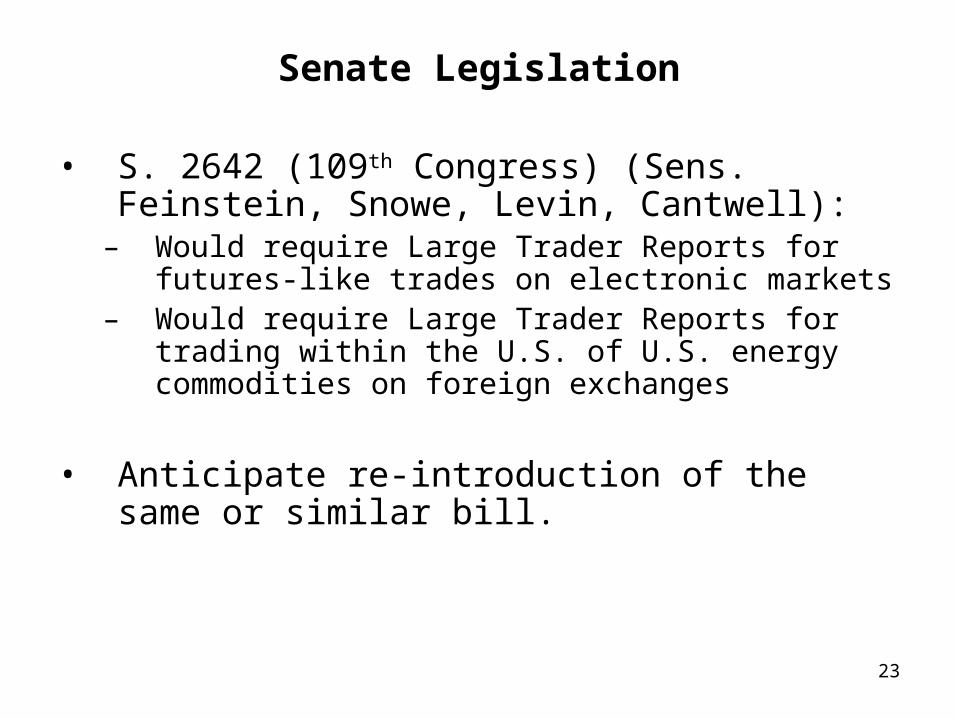
Senate Legislation
• S. 2642 (109th Congress) (Sens. Feinstein, Snowe, Levin, Cantwell):
– Would require Large Trader Reports for futures-like trades on electronic markets
– Would require Large Trader Reports for trading within the U.S. of U.S. energy commodities on foreign exchanges
• Anticipate re-introduction of the same or similar bill.
24
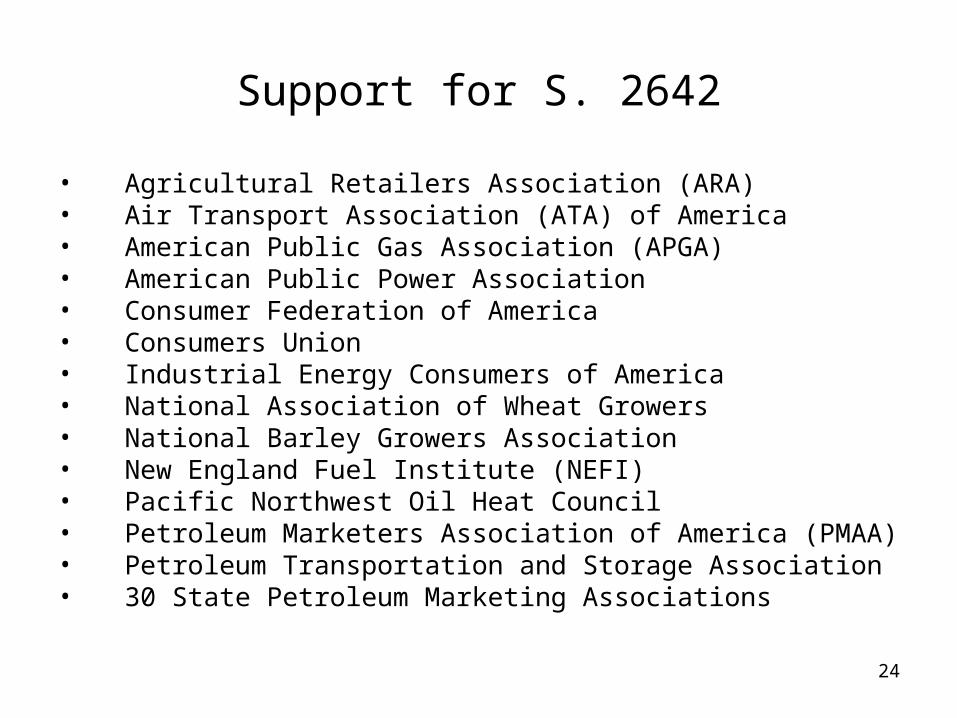
Support for S. 2642
• Agricultural Retailers Association (ARA)• Air Transport Association (ATA) of America• American Public Gas Association (APGA)• American Public Power Association• Consumer Federation of America• Consumers Union• Industrial Energy Consumers of America• National Association of Wheat Growers• National Barley Growers Association• New England Fuel Institute (NEFI)• Pacific Northwest Oil Heat Council• Petroleum Marketers Association of America (PMAA)• Petroleum Transportation and Storage Association• 30 State Petroleum Marketing Associations
25
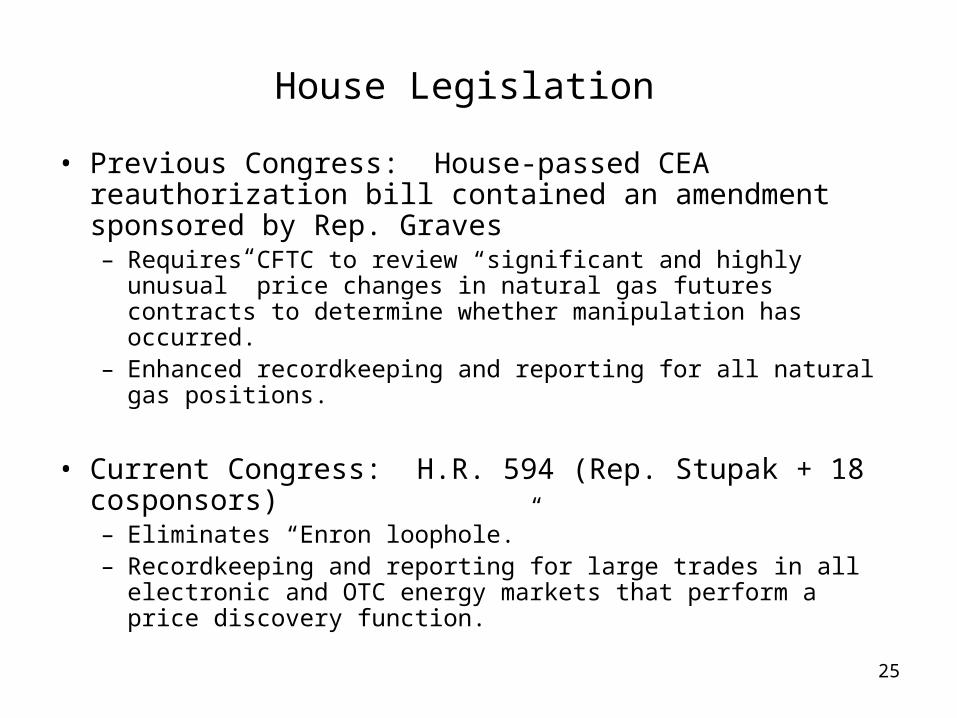
House Legislation
• Previous Congress: House-passed CEA reauthorization bill contained an amendment sponsored by Rep. Graves– Requires CFTC to review “significant and highly unusual” price
changes in natural gas futures contracts to determine whether manipulation has occurred.
– Enhanced recordkeeping and reporting for all natural gas positions.
• Current Congress: H.R. 594 (Rep. Stupak + 18 cosponsors)– Eliminates “Enron loophole.”– Recordkeeping and reporting for large trades in all electronic
and OTC energy markets that perform a price discovery function.
26
References
• PSI Report on Speculation http://hsgac.senate.gov/index.cfm?Fuseaction=Subcommittees.Home&SubcommitteeID=11&Initials=PSI(scroll down the page)
• Data sources: NYMEX, CFTC, ICE, EIA.