Embed Size (px)
Citation preview

Mark HauseGEMI Benchmark Chair
GEMI Survey
EHS Metrics and Processes
April 2007

EHS Metrics & Processes 2
Outline• Survey Recap• EHS Leading Indicator Metrics• Metrics Process and Practice• Future Benchmarking

EHS Metrics & Processes 3
Survey Overview• Survey addresses the management of environment,
health or safety (EHS) leading indicator metrics and metrics processes.
• Survey response rate ~50% – 21 companies responded to the survey– Not all companies completed all questions
• Broad industry coverage
• Although several questions were asked about normalization and external use, very few companies did either of these with most metrics.
• Also review data from a 2003 GEMI metrics survey.
• Thank you to all participants!

EHS Metrics & Processes 4
Industry Segment
Chemical Consumer Products
Diversified Industrial Goods
and Services
Food/Agri Industry
Health Care & Health Care
Products Oil and Gas Production
Pharmaceutical
Semiconductor Diverse
Building Products

EHS Metrics & Processes 5
Revenue
<$10 Billion
$10-20 Billion
$21-$50 Billion
$51-$100 Billion

EHS Metrics & Processes 6
Types of Metrics
0
2
4
6
8
10
12
14
16
18
20
Environmental Sustainability Health Safety
Overall Metrics Leading Indicator Metrics
0
2
4
6
8
10
12
14
16
18
20
Environmental Sustainability Heath SafetyMost companies have EHS metrics, but only half have sustainability metrics.
Leading indicator metrics are comparable, but slightly lower overall.

EHS Metrics & Processes 7
EHS Audit Leading Indicator Metrics
0 5 10 15 20
audits scheduled vs.complete
# overdue action itemsversus total
% overdue action itemsversus total open
% overdue versus total
% extended
Number of Regulatoryfindings
Average time to closure byseverity of finding
# Repeat findings
Other
None
# of Companies
All companies have leading indicator audit metrics.
Most focus on ensuring follow-up on findings.

EHS Metrics & Processes 8
Other EHS Audit Leading Indicator MetricsSeveral others were identified. • RC 14001 Management Certifications• Toller Audits• Supplier Audits• % completed on time• Regulatory inspections with no further actions required. • Audit findings open more than one year.• Overdue Status Reports • % Auditors trained • Performance Against 10 Audit Quality Criteria By a Third
Party• Overdue Initial Action Plans• Significant Findings• Document best practices

EHS Metrics & Processes 9
EHS Training Leading Indicator Metrics
0 5 10 15 20
% of facilitators trained vs.scheduled
Number of people trainedvs. scheduled
% people who passcompetency tests following
training
# of Training hourscompleted
% of Sites with a trainedSHE resource
Annual $ spent on training
None
# of Companies
Most companies have leading indicator training metrics.
Some respondents questioned whether training is a leading indicator.

EHS Metrics & Processes 10
Ergonomics Leading Indicator Metrics
“Other” is % new manufacturing equipment receiving an ergo review
0 5 10 15 20
Completion of findings frominvestigations
% of jobs assessed forergonomics
% of high risk jobs withaction plans for resolution
% of capital projects withergonomics reviews
None
Other
# of Companies
Fewer than half of the companies have leading indicator ergonomics metrics.

EHS Metrics & Processes 11
Safety Leading Indicator Metrics
0 5 10 15 20
Off the job injuries -restricted or lost workday
% of serious incidentswhere a Root Cause Failure
Analysis was completed
Sites reporting near-missincidents
# of safety positions openor days to close open
positions
Average years working inSHE for people assigned to
SHE roles
None
Other
# of Companies
Over half of the companies have leading indicatorsafety metrics.
Reporting near misses is the most prevalent.
Food and Pharma were least likely to have safety metrics.

EHS Metrics & Processes 12
“Other” Safety Leading Indicator Metrics
Several others were identified.• Unsafe Behaviors per Unsafe Condition• Resource capability vs. site hazard level• Global Safety and Health Plan Self
Assessment• Observations, etc. • Ratio of First Aids/ Recordables

EHS Metrics & Processes 13
PSM Leading Indicator Metrics
0 5 10 15 20
PHAs completed vs.scheduled
# of open/overdue inc. rec
# of open/overdue PHA recommendations
# of open/overdue E-drill recommendations
Mechanical integrity complete vs. scheduled
# of Tests & Inspections temporarily delayed
Open/overdue MOC Tech Recommendations
Operating procedure reviews overdue
PSSR recommendations open and overdue
MOC personnel demonstrations overdue
None
Other
# of Companies
Most of the companies have leading indicator PSM metrics.
These varied widely.
Food and Pharma were least likely to have safety metrics.

EHS Metrics & Processes 14
Distribution Safety Leading Metrics
# of Companies0 5 10 15 20
% completion ofTransportation risk
assessments
% of Logistics ProvidersAudited by Region on
schedule
Distribution incidentinvestigation cycle time
None
Other
Most of the companies do not have leading indicator distribution safety metrics.
Companies that transport chemicals were the only ones that did.

EHS Metrics & Processes 15
Occupational Health Leading Metrics
0 5 10 15 20
# of exposure assessmentscompleted vs. jobs
Air samples over limits
Medical surveillancescompleted vs. scheduled
Respirator fit testscomplete vs. scheduled
None
Other
# of Companies
About half of the companies have leading indicator occupational health metrics.
Food and Pharma were least likely, although some “chemical”companies did not.

EHS Metrics & Processes 16
Fire Safety Leading Indicator Metrics
“Other” is “response to insurance audits” and “Evacuation Drills”.
0 5 10 15 20
Time to issue incidentinvestigation report
% of sites with completedfire safety evaluations
Emergency Response teamassessments completed
None
Other
# of Companies
About half of the companies have leading indicator fire safety metrics.
Pharma was least likely, although some “chemical”companies did not.

EHS Metrics & Processes 17
Product Stewardship Leading Metrics
# of Companies
Most companies have Product Stewardship leading indicator metrics.
Energy-related metrics were the most prevalent.
0 5 10 15 20
% Product Stewardshipreview completed per
schedule
% completion of productstewardship action items
Time to respond tocustomer inquiries
Unit of waste per unit ofproduct 'e factor'
Energy input per unit ofproduct
None
Other

EHS Metrics & Processes 18
“Other” Product Stewardship Metrics
• Information entered in database• Environmental risk assessment• Energy consumption in use• Material content• Carbon footprint • Reuse / recylability• Packaging reductions

EHS Metrics & Processes 19
Sustainability Leading Metrics - Footprint
0 5 10 15 20
Total Water usage
Water usage in water-scarce areas
% Water reused or recycled
Total COD or BOD from wastewater
Energy usage
% energy from renewable sources
Greenhouse gas emissions
Air carcinogen emissions
Hazardous waste disposal
Substitution of more sustainable chemicals
Fleet fuel efficiency
Cost reduction from energy programs
Land area saved from raw material reductions
None
Other
# of Companies
All of the companies have leading indicator sustainability metrics.
GHG, energy, water and waste were the most prevalent.
Most of these were normalized.

EHS Metrics & Processes 20
Sustainability – Footprint (External)
# of Companies0 5 10 15 20
Total Water usage
Water usage in water-scarce areas
% Water reused or recycled
COD or BOD from wastewater
Energy usage
% energy from renewable sources
Greenhouse gas emissions
Air carcinogen emissions
Hazardous waste disposal
Substitution of more sustainable chemicals
Fleet fuel efficiency
Cost reduction from energy programs
Land area saved from raw material reductions
None
Other Almost all of the companies communicate leading indicator sustainability metrics externally.
GHG, energy, water, and waste were the most prevalent.

EHS Metrics & Processes 21
Other Sustainability Leading MetricsSeveral others were identified.• Total solid waste• VOC emissions,• Pollution prevention projects (#, savings,
pollution prevented)• Recycling rates, • Employee ride share• Philanthropy - contributions to external
environmental education, • CSR activities• Access to Medicine• Many others

EHS Metrics & Processes 22
Sustainable Growth Leading Metrics
0 5 10 15 20
Sales of products thatreduce the use of energy,
water, etc.
Sales of products thatprotect or increase health
Sales of products based onrenewable resources
R&D $ spent on productsthat improve sustainability
None
Other
# of Companies
Only three companies have established sustainable growth metrics.

EHS Metrics & Processes 23
Sustainability Goals
YesNo
Common Goals #• Reduce Energy Consumption 6• Reduce GHG emissions 5• Reduce Water Use. 4• Reduce Hazardous Waste 3• Reduce Accident Rate 2• Reduce CO2 2• Water Recycle 2
60% of companies have established sustainability goals.
These were the most prevalent.

EHS Metrics & Processes 24
Why Do Companies Develop Leading Metrics?
0 5 10 15 20
Influence stakeholders
Organizationalperformance
Long term predictor
Competitive position
Compensation andreward
Other
# of Companies
Most use leading metrics to measure organizational performance.

EHS Metrics & Processes 25
New Metrics - Practical Considerations
Compare new metrics with existing or developing standards 53% 47% 0%
Define internal measurement techniques and performance goals 53% 47% 0%
0%
12%
12%
0%
12%
29%
29%
24%
Identify external benchmarks 41% 59%
Define reporting levels and responsibilities 35% 53%
Conduct pilot testing to confirm / validate data measurement 35% 53%
Involve key business unit, operational and line managers 24% 76%
Conduct a cost / benefit analysis for rationalizing new metric 24% 65%
Account for off-shore facility considerations / applicability 24% 41%
Perform a formalized stakeholder needs evaluation 18% 53%
Personnel evaluations/compensation 12% 65%
1
4
6
5
7
3
8
2
9
10
Very Important
Considered
Not ImportantWhat steps do companies perform when developing new EHS metrics?
2003
1
2
3
4
5
6
7
8
9
10
2007
“Off-shore” impact implications was the biggest change since 2003.

EHS Metrics & Processes 26
New Metrics – “Value-Added” Factors
Can be clearly stated / is easily understood by management 75% 25% 0%
Can be used to demonstrate progress towards goals and objectives 69% 31% 0%
Can be used to motivate a desired behavior or change 69% 31% 0%
Easy to measure/data collection at a reasonable cost or automated 63% 38% 0%
Has strong linkage to strategy and objectives 56% 44% 0%
Shows strengths and weaknesses of business or EHS processes 44% 56% 0%
Can be aggregated by site, business, region . . . 44% 56% 0%
Reflects risk associated with operational / EHS activities 38% 63% 0%
Shows tie between EHS, operational, and management performance 38% 63% 0%
Potential for improving company's financial return 31% 69% 0%
Very Important
Considered
Not Important
Top 10 “value-added” factors companies consider when assessing a GLOBAL EHS metric
1
2
3
4567
89
10
2003
2007
4
1
2
375829
10
With the exception of “risk”, findings were similar to 2003.

EHS Metrics & Processes 27
Leading Indicator – “Value-Added” Factors
Can be used to demonstrate progress towards goals and objectives 75% 25% 0%
Can be used to motivate a desired behavior or change 75% 25% 0%
Can be clearly stated / is easily understood by management 75% 25% 0%
Easy to measure / data collection at a reasonable cost / automated 58% 42% 0%
Has strong linkage to strategy and objectives 50% 50% 0%
Reflects risk associated with operational / EHS activities 42% 58% 0%
Shows tie between EHS, operational, and management performance 42% 58% 0%
Shows strengths and weaknesses of business or EHS processes 42% 50% 8%
Can be aggregated by site, business, region . . . 33% 67% 0%
Potential for improving company's financial return 25% 75% 0%
Very Important
Considered
Not ImportantTop 10 “value-added” factors companies consider when assessing a LEADING EHS metric
1
2
3
4567
89
10
Global
Leading
2
3
1
458967
10
No major differences between “leading” and “Global”.

EHS Metrics & Processes 28
Data Sources
• Regulatory reports • Audit results / findings• Computerized MIS• Monitoring / measuring
equipment• Management systems
reviews• Inventory and production
records• External reports and
studies• Interviews / discussions• Quality management
systems• Financial and accounting
systems
Common
Uncommon
• Inventory and production records
• Regulatory reports • Audit results / findings• Management systems
reviews• Computerized MIS• Monitoring / measuring
equipment• Financial and
accounting systems
• Interviews / discussions• External reports and studies• Quality management
systems
2007 Data 2003 Data
Findings are comparable to 2003.

EHS Metrics & Processes 29
Data Capture & Validation
Manual ProcessSome AutomationElectronic and ManualMostly ElectronicIntegrated MIS
Capture
Via audit programs
Formal internal data checking processes
Searches of reg. agency or 3rd-party databases
Via an independent, 3rd-party consultantNo validation practices implemented
Validation
0%
12%
53%
18%
18%
0
10%
40%
40%
10%
2003
53
65%
6%
47%
12%
71%
71%
38%
10%
5%
2007
Less reliance on databases and audits; more use of consultants.
Some growth in automation of metrics gathering processes

EHS Metrics & Processes 30
Overview of Metrics Processes• Most companies
do not have a problem with management support of the EHS metrics program
0
1
2
3
4
5
6
7
8
9
10
Very Strong Strong Adequate Needs Improvement Poor
Top Management Line Management
Management Support
0
2
4
6
8
10
Very Strong Strong Adequate Needs Improvement Poor
Num
ber o
f com
pani
es Top MgmtBU and Line Mgmt
2007
Dat
a20
03 D
ata • Support seems
to be lower than in the previous survey.

EHS Metrics & Processes 31
Conclusions• All companies use leading indicator metrics in some
area of EHS. Sustainability and auditing are highest.• The use of lagging indicators outweighs the use of
leading indicators.• There are many different leading metrics in use with
the broadest range in the area of sustainability. • Differences exist between metrics that are used
internally and those that are communicated externally. Sustainability was an exception.
• EHS metrics are linked to the business.• Findings are comparable to a similar 2003 survey on
metrics processes and management support.• Companies continue to search for better metrics.• Questions /comments?

EHS Metrics & Processes 32
Future BenchmarkingOrganization structure changes and support for HSE is the next topic for benchmarking.
Q19. What other topics should GEMI benchmark in 2007? (Check all that apply.) (n=24)
17%
21%
21%
38%
42%
46%
54%
0% 10% 20% 30% 40% 50% 60%
Sustainability trends in the retail industry
Environmental/safety incentives
IT management systems for HSE
Auditing
Risk management
Organizational structurechanges and support for HSE
Leading indicators for HSE

EHS Metrics & Processes 33
Background Slides

EHS Metrics & Processes 34
Audit Normalization and External UseNormalization• Limited use of normalization beyond the use of %.• Focus is on % completed.
External Use• Four companies communicate # of regulatory
findings externally.• One publishes their 3rd party audit report• One publishes # of audits completed vs. scheduled.• Other metrics published include:
– Total Findings– Open Findings

EHS Metrics & Processes 35
EHS Training Normalization/External UseNormalization• One company collects training hours per
employee
External Use• Two companies publish # of training hours
provided• One company publishes # of people trained• One shares data with SRI
EHS Metrics & Processes 36
Ergonomics Normalization/External Use
• Normalization is focused on % of capital projects assessed, % high risk jobs action plans developed and % jobs assessed.
• External use is limited to one company that publishes jobs and capital projects assessed.

EHS Metrics & Processes 37
Safety Normalization/External Use
• Normalization is generally on incidents per exposure hours
• Limited external use of metrics – one company

EHS Metrics & Processes 38
Other PSM Metrics
• Mechanical Integrity Test results Corrective Action Completion
• Process Hazard Management Plan progress - % complete
• Normalization is limited• Only one company publishes data
externally.

EHS Metrics & Processes 39
Distribution Safety Leading Metrics
• Normalization is limited to %• No external usage

EHS Metrics & Processes 40
Occupational Health Metrics
• Normalization and External Usage are minimal.

EHS Metrics & Processes 41
Normalization of Sustainability Metrics
Total Water usage
Water usage in water-scarce areas
% Water reused or recycled
Total COD or BOD from wastewater emissions
Energy usage
% of total energy from renewable energy sources
Greenhouse gas emissions
Air carcinogen emissions
Hazardous waste disposal
Substitution of more sustainable chemicals
Fleet fuel efficiency
Cost reduction from energy savings programs
Land area saved from raw material reductions None
Other (Please specify)
Revenue Revenue
per $1000 of sales
per $1000 of sales
per $1000 of sales
Solid waste per $1000 of sales
Water Index Calculation
Total Sales $
None
per dollar of sales
per employee sales
average per vehicle type.
Sales Sales Sales Sales
revenue production
net sales net sales
net sales for VOC emissions
/sales, etc. /sales, etc. /sales, etc. /sales, etc. /sales, etc. /sales, etc. /sales, etc. /sales, etc. /sales, etc. /sales, etc. /sales, etc.
sales, mileage, hours worked, etc.
for corporation on annual basis
for corporation on annual basis as noted
for corporation on annual basis
for corporation on annual basis
for corporation on annual basis
for corporation on annual basis
unit of production
unit of production
unit of production
unit of production
unit of production
unit of production
to $ sales to $ sales to $ sales to $sales
tons producttons product tons product

EHS Metrics & Processes 42
Product Stewardship - External
0 5 10 15 20
% Product Stewardshipreview completed per
schedule
% completion of productstewardship action items
Time to respond tocustomer inquiries
Unit of waste per unit ofproduct 'e factor'
Energy input per unit ofproduct
None
Other
# of Companies
EHS Metrics & Processes 43
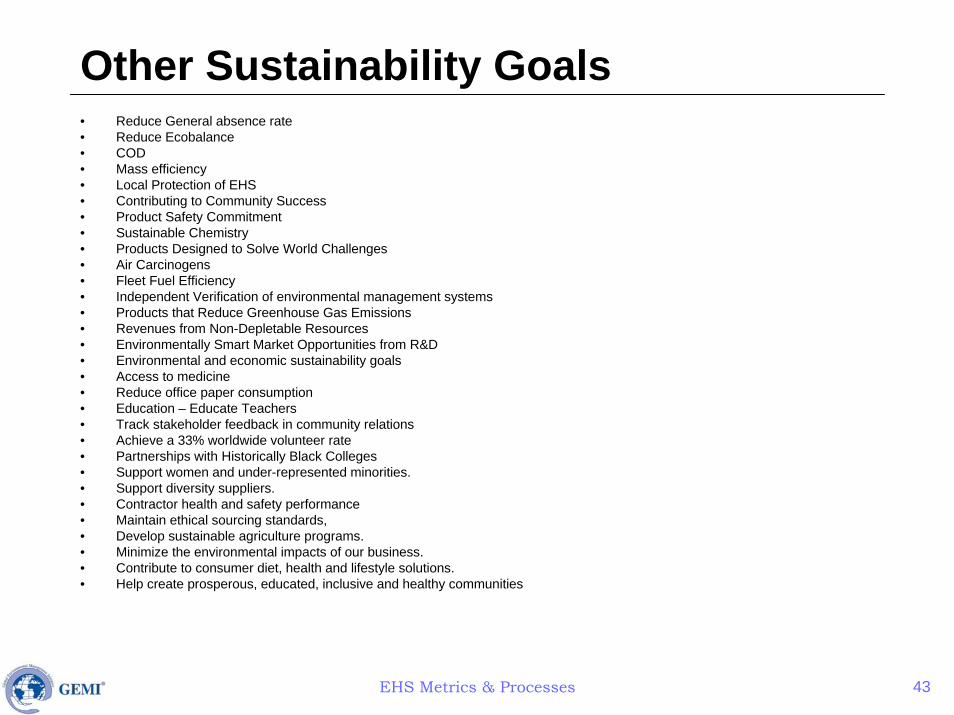
Other Sustainability Goals• Reduce General absence rate • Reduce Ecobalance• COD• Mass efficiency• Local Protection of EHS• Contributing to Community Success• Product Safety Commitment• Sustainable Chemistry• Products Designed to Solve World Challenges• Air Carcinogens • Fleet Fuel Efficiency • Independent Verification of environmental management systems • Products that Reduce Greenhouse Gas Emissions • Revenues from Non-Depletable Resources • Environmentally Smart Market Opportunities from R&D • Environmental and economic sustainability goals• Access to medicine• Reduce office paper consumption • Education – Educate Teachers• Track stakeholder feedback in community relations • Achieve a 33% worldwide volunteer rate• Partnerships with Historically Black Colleges • Support women and under-represented minorities. • Support diversity suppliers. • Contractor health and safety performance • Maintain ethical sourcing standards, • Develop sustainable agriculture programs. • Minimize the environmental impacts of our business. • Contribute to consumer diet, health and lifestyle solutions. • Help create prosperous, educated, inclusive and healthy communities