Embed Size (px)
Citation preview
1
Market Sentiment and Innovation Activities*
Tri Vi Dang
Columbia University
Zhaoxia Xu
New York University
September 2016
Abstract
We investigate potential mechanisms through which market-wide sentiment affects firms’
innovation activities. We provide evidence for the financing channel by showing that
financially constrained firms are more likely to issue equity and invest more in R&D than
financially unconstrained firms at high market sentiment. Using time-varying manager
sentiment measures, we find suggestive evidence for a sentiment spillover channel whereby
market sentiment affects R&D investments through influencing manager sentiment.
Furthermore, we document that better patent portfolios are produced from R&D investments
stimulated by high market sentiment. Market sentiment has a stronger impact on R&D than
capital expenditures of financially constrained firms.
Key words: Sentiment, Innovation, Financial Constraints
JEL No: G30, G12
* We thank Paul H. Malatesta (Editor) and especially an anonymous referee for very useful comments and
suggestions. We also thank Viral Acharya, Soku Byoun, Gary Gorton, Bernard Salanie, Robert Shiller, Harald
Uhlig, and participants at the Applied Economics Workshop at Columbia University and Tsinghua University
Finance Workshop for their insightful comments.
2
I. Introduction
Classical finance theory based on investor and manager rationality predicts no role for market
sentiment in corporate investments. Earlier studies provide support for this theory (Morck et
al. (1990) and Blanchard et al. (1993)). However, this view has been challenged by recent
studies that show investments are responsive to non-fundamental movements of stock prices
(e.g. Chirinko and Schaller (2001), Baker et al (2003), Gilchrist et al. (2005), Lamont and
Stein (2006), Polk and Sapienza (2009), Arif and Lee (2014), and McLean and Zhao (2014)).
An interesting question is whether market-wide sentiment has an impact on corporate
innovation activities.
A better understanding of the real effects of market sentiment on innovative activities
is important because innovation is essential to economic growth. Endogenous growth models
emphasize that the economic growth rate is driven by the rate of technological progress,
which takes place through innovation (Romer (1990), Aghion and Howitt (1992)).
Furthermore, the unique features of innovation and the evidence that economic factors affect
R&D investments and other investments differently warrant studying innovation activities
separately.
First, it is more costly to finance innovation due to high uncertainty of innovation
outcomes (Hall and Lerner (2010)). Second, investments in innovation produce intangible
assets that are harder to serve as collateral for borrowing, while capital expenditures generate
tangible assets. Third, innovation investments generate knowledge with the nature of public
goods. Such externality could lower firms’ incentives to invest up to a socially optimal level
of R&D investment (Hall and Lerner (2010)). Additionally, the cross-country analyses of
Brown et al. (2013) show that the development of stock markets and credit markets has
differential impacts on R&D and fixed asset investments due to the intangibility nature and
uncertainty of R&D investment outcome. Stock liquidity and short selling are also found to
3
affect capital expenditures and innovation differently (Becker-Blease and Paul (2006), Fang et
al. (2014), He and Tian (2014), and Grullon et al. (2015)).
In this paper we provide a theoretical model that links market sentiment to subjective
belief formation and analyze three (interrelated) mechanisms through which stock market
sentiment might affect innovation activities of firms. The first mechanism is the financing
channel. When market sentiment increases, investors become more optimistic about future
cash flows and the cost of capital decreases. Thus financially constrained firms can obtain
cheaper funding and invest in positive net present value (NPV) projects that otherwise cannot
be funded. The second mechanism is the NPV channel in which lower costs of capital can
turn negative NPV projects into positive NPV ones even in the absence of financial
constraints. The third potential transmission mechanism is the sentiment spillover channel.
Shiller (1984, p.459) “claim that mass psychology may well be the dominant cause of
movements in the price of the aggregate stock markets.” The crowd (or mass) psychology
literature shows that individual opinions and actions are influenced by group or mass opinions
and actions (Sherif (1935), Asch (1951, 1955), and Moscovici (1985)). Our model formalizes
how investor sentiment affects managers’ sentiments and thus their perceptions of returns on
R&D investments and willingness to conduct innovative projects. The three channels can
have a reinforcing effect on investments in innovation.
To empirically examine the real effects of time-varying market-wide sentiment on
innovations, we address five main questions. First, are R&D investments of individual firms
sensitive to market sentiment? Second, are financially constrained firms more likely to issue
equity and invest in R&D when market sentiment is high (the financing channel)? Third, are
investments in R&D responsive to both manager sentiment and market-wide sentiment (the
sentiment spillover channel)? Fourth, do firms generate more and higher quality patents from
these R&D investments? Fifth, does market-wide sentiment affect R&D and fixed asset
investments differently?
4
We conduct our analyses using a panel sample of 6,139 U.S. public firms over the
period of 1985 to 2010. Using the “orthogonalized” component of Robert Shiller’s Cyclical-
Adjusted Price Earnings Ratio (CAPE) and Baker and Wurgler (2006) sentiment index as
proxies for stock market sentiment, we document a positive correlation between firm-level
inputs (R&D) as well as outcomes (patents) of innovation and aggregate stock market
sentiment, while controlling for various observable and unobservable factors that are expected
to affect innovation and investment opportunities. At the aggregate level, aggregate R&D and
market sentiment are also positively related. We then investigate the economic mechanisms
underlying the sensitivity of R&D investments to market sentiment.
Our analyses show that financially constrained firms invest more in innovation when
stock markets are more optimistic, while a similar relation is not observed for financially
unconstrained firms. Furthermore, financially constrained firms have a higher propensity to
issue equity in optimistic markets. These results are consistent with the prediction of the
financing channel. To investigate the sentiment spillover channel, we construct two time-
varying measures of manager sentiment in order to capture the dynamics of a manager’s view
on future cash flows. Applying these two measures of manager sentiment and using the
cumulant estimators from Erickson et al. (2014), we find suggestive evidence for the
sentiment spillover channel that optimistic managers invest significantly more in innovation
than less optimistic managers do when investors are more optimistic. We find only weak
evidence for the NPV channel. In terms of innovation outcome, we document that R&D
investments at higher market sentiment produce more and better quality patents.
Lastly, we find that market-wide sentiment has differential effects on capital
expenditure (CAPEX) of firms with R&D spending (R&D firms) and firms without R&D
(non-R&D firms). For R&D firms, market sentiment has a significant impact on CAPEX of
financially constrained firms, but not that of financially unconstrained firms. For non-R&D
firms, market sentiment has a positive and significant impact on investments of both
5
financially constrained and unconstrained. The results indicate that the financing channel is
relatively more important for investments of R&D firms. The NPV channel might play a role
in investments by financially unconstrained firms without R&D spending. We also find
suggestive evidence for the sentiment spillover channel through which market sentiment
affects fixed asset investments of non-R&D firms, but find no such evidence for R&D firms.
Additionally, for financially constrained firms that invest both in R&D and fixed assets, R&D
investments are more sensitive to market sentiment than CAPEX.
Our paper is related to the literature on the effects of financial markets on corporate
investments (reviewed in Bond et al. (2012)). Morck et al. (1990) and Blanchard et al. (1993)
document that stock markets have little impact on investments after controlling for
fundamentals. Chen et al. (2007) and Bakke and Whited (2010) argue that corporate
investments are sensitive to the private information component of stock prices as it is useful
for firms’ decision making. Chirinko and Schaller (2001), Baker et al (2003), Gilchrist et al.
(2005), Lamont and Stein (2006), Polk and Sapienza (2009), and Edmans et al. (2012) find
that investments in capital expenditures and merger & acquisitions are affected by mispricing.
McLean and Zhao (2014) show that investment sensitivity to Tobin’s Q varies with business
cycle and investor sentiment. Arif and Lee (2014) document that aggregate investments vary
with investor sentiment and future aggregate returns. Our study focuses on the influence of
market-wide sentiment on firms’ R&D investments and patent production and explores
potential transmission channels.
This paper makes several contributions to the literature. We provide a model to
formalize how market sentiment affects subjective belief formation and analyze different
transmission mechanisms of how market-wide sentiment affects R&D investments. Our
empirical analyses offer several new findings to the literature. First, we show that R&D
investments of financially constrained and unconstrained firms are affected differently by
market sentiment. As suggested by the financing channel, financially constrained firms invest
6
more in R&D and are more likely to issue equity when market sentiment is high. Second, we
provide novel and suggestive evidence for a sentiment spillover channel by which market-
wide sentiment affects investments in innovation through its spillover effect on manager
sentiment. Third, we provide a new finding that R&D investments stimulated by high market
sentiment generate patents of higher quality and quantity. Fourth, we show that market
sentiment has differential effects on R&D investments and capital expenditures of financially
constrained firms.1
Our study also contributes to the debate on the welfare effects of stock market
optimism. On the one hand, stock market bubbles are regarded as undesirable because they
can lead to overinvestment of firms and misallocation of resources (Gilchrist et al. (2005)).
On the other hand, Olivier (2000), Caballero et al. (2006) and Jermann and Quadrini (2007)
propose models that illustrate a growth-enhancing effect of market optimism in which asset
bubbles can encourage entrepreneurship, firm creation, and investments.2 Our paper provides
1 Recent literature shows that R&D investments and capital expenditures are of different nature and are affected
differently by various economic factors such as financial market development, stock liquidity, and short selling
(Brown et al. (2013), Becker-Blease and Paul (2006), Fang et al. (2014), He and Tian (2014), and Grullon et al.
(2015)). We highlight another economic force, namely market sentiment.
2 Venture capitalists tend to have a view that stock market optimism fosters innovation, which is similar to
Keynes (1931)’s interpretation of the investment and stock market boom preceding the Great Depression. For
example, the 11/19/2010 New York Times article, “As Technology Deals Boom, the Talk Turns to Bubbles” by
Heidi N. Moore summarizes a conversation between two venture capitalists about the social media and mobile
boom.
“Mr. Doerr: I prefer to think of these bubbles as booms. I think booms are good. Booms lead to
overinvestment, booms lead to full employment, booms lead to lots of innovation.
Mr. Wilson: My friend says that nothing great is ever created without irrational exuberance. That’s
totally accurate. This frothy time will finance a lot of great ideas that will become great companies.”
Keynes (1931) describes the investment booms accompanying the stock market boom preceding the Great
Depression as: “While some part of the investment which was going on …. was doubtless ill-judged and
unfruitful, there can, I think, be no doubt that the world was enormously enriched by the constructions of the
quienquennium from 1925 to 1929, its wealth expanded in those five years by as much as in any other ten or
twenty years in its history…. A few more quinquennia of equal activity might, indeed, have brought us near to
the economic Eldorado where all our reasonable economic needs would be satisfied.”
7
empirical evidence for the growth-enhancing view by showing that market optimism
facilitates innovation of financially constrained firms.
The remainder of the paper is organized as follows. In the next section we develop a
simple theoretical framework and the testing hypotheses. Section III describes the data, the
measures of market sentiment and manager sentiment, and the descriptive statistics of the
sample. Section IV provides evidence for the relation between market sentiment and R&D
investments. Section V provides evidence for the financing and the sentiment spillover
channels through which market sentiment affects R&D investments. Section VI investigates
patent production. Section VII investigates the effects of market sentiment on fixed asset
investments and compares it to R&D investments. Section VIII performs robustness checks.
Section IX concludes.
II. The Model and Hypothesis Development
A. The Setting
We provide a theoretical model that links market sentiment to subjective belief
formation and analyze three (interrelated) mechanisms through which stock market sentiment
might affect R&D investments. We consider a setting with two agents, a risk averse
entrepreneur (also referred as he) with utility function U where U(0)=0, U’>0 and U’’<0 and
a risk neutral investor (also referred as she) with utility function V where V’>0 and V’’=0.
The entrepreneur has wealth 0w and limited liability. He can invest in an indivisible
project that requires an investment wZ . The entrepreneur needs to raise the amount K=Z-w
of equity capital to finance the project.3 The investor has wealth K. If equity is issued, the
3 We focus on equity finance since the empirical evidence shows that equity is preferable to debt for innovation
financing (Hall and Lerner (2010)). Brown et al. (2013) provide empirical evidence that credit market
development has no impact on R&D.
8
investor obtains a fraction ]1,0[ of the payoff and the entrepreneur keeps the remaining
fraction )1( . The risk free rate is normalized to zero.
The project delivers a verifiable payoff X which is either 0 (failure) or 0x
(success). The probability of success depends on how the entrepreneur implements the
project. If the entrepreneur implements it efficiently, then the probability of success is q. If
the entrepreneur implements it inefficiently, then the probability of success is p (p<q), but he
enjoys a private benefit B>0.4 We formalize market sentiment and subjective belief formation
about the payoff x of the project as follows. Initially, the entrepreneur believes that Exx
and the investor believes that Ixx . When market (or investor) sentiment goes up, the
investor becomes more optimistic such that Ix changes to H
Ix where I
H
I xx .5
We assume that the investor cannot break even (under initial or high market sentiment)
if the project is implemented inefficiently, i.e. even if 1 , KpxXE H
I
I
p )( . It implies
that the investor will not provide funding if she anticipates that the entrepreneur would invest
inefficiently. If the entrepreneur implements the project efficiently and the investor gets a
fraction of the payoff, the investor’s expected utility is
II
I
q qxqxqXEXEV 0)1()()( . For the investor to be willing to provide
funding, she must break even, i.e. KqxI or Iqx
K . We let denote the investor’s
breakeven fraction of the payoff.
4 The objectives of the entrepreneur and the investor are not necessarily the same. The investor is mainly
interested in return on investment, while the entrepreneur might also care about types of the innovation and
technological spillovers. Note that the moral hazard in the model can be given alternative interpretations. For
example, the entrepreneur can choose high or low level of effort and B represents the entrepreneur’s utility from
shirking as in Holmstrom and Tirole (1997) and Tirole (2006).
5 Because of the high uncertainty of innovation outcomes, the entrepreneur and the investor could have different
opinions and expectations. Our model allows for different prior beliefs. We assume that the investor observes xE.
We discuss how market sentiment affects the posterior belief of the entrepreneur in section D.
9
The entrepreneur has an incentive to issue equity and conduct the project if
)()1()1(0)1())1(( wUxqUxqUUqXEU EE . In other words, the risk
averse entrepreneur evaluates the expected payoff that he obtains from the project and the
investment cost that he pays according to his utility function. We say the project is perceived
to have a positive NPV by the entrepreneur if his expected utility from investing in the project
is higher than the utility from consuming his initial wealth, given the investor’s breakeven
fraction of the payoff.
For the entrepreneur to have an incentive to implement the project efficiently, only a
fraction of the payoff can be pledged to the investor ( 1 ). Since the entrepreneur enjoys a
private benefit when the project is implemented inefficiently, the incentive compatibility
constraint for the entrepreneur is
BxpUxqU EE ))1(())1((
pq
BExU
))1(( (IC)
We define the entrepreneur’s incentive compatible fraction of the payoff as IC such
that pq
BE
IC xU
))1(( . The maximum fraction of the payoff that can be pledged to the
investor without jeopardizing the entrepreneur’s incentive is IC ( IC <1). If the investor’s
breakeven fraction of the payoff is smaller than the entrepreneur’s incentive compatible
fraction of the payoff ( IC ), the project will be funded and the entrepreneur will
implement the project efficiently.
Thus, the conditions for the investor to provide capital K and for the entrepreneur to
invest in a positive NPV project efficiently are IC and )())1(( wUxqU E . We
analyze three channels through which market sentiment affects R&D investments by
influencing the investor’s breakeven , the entrepreneur’s incentive compatible IC , and the
perceived NPV of the project.
10
B. The Financing Channel
Suppose the project is perceived to have a positive NPV by the entrepreneur, i.e.
)())1(( wUxqU E where Iqx
K under the initial beliefs. When IC , the incentive
compatibility constraint implies that the entrepreneur will implement the project inefficiently
if he obtains the funding. The investor will not provide the capital K ex ante, since she cannot
break even when the project is implemented inefficiently. Therefore, the entrepreneur cannot
raise the capital needed and is financially constrained.
If market sentiment increases, the investor is more optimistic about x and believes that
H
Ixx . The breakeven condition of the investor is HIqx
KH . Since
I
H
I xx , this implies
that H . If sentiment is sufficiently high such that H
falls below IC , then financial
constraint is relaxed and the entrepreneur is able to raise equity to conduct the positive NPV
project. This leads to the first hypothesis.
H1: Optimistic stock markets enable financially constrained firms to raise equity at a
lower cost and thus enhance innovation (the financing channel).
C. The NPV Channel
Market sentiment could also affect R&D investments through shifting the perceptions
of a project’s NPV from negative to positive. Suppose the project is perceived to have a
negative NPV by the entrepreneur, i.e. )())1(( wUxqU E . When market sentiment goes
up, the investor requires a smaller faction of the payoff ( H ) as discussed above. If
H is sufficiently low such that )())1(( wUxqU E
H , the project becomes a positive NPV
project.6 This leads to the second hypothesis.
6 Formally, 0/ Idxd and 0/ ddU since U is a strictly increasing function and thus
))1(( ExU increases when declines. Note that this channel works even in the absence of financial
constraints.
11
H2: High market sentiment stimulates more R&D investments through turning
negative NPV projects into positive NPV projects (the NPV channel).
D. The Sentiment Spillover Channel
The crowd psychology literature argues that individual beliefs are affected by the
beliefs of others. The influence can be informational, normative, or referent informational.
The informational influence occurs when a person is lack of information or faces uncertainty.
The person hence seeks information from the group and accepts the views of others (Sherif
(1935)).7 The normative influence works when a person conforms to others in order to gain
social approval or to avoid social disapproval (Asch (1955)).8 Under referent informational
influence, people establish a frame of reference using behavior of others and adopt the
common beliefs (Turner (1991)). These experiments suggest a contagious effect of group
opinion. This contagion of opinions might be simply psychologically driven rather than
information driven. Shiller (1984) uses this kind of social movements to explain excessive
optimism in stock markets.
Motivated by the crowd psychology literature and Shiller (1984), we postulate a
behavioral hypothesis about the spillover effect of the investor’s belief (or market sentiment)
on the entrepreneur’s belief. It is worth noting that our sentiment spillover channel includes
but is not restricted to the rational learning channel in which the manager infers information
from actions of the investor and adjusts his posterior belief according to Bayesian updating.
7 Sherif (1935) conducts the autokinetic effect experiment in which participants were asked to estimate how far a
seemingly moving spot of light in a dark room had moved. The estimates of light movement varied substantially
when the participants were tested individually. However, the estimates converged to a common estimate when
one participant who has a quite different estimate was tested together with two participants who have similar
estimates.
8 In the Asch (1955) conformity experiment, one real participant and several confederates were asked to compare
the lengths of line segments. The confederates had been coached beforehand to give unanimously correct or
unanimously wrong answers. The experiment found that the real participant tended to change his perception
when the confederates gave the same answer.
12
Our mechanism is more general in the sense that the manager sentiment may change for a
psychological reason (social influence).
As market sentiment goes up, the entrepreneur also becomes more optimistic about x
because of the sentiment spillover effect and believes that E
H
E xxx . This has two effects.
First, the entrepreneur’s expected utility from doing the project increases, since
))1(( ExqUEU increases in Ex . Second, the incentive compatible fraction of the payoff
IC increases because IC is defined as pq
BE
IC xU
))1(( and U is strictly increasing in
Ex .9 If H
Ex is sufficiently high such that IC , then market sentiment mitigates the
incentive compatibility constraint of the entrepreneur. Consequently, the entrepreneur will
implement the project efficiently and the investor is willing to provide financing.
Accordingly, our third hypothesis is:
H3: High market sentiment stimulates more R&D investments of firms through its
spillover effect on manager sentiment (sentiment spillover channel).
E. Comparative Analysis
To compare the impacts of market sentiment on financially constrained and
unconstrained firms, we assume there are two entrepreneurs {1, 2} and two identical
investors. The two entrepreneurs have the same utility function and investment opportunity as
described above. The two projects have the same expected payoff structure and the
entrepreneurs enjoy the same private benefit B if the project is implemented inefficiently. The
only difference is that entrepreneur 1 has wealth w1, while entrepreneur 2 has wealth w2<w1.
Suppose the project has a positive NPV if implemented efficiently, i.e.
9 Formally, define a such that
pqBaU
)( . Let axE
IC )1( and ax H
E
HIC )1( )( . So
ExaIC 1 and
HEx
aHIC 1)( . Since E
H
E xx , ICHIC )( .
13
)())1(( jEjwUxqU where
I
j
qx
wZ
j
(for j=1,2). Since w2<w1, we have
21 .
Suppose 21
IC where IC is such that pq
BE
IC xU
))1(( and the same for both
entrepreneurs. Thus entrepreneur 1 can raise equity to conduct the project, while entrepreneur
2 is financially constrained and cannot conduct the project. When market sentiment increases,
2 decreases. If H
2 falls below IC , then entrepreneur 2 can raise equity capital and conduct
the project. The higher market sentiment, however, does not affect the investment of the
financially unconstrained entrepreneur 1. This leads to the fourth hypothesis:
H4: Market sentiment has a stronger effect on R&D investments of financially
constrained firms than financially unconstrained firms.
III. Data and Measures
A. Data Sample
The firm-level financial data are from the merged CRSP-Compustat database and the
return data are from GRSP monthly stock database. We compute each firm’s annual
compound returns over the fiscal year using monthly stock returns and match them with the
financial data. The sample period is from January 1, 1985 to December 31, 2010. The
management earnings forecast data are between 1995 and 2010 as First Call’s Company
Issued Guidance Database (CIG) has a limited number of management forecasts before 1995.
To be consistent with the frequency of financial data, we only use annual earnings guidance.
All EPS forecasts not in “USD” and pre-announcement (i.e. forecasts made after the end of
the fiscal period) are excluded. We merge management earnings forecast data with our
financial data. The regulated financial (SIC 6000-6999) and utility (SIC 4900-4999) sectors
are excluded. Also omitted are firms with total assets of less than $10 million or with missing
sales values. We also require firms to have minimum 5 years of consecutive observations. As
14
a result of this screening, our sample consists of 6,139 firms and 77,863 firm-year
observations.
B. Market Sentiment Measures
We use two measures for market sentiment. One measure is an orthogonalized version
of Robert Shiller’s Cyclical-Adjusted Price Earnings Ratio (Orth. CAPE) that removes the
components reflecting macroeconomic conditions. CAPE is defined as the real (“inflation-
adjusted”) price level of the S&P 500 divided by the moving average of the preceding 10
years of S&P 500 real reported earnings.10
It is possible that CAPE simply reveals overall
economic conditions related to growth opportunities. Firms may invest less in innovation
during recessions because of fewer growth opportunities. To isolate the exogenous component
of the market sentiment effect, we adopt an approach similar to Baker and Wurgler (2006) to
orthogonalize CAPE. Specifically, we first regress CAPE on six macroeconomic variables
used in Baker and Wurgler (2006): growth in industrial production, real growth in durable
consumption, non-durable consumption, services consumption, growth in employment, and an
NBER recession indicator. We then use the residuals from this regression to capture the
component in market sentiment index beyond macroeconomic conditions.
The second measure is investor sentiment index developed by Baker and Wurgler
(2006). The Baker and Wurgler sentiment index is formed based on the first principal
component of six investor sentiment proxies, including the closed-end fund discount, NYSE
share turnover, the number of initial public offerings, the average first day’s return of initial
public offerings, the equity share in new issues, and the dividend premium. To minimize the
influence of economic conditions, each of the six proxies is orthogonalized to a set of
macroeconomic variables. A high value of market sentiment index indicates that investors are
10
Since CAPE is scaled by the moving average of ten years S&P real earning, it is less likely to be mechanically
related to individual firms’ R&D in a given year. The annual CAPE data are used in the analysis.
15
more optimistic and have higher risk tolerance. Stock market sentiment varies substantially
over time (Figure 1).
C. Manager Sentiment Measures
Measuring manager sentiment empirically is difficult because it cannot be observed
directly. The literature on managerial optimism/overconfidence suggests that managers may
have some self-attribution bias. The existing studies usually measure managerial optimism
based on the description of the manager by outsiders or on the manager’s personal portfolio
decisions. For example, Malmendier and Tate (2008) identify CEO overconfidence using
market perception of a CEO’s personality from media. Malmendier and Tate (2005, 2008) and
Campbell et al. (2011) use CEO’s stock option holdings and exercise decisions.
Overconfident CEOs postpone the exercise of options that are deep in the money. The
commonly used manager overconfident indices are time invariant and are not suitable to
capture the sentiment spillover effect.
To construct a new measure of managerial sentiment which allows for time variation,
we use earnings forecasts from management earnings guidance. Management earnings
guidance is a firm’s disclosure about its expected future earnings. It is a major channel for
managers to convey their view of the firm’s financial outlook to investors. We obtain
management earnings forecast data from the CIG database. We construct two measures of
managerial sentiment.
The first measure uses changes in management earnings forecasts for the same fiscal
year earnings when a firm issues multiple forecasts throughout the year. An upward
(downward) revision of forecasts indicates that managers become more optimistic
(pessimistic) about future earnings. The differencing procedure removes the time-invariant
manager attributes such as managerial overconfidence that may influence management
earnings forecasts. Although this approach helps to eliminate time-invariant factors that drive
16
the cross-sectional differences in changes in management earnings forecasts, there may still
be other factors driving the differences. The proxy may suffer from a measurement-error
problem. We address this measurement-error problem using the Erickson et al. (2014)
estimator in Section V.B. We assign a value of 1, -1, or 0 if managers revise earnings
forecasts upwards, downwards, or no change, respectively. To construct the first manager
sentiment measure (Manager Sentiment 1), we sum all values over the multiple revisions. A
higher value of the measure indicates that managers become more optimistic.
The second measure of manager sentiment is constructed as the difference between
management earnings forecasts and the actual earnings per share reported by the firm
(Manager Sentiment 2). The actual earnings per share data are obtained from Institutional
Brokers’ Estimate system (I/B/E/S). A higher value of this measure indicates that the
management is optimistic about the earnings perspective of the firm.
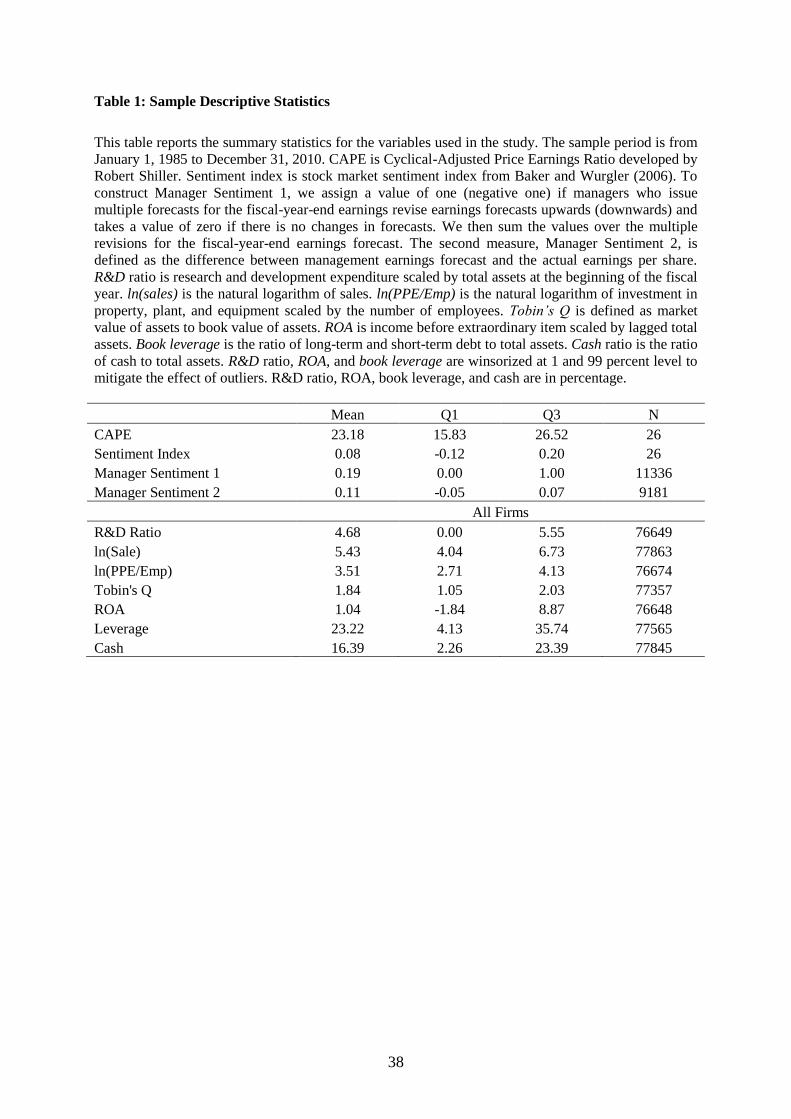
D. Descriptive Statistics
Table 1 describes the summary statistics of market sentiment measures, manager
sentiment measures, and characteristics of firms in the sample. We report the statistics of
market sentiment measures. The average CAPE over the period of 1985 to 2010 is 23.28 and
the mean value of investor sentiment index is 0.08. The correlation between the two CAPE
and investor sentiment index is 0.50. Manager sentiment measures are based on management
earnings forecasts. The average of Manager Sentiment 2 is 0.11, indicating that managers on
average are optimistic.
The R&D expenditures to total assets is 4.68% on average.11
The size of firms,
measured by logarithm of sales, is 5.43 on average and the mean value of capital intensity,
11 We include firm-year observations with missing or zero R&D expenditures because patents are produced in
those years. Missing values of R&D are replaced by zero. Our results also hold for the sample excluding firms
with zero R&D expenditures.
17
measured by logarithm of investment in property, plant, and equipment scaled by the number
of employees is 3.51. Tobin’s Q, measured as the ratio of market value of assets to book
values of assets, on average is 1.84. Return on asset defined as income before extraordinary
item scaled by lagged total assets is 1.04% on average. Firms in the sample have an average
book leverage of 23.22% and a cash ratio of 16.39%.
IV. Market Sentiment and R&D Investments
A. Firm-Level Evidence
We first test whether or not firms spend more on innovation as measured by R&D
ratio when market sentiment is high. In the firm-level analysis, we run a series of panel
regressions with our sample firms. The baseline specification is
R&Di,t = α + β Market Sentimentt + γXi,t-1 + ∑δi + εi,t, (1)
where R&Di,t is the R&D expenditures in year t scaled by total assets of firm i at-the-
beginning of the fiscal year. Market Sentimentt is a measure of stock market sentiment using
annual CAPE, Orth. CAPE, or investor sentiment index. The coefficient on the market
sentiment measure, β, captures changes in R&D investments in response to market-level
sentiment, controlling for other observable and unobservable factors that influence R&D.
The estimation of β potentially involves an endogeneity problem. If changes in firms’
characteristics (or investment opportunity sets) coincide with changes in market sentiment,
then R&D investments may potentially be induced by the changes in firm characteristics
rather than market sentiment. This concern can be partially addressed by including a set of
determinant variables of R&D investments. For example, if firms have more investment
opportunities at good market conditions, the increase in R&D may be due to the increased
investment opportunities. We can mitigate this problem by including control variables such as
Tobin’s Q. We control for a set of firm characteristic variables Xi.t-1, including lag values of
18
log(sales), log(PPE/Emp), Tobin’s Q, ROA, book leverage, and cash, that might affect a
firm’s R&D spending. Furthermore, we also include firm fixed effects to separate market
effects from unobservable firm effects (∑δi). The firm fixed effects estimation exploits the
time series variation within each firm.
Additionally, we adopt the identification strategy used in Bernanke et al. (1996) and
McLean and Zhao (2014) to ease the concern about the potential confounding effect of
growth opportunities and explore cross-sectional variation in the responsiveness of R&D to
changes in market sentiment.12
Table 2 presents the estimation results using CAPE, Orth. CAPE, and the investor
sentiment index as a measure of market sentiment. The coefficients on market sentiment in all
the specifications are positive and significant. For example, the coefficient in regression (5)
shows that one standard deviation increase in investor sentiment index is associated with an
increase in R&D as a ratio of total assets by 0.3406%. Given an average R&D ratio of 4.68%,
the change is also economically significant. After controlling for firm characteristic variables
that may affect firms’ R&D investments, market sentiment still have a positive and significant
influence on R&D. The coefficients on the control variables suggest that smaller firms have a
higher R&D ratio and firms with lower tangibility, higher Tobin’s Q, lower ROA, lower debt
ratio, and lower cash reserves spend more on R&D.
B. Aggregate-Level Evidence
Having established that firm-level R&D is positively related to market sentiment, we
next investigate whether aggregate R&D is related to market sentiment. The rational
investment model based on efficient markets predicts no relation between aggregate R&D and
market sentiment. Our model predicts a positive relation between aggregate R&D and market
12
We investigate the differential effects of market sentiment on R&D investments of financially constrained and
unconstrained firms in Section V.
19
sentiment, since financially constrained firms would invest more as financing costs decline or
managers would undertake more innovative projects as they become more optimistic.
To investigate the relation of aggregate R&D and market sentiment, we regress
aggregate time series R&D on the market sentiment index. We compute time series aggregate
R&D by value-weighting annual firm-level R&D using the fiscal year-end market
capitalizations as weights. Arif and Lee (2014) compute aggregate investments in a similar
methodology. Table 3 presents the estimation results of regression using CAPE, Orth.CAPE,
and the investor sentiment index as a proxy for market sentiment. The estimation results show
that aggregate R&D and market sentiment are positively related.
V. The Transmission Channels of Market Sentiment on R&D Investments
We find that firms’ spending on R&D is positively related to stock market sentiment. Our
theoretical model highlights three transmission mechanisms and thus potential explanations
for why firms might invest more in R&D when market-wide sentiment increases. This section
empirically examines these transmission channels.
A. The Financing Channel
One potential explanation for the positive relation between firm-level R&D spending
and market sentiment is that high stock market sentiment reduces the cost of equity and
facilitates funding for innovation as illustrated in our model (the financing channel). If market
sentiment encourages investments in innovation through the financing channel, we would
expect the effect to be stronger among firms that are financially constrained. The capital
provided by optimistic investors should ease the constraint faced by financially constrained
firms and enable them to invest more in R&D. To test this conjecture, we estimate the
baseline model for financially constrained and unconstrained firms separately.
20
1. Financially Constrained versus Unconstrained Firms
Following the literature, we use five measures of financial constraints to split our
sample.13
The first measure is firm size following Erickson and Whited (2000), Acharya et al.
(2007) and many others. Firms are ranked annually based on total assets and are allocated to
the financially constrained (unconstrained) group for the bottom (top) tertile. Small firms are
generally more vulnerable to capital market imperfections (Frank and Goyal (2003)).
Fazzari et al. (1988), among many others, argue that financially constrained firms are
reluctant to pay dividends. The second financial constraint measure is payout ratio defined as
dividends plus stock repurchases scaled by total assets. The total distribution of funds is used
so that firms not paying dividends but conducting stock repurchase are not classified as
constrained. In every year over the sample period, we rank firms based on their payout ratios
and assign to the financially constrained (unconstrained) group. Firms in the bottom (top)
tertile are constrained (unconstrained).
The third measure is the SA index derived by Hadlock and Pierce (2010). By
analyzing qualitative information from financial filings, Hadlock and Pierce (2010) show that
firm size and age are the most useful proxy for financial constraints. They develop a size-age
(SA) index to measure financial constraints. The SA index is constructed as SA = −0.737SIZE
+ 0.043SIZE2
− 0.040AGE, where SIZE is the natural logarithm of inflation adjusted total
assets. Total assets are in 2004 dollars. AGE is defined as the number of years after the firm
goes public or the number of years the firm appears on Compustat with a non-missing stock
13
We also perform the test using the WW index derived by White and Wu (2006) based on an Euler equation
approach from a structural model of investment. The WW index is a linear combination of six factors according
to the following formula: WW = −0.091CF−0.062DIVPOS+0.021TLTD−0.044LNTA+0.102ISG−0.035SG,
where CF is the ratio of cash flow to total assets; DIVPOS is a dummy variable that takes the value of one if the
firm pays cash dividends; TLTD is the ratio of the long-term debt to total assets; LNTA is the natural log of total
assets; ISG is the firm’s three-digit industry sales growth; and SG is firm sales growth. Firms with a higher value
of the WW index are more constrained. We rank firms based on the WW index and group the top (bottom) tertile
into constrained (unconstrained) portfolios. Similar results are found using WW index.
21
price if no initial public offering date is available. Following Hadlock and Pierce (2010), we
replace firm size with log($4.5 billion) and age with thirty-seven years if the actual values
exceed these thresholds. Firms with a higher value of the SA index are more constrained. We
rank firms each year based on the SA index and group the top (bottom) tertile into constrained
(unconstrained) portfolios.
A potential concern about the size and the SA index is that these measures may
capture young and/or small firms that are especially likely to have time-varying investment
opportunities. To minimize this concern, we adopt another financial constraint measure
introduced by Lewellen and Lewellen (2014). This measure is based on forecasts of a firm’s
free cash flow (FCF), which is not necessarily highly correlated with investment
opportunities.14
Free cash flow is measured as the difference between cash flow (CF) and net
capital expenditures. Cash flow is defined as the sum of income before extraordinary items,
extraordinary items and discontinued operations, depreciation and amortization, deferred
taxes, equity in net loss of unconsolidated subsidiaries, losses from the sale of PPE, and funds
from operations-other. Net capital expenditures represent the difference between capital
expenditures and depreciation. Following Lewellen and Lewellen (2014), we rank firms each
year based on expected free cash flow to avoid sorting on realized investment. Expected cash
flow is estimated by the predicted value from a cross-sectional regression of FCF on lagged
firm characteristics including CF, stock returns, net capital expenditures, dividends, book
leverage, M/B, sales, PPE, depreciation, cash, and changes in cash. The level variables are
scaled by total assets and the flow variables are scaled by total assets at-the-beginning of the
fiscal year. Firms with expected free cash flow at the top 1/3 are classified unconstrained and
those at the bottom 1/3 are classified as constrained.
14
Using Tobin’s Q as a proxy for investment opportunities, the correlation between expected free cash flow and
Tobin’s Q is -0.0462.
22
The fifth financial constraint measure that we use is investment-cash flow sensitivity.
Fazzari et al. (1988, 2000) find a positive sensitivity of investment to cash flow and interpret
the sensitivity as evidence for financial constraints. The basis is that investments of a
financially constrained firm rely heavily on internal funds due to unavailability of external
capital. Hence, investments of financially constrained firms are more sensitive to cash flows.15
To classify firms as financially constrained or unconstrained, we first estimate investment-
cash flow sensitivity for each firm with minimum 20 years of observations. We then rank
firms based on the sensitivities and categorize firms in the top tercile as financially
constrained and those in the bottom tercile as financially unconstrained.
Table 4 presents the estimation results using Orth. CAPE as a measure for market
sentiment. Similar results are obtained with CAPE and investor sentiment as a market
sentiment measure. The relation between market sentiment and R&D investments is
concentrated on firms that are younger; that pay a lower amount of dividends; that have a
smaller value of SA index, that have lower expected free cash flows, and that have higher
investment-cash flow sensitivity. These are firms, suggested by existing evidence, that are
most likely to be financially constrained. In contrast, the R&D investments of unconstrained
firms exhibit no response to movements in market sentiment. The rationale behind this
finding might be unconstrained firms do not have to wait for optimism in stock markets to
reduce the cost of capital in order to finance innovation.
2. Financing Decisions
The previous section shows that financially constrained firms invest more in R&D
when market sentiment is high. The evidence that the relation between market sentiment and
innovation investments is stronger for financially constrained firms indicates a role of the
15
However, Kaplan and Zingales (1997), Cleary (1999), Erickson and Whited (2000), Gomes (2001), Alti
(2003), and Chen and Chen (2012) find a much weaker or disappearing sensitivity of firms’ investment to cash
flows. The results using this financial constraint measure should be interpreted with some caution.
23
financing channel. Our model illustrates that optimism in stock markets may lower the cost of
equity and therefore firms raise cheaper equity capital to finance innovation.
Now we examine whether financially constrained firms are more likely to issue stocks
when market sentiment is high. Our empirical specification estimates a probit model with an
equity issuance dummy as the dependent variable. The independent variables include market
sentiment index, financial constraint dummy, the interaction term between market sentiment
index and financial constraint dummy, as well as other factors that affect the decision of stock
issuance such as ln(sales), ln(PPE/Emp), Tobin’s Q, ROA, Book leverage, Cash, and Stock
return. Following the literature, we consider a firm as issuing equity if the sale of common
and preferred stock minus purchase of common and preferred stock scaled by total assets at
the beginning of fiscal year is more than 5%. We include stock returns in the preceding fiscal
year in light of the stylized facts that firms tend to issue equity following periods of high stock
returns.16
Table 5 presents the estimation results using Orth. CAPE. The negative and mostly
insignificant coefficients on Orth. CAPE indicate that financially unconstrained firms are not
more likely to issue equity when market sentiment is high. The coefficients on the interaction
term between market sentiment and financial constraint dummy are all positive and
statistically significant, which support the view that financially constrained firms have a
higher propensity to issue equity when the market is more optimistic. Overall, the results
provide support for the financing channel through which optimistic markets stimulate
innovation by enabling financially constrained firms to raise equity capital for R&D
investments.
16
The empirical evidence includes Asquith and Mullins (1986), Jung, Kim, and Stulz (1996), and Hovakimian,
Opler, and Titman (2001) and many others.
24
B. The Sentiment Spillover Channel
The positive relation between market sentiment and spending on innovation may also
arise because managers become more optimistic about their firms’ future earnings or more
risk tolerant when investors in the markets are optimistic. The influence of market sentiment
on manager sentiment could come from psychological impacts and/or informational effects as
suggested in our model. Optimistic managers are more likely to undertake riskier projects.
Under this circumstance, we expect that market sentiment affects R&D through influencing
managers’ willingness to undertake risky innovative projects (the sentiment spillover
channel).
To investigate this transmission channel, we include a measure of manager sentiment
and an interaction term between manager sentiment and market sentiment to the baseline
regression model. If the sentiment spillover channel is at force, we expect the coefficient on
the interaction term to be significant. We first estimate our model controlling for the firm
fixed effects and report the results using the two measures of manager sentiment. Table 6
Panel A shows that the coefficients on the interaction term between manager sentiment and
market sentiment are positive but statistically insignificant.
Our manager sentiment measures potentially suffer from the measurement error
problem. Management earnings forecasts may reflect factors other than manager sentiment. In
presence of errors-in-variables, the ordinary least square estimates of the coefficients are
biased. To address the measurement error problem, we use the cumulant estimators for
mismeasured regressors developed by Erickson et al. (2014) to estimate the coefficients. The
cumulant estimators are closed-form minimum distance estimators that are linear in the third
and higher cumulants of the regressors. The estimation of coefficients is based on higher-
order moments. The cumulant estimators only require that the mismeasured regressors are not
normally distributed. We verified that this condition is satisfied in our estimations. Erickson et
25
al. (2014) find that the cumulant estimators have better finite-sample performance than the
moment estimators from Erickson and Whited (2002).
Table 6 Panel B shows that the coefficients on the manager sentiment measure are
positive and significant after correcting for the measurement error problem. The results
indicate that optimistic managers tend to spend more on R&D. The coefficients on the
interaction term between the market sentiment measure and the manager sentiment measure
are all positive and statistically significant, indicating that more optimistic managers invest
more in R&D when market sentiment is high. The significance of the interactive term
between manager sentiment and market sentiment indicate that our manager sentiment
measure might pick up something beyond managerial forecasts of true fundamentals. The
results provide suggestive evidence that market sentiment affects R&D investments through
influencing managers’ sentiment regarding investments in innovative projects.
VI. Patent Production
Although market-wide sentiment affects firms’ innovation inputs, that is, R&D
investments, its impact on innovation outputs is unclear. One the one hand, more R&D
investments could lead to lower efficiency in generating patents if more marginal projects are
funded. One the other hand, more investments in innovation could bring economy of scale
and create synergy among innovative projects. Therefore, we investigate empirically whether
R&D investments stimulated by market sentiment lead to more innovation outcomes in the
future.
To examine the real effects of R&D spending, we explore the quantity and quality of
firms’ patents as well as innovation productivity. Patents represent successful outcomes of
past R&D investments. The firm-year patent counts and patent citations data are obtained
from the National Bureau of Economic Research (NBER) Patent Citation database. Our
sample for this analysis stops in 2004 because the average time lag between patent application
26
date and grant date is two to three years and the NBER database contains patent data up to
2006.
We measure the quantity of innovation outcome as the number of patents applied by a
firm in a given year. The quality of patents is measured by the number of citations. Patent
citations are subject to a truncation bias because citations are received over a long period of
time and therefore patents created in later years have less time to accumulate citations
compared to patents created in earlier years. Additionally, the citation intensities of patents
might vary across different industries. To correct for the truncation bias, we follow Hall et al.
(2001) and scale the raw patent citation counts by the average citation counts of all patents
applied in the same year and technology class. The innovation productivity measure reveals
the number of patents produced in subsequent years for every million dollar of R&D
expenditures (Patentt+1/R&Dt, Patentt+2/R&Dt). If R&D investments stimulated by market
sentiment lead to more innovation, we would expect a positive relation between innovation
productivity and market sentiment.
We estimate our model with patent measures as the dependent variable. Since patent
production may take time, we check patents applied in the subsequent few years. For brevity,
Table 7 only presents the estimation results for the subsequent two years using the two
sentiment indexes. Our results also hold for a longer time period. The coefficients on market-
wide sentiment indexes are all positive and significant, suggesting that higher quantity and
better quality patents are produced in more optimistic markets. More patents are produced for
every million dollar of investment in R&D in more optimistic markets. The higher efficiency
in patent production leads to better quantity and quality of patents. The results indicate that
market sentiment not only affects innovation inputs, but also innovation outcomes.
27
VII. Capital Expenditures
Our analyses have shown that market sentiment affects innovation inputs and outputs.
Recent studies find that economic forces have differential effects on R&D and fixed asset
investments due to the intangibility nature and uncertainty of R&D investment outcome
(Brown et al. (2013), Becker-Blease and Paul (2006), Fang et al. (2014), He and Tian (2014),
and Grullon et al. (2015)). The survey study of Hall and Lerner (2010) highlights that equity
financing is particularly important for R&D investments. Debt financing is more difficult for
innovation because the intangible assets generated by R&D investments offer little collateral
values. Additionally, creditors have lower incentives to fund risky innovative activities
because they cannot share the unlimited upside returns associated with innovation. In contrast,
the collateral value of fixed asset investments makes it easier to be financed with debt. In light
of differences in the nature of R&D investments and fixed asset investments, we investigate
whether market-wide sentiment affects capital expenditures differently from R&D.
Since we are interested in the differential effects of market sentiment on R&D
investments and capital expenditures, we partition the sample into firms with R&D spending
and firms without R&D spending. We regress firms’ capital expenditures as a ratio of total
assets at the beginning of the fiscal year on the market sentiment measure, while controlling
for other factors and firm fixed effects. The model is estimated separately for R&D firms and
non-R&D firms. To investigate whether market sentiment affects fixed asset investments of
financially constrained and unconstrained firms differently, we estimate the baseline model
with capital expenditure ratio as the dependent variable for financially constrained and
unconstrained firms, separately. For brevity, we report results using firm size as the financial
constraint measure and orthogonalized sentiment index. Similar results are obtained using the
investor sentiment index.
The estimation results for R&D firms are reported on Table 8 Panel A Columns (1)
and (2) and those for non-R&D firms are reported on Columns (3) and (4). Column (1) shows
28
that the coefficients on market sentiment is positive and significant, indicating that financially
constrained R&D firms invest more in fixed assets as market sentiment goes up. However, the
coefficient is insignificant in Column (2), indicating that financially unconstrained R&D firms
do not spend significantly more on capital expenditures at high market sentiment. For non-
R&D firms, the coefficients on market sentiment index are positive and significant for both
financially constrained and unconstrained firms. These results indicate that financial
constraints seem to matter more for investments of R&D firms. Additionally, more
investments, especially those by financially unconstrained firms, might also arise because
lower cost of capital at high market sentiment turns negative NPV projects into positive NPV
projects.
In Panel B and C, we investigate whether market sentiment affects fixed asset
investments through its influence on manager sentiment. Panel B reports the estimation
results controlling for firm fixed effects. The coefficients on the interaction term between
market sentiment and manager sentiment measure are insignificant. In Panel C, we use the
higher-order cumulant estimators to ease the measurement error concern. For R&D firms, the
coefficients on the interaction term between market sentiment and manager sentiment
measure remain insignificant (Columns (1) and (2)). The coefficients on the interaction terms
are positive and significant for non-R&D firms (Columns (3) and (4)), indicating that more
optimistic managers of non-R&D firms tend to spend more on physical assets as market
sentiment is high. The sentiment spillover channel seems to matter more for fixed asset
investments of non-R&D firms. The differences in the impact of market sentiment on CAPEX
of R&D firms and non-R&D firms might be due to relative importance of the three
transmission channels or characteristic differences between R&D firms and non-R&D firms.
Lastly, we examine whether market-wide sentiment has a differential impact on fixed
asset investments and R&D investments. We expect that R&D investments of financially
constrained firms are more sensitive to market sentiment due to the relative importance of
29
equity financing for investments in innovation and the intangibility nature of R&D
investments. We estimate the model for financially constrained and unconstrained firms with
positive R&D expenses. To examine whether the impact of market sentiment is stronger for
R&D investments than capital expenditures, we compute the difference between R&D and
capital expenditures for each firm in each year and scale the difference by total assets at the
beginning of the fiscal year for R&D firms. We regress the difference between R&D and
capital expenditures on the market sentiment measure, while controlling for observable and
unobservable factors affecting investments. Table 8 Panel D shows that the coefficient on the
market sentiment measure is positive and statistically significant for financially constrained
firms, but is insignificant for financially unconstrained firms. The result indicates that
financially constrained firms’ investments in innovation are more sensitive to market
sentiment than investments in fixed assets. These results are also consistent with the view that
fixed asset investments depend less on equity financing because they can also be financed
with debt relatively easily.
VIII. Robustness Checks
One concern is that firms’ investments in innovation and market sentiment are
endogenously determined by investment opportunities. In other words, changes in innovation
investments can be driven by a demand shift in R&D. We ease this concern by controlling for
observable and unobservable factors that might reflect firm-level investment opportunities in
our regression models. In the unreported analysis, we use industry fixed effects to control for
industry-wide investment opportunities and use a set of macroeconomic variables to control
for economy-wide time-varying investment opportunities. Our results remain intact. In
addition, we investigate the cross-sectional difference in the sensitivity of R&D investments
to changes in market sentiment. To the extent that market sentiment captures investment
opportunities, all firms should respond to time-varying investment opportunities. We find that
30
only financially constrained, but not unconstrained, firms invest more in R&D when market
sentiment is high. This piece of evidence is inconsistent with the view that investment
opportunities drive the relation between market sentiment and R&D investments.
Although the Baker and Wurgler investor sentiment index and the Orth. CAPE are
constructed to be orthogonal to macroeconomic variables related to growth opportunities,
Sibley, Xing and Zhang (2013) show that the Baker and Wurgler index is correlated with
business cycle variables and risk variables such as the current T-bill rate and liquidity risk. To
remove the effect of these fundamental related variables, we orthogonalize the two market
sentiment indexes to these factors and re-estimate our model. Following Sibley et al. (2013),
we use the 3-month Treasury rate as an indicator for business cycle and use the market
average of firm-level percentage of zero return days as a proxy for market liquidity risk. We
obtain stock daily returns data from the CRSP daily returns file. The percentage of zero return
days is defined as the ratio of the number of zero days to the total number of trading days in a
given month. Using the orthogonalized sentiment indexes, we still observe that firms invest
more in R&D as market sentiment increases (Table 9). Overall, investment opportunity is less
likely to be the main driver underlying the positive relation between R&D and market
sentiment.
IX. Conclusions
This paper analyzes whether innovation activities of publicly traded firms are
responsive to aggregate stock market sentiment and identifies three transmission channels.
We provide empirical evidence which supports the view that stock market optimism
facilitates investments in innovation through a financing channel where higher market
sentiment reduces the financing costs. We document that financially constrained firms are
more likely to issue equity and invest more in R&D when the stock market is more optimistic,
while we do not observe such relation for financially unconstrained firms. Our analyses also
31
provide suggestive evidence that is consistent with the view that market sentiment affects
R&D investments through its influence on manager sentiment. We find only weak evidence
that firms may invest more because high market sentiment turns negative NPV projects into
positive NPV projects. Furthermore, we find that more and better quality patents are
generated from R&D investments stimulated by high market sentiment. For financially
constrained firms that invest in both R&D and fixed assets, the impact of market-wide
sentiment on R&D is stronger than the impact on fixed asset investments.
Overall, our results indicate potential positive effects of stock market optimism on
facilitating innovation. Therefore, policy makers and central bankers may need to take into
account the potential social benefits of high stock market sentiment when they design
measures to deflate high level of market optimism.
32
References
Alti, A. “How sensitive is investment to cash flow when financing is frictionless?” Journal of
Finance, 58 (2003), 707-722.
Aghion, P. and P. Howitt. “A Model of Growth through Creative Destruction.”
Econometrica, 60 (1992), 323-351.
Arif, S and C. M. Lee. “Aggregate Investment and Investor Sentiment.” Review of Financial
Studies, 27 (2014), 3241-3279.
Asquith, P. and D. Mullins. “Equity Issues and Offering Dilution.” Journal of Financial
Economics, 15 (1986), 61-89.
Asch, S. E. “Effects of Group Pressure upon the Modification and Distortion of Judgment.” In
Groups, leadership and men. H. Guetzkow, ed. Pittsburgh, PA: Carnegie Press (1951).
Asch, S. E. “Opinions and social pressure,’ Scientific American, 193 (1955), 35-35.
Acharya, V., H. Almeida and M. Campello. “Is Cash Negative Debt? A Hedging Perspective
on Corporate Financial Policies.” Journal of Financial Intermediation, 16 (2007), 515-554.
Baker, M., J. Stein and J. Wurgler. “When Does the Market Matter? Stock Prices and the
Investment of Equity-Dependent Firms.” Quarterly Journal of Economics, 118 (2003), 969-
1006.
Baker, M., and J. Wurgler. “Investor Sentiment and the Cross-section of Stock Returns.”
Journal of Finance, 61 (2006), 1645-1680.
Baker, M. and J. Wurgler. “Investor Sentiment in the Stock market.” Journal of Economic
Perspectives, 21 (2007), 129-157.
Baker, M. “Capital Market-Driven Corporate Finance.” Annual Review of Financial
Economics, 1 (2009), 181-205.
33
Bakke T. E., T. Whited. “Which Firms Follow the Market? An Analysis of Corporate
Investment Decisions.” Review of Financial Studies, 23 (2010), 1941-1980.
Becker-Blease, J. R., and D. L. Paul. “Stock Liquidity and Investment Opportunities:
Evidence from Index Additions.” Financial Management, 35 (2006), 35-51.
Ben-David, I., J. R. Graham, and C. R Harvey. “Managerial Miscalibration.” Quarterly
Journal of Economics, 128 (2013), 1547-1584.
Bernanke, B., M. Gertler, and S. Gilchrist. ”The Financial Acccelerator and the Flight to
Quality.” Review of Economics & Statistics, 78 (1996), 1-15.
Blanchard, O., C. Rhee, and L. Summers. “The Stock Market, Profit, and Investment.”
Quarterly Journal of Economics, 108 (1993), 115-136.
Bond, P., A. Edmans and I. Goldstein. “The Real Effects of Financial Markets.” Annual
Review of Financial Economics, 4 (2012), 339-360.
Brown, J. R., G. Martinsson, and B. C. Petersen. “Law, Stock Markets, and Innovation.”
Journal of Finance, 68 (2013), 1517-1549.
Caballero, R., E. Farhi, and M. Hammour. “Speculative Growth: Hints from the U.S.
Economy.” American Economic Review, 96 (2006), 1159-1192.
Campbell, T. C., M. Gallmeyer, S. Johnson, J. Rutherford, and B. Stanley. “CEO Optimism
and Forced Turnover.” Journal of Financial Economics, 101 (2011), 695-712.
Carhart, M. M. “On Persistence in Mutual Fund Performance.” Journal of Finance, 52 (1997),
57-82.
Chambers, D., R. Jennings, and R. B. Thompson. “Excess Returns to R&D-intensive Firms.”
Review of Accounting Studies, 7 (2002), 133-158.
34
Chen, H., and S. Chen. “Investment-cash flow sensitivity cannot be a good measure of
financial constraints: evidence from the time series.” Journal of Financial Economics, 103
(2012), 393-410.
Chen Q., I. Goldstein and W. Jiang. “Price Informativeness and Investment Sensitivity to
Stock Price.” Review of Financial Studies, 20 (2007), 619-650.
Chirinko, R., and H. Schaller. “Business Fixed Investment and “Bubbles”: The Japanese
Case.” American Economic Review, 91 (2001), 663-680.
Cleary, S. “The relationship between firm investment and financial status.” Journal of
Finance, 54 (1999), 673-692.
Edmans, A., I. Goldstein, and W. Jiang. “The Real Effects of Financial Markets: The Impact
of Prices on Takeovers.” Journal of Finance, 67 (2012), 933–971.
Erickson, T. and T.M. Whited. “Measurement Error and the Relationship between Investment
and Q.” Journal of Political Economy, 108 (2000), 1027-1057.
Erickson, T., C.H. Jiang, T.M. Whited. “Minimum distance estimation of the errors-in-
variables model using linear cumulant equations.” Journal of Econometrics, 183 (2014), 211-
221.
Fama, E. F., and K. R. French. “Common risk factors in the returns of bonds and stocks.”
Journal of Financial Economics, 33 (1993), 3-56.
Fang, V. W., X. Tian, and S. Tice. “Does Stock Liquidity Enhance or Impede Firm
Innovation?” Journal of Finance, 69 (2014), 2085-2125.
Fazzari, S., R. G. Hubbard, and B. Petersen. “Financing Constraints and Corporate
Investment.” Brookings Papers on Economic Activity, 1 (1988), 141-195.
35
Fazzari, S. M., G. R. Hubbard, and B. C. Petersen. “Investment-cash flow sensitivities are
useful: A comment on Kaplan-Zingales.” Quarterly Journal of Economics, 115 (2000), 695-
705.
Frank, M., and V. Goyal. “Testing the Pecking Order Theory of Capital Structure.” Journal of
Financial Economics, 67 (2003), 217-248.
Gilchrist, S., C. Himmelberg, and G. Huberman. “Do Stock Price Bubbles Influence
Corporate Investment?” Journal of Monetary Economics, 52 (2005), 805-827.
Gomes, J. “Financing Investment.” American Economic Review, 91 (2001), 1263-1285.
Grullon, G., S. Michenaud, and J. Weston. “The Real Effects of Short-selling Constraints,
Review of Financial Studies, (2015), forthcoming
Hadlock, C. J. and J. R. Pierce. “New Evidence on Measuring Financial Constraints: Moving
beyond the KZ Index.” Review of Financial Studies, 23 (2010), 1909-1940
Hall, B. H., A. B. Jaffe, and M.Trajtenberg. “The NBER patent and citation data file: Lessons,
insights and methodological tools.” NBER Working Paper (2001).
Hall, B. H. The Financing of Innovation, Blackwell Handbook of Technology and Innovation
Management. S. Shane. Oxford Blackwell Publishers, Ltd. (2005).
Hall, B. H. and J. Lerner. “The Financing of R&D and Innovation.” Handbook of Economics
and Innovation. Hall, B.H. and N.Rosenber, eds. Elsevier-North Holland (2010).
He, J., and X. Tian. “Short Sellers and Innovation: Evidence from a Quasi-natural
Experiment.” Working paper available at SSRN: http://ssrn.com/abstract=2380352 (2014)
Hirshleifer, D., A. Low, and S. H. Teoh. “Are Overconfident CEOs Better Innovators?”
Journal of Finance, 67 (2102), 1457-1498.
36
Holmstrom, B. and J. Tirole. “Financial Intermediation, Loanable Funds, and the Real
Sector.” Quarterly Journal of Economics, 112 (1997), 663-691.
Hovakimian, A., T. Opler, and S. Titman. “The Debt-Equity Choice.” Journal of Financial
and Quantitative Analysis, 36 (2001), 1-24.
Hribar, P. and H. Yang. “CEO Overconfidence and Management Forecasting.” Working
Paper, Available at SSRN: http://ssrn.com/abstract=929731 (2012).
Jermann, U. and V. Quadrini. “Stock Market Boom and the Productivity Gains of the 1990s.”
Journal of Monetary Economics, 54 (2007), 413-432.
Jung, K., Y. C. Kim, and R. M. Stulz. “Timing, Investment Opportunities, Managerial
Discretion, and Security Issue Decision.” Journal of Financial Economics, 42 (1996), 159-
185.
Kaplan, S., and L. Zingales. “Do Financing Constraints Explain Why Investment is Correlated
with Cash Flow?” Quarterly Journal of Economics, 112 (1997), 169–215.
Keynes, J. M. An Economic Analysis of Unemployment, In Collected Writings, Volume XII
(1931). Macmillan, London.
Lamont, O. and J. Stein. “Investor Sentiment and Corporate Finance: Micro and Macro.”
American Economic Review, 96 (2006), 147-151.
Lewellen, K., and J. Lewellen. “Investment and cash flow: New evidence.” Journal of
Financial and Quantitative Analysis, (2014), forthcoming
McLean D. and M. Zhao. “The Business Cycle, Investor Sentiment, and Costly External
Finance.” Journal of Finance, 69 (2014), 1377-1409.
Malmendier, U. and G. Tate. “CEO Overconfidence and Corporate Investment.” Journal of
Finance, 60 (2005), 2660-2700.
37
Malmendier, U. and G. Tate. “Who Makes Acquisitions? CEO Overconfidence and the
Market’s Reaction.” Journal of Financial Economics, 89 (2008), 20-43.
Morck, R., A. Shleifer, and R. Vishny. “The Stock Market and Investment: Is the Market a
Side Show?” Brookings Papers on Economic Activity, 2 (1990), 157–215.
Moscovici, S. Age of the Crowd: A Historical Treatise on Mass Psychology, Cambridge
University Press (1985).
Olivier, J. “Growth-Enhancing Bubbles.” International Economic Review, 41 (2000), 133-
151.
Polk, C., and P. Sapienza. “The Stock Market and Corporate Investment: A Test of Catering
Theory.” Review of Financial Studies, 22 (2009), 187-217.
Romer, P.M. “Endogenous Technological Change.” Journal of Political Economy, 98 (1990),
71-102.
Shiller, R. “Stock Prices and Social Dynamics.” Brookings Papers on Economic Activity, 2
(1984), 457-498.
Sherif, M. “A Study of Some Social Factors in Perception.” Archives of Psychology, 27
(1935), 23-46.
Sibley, S., Y. Xing, and X. Zhang. “Is Sentiment Sentimental.” Working Paper available at
SSRN: http://ssrn.com/abstract=2176348 (2013).
Tirole, J. The Theory of Corporate Finance, Princeton University Press. (2006).
Turner, J. C. Social influence, Milton Keynes: Open University Press (1991).
Whited, T. and G. Wu. “Financial Constraints Risk.” Review of Financial Studies, 19 (2006),
531-559.
38
Table 1: Sample Descriptive Statistics
This table reports the summary statistics for the variables used in the study. The sample period is from
January 1, 1985 to December 31, 2010. CAPE is Cyclical-Adjusted Price Earnings Ratio developed by
Robert Shiller. Sentiment index is stock market sentiment index from Baker and Wurgler (2006). To
construct Manager Sentiment 1, we assign a value of one (negative one) if managers who issue
multiple forecasts for the fiscal-year-end earnings revise earnings forecasts upwards (downwards) and
takes a value of zero if there is no changes in forecasts. We then sum the values over the multiple
revisions for the fiscal-year-end earnings forecast. The second measure, Manager Sentiment 2, is
defined as the difference between management earnings forecast and the actual earnings per share.
R&D ratio is research and development expenditure scaled by total assets at the beginning of the fiscal
year. ln(sales) is the natural logarithm of sales. ln(PPE/Emp) is the natural logarithm of investment in
property, plant, and equipment scaled by the number of employees. Tobin’s Q is defined as market
value of assets to book value of assets. ROA is income before extraordinary item scaled by lagged total
assets. Book leverage is the ratio of long-term and short-term debt to total assets. Cash ratio is the ratio
of cash to total assets. R&D ratio, ROA, and book leverage are winsorized at 1 and 99 percent level to
mitigate the effect of outliers. R&D ratio, ROA, book leverage, and cash are in percentage.
Mean Q1 Q3 N
CAPE 23.18 15.83 26.52 26
Sentiment Index 0.08 -0.12 0.20 26
Manager Sentiment 1 0.19 0.00 1.00 11336
Manager Sentiment 2 0.11 -0.05 0.07 9181
All Firms
R&D Ratio 4.68 0.00 5.55 76649
ln(Sale) 5.43 4.04 6.73 77863
ln(PPE/Emp) 3.51 2.71 4.13 76674
Tobin's Q 1.84 1.05 2.03 77357
ROA 1.04 -1.84 8.87 76648
Leverage 23.22 4.13 35.74 77565
Cash 16.39 2.26 23.39 77845
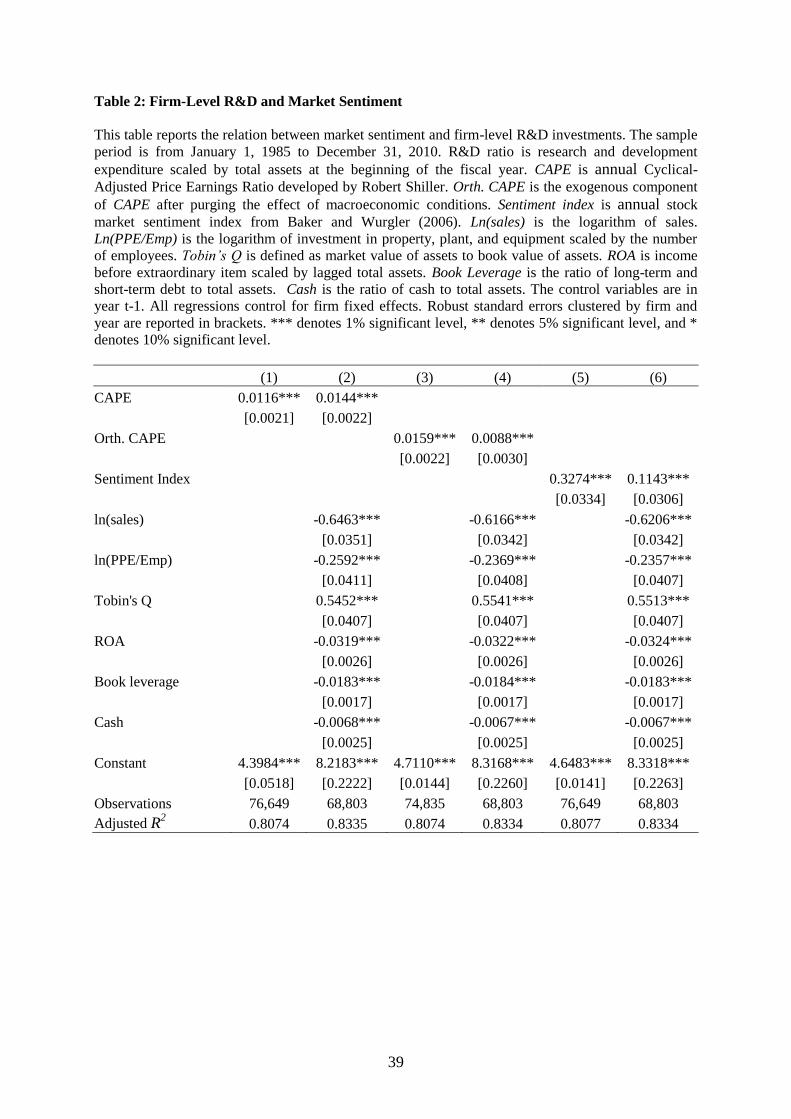
39
Table 2: Firm-Level R&D and Market Sentiment
This table reports the relation between market sentiment and firm-level R&D investments. The sample
period is from January 1, 1985 to December 31, 2010. R&D ratio is research and development
expenditure scaled by total assets at the beginning of the fiscal year. CAPE is annual Cyclical-
Adjusted Price Earnings Ratio developed by Robert Shiller. Orth. CAPE is the exogenous component
of CAPE after purging the effect of macroeconomic conditions. Sentiment index is annual stock
market sentiment index from Baker and Wurgler (2006). Ln(sales) is the logarithm of sales.
Ln(PPE/Emp) is the logarithm of investment in property, plant, and equipment scaled by the number
of employees. Tobin’s Q is defined as market value of assets to book value of assets. ROA is income
before extraordinary item scaled by lagged total assets. Book Leverage is the ratio of long-term and
short-term debt to total assets. Cash is the ratio of cash to total assets. The control variables are in
year t-1. All regressions control for firm fixed effects. Robust standard errors clustered by firm and
year are reported in brackets. *** denotes 1% significant level, ** denotes 5% significant level, and *
denotes 10% significant level.
(1) (2) (3) (4) (5) (6)
CAPE 0.0116*** 0.0144***
[0.0021] [0.0022]
Orth. CAPE
0.0159*** 0.0088***
[0.0022] [0.0030]
Sentiment Index
0.3274*** 0.1143***
[0.0334] [0.0306]
ln(sales)
-0.6463***
-0.6166***
-0.6206***
[0.0351]
[0.0342]
[0.0342]
ln(PPE/Emp) -0.2592***
-0.2369***
-0.2357***
[0.0411]
[0.0408]
[0.0407]
Tobin's Q
0.5452***
0.5541***
0.5513***
[0.0407]
[0.0407]
[0.0407]
ROA
-0.0319***
-0.0322***
-0.0324***
[0.0026]
[0.0026]
[0.0026]
Book leverage -0.0183***
-0.0184***
-0.0183***
[0.0017]
[0.0017]
[0.0017]
Cash
-0.0068***
-0.0067***
-0.0067***
[0.0025]
[0.0025]
[0.0025]
Constant 4.3984*** 8.2183*** 4.7110*** 8.3168*** 4.6483*** 8.3318***
[0.0518] [0.2222] [0.0144] [0.2260] [0.0141] [0.2263]
Observations 76,649 68,803 74,835 68,803 76,649 68,803
Adjusted R2 0.8074 0.8335 0.8074 0.8334 0.8077 0.8334
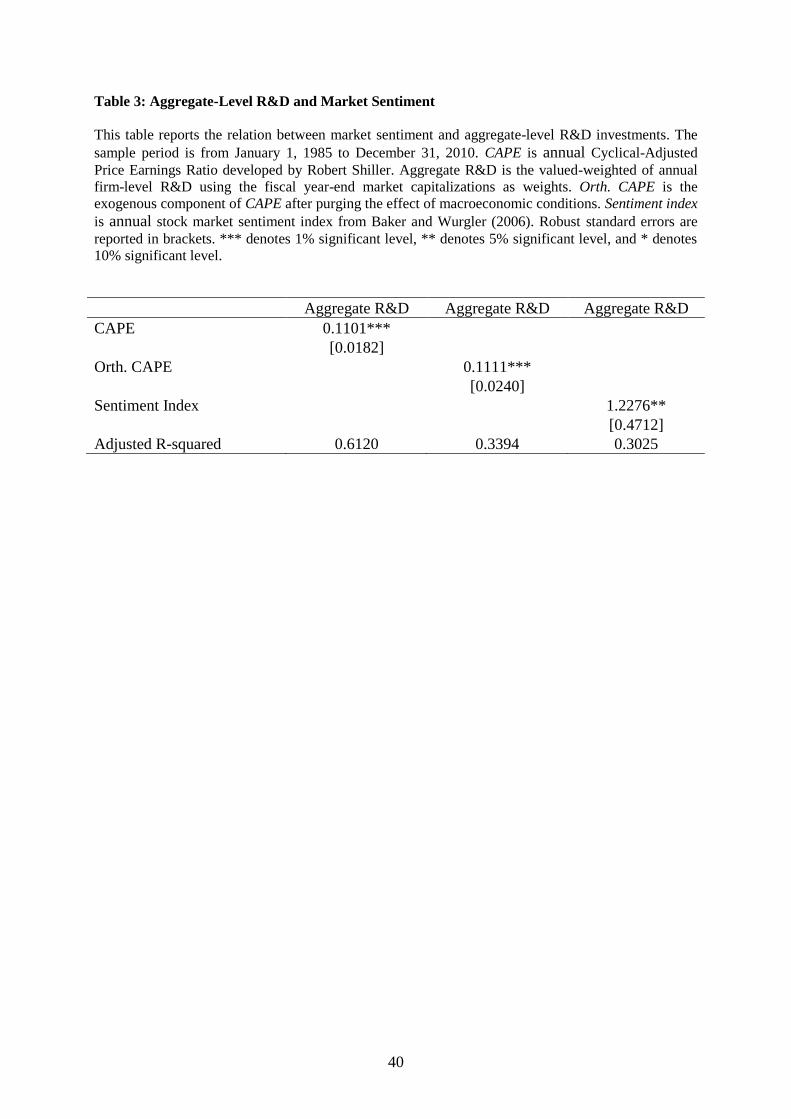
40
Table 3: Aggregate-Level R&D and Market Sentiment
This table reports the relation between market sentiment and aggregate-level R&D investments. The
sample period is from January 1, 1985 to December 31, 2010. CAPE is annual Cyclical-Adjusted
Price Earnings Ratio developed by Robert Shiller. Aggregate R&D is the valued-weighted of annual
firm-level R&D using the fiscal year-end market capitalizations as weights. Orth. CAPE is the
exogenous component of CAPE after purging the effect of macroeconomic conditions. Sentiment index
is annual stock market sentiment index from Baker and Wurgler (2006). Robust standard errors are
reported in brackets. *** denotes 1% significant level, ** denotes 5% significant level, and * denotes
10% significant level.
Aggregate R&D Aggregate R&D Aggregate R&D
CAPE 0.1101***
[0.0182]
Orth. CAPE
0.1111***
[0.0240]
Sentiment Index
1.2276**
[0.4712]
Adjusted R-squared 0.6120 0.3394 0.3025
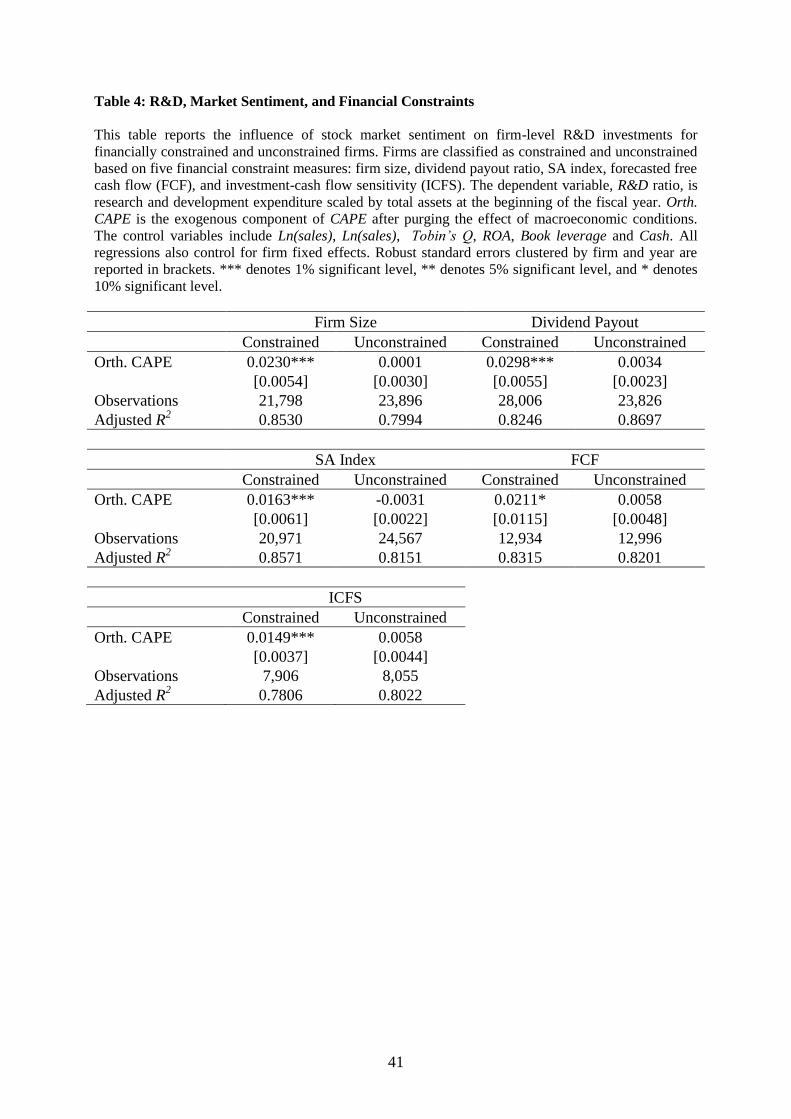
41
Table 4: R&D, Market Sentiment, and Financial Constraints
This table reports the influence of stock market sentiment on firm-level R&D investments for
financially constrained and unconstrained firms. Firms are classified as constrained and unconstrained
based on five financial constraint measures: firm size, dividend payout ratio, SA index, forecasted free
cash flow (FCF), and investment-cash flow sensitivity (ICFS). The dependent variable, R&D ratio, is
research and development expenditure scaled by total assets at the beginning of the fiscal year. Orth.
CAPE is the exogenous component of CAPE after purging the effect of macroeconomic conditions.
The control variables include Ln(sales), Ln(sales), Tobin’s Q, ROA, Book leverage and Cash. All
regressions also control for firm fixed effects. Robust standard errors clustered by firm and year are
reported in brackets. *** denotes 1% significant level, ** denotes 5% significant level, and * denotes
10% significant level.
Firm Size Dividend Payout
Constrained Unconstrained Constrained Unconstrained
Orth. CAPE 0.0230*** 0.0001 0.0298*** 0.0034
[0.0054] [0.0030] [0.0055] [0.0023]
Observations 21,798 23,896 28,006 23,826
Adjusted R2 0.8530 0.7994 0.8246 0.8697
SA Index FCF
Constrained Unconstrained Constrained Unconstrained
Orth. CAPE 0.0163*** -0.0031 0.0211* 0.0058
[0.0061] [0.0022] [0.0115] [0.0048]
Observations 20,971 24,567 12,934 12,996
Adjusted R2 0.8571 0.8151 0.8315 0.8201
ICFS
Constrained Unconstrained
Orth. CAPE 0.0149*** 0.0058
[0.0037] [0.0044]
Observations 7,906 8,055
Adjusted R2 0.7806 0.8022
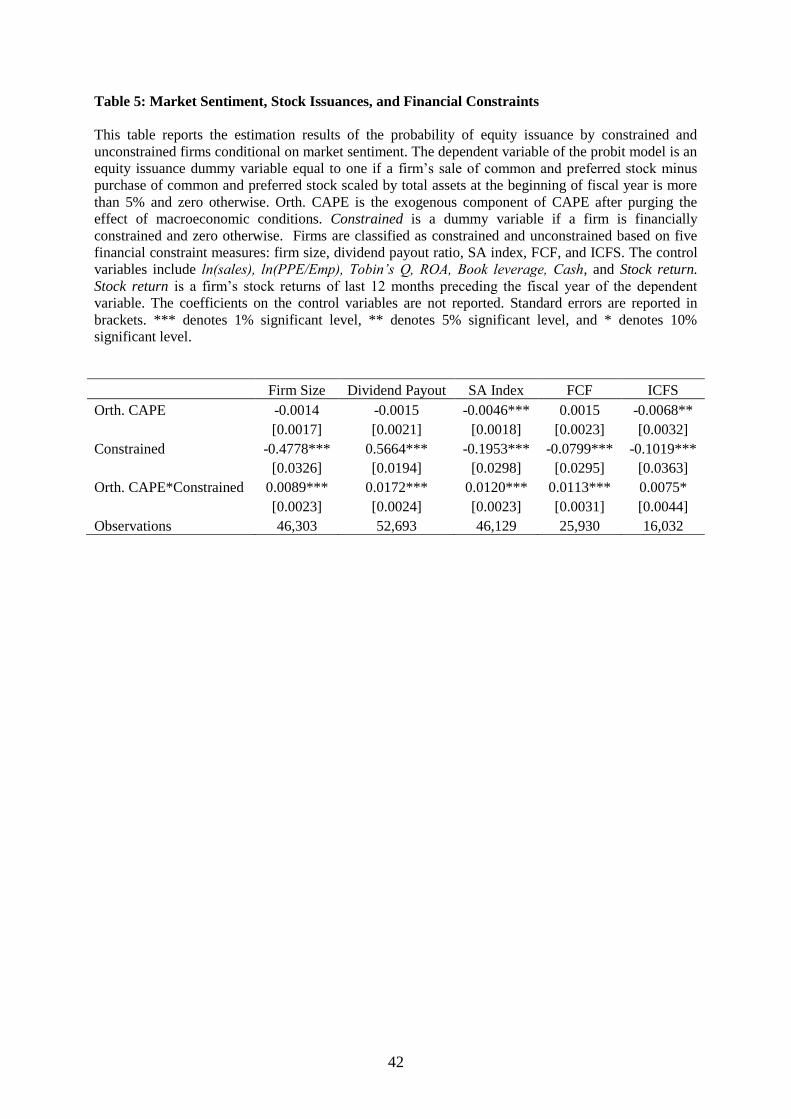
42
Table 5: Market Sentiment, Stock Issuances, and Financial Constraints
This table reports the estimation results of the probability of equity issuance by constrained and
unconstrained firms conditional on market sentiment. The dependent variable of the probit model is an
equity issuance dummy variable equal to one if a firm’s sale of common and preferred stock minus
purchase of common and preferred stock scaled by total assets at the beginning of fiscal year is more
than 5% and zero otherwise. Orth. CAPE is the exogenous component of CAPE after purging the
effect of macroeconomic conditions. Constrained is a dummy variable if a firm is financially
constrained and zero otherwise. Firms are classified as constrained and unconstrained based on five
financial constraint measures: firm size, dividend payout ratio, SA index, FCF, and ICFS. The control
variables include ln(sales), ln(PPE/Emp), Tobin’s Q, ROA, Book leverage, Cash, and Stock return.
Stock return is a firm’s stock returns of last 12 months preceding the fiscal year of the dependent
variable. The coefficients on the control variables are not reported. Standard errors are reported in
brackets. *** denotes 1% significant level, ** denotes 5% significant level, and * denotes 10%
significant level.
Firm Size Dividend Payout SA Index FCF ICFS
Orth. CAPE -0.0014 -0.0015 -0.0046*** 0.0015 -0.0068**
[0.0017] [0.0021] [0.0018] [0.0023] [0.0032]
Constrained -0.4778*** 0.5664*** -0.1953*** -0.0799*** -0.1019***
[0.0326] [0.0194] [0.0298] [0.0295] [0.0363]
Orth. CAPE*Constrained 0.0089*** 0.0172*** 0.0120*** 0.0113*** 0.0075*
[0.0023] [0.0024] [0.0023] [0.0031] [0.0044]
Observations 46,303 52,693 46,129 25,930 16,032
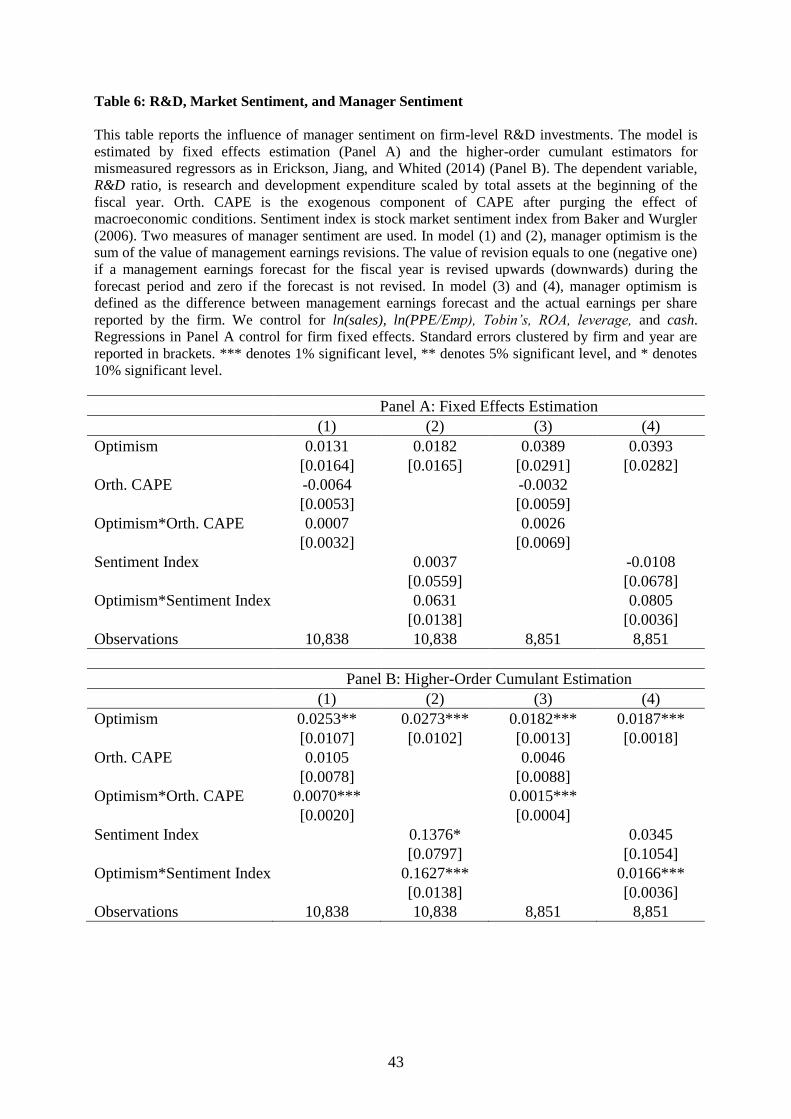
43
Table 6: R&D, Market Sentiment, and Manager Sentiment
This table reports the influence of manager sentiment on firm-level R&D investments. The model is
estimated by fixed effects estimation (Panel A) and the higher-order cumulant estimators for
mismeasured regressors as in Erickson, Jiang, and Whited (2014) (Panel B). The dependent variable,
R&D ratio, is research and development expenditure scaled by total assets at the beginning of the
fiscal year. Orth. CAPE is the exogenous component of CAPE after purging the effect of
macroeconomic conditions. Sentiment index is stock market sentiment index from Baker and Wurgler
(2006). Two measures of manager sentiment are used. In model (1) and (2), manager optimism is the
sum of the value of management earnings revisions. The value of revision equals to one (negative one)
if a management earnings forecast for the fiscal year is revised upwards (downwards) during the
forecast period and zero if the forecast is not revised. In model (3) and (4), manager optimism is
defined as the difference between management earnings forecast and the actual earnings per share
reported by the firm. We control for ln(sales), ln(PPE/Emp), Tobin’s, ROA, leverage, and cash.
Regressions in Panel A control for firm fixed effects. Standard errors clustered by firm and year are
reported in brackets. *** denotes 1% significant level, ** denotes 5% significant level, and * denotes
10% significant level.
Panel A: Fixed Effects Estimation
(1) (2) (3) (4)
Optimism 0.0131 0.0182 0.0389 0.0393
[0.0164] [0.0165] [0.0291] [0.0282]
Orth. CAPE -0.0064
-0.0032
[0.0053]
[0.0059]
Optimism*Orth. CAPE 0.0007
0.0026
[0.0032]
[0.0069]
Sentiment Index
0.0037
-0.0108
[0.0559]
[0.0678]
Optimism*Sentiment Index 0.0631
0.0805
[0.0138]
[0.0036]
Observations 10,838 10,838 8,851 8,851
Panel B: Higher-Order Cumulant Estimation
(1) (2) (3) (4)
Optimism 0.0253** 0.0273*** 0.0182*** 0.0187***
[0.0107] [0.0102] [0.0013] [0.0018]
Orth. CAPE 0.0105
0.0046
[0.0078]
[0.0088]
Optimism*Orth. CAPE 0.0070***
0.0015***
[0.0020]
[0.0004]
Sentiment Index
0.1376*
0.0345
[0.0797]
[0.1054]
Optimism*Sentiment Index 0.1627***
0.0166***
[0.0138]
[0.0036]
Observations 10,838 10,838 8,851 8,851
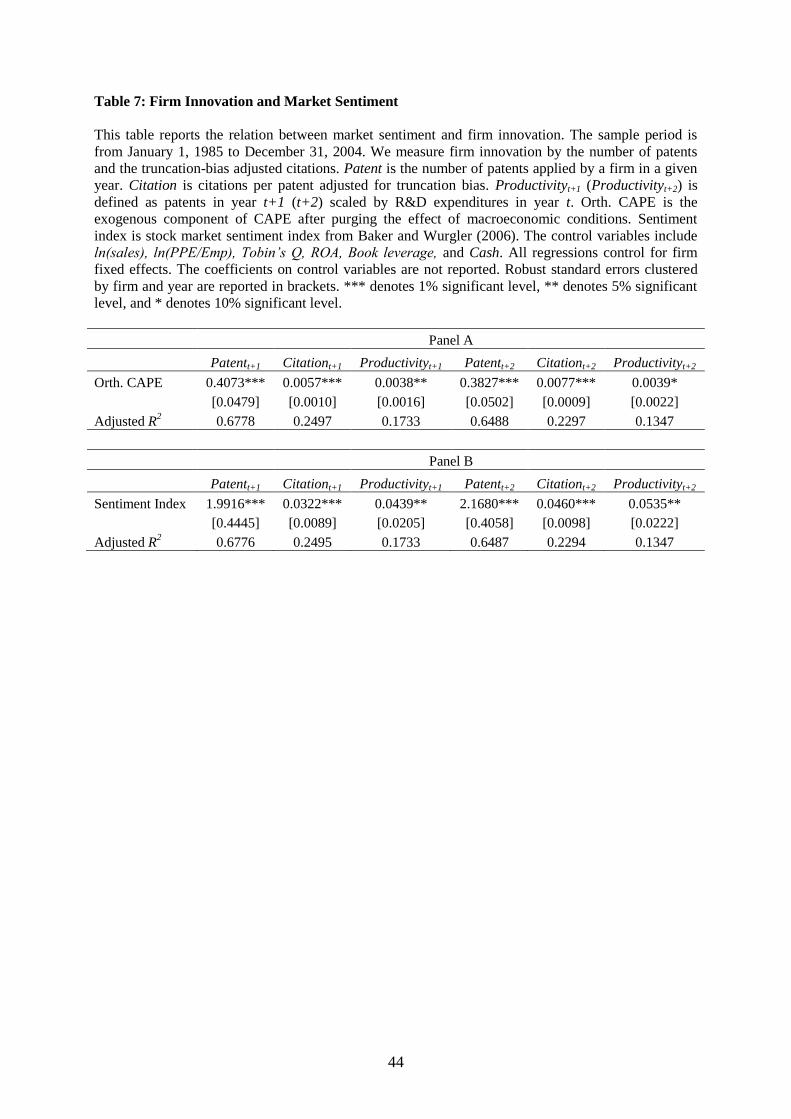
44
Table 7: Firm Innovation and Market Sentiment
This table reports the relation between market sentiment and firm innovation. The sample period is
from January 1, 1985 to December 31, 2004. We measure firm innovation by the number of patents
and the truncation-bias adjusted citations. Patent is the number of patents applied by a firm in a given
year. Citation is citations per patent adjusted for truncation bias. Productivityt+1 (Productivityt+2) is
defined as patents in year t+1 (t+2) scaled by R&D expenditures in year t. Orth. CAPE is the
exogenous component of CAPE after purging the effect of macroeconomic conditions. Sentiment
index is stock market sentiment index from Baker and Wurgler (2006). The control variables include
ln(sales), ln(PPE/Emp), Tobin’s Q, ROA, Book leverage, and Cash. All regressions control for firm
fixed effects. The coefficients on control variables are not reported. Robust standard errors clustered
by firm and year are reported in brackets. *** denotes 1% significant level, ** denotes 5% significant
level, and * denotes 10% significant level.
Panel A
Patentt+1 Citationt+1 Productivityt+1 Patentt+2 Citationt+2 Productivityt+2
Orth. CAPE 0.4073*** 0.0057*** 0.0038** 0.3827*** 0.0077*** 0.0039*
[0.0479] [0.0010] [0.0016] [0.0502] [0.0009] [0.0022]
Adjusted R2 0.6778 0.2497 0.1733 0.6488 0.2297 0.1347
Panel B
Patentt+1 Citationt+1 Productivityt+1 Patentt+2 Citationt+2 Productivityt+2
Sentiment Index 1.9916*** 0.0322*** 0.0439** 2.1680*** 0.0460*** 0.0535**
[0.4445] [0.0089] [0.0205] [0.4058] [0.0098] [0.0222]
Adjusted R2 0.6776 0.2495 0.1733 0.6487 0.2294 0.1347
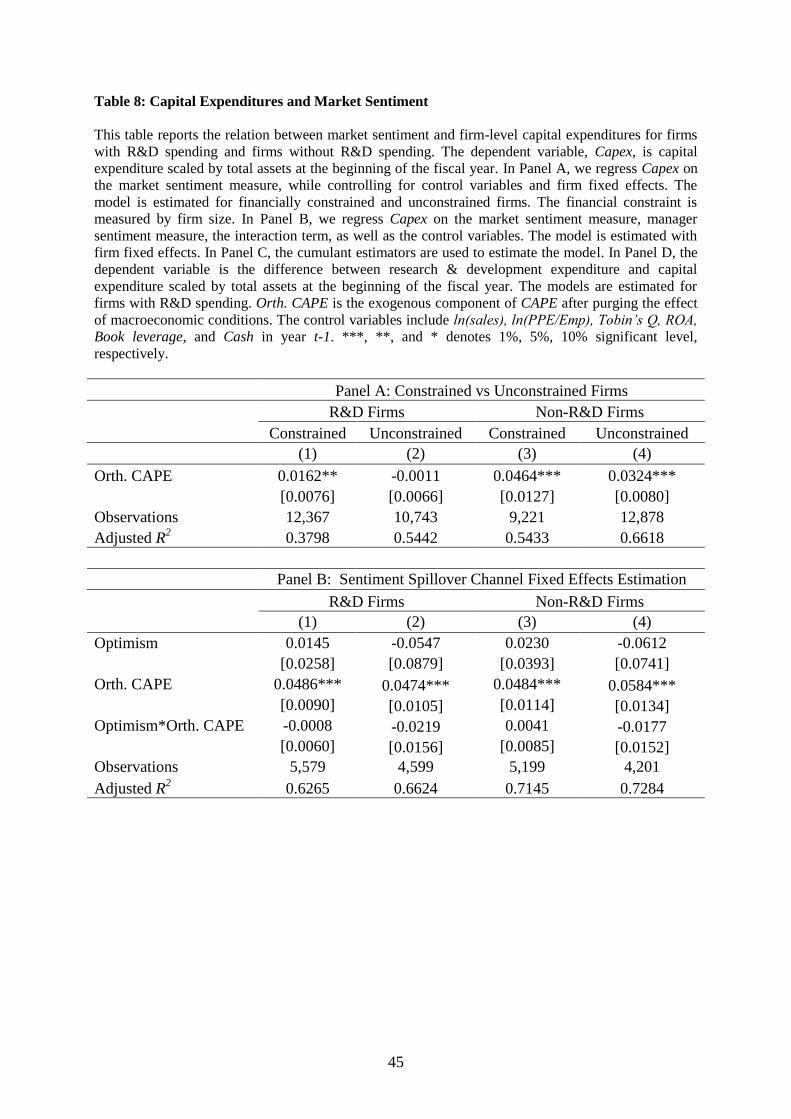
45
Table 8: Capital Expenditures and Market Sentiment
This table reports the relation between market sentiment and firm-level capital expenditures for firms
with R&D spending and firms without R&D spending. The dependent variable, Capex, is capital
expenditure scaled by total assets at the beginning of the fiscal year. In Panel A, we regress Capex on
the market sentiment measure, while controlling for control variables and firm fixed effects. The
model is estimated for financially constrained and unconstrained firms. The financial constraint is
measured by firm size. In Panel B, we regress Capex on the market sentiment measure, manager
sentiment measure, the interaction term, as well as the control variables. The model is estimated with
firm fixed effects. In Panel C, the cumulant estimators are used to estimate the model. In Panel D, the
dependent variable is the difference between research & development expenditure and capital
expenditure scaled by total assets at the beginning of the fiscal year. The models are estimated for
firms with R&D spending. Orth. CAPE is the exogenous component of CAPE after purging the effect
of macroeconomic conditions. The control variables include ln(sales), ln(PPE/Emp), Tobin’s Q, ROA,
Book leverage, and Cash in year t-1. ***, **, and * denotes 1%, 5%, 10% significant level,
respectively.
Panel A: Constrained vs Unconstrained Firms
R&D Firms Non-R&D Firms
Constrained Unconstrained Constrained Unconstrained
(1) (2) (3) (4)
Orth. CAPE 0.0162** -0.0011 0.0464*** 0.0324***
[0.0076] [0.0066] [0.0127] [0.0080]
Observations 12,367 10,743 9,221 12,878
Adjusted R2 0.3798 0.5442 0.5433 0.6618
Panel B: Sentiment Spillover Channel Fixed Effects Estimation
R&D Firms Non-R&D Firms
(1) (2) (3) (4)
Optimism 0.0145 -0.0547 0.0230 -0.0612
[0.0258] [0.0879] [0.0393] [0.0741]
Orth. CAPE 0.0486*** 0.0474*** 0.0484*** 0.0584***
[0.0090] [0.0105] [0.0114] [0.0134]
Optimism*Orth. CAPE -0.0008 -0.0219 0.0041 -0.0177
[0.0060] [0.0156] [0.0085] [0.0152]
Observations 5,579 4,599 5,199 4,201
Adjusted R2 0.6265 0.6624 0.7145 0.7284
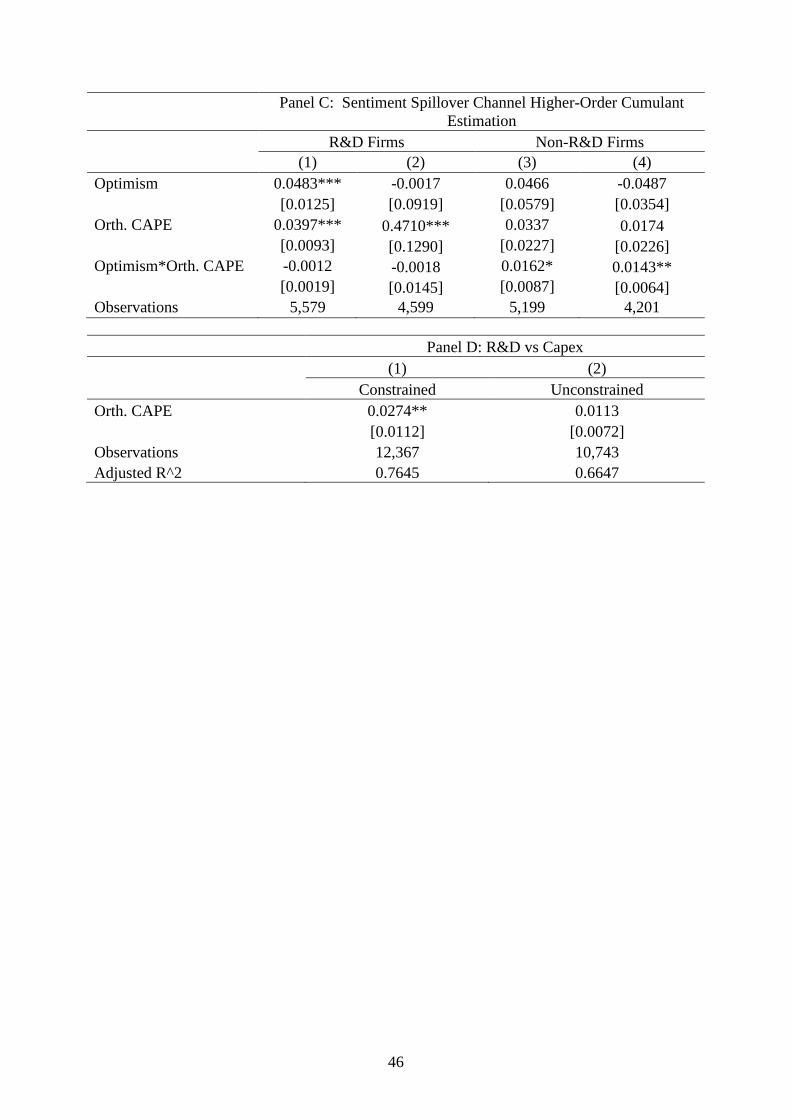
46
Panel C: Sentiment Spillover Channel Higher-Order Cumulant
Estimation
R&D Firms Non-R&D Firms
(1) (2) (3) (4)
Optimism 0.0483*** -0.0017 0.0466 -0.0487
[0.0125] [0.0919] [0.0579] [0.0354]
Orth. CAPE 0.0397*** 0.4710*** 0.0337 0.0174
[0.0093] [0.1290] [0.0227] [0.0226]
Optimism*Orth. CAPE -0.0012 -0.0018 0.0162* 0.0143**
[0.0019] [0.0145] [0.0087] [0.0064]
Observations 5,579 4,599 5,199 4,201
Panel D: R&D vs Capex
(1) (2)
Constrained Unconstrained
Orth. CAPE 0.0274** 0.0113
[0.0112] [0.0072]
Observations 12,367 10,743
Adjusted R^2 0.7645 0.6647
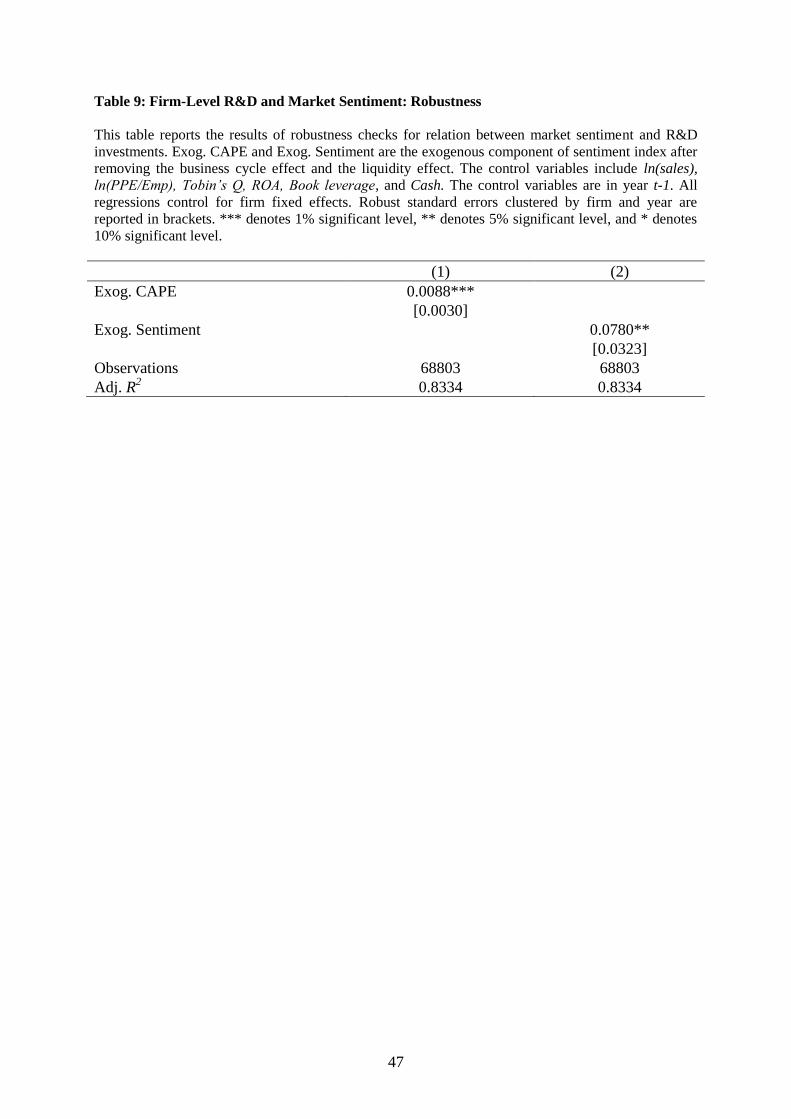
47
Table 9: Firm-Level R&D and Market Sentiment: Robustness
This table reports the results of robustness checks for relation between market sentiment and R&D
investments. Exog. CAPE and Exog. Sentiment are the exogenous component of sentiment index after
removing the business cycle effect and the liquidity effect. The control variables include ln(sales),
ln(PPE/Emp), Tobin’s Q, ROA, Book leverage, and Cash. The control variables are in year t-1. All
regressions control for firm fixed effects. Robust standard errors clustered by firm and year are
reported in brackets. *** denotes 1% significant level, ** denotes 5% significant level, and * denotes
10% significant level.
(1) (2)
Exog. CAPE 0.0088***
[0.0030]
Exog. Sentiment
0.0780**
[0.0323]
Observations 68803 68803
Adj. R2 0.8334 0.8334
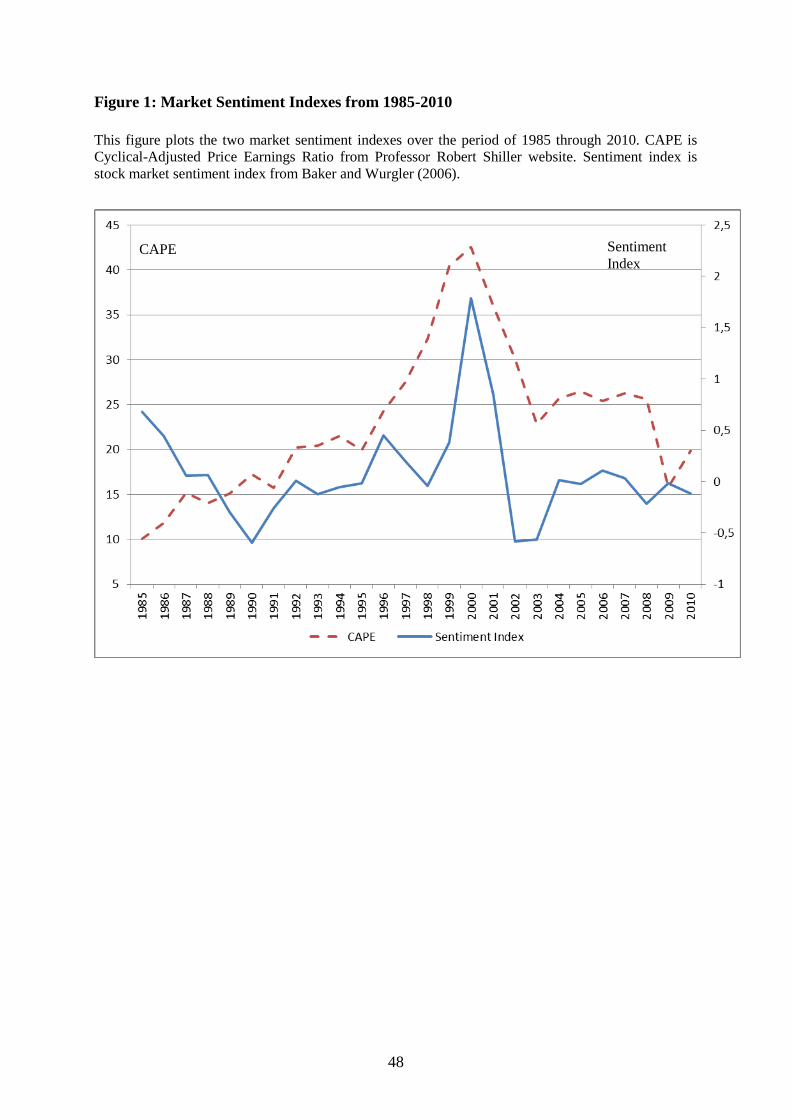
48
Figure 1: Market Sentiment Indexes from 1985-2010
This figure plots the two market sentiment indexes over the period of 1985 through 2010. CAPE is
Cyclical-Adjusted Price Earnings Ratio from Professor Robert Shiller website. Sentiment index is
stock market sentiment index from Baker and Wurgler (2006).
CAPE Sentiment
Index