Embed Size (px)
Citation preview
RETAILHAMPTON ROADS
R E A L E S TAT E M A R K E T R E V I E W2014
2014 RE
TAIL
13
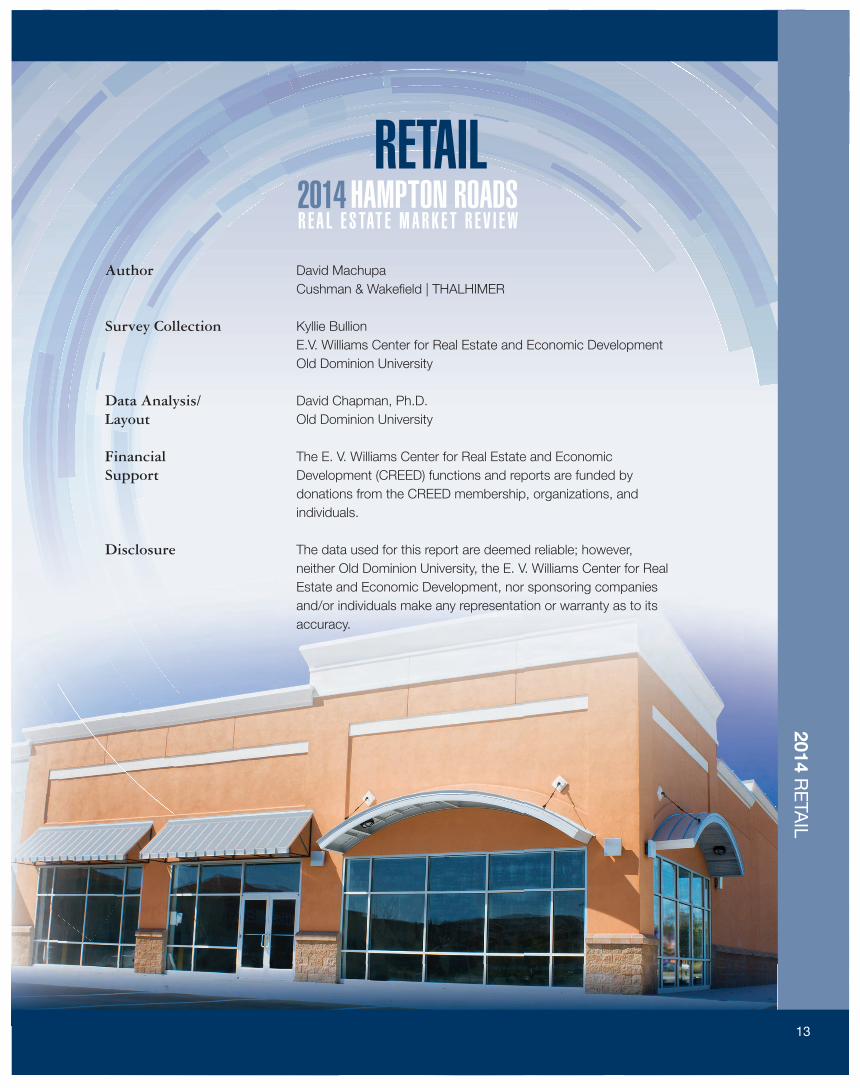
Author David Machupa Cushman & Wakefi eld | THALHIMER
Survey Collection Kyllie Bullion E.V. Williams Center for Real Estate and Economic Development Old Dominion University
Data Analysis/ David Chapman, Ph.D.Layout Old Dominion University
Financial The E. V. Williams Center for Real Estate and EconomicSupport Development (CREED) functions and reports are funded by donations from the CREED membership, organizations, and individuals.
Disclosure The data used for this report are deemed reliable; however, neither Old Dominion University, the E. V. Williams Center for Real Estate and Economic Development, nor sponsoring companies and/or individuals make any representation or warranty as to its accuracy.

14 2014 Hampton Roads Real Estate Market Review
2 0 1 4 R E TA I L
General Overview
his report analyzes the 2013 retail real estate conditions within the Virginia Beach-Norfolk-New-port News, Virginia Metropolitan Statistical Area (MSA) which is commonly referred to as
Hampton Roads. The report examines supply, vacancy, construction, absorption, and rent data to provide a comparison of data for the specifi c submarkets and product types located within the Southside and Peninsula regions of the Hampton Roads MSA. Southside properties surveyed for the purpose of this report included those located in the cities of Chesapeake, Norfolk, Portsmouth, Smithfi eld, Suffolk and Virginia Beach. Peninsula properties surveyed are located in the cities of Gloucester, Hampton, Newport News, Poquoson, Williamsburg, and York County.
This survey is recognized as the most comprehensive analysis of retail real estate trends in the HamptonRoads MSA. The report includes information on all retail property types including regional malls,freestanding buildings and strip centers of various classifi cations. The scope of the report also includesa summary of new retail construction activity, an analysis of absorption, and a review of selected retailinvestment sales that have occurred in the region in 2013.
This survey gathered information about strip shopping centers and regional malls located in the Hampton Roads MSA that were generally 30,000 square feet in size or larger. Additionally, information on retail-oriented freestanding buildings at least 23,000 square feet and freestanding buildings that contained furniture stores, discounters, grocery stores or category killer retailers that met the established size criteria were included in the survey.
Automotive uses and buildings containing “downtown storefronts” were not included. Although available retail space in many submarkets (e.g. Ghent) is best described as a collection of small specialty shops, storefronts or freestanding buildings, practical limitations dictated that the focus of the survey be on larger product types.
The survey data was collected between October 2013 and January 2014. Questionnaires were mailed to owners, leasing agents and property managers responsible for retail properties meeting the selection criteria. Direct contact was utilized as a follow-up to the mailing to encourage participation. Information on square footage for freestanding buildings was obtained from building owners, tax records, store managers and retail real estate representatives. Sales information was obtained from property owners, real estate agents, appraisers and real estate assessors.
General Overview
METHODOLOGY

2014 RE
TAIL
15
Regional Mall Node: Submarket anchored by regional mall.
Small Shop: In-line retail space usually less than 10,000 square feet located in a multi-tenanted shopping center.
Submarkets: Hampton Roads is divided into 35 retail submarkets (25 Southside submarkets and 10 Peninsula submarkets) which refl ected general concentrations, pockets or corridors of retail product type. Geographical boundaries of the retail submarkets were infl uenced by density of existing retail product, physical or geographical obstacles, existing transportation networks, municipal boundaries, population concentrations and retailers’ per-ceptions of the MSA. Final determination of specifi c boundaries of each submarket was made by a subcommittee of retail real estate professionals who are actively involved in the MSA. Also highlighted were specifi c submarkets that are anchored by regional malls. A map which identifi es the general location of each submarket is included in the centerfold of this report.
Triple Net Lease: Type of lease under which a tenant pays its pro-rata share of real estate taxes, insurance and common area maintenance.
Neighborhood Center 30,000 to 150,000 square feet; supermarket anchored
Community Center 100,000 to 350,000 square feet; discount department store, supermarket or drug store anchored
Fashion/Specialty Center 80,000 to 250,000 square feet; fashion anchored
Power Center 250,000 to 600,000 square feet; category killer, home improvement and discount department store anchored
Theme Festival Center 80,000 to 250,000 square feet; restaurants, entertainment anchored
Outlet Center 50,000 to 400,000 square feet; manufacturer’s outlet store anchored
Freestanding Individual building not considered a shopping center
Mall Shopping center with area designed for pedestrian use only
Other Any center that does not fi t into a typical category
Asking Rates: The market rate per square foot of a retail property (excluding freestanding buildings and malls), exclusive of additional rents that may be paid under a triple net lease. Interpretation of average retail rates in different product types and submarkets should be viewed cautiously given the tremendous variability in rates for like products and for properties located within the same submarket. Factors such as visibility, co-tenancy, and accessibility, are some of the many sources of variation in market rates which should be considered.
Big Boxes: Contiguous retail space that is at least 23,000 square feet and located in any one of the identifi ed product types. Retailers occupying big boxes include, but are not limited to, the following: category killers, specialty stores, discounters, furniture stores, grocery stores and theaters. Bowling alleys, automotive uses, roller rinks and ice-skating rinks were not included.
CAM: Common Area Maintenance.
Product Types: Properties were classifi ed according to one of the following nine retail product types. The International Council of Shopping Centers defi ned the fi rst six categories. Three additional categories were included to accurately categorize the remaining properties.
D E F I N I T I O N S O F T E R M S

16 2014 Hampton Roads Real Estate Market Review
2 0 1 4 R E TA I L
The Hampton Roads market appears to have stabilized. 2013 saw the re-emergence of grocery stores to the market as Walmart and Kroger continued to expand their presence. On a national level, the retail market remained stable and, as such, remained stable here in Hampton Roads. 2013 did not bring a mass exodus of retailers;however, a few large box brands did limp into 2014 and we expect a thinning of the herd as these retailers attempt to remain viable. The fi nancing market is stable with lenders actively seeking opportunities. A disconnect remains on product valuation between buyers, sellers and lenders of retail centers and, as such, we did not see a great deal of investment sales in Hampton Roads this past year.
2013 brought increased activity from grocery stores. Kroger, Walmart Neighborhood Market, and Harris Teeter were very active. Harris Teeter was purchased by Kroger and we will pause to see how this will curtail expansion by both retailers. Walmart opened on Jefferson Avenue and is under construction in the Pembroke area of Virginia Beach with a Super Center. Five of the smaller Neighborhood Market concepts are under construction in Hampton Roads. Harris Teeter will open in the Red Mill area of Virginia Beach and in the Wards Corner area of Norfolk. Kroger opened its 124,000 square foot Marketplace concept on Holland Road in Virginia Beach and is under construction with two more in Portsmouth and Northern Suffolk respectively. Additionally, Whole Foods has an-nounced they will anchor Tech Center at Oyster Point in Newport News and The Fresh Market will open in the Ghent section of Norfolk. Dave and Buster’s opened at Lynnhaven Mall and West Marine opened in Loehman’s Plaza in Virginia Beach. Starbucks opened a drive thru only location in Virginia Beach; this was the fi rst in Virginia and only the seventh in the country. CVS and 7-11 both continued aggressive expansion within the market. Simon Properties has Lake Wright under contract and is working to bring an outlet mall to the Norfolk site. We saw two small redevelopment projects along Lynnhaven Parkway near the mall with Noodles, Five Guys and Mattress Firm anchoring those developments. Lynnhaven Convenience, a mostly vacant property along Virginia Beach Boulevard anchored by Farm Fresh, is being redeveloped. Farm Fresh closed and has been replaced by Walmart Neighborhood Market, One Life Fitness, and Hobby Lobby. Bahama Breeze and Old Navy opened at the entrance of Pembroke Mall. Settler’s Market in Williamsburg came full circle. After starting off slowly, going through foreclosure, and sitting partially constructed, the new ownership was able to re-energize the project and Home Goods, Stein Mart, Michaels, Ulta, Shoe Carnival and 5 Below opened in March occupying roughly 200,000 sf of a 250,000 sf project.
There is concern for certain retailers as they continue to struggle on a national level. K-Mart and Sears are closing stores on both a local and national level. K-mart closed the Chesapeake Square and Tidewater Drive locations with many more being offered for lease with or without K-Mart. J.C. Penney’s announced the closing of the Military Highway location, while Ruby Tuesday shuttered thirty stores across the country and one here in Virginia Beach. Blockbuster fi nally threw in the towel and closed the last of its stores across the country, Radio Shack is closing 500 stores, Best Buy tried to go private, but could not obtain fi nancing and Barnes and Noble placed themselves for sale, but did not fi nd any suitors. The retail landscape is constantly changing and those tenants that do not change with it will be closing their doors.
Hampton Roads is stable, new tenants are looking for locations within the market, and we are seeing new development. We do expect the vacancy rate to increase because of the amount of big box space that will come to the market, but we also expect rental rates to increases as quality retail product is limited at this time.
YEAR IN REVIEW 2013

2014 RE
TAIL
17
HAMPTON ROADS MARKET SURVEY
The Hampton Roads retail market contained approximately 54,222,598 square feet of gross leasable area (“GLA”) in 422 properties with anaverage asking rental rate of $15.97 with triple net charges (Common Area Maintenance, Real Estate Taxes and Insurance) running $2.87 per square foot. The US Census Bureau indicates the population of Hampton Roads is approximately 1.7 Million resulting in a 31.90 square feet of retail supply per person. Certain methodological differences (e.g., the inclusion of freestanding buildings and malls in this survey) make it diffi cult to compare per capita supply in the MSA to a national average statistic.
Hampton Roads consist of two markets, the Southside and Peninsula. The Southside market has approximately 35,835,277 square feet, roughly 66% of the total square footage in the market, in 288 properties. The average asking rent for small shop space increased $.20 over 2012 numbers to $16.56 triple net. The increase in rental rates can be attributed to consistent demand as vacancy rates remained low at 6.74% in 2013. While 89,200 square feet of new construction came on line in 2013, Hampton Roads has signifi cant amounts of new construction in the pipeline for 2014.
The Peninsula also experienced some mixed change this past year. The 134 properties on the Peninsula that were surveyed combined for 18,387,321 square feet of product. The average asking price of small shop space was $14.61 per square foot with $2.69 in triple net charges. The vacancy rate for the greater Peninsula was 11.55%; however, activity and interest in the Peninsula market is strong in the fi rst quarter of 2014. The Williamsburg submarket rebounded as new ownerships were able to reposition previously faltering projects.
In 2013, the Hampton Roads market did see a slight increase in the vacancy rate as 2012’s overall 7.85% vacancy rate gave way to 2013’s 8.37%. This increase is largely due to more Big Box space coming onto the market. While landlords and tenants continue to get creative in the deal making process and retailers are repositioning themselves within the market creating new developments, as well as second generation opportunities, local tenants are not as abundant as in years past. Landlords are approaching these second generation spaces with both traditional and non-traditional retailers to back fi ll the space. Unlike years past, the market was not saturated with retail product due to mass store closings; however, we expect a fair amount of big box retail space to enter in 2014. Specifi cally, K-mart and Sears present large blocks that may enter the market.
We move forward acknowledging 2014 is off to a strong start. We will see the size of the overall market increase due to grocery store expansion as multiple new centers are currently under construction and will be opening this year. We will approach the older second generation space for re-use and redevelopment. It should be noted some of the larger vacant space highest and best use may no longer be retail. These spaces will continue to negatively impact the overall Hampton Roads numbers until such time as they are redeveloped.

18 2014 Hampton Roads Real Estate Market Review
2 0 1 4 R E TA I L
Market Overview Table
Southside 288 35,835,277 2,416,346 6.74% 89,200 33,418,931 701,392 Peninsula 134 18,387,321 2,123,718 11.55% 21,411 16,263,603 (280,018)Total 422 54,222,598 4,540,064 8.37% 110,611 49,682,534 421,374 Southside 286 34,924,153 2,206,614 6.32% 57,442 32,717,539 1,896,773 Peninsula 138 18,532,649 1,989,028 10.73% 6,576 16,543,621 775,368 Total 424 53,456,802 4,195,642 7.85% 64,018 49,261,160 2,672,141 Southside 279 34,150,108 2,534,765 7.42% 103,380 31,615,343 794,577Peninsula 138 18,494,461 1,944,109 10.51% 999,389 16,550,352 782,099Total 417 52,644,569 4,478,874 8.51% 1,102,769 48,165,695 1,576,676Southside 274 34,019,555 2,523,754 7.42% 18,880 31,495,801 675,035Peninsula 138 18,548,407 2,175,793 11.73% - 16,372,614 604,361Total 412 52,567,962 4,699,547 8.94% 18,880 47,868,415 1,279,396Southside 273 33,535,280 2,714,514 8.09% 302,352 30,820,766 (288,440)Peninsula 136 18,160,963 2,392,710 13.18% 981,463 15,768,253 362,777Total 409 51,696,243 5,107,224 9.88% 1,283,815 46,589,019 74,337Southside 265 33,265,028 2,155,822 6.48% 275,252 31,109,206 238,525Peninsula 133 17,112,012 1,706,536 9.97% - 15,405,476 (109,898)Total 398 50,377,040 3,862,358 7.67% 275,252 46,514,682 128,627Southside 263 33,086,160 2,215,479 6.70% 1,038,291 30,870,681 339,596Peninsula 133 17,133,079 1,617,705 9.44% 1,009,000 15,515,374 100,485Total 396 50,219,239 3,833,184 7.63% 2,047,291 46,386,055 440,081Southside 259 32,407,761 1,876,676 5.79% 1,552,392 30,531,085 1,741,962Peninsula 131 16,895,155 1,480,266 8.76% 1,042,451 15,414,889 576,788Total 390 49,302,916 3,356,942 6.81% 2,594,843 45,945,974 2,318,750Southside 246 30,852,210 2,063,087 6.69% 593,520 28,789,123 1,280,869Peninsula 129 16,337,458 1,499,357 9.18% 618,179 14,838,101 687,097Total 375 47,189,668 3,562,444 7.55% 1,211,699 43,627,224 1,967,966Southside 243 30,184,395 2,676,141 8.87% 271,610 27,508,254 341,736Peninsula 125 15,799,778 1,648,774 10.44% 185,000 14,151,004 496,338Total 368 45,984,173 4,324,915 9.41% 456,610 41,659,258 838,074Southside 243 30,336,266 3,169,748 10.45% 419,458 27,166,518 419,138Peninsula 127 16,094,161 2,027,477 12.60% 330,000 14,066,684 412,018Total 370 46,430,427 5,197,225 11.19% 749,458 41,233,202 831,156Southside 245 30,180,691 3,433,311 11.38% 574,400 26,747,380 535,167Peninsula 126 15,546,085 1,891,419 12.17% 676,000 13,654,666 932,008Total 371 45,726,776 5,324,730 11.64% 1,250,400 40,402,046 1,467,175Southside 239 29,760,443 3,548,230 11.92% 828,800 26,212,213 1,185,818Peninsula 123 14,906,530 2,183,872 14.65% 202,750 12,722,658 242,563Total 362 44,666,973 5,732,102 12.83% 1,031,550 38,934,871 1,428,381Southside 230 29,436,515 3,760,087 12.77% 918,100 25,676,428 (158,181)Peninsula 121 14,477,970 1,997,875 13.80% 212,229 12,480,095 147,115Total 351 43,914,485 5,757,962 13.11% 1,130,329 38,156,523 (11,066)Southside 220 28,816,383 2,933,294 10.18% 2,064,727 25,883,089 1,344,209Peninsula 118 15,249,617 2,012,637 13.20% 758,370 13,236,980 292,785Total 338 44,066,000 4,945,931 11.22% 2,823,097 39,120,069 1,636,994Southside 208 27,089,939 2,551,059 9.42% 1,414,805 24,538,880 1,961,927Peninsula 112 14,548,482 1,604,287 11.03% 1,253,342 12,944,195 1,592,805Total 320 41,638,421 4,155,346 9.98% 2,668,147 37,483,075 3,554,732
2014
2013
2012
2011
2010
2009
2008
2007
2006
2005
2004
2003
2002
2001
2000
1999
New Construction in
SFNumber of Properties GLA in SF Vacant SF % Vacant
Occupiedin SF
Absorption in SF
2014 RE
TAIL
19
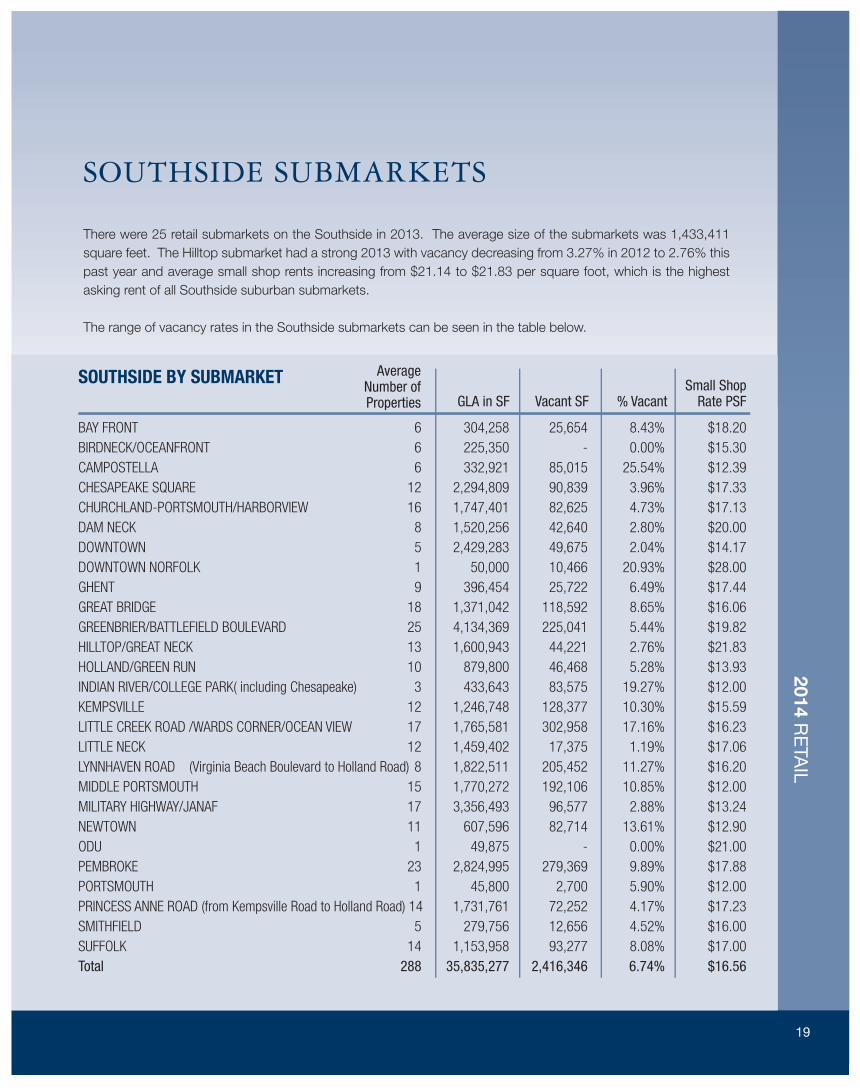
SOUTHSIDE SUBMARKETS
There were 25 retail submarkets on the Southside in 2013. The average size of the submarkets was 1,433,411 square feet. The Hilltop submarket had a strong 2013 with vacancy decreasing from 3.27% in 2012 to 2.76% this past year and average small shop rents increasing from $21.14 to $21.83 per square foot, which is the highest asking rent of all Southside suburban submarkets.
The range of vacancy rates in the Southside submarkets can be seen in the table below.
SOUTHSIDE BY SUBMARKET
BAY FRONT 6 304,258 25,654 8.43% $18.20 BIRDNECK/OCEANFRONT 6 225,350 - 0.00% $15.30 CAMPOSTELLA 6 332,921 85,015 25.54% $12.39 CHESAPEAKE SQUARE 12 2,294,809 90,839 3.96% $17.33 CHURCHLAND-PORTSMOUTH/HARBORVIEW 16 1,747,401 82,625 4.73% $17.13 DAM NECK 8 1,520,256 42,640 2.80% $20.00 DOWNTOWN 5 2,429,283 49,675 2.04% $14.17 DOWNTOWN NORFOLK 1 50,000 10,466 20.93% $28.00 GHENT 9 396,454 25,722 6.49% $17.44 GREAT BRIDGE 18 1,371,042 118,592 8.65% $16.06 GREENBRIER/BATTLEFIELD BOULEVARD 25 4,134,369 225,041 5.44% $19.82 HILLTOP/GREAT NECK 13 1,600,943 44,221 2.76% $21.83 HOLLAND/GREEN RUN 10 879,800 46,468 5.28% $13.93 INDIAN RIVER/COLLEGE PARK( including Chesapeake) 3 433,643 83,575 19.27% $12.00 KEMPSVILLE 12 1,246,748 128,377 10.30% $15.59 LITTLE CREEK ROAD /WARDS CORNER/OCEAN VIEW 17 1,765,581 302,958 17.16% $16.23 LITTLE NECK 12 1,459,402 17,375 1.19% $17.06 LYNNHAVEN ROAD (Virginia Beach Boulevard to Holland Road) 8 1,822,511 205,452 11.27% $16.20 MIDDLE PORTSMOUTH 15 1,770,272 192,106 10.85% $12.00 MILITARY HIGHWAY/JANAF 17 3,356,493 96,577 2.88% $13.24 NEWTOWN 11 607,596 82,714 13.61% $12.90 ODU 1 49,875 - 0.00% $21.00 PEMBROKE 23 2,824,995 279,369 9.89% $17.88 PORTSMOUTH 1 45,800 2,700 5.90% $12.00 PRINCESS ANNE ROAD (from Kempsville Road to Holland Road) 14 1,731,761 72,252 4.17% $17.23 SMITHFIELD 5 279,756 12,656 4.52% $16.00 SUFFOLK 14 1,153,958 93,277 8.08% $17.00 Total 288 35,835,277 2,416,346 6.74% $16.56
Small Shop Rate PSF% VacantVacant SFGLA in SF
Average Number of Properties

20 2014 Hampton Roads Real Estate Market Review
2 0 1 4 R E TA I L
COLISEUM CENTRAL 16 4,051,110 496,819 12.26% $15.40
DENBIGH 15 1,785,033 451,642 25.30% $11.25
FOXHILL/BUCKROE/EAST MERCURY 7 708,425 91,796 12.96% $13.17
GLOUCESTER 8 894,676 68,664 7.67% $14.38
HAMPTON MISC 1 64,327 10,910 16.96% $10.00
NEWMARKET/MAIN (TO INCLUDE HAMPTON) 12 974,957 198,407 20.35% $9.48
NEWPORT NEWS 1 21,240 1,400 6.59% $14.00
PATRICK HENRY/OYSTER POINT/KILN CREEK 30 4,200,077 157,415 3.75% $16.31
POQUOSON 2 108,521 5,250 4.84% $13.50
WILLIAMSBURG 30 4,745,579 570,487 12.02% $18.64
YORK COUNTY 12 833,376 70,928 8.51% $14.41
Total 134 18,387,321 2,123,718 11.55% $14.61
PENINSULA BY SUBMARKET Average Small Shop
Rate PSF% VacantVacant SFGLA in SFNumber of properties
PENINSULA SUBMARKETS
RETAIL PRODUCT TYPE
There were 10 retail submarkets on the Peninsula with an average size of 1,671,574 square feet. The two largest Peninsula submarkets are now Patrick Henry and Williamsburg. The Patrick Henry submarket is anchored by a regional mall and has the lowest vacancy rate on the Peninsula.
The Patrick Henry submarket continues to be one of the most highly desired submarkets in Hampton Roads having 4,374,256 square feet and a vacancy rate of just 3.75%. The Williamsburg market continues to have good retail activity along the Monticello corridor.
The Neighborhood Center remains the predominant product type with 173 properties with over 12 million square feet of GLA. The Community Centers comprised almost 10 million square feet with both product types showing a decrease in vacancy rate and an increase in rental rate. We do anticipate new Neighborhood Centers in 2014 and expect they will contain less small shop space than traditionally developed.

2014 RE
TAIL
21
Total Retail Product By Type
Neighborhood Center 173 12,448,491 36,000 1,473,678 11.84% $14.95 $2.71 Community Center 56 9,442,322 26,800 1,097,952 11.63% $15.62 $2.41 Fashion/Specialty Center 10 1,551,243 26,400 134,993 8.70% $24.89 $4.03 Power Center 31 10,851,642 - 786,746 7.25% $19.67 $3.58 Theme Festival Center 1 100,000 - - No data No data No data Outlet Center 1 349,927 - - No data No data No data Other 57 2,177,439 - 235,642 10.82% $16.19 $3.02 Freestanding 82 8,482,893 21,411 358,318 4.22% $14.87 $3.31 Mall 11 8,818,641 - 452,735 5.13% $20.50 $17.75 Total 422 54,222,598 110,611 4,540,064 8.37% $15.97 $2.87
Average Small Shop
Rate PSFAverage
CAM PSF% VacantVacant SF
NewConstruction
in SFGLA in SFNumber of Properties
Southside By Type
Neighborhood Center 125 9,150,514 36,000 1,084,314 11.85% $15.50 $2.73 Community Center 36 5,721,904 26,800 491,022 8.58% $16.17 $2.41 Fashion/Specialty Center 8 1,068,243 26,400 80,026 7.49% $24.75 $4.03 Power Center 21 6,616,525 - 271,371 4.10% $19.53 $3.58 Theme Festival Center 1 100,000 - - No data No data No dataOutlet Center - - - - No data No data No dataOther 40 1,433,737 - 121,324 8.46% $16.59 $3.03 Freestanding 49 4,994,709 - 35,225 0.71% $17.12 $3.31 Mall 8 6,749,645 - 333,064 4.93% $20.50 $18.86Total 288 35,835,277 89,200 2,416,346 6.74% $16.56 $2.95
Average Small Shop
Rate PSFAverage
CAM PSF% VacantVacant SF
NewConstruction
in SFGLA in SFNumber of Properties
Peninsula By Type
Neighborhood Center 48 3,297,977 - 389,364 11.81% $13.54 $2.33 Community Center 20 3,720,418 - 606,930 16.31% $14.68 $2.54 Fashion/Specialty Center 2 483,000 - 54,967 11.38% $26.00 $5.40 Power Center 10 4,235,117 - 515,375 12.17% $19.95 $3.00 Theme Festival Center - - - - No data No data No data Outlet Center 1 349,927 - - No data No data No data Other 17 743,702 - 114,318 15.37% $15.32 $2.53 Freestanding 33 3,488,184 21,411 323,093 9.26% $10.00 $2.50 Mall 3 2,068,996 - 119,671 5.78% #DIV/0! $17.75 Total 134 18,387,321 21,411 2,123,718 11.55% $14.61 $2.69
Average Small Shop
Rate PSFAverage
CAM PSF% VacantVacant SF
NewConstruction
in SFGLA in SFNumber of Properties

22 2014 Hampton Roads Real Estate Market Review
2 0 1 4 R E TA I L
BIG BOX VACANCYBig box vacancy increased in 2013 and is expected to climb again in 2014. The thought being several big box retailers limped into 2014. Additionally, a few small shop retailers are struggling as well. We will see tenants right size their units as they modify their footprints to stay current to what the market dictates. The boxes that we believe will bring the most product to market are K-Mart, Sears, and J.C. Penney. The 1,825,202 square feet of vacant space represents 40% of the total retail vacancy in the market. It is important to note some of the vacant boxes are now functionally or practically obsolete for today’s retailer. They will remain on the report as retail product until such time as they are demolished, converted to a non-retail use, or redeveloped.
Big Box Vacancy
Big Box Vacancy
Southside2000 2001 2002 2003 2004 2005 2006 2007 2008 2009 2010 2011 2012 20132,073,115 2,207,416 2,220,935 1,906,391 1,513,523 1,142,319 957,887 948,288 907,688 1,102,093 880,568 855,979 821,993 929,713
Peninsula2000 2001 2002 2003 2004 2005 2006 2007 2008 2009 2010 2011 2012 2013 1,328,841 1,435,489 1,407,021 1,556,029 1,141,207 982,263 819,163 827,360 880,805 989,305 837,025 794,484 767,637 895,489
TOTAL2000 2001 2002 2003 2004 2005 2006 2007 2008 2009 2010 2011 2012 2013 3,401,956 3,642,905 3,627,956 3,462,420 2,654,730 2,124,582 1,777,050 1,775,648 1,788,493 2,091,398 1,717,593 1,650,463 1,589,630 1,825,202
4,000,000
3,500,000
3,000,000
2,500,000
2,000,000
1,500,000
1,000,000
500,000
01999 2000 2001 2002 2003 2004 2005 2006 2007 2008 2009 2010 2011 2012 2013
Vaca
nt S
quar
e Fe
et
SouthsidePeninsulaTOTAL

1 Bayfront2 Birdneck/Oceanfront3 Campostella4 Chesapeake Square5 Churchland/Harbourview6 Dam Neck7 Downtown Norfolk8 Ghent9 Great Bridge10 Greenbrier/Battlefi eld Boulevard
11 Hilltop/Great Neck12 Holland/Green Run13 Indian River/College Park14 Kempsville15 Little Creek Road/ Wards Corner16 Little Neck17 Lynnhaven18 Middle Portsmouth19 Military Highway/Janaf20 Newtown
21 ODU 22 Pembroke23 Princess Anne24 Smithfi eld25 Suffolk
Retail SubmarketsSouthside
26 Coliseum Central27 Denbigh28 Foxhill/Buckroe29 Gloucester30 Hampton Miscellaneous31 Patrick Henry32 Poquoson33 Newmarket/Main34 Williamsburg35 York County
Peninsula
2014 RE
TAIL
23

24
The following is a list of theproperties included in this year’s surveylisted by submarket with a coderepresenting the type of property The GLA of the property is also listed
A Neighborhood CenterB Community CenterC Fashion/Specialty CenterD Power CenterE Theme Festival
F Outlet CenterG OtherH FreestandingI Mall
southside
BAY FRoNt CapeHenryPlaza A 58,424
Chic’sBeachShoppingCenter A 79,397
Kroger H 47,000
KrogerShops A 13,540
LakeShoresPlazaShoppingCenter A 58,230
MarinaShores G 47,667
BiRdNeCK/oCeANFRoNt
BirdneckSC A 65,460
BirdneckShoppes B 24,000
FarmFresh H 29,296
HarrisTeeter H 48,000
LinkhornShops A 48,899
PacificPlaza H 9,695
CAMPosteLLA
AtlanticCommons A 63,393
BainbridgeMarketplace A 46,444
CampostellaCorner A 43,375
GeorgeWashingtonCommons A 44,942
HollyPointSC A 65,338
SouthgatePlaza A 69,429
ChesAPeAKe sQuARe
BJ’s H 115,660
CastleShops H 37,464
ChesapeakeCenter B 270,602
ChesapeakeSquareMall I 800,000
ChesapeakeSquareShops H 13,559
CrossroadsCenteratChesapeakeSquare D 332,464
[email protected]. H 45,000
HomeDepot H 130,060
Lowes H 115,000
ShopsatChesapeakeSquare H 25,000
TaylorRoadPlaza A 60,000
Wal-MartSupercenter/Sam’sClub H 350,000
ChuRChLANd-PoRtsMouth/hARBoRVieW
ChurchlandPlaceShoppes G 21,000
ChurchlandSC A 149,741
ChurchlandSquare A 72,189
CollegePkwyCrossingatHarbourView A 86,130
Grand H 30,000
HarborViewShoppes A 17,000
HarbourViewEast D 172,000
HarbourViewMarketplace H 96,624
HarbourviewStationEast D 217,308
HarbourviewStationWest D 83,007
MarketplaceSquare A 12,461
PlanetFitnessPlaza A 52,966
PoplarHillPlaza B 102,326
SterlingCreek A 75,660
TownPointSquare A 58,989
VictoryCrossing H 500,000
dAM NeCK
2236GeneralBoothBlvd.A 11,500
DamNeckCrossing B 138,571
DamNeckSquare A 67,917
GeneralBoothPlaza A 71,639
RedMillCommons D 750,000
RedMillWalk D 240,000
SandbridgeSC A 66,800
StrawbridgeMarketplace A 173,829
doWNtoWN
BerkleyCenter A 47,945
ChurchStreetCrossing A 51,000
MacArthurCenterMall I 2,200,000
WatersideFestivalMarketplaceI 130,338
doWNtoWN NoRFoLK
WellsFargoRetail G 50,000
GheNt
201TwentyOne A 15,616
21stStreetPavilion G 21,000
CenterShops A 139,081
ColleyVillage A 44,585
GhentPlace G 13,000
HarrisTeeter H 27,000
PalaceShopsI,II C 78,669
PalaceStation G 37,503
TheCornerShops G 20,000
GReAt BRidGe
CahoonCommons D 278,023
CedarLakesCenter A 35,659
CentervilleCrossing A 46,000
CountryClubShoppes H 17,700
CrossingsatDeepCreek A 68,970
DominionMarketplace A 73,103
DominionPlazaSC A 63,733
GlenwoodSquare A 73,859
GreatBridgeSC A 156,937
HanburyVillage A 100,560
HarborWatchShoppes G 21,505
LasGaviotas A 82,000
MillwoodPlaza G 16,930
Mt.PleasantShoppingCenterA 100,000
Mt.PleasantVillage A 34,180
WilsonVillage A 52,500
WoodfordShoppes B 9,760
WoodfordSquare B 139,623
GReeNBRieR/BAttLeFieLd BouLeVARd
BattlefieldMarketplace G 30,000
ChesapeakeCrossing B 287,679
CountryClubSquare H 12,600
CrosswaysCntr I
&EdenWayShops D 438,725
EdinburghCommons D 184,232
EdinburghEast D 133,000
GainsboroughSquare A 88,862
GreenbrierMall I 899,665
GreenbrierMarketCenter D 487,580
GreenbrierShops A 37,500
GreenbrierSouthSC A 97,500
HomeDepot H 130,060
K-Mart/OfficeMax H 165,000
Knell’sRidgeSquare G 40,000
Lowes H 114,000
OrchardSquare A 88,728
Parkview@Greenbrier A 83,711
PlantationWoods A 16,800
RegalCinemas H 60,763
TheShoppesatGreenbrierG 40,000
Thn G 80,160
TownePlaceatGreenbrierC 127,109
VillageSquare G 15,000
VolvoParkwaySC G 41,874
Wal-Mart/Sam’sClub/Kohl’sD 433,821
hiLLtoP/GReAt NeCK
GreatNeckSquare A 94,587
GreatNeckVillage A 73,736
HilltopEast C 144,100
HilltopNorth A 202,346
HilltopPlaza B 152,025
HilltopSquare B 270,093
HilltopWest G 55,784
LaPromenade C 63,280
MarketplaceatHilltop C 113,000
MillDamCrossing A 25,776
RegencyHilltop B 236,549
RenaissancePlace G 47,667
Target H 122,000
hoLLANd/GReeN RuN
AuburnPlace A 42,709
ChimneyHill B 207,175
GreenRunSquare A 75,000
HollandPlazaSC A 155,000
HollandWindsorCrossing B 74,200
Lowes H 125,323
LynnhavenGreen A 50,838
RosemontCenter A 12,700
ShippsCorner A 63,355
TimberlakeSC A 73,500
iNdiAN RiVeR/CoLLeGe PARK(includingChesapeake)
CollegeParkI&II B 183,874
IndianRiverPlaza B 126,017
IndianRiverSC A 123,752

25
KEMPSVILLE
Arrowhead Plaza A 97,006
Fairfi eld SC B 239,763
Kemps Corner Shoppes G 25,929
Kemps River Center A 62,507
Kemps River Crossing B 245,268
Kempsville Crossing A 94,477
Kempsville Plaza A 60,778
Parkway Marketplace A 26,602
Providence Square SC A 144,904
University Shoppes A 47,200
Witchduck Exchange A 50,000
Woods Corner A 152,314
LITTLE CREEK ROAD/
WARDS CORNER/OCEAN VIEW
Ames/Kroger B 140,568
Dollar Tree Shopping Center A 51,415
East Beach Marketplace B 202,000
East Beach Shoppes A 63,000
Farm Fresh - Little Creek H 66,120
Glenwood Shoppes A 53,255
Little Creek and Tidewater Shops B 119,820
Little Creek Square A 82,300
Meadowbrook S C G 27,260
Mid-Town A 75,768
Mid-Way SC G 31,000
Ocean View SC A 73,658
Roosevelt Gardens SC A 109,175
Southern Shopping Center B 245,868
Super Wal-Mart H 225,000
Wards Corner Strip A 61,540
Wedgewood SC A 137,834
LITTLE NECK
Birchwood SC A 358,635
Colony Building A 23,625
Home Depot H 130,060
Kroger H 45,000
London Bridge Plaza B 114,584
Lowes H 160,000
Lynnhaven 2600 H 13,300
Lynnhaven Convenience G 36,900
Lynnhaven Shopping Center B 191,136
Princess Anne Plaza West C 77,558
Regatta Bay Shops G 60,000
Sam’s Club Plaza D 248,604
LYNNHAVEN ROAD
(Virginia Beach Boulevard to Holland Road)
Lynnhaven Crossing G 55,550
Lynnhaven East B 97,303
Lynnhaven Mall I 1,293,100
Lynnhaven North B 176,254
Lynnshores Shopping Center G 12,692
Lynnway Place G 30,213
Parkway Plaza A 44,287
Wal-Mart H 113,112
MIDDLE PORTSMOUTH
Afton SC A 106,500
Airline Marketplace A 69,000
Airline Plaza A 99,549
Alexander’s Corner Shopping Center A 50,826
Elmhurst Square A 66,250
Gilmerton Square A 43,236
Manor Commerce Center G 67,060
Manor Shops G 14,573
Old Towne Marketplace A 42,000
Rodman SC A 45,000
Super Wal-Mart H 200,000
Triangle SC A 84,437
Victory Crossing D 500,000
Victory West Shopping Center A 167,102
Williams Court B 214,739
MILITARY HIGHWAY/JANAF
3455 Azalea Garden Road A 1,024
Best Square B 140,030
Broad Creek Crossing Phase 1 and Phase 2 D 100,000
Broad Creek SC D 205,417
Bromley SC A 67,790
CostCo H 110,000
Dump/Mega Offi ce G 115,854
Farm Fresh H 60,000
Food Lion #170 H 41,000
Grand Outlet H 35,000
Janaf D 882,262
Lowes H 115,000
Military Crossing D 192,000
Military Triangle G 10,061
Super K-Mart & Shoppes B 200,000
Super Wal-Mart H 224,513
The Gallery @ Military Circle I 856,542
NEWTOWN
Cypress Point A 117,958
Diamond Springs North (Shopping Center) A 23,880
Diamond Springs Shoppes H 18,840
Mattress Discounters Plaza A 59,892
Newpointe SC A 92,978
Newtown Baker Crossing A 91,687
Newtown Center H 19,800
Newtown Convenience Center G 19,800
Northampton Business Center G 85,000
Thomas Corner SC G 23,557
Wesleyan Commons Shopping Center A 54,204
ODU
First Floor Retail Shops at
University Village Apartments G 49,875
PEMBROKE
Aragona SC A 69,700
Best Buy H 45,000
Collins Square A 123,870
Columbus Village East A 63,000
Columbus Village Entertainment Center E 100,000
Dean Plaza (Former HQ) D 140,000
Former Bloom Brothers H 165,000
Giant Square B 150,000
Goodwill H 34,000
Haverty’s H 55,000
Haygood SC B 165,000
Haynes H 228,000
Hunter’s Mill Shoppes G 22,827
Loehmann’s Plaza C 139,380
Northern Super Center G 36,588
Pembroke East B 24,806
Pembroke Mall I 570,000
Pembroke Meadows SC A 81,592
Pembroke Place B 165,000
Pembroke Plaza G 34,900
Roomstore H 50,000
The Town Center
of Virginia Beach C 325,147
Town Center Station B 36,185
PORTSMOUTH
Academy Crossing A 45,800
PRINCESS ANNE ROAD
(from Kempsville Road to Holland Road)
Brenneman Farm SC A 254,197
Courthouse Marketplace A 103,263
Home Depot H 130,000
Kempsville Marketplace A 71,460
Landstown Commons D 505,766
Lynnhaven Square S C G 22,933
Parkway SC A 64,820
Pleasant Valley Marketplace A 88,107
Princess Anne Marketplace B 209,500
Princess One SC A 84,725
Salem Crossing D 92,316
Salem Lakes Marketplace A 42,087
Salem Lakes SC A 37,087
Woodtide SC A 25,500
SMITHFIELD
Cypress Run SC G 25,000
Eagle Harbor A 77,049
Shoppes at Eagle Harbor A 23,343
Smithfi eld Plaza B 89,120
Smithfi eld Square A 65,244
SUFFOLK
Bennetts Creek Crossing A 119,812
Bennetts Creek Food Lion A 64,544
Centerbrooke Village A 12,600
Creekside Village A 18,835
Holland Plaza A 69,345
Kensington Square A 66,421
Lowes H 150,000
Oak Ridge Plaza A 38,700
Suffolk Plaza B 176,733
Suffolk Plaza West A 60,000
Suffolk Shopping Center B 155,733
Suffolk Specialty Shops G 15,200
Suffolk Village SC G 11,875
Wal-Mart Super Center H 194,160

26
PENINSULA
COLISEUM CENTRAL Coliseum Corner A 49,267
Coliseum Crossing B 221,004
Coliseum Marketplace A 105,998
Coliseum Specialty Shops G 15,026
Coliseum Square G 43,307
Hampton Towne Centre D 376,100
Hampton Woods A 89,092
Home Depot H 130,060
Newmarket South D 368,085
Peninsula Towncenter I 1,174,389
Riverdale Plaza D 260,316
Sports Authority H 40,000
Target H 122,000
The Power Plant D 621,150
Todd Center & Todd Lane Shops B 242,000
Wal-Mart Super Center H 193,316
DENBIGH
Beaconsdale SC A 28,000
Denbigh Speciality Shops G 24,504
Denbigh Village Centre B 334,299
Denbigh Village Shopping Center H 327,322
Ferguson Center G 118,000
Former Hills Denbigh H 86,589
Jefferson Crossing
(formerly Denbigh Crossing) A 145,000
Kmart H 115,854
Lee Hall Plaza A 36,000
Newport Crossing B 200,000
Richneck Shopping Center A 63,425
Stoneybrook Shopping Center A 74,340
Turnberry Crossing A 53,775
Village Square A 40,000
Warwick Denbigh SC B 137,925
FOXHILL/BUCKROE/EAST MERCURY
Buckroe SC A 76,000
Farm Fresh Phoebus H 60,411
Kmart H 94,500
Langley Square A 120,646
Marketplace @ Nickerson A 75,850
Nickerson Plaza A 83,849
Willow Oaks Village Square S.C. B 197,169
GLOUCESTER
Food Lion H 40,000
Hayes Plaza SC A 52,651
Hayes SC A 100,000
Home Depot H 100,000
Lowe’s H 125,000
Shoppes at Gloucester B 82,025
Wal-Mart Super Center H 220,000
York River Crossing B 175,000
HAMPTON MISC
Kecoughtan SC A 64,327
NEWMARKET/MAIN (TO INCLUDE HAMPTON)
4113 W Mercury Blvd. H 49,770
4205 W. Mercury Blvd. H 28,080
Brentwood SC A 53,600
Dresden SC G 35,000
Forest Park Square B 150,000
Fransisco Village A 55,865
Hampton Plaza B 173,199
Hilton SC A 74,000
Midway Shopping Center G 58,780
Plaza @ Newmarket B 117,377
Warwick Center A 103,886
Warwick Village A 75,400
NEWPORT NEWS
Jefferson Shoppes A 21,240
PATRICK HENRY/OYSTER POINT/KILN CREEK
Bayberry Village A 72,883
Best Buy Building H 135,000
City Center C 230,000
Commonweatlh Center G 30,279
Fairway Plaza G 37,950
Glendale SC G 30,000
Grand Furniture H 35,000
Harris Teeter H 52,334
Haverty’s H 45,000
Haynes H 85,000
Hidenwood SC A 100,000
Jefferson Commons D 400,000
Jefferson Greene G 57,430
Kroger H 55,000
Lowes H 120,000
Market Place @ Oyster Point A 69,660
Newport Marketplace D 450,000
Newport Square B 184,126
Offi ce Depot H 30,122
Oyster Point Plaza A 73,197
Oyster Point Square A 83,089
Patrick Henry Mall I 714,607
Patrick Henry Place A 17,000
Sam’s Club H 133,880
The Shoppes at Oyster Point G 30,000
Victory Center @ Kiln Creek A 78,000
Village Square @ Kiln Creek B 267,021
Villages of Kiln Creek G 45,300
Wal-Mart Super Center H 201,146
Yoder Plaza SC D 337,053
POQUOSON
Poquoson SC A 57,458
Wythe Creek Plaza SC A 51,063
WILLIAMSBURG
Colony Square A 66,806
Governor’s Green SC A 100,000
Home Depot H 130,000
James York Plaza B 137,708
Kingsgate Green B 138,348
Lowes H 163,000
Marketplace Shoppes G 32,026
Marketplace Shopping Center A 36,000
Monticello Marketplace B 299,792
Monticello SC A 82,000
New Town Shops on Main C 253,000
Norge Crossing H 52,000
Olde Towne SC G 30,000
Prime Outlets F 349,927
Quarterpath Crossing A 85,600
Settlers Market at New Town D 232,808
Staples H 37,400
The Marquis (Phase I) D 1,000,000
The Shops at High Street B 114,449
Village Shops at Kingsmill G 82,200
Wal-Mart SuperCenter H 210,000
Williamsburg Crossing A 150,000
Williamsburg Farm Fresh A 79,188
Williamsburg Marketcenter B 120,920
Williamsburg Outlet Mall I 180,000
Williamsburg Pavillion Shops G 50,000
Williamsburg SC I & II B 251,000
Williamsburg Towne and Cnty A 49,802
WindsorMeade Marketplace D 189,605
Yankee Candle H 42,000
YORK COUNTY
Grafton SC A 32,000
Heritage Square A 73,865
Kiln Creek Center A 45,700
Lakeside 17 H 8,400
Marketplace @ Yorktown A 73,050
Patriots Square A 47,231
Pavilion at Kiln Creek A 26,820
Shady Banks SC A 56,634
Wal-Mart SuperCenter H 220,000
Washington Square
Shopping Center B 177,056
York Square A 48,720
Yorkshire Downs G 23,900