Embed Size (px)
Citation preview
11
AuthorDavid MachupaThalhimer/Cushman & Wakefield
Data Analysis/LayoutDavid ChapmanOld Dominion University
Financial SupportThe E. V. Williams Center for Real Estate for RealEstate and Economic Development (CREED) functionsand reports are funded by donations from individuals, organizations and the CREED Advisory Board.
Disclosure The data used for this report was provided by agentsand owners of the surveyed properties. The data isdeemed reliable; however, neither Old DominionUniversity, the E. V. Williams Center for Real Estate forReal Estate and Economic Development, nor Thalhimer/Cushman & Wakefield makes any representation orwarranty as to its accuracy.
Acknowledgements
2 0 0 8 H A M P TO N R O A D S R E A L E S TAT E M A R K E T R E V I E W
R E T A I L
ODU-MarketReview2008-FINAL2:ODUMarketReview2005 2/14/08 11:51 AM Page 11
12
2 0 0 8 R E TA I L
HAMPTON ROADSReal Estate Market Review 2008
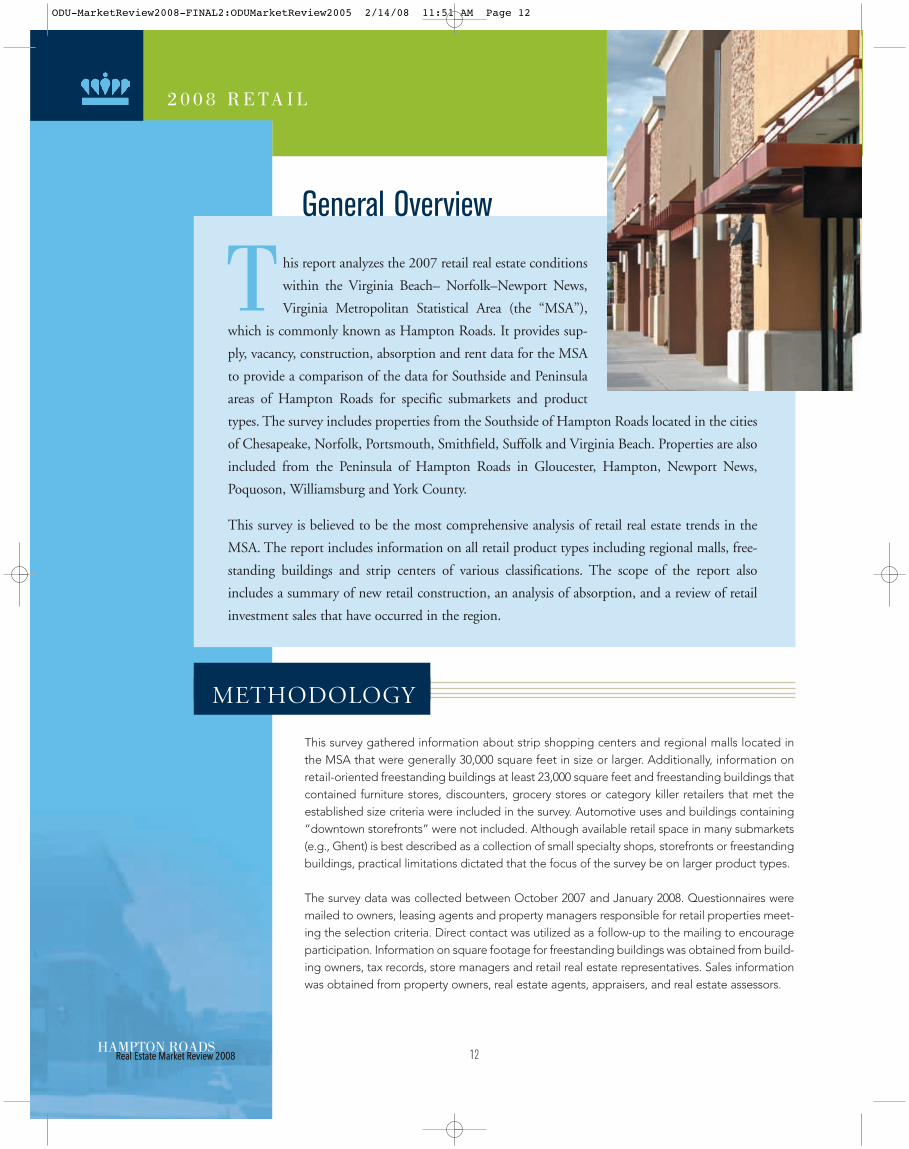
This survey gathered information about strip shopping centers and regional malls located inthe MSA that were generally 30,000 square feet in size or larger. Additionally, information onretail-oriented freestanding buildings at least 23,000 square feet and freestanding buildings thatcontained furniture stores, discounters, grocery stores or category killer retailers that met theestablished size criteria were included in the survey. Automotive uses and buildings containing“downtown storefronts” were not included. Although available retail space in many submarkets(e.g., Ghent) is best described as a collection of small specialty shops, storefronts or freestandingbuildings, practical limitations dictated that the focus of the survey be on larger product types.
The survey data was collected between October 2007 and January 2008. Questionnaires weremailed to owners, leasing agents and property managers responsible for retail properties meet-ing the selection criteria. Direct contact was utilized as a follow-up to the mailing to encourageparticipation. Information on square footage for freestanding buildings was obtained from build-ing owners, tax records, store managers and retail real estate representatives. Sales informationwas obtained from property owners, real estate agents, appraisers, and real estate assessors.
his report analyzes the 2007 retail real estate conditions
within the Virginia Beach– Norfolk–Newport News,
Virginia Metropolitan Statistical Area (the “MSA”),
which is commonly known as Hampton Roads. It provides sup-
ply, vacancy, construction, absorption and rent data for the MSA
to provide a comparison of the data for Southside and Peninsula
areas of Hampton Roads for specific submarkets and product
types. The survey includes properties from the Southside of Hampton Roads located in the cities
of Chesapeake, Norfolk, Portsmouth, Smithfield, Suffolk and Virginia Beach. Properties are also
included from the Peninsula of Hampton Roads in Gloucester, Hampton, Newport News,
Poquoson, Williamsburg and York County.
This survey is believed to be the most comprehensive analysis of retail real estate trends in the
MSA. The report includes information on all retail product types including regional malls, free-
standing buildings and strip centers of various classifications. The scope of the report also
includes a summary of new retail construction, an analysis of absorption, and a review of retail
investment sales that have occurred in the region.
METHODOLOGY
Real Estate Market Review 2008
General Overview
T
ODU-MarketReview2008-FINAL2:ODUMarketReview2005 2/14/08 11:51 AM Page 12
13
Asking Rates: The market rate per square foot of a retail property (excluding freestanding buildings and malls),exclusive of additional rents that may be paid under a triple net lease. Interpretation of average retail rates in dif-ferent product types and submarkets should be viewed cautiously given the tremendous variability in rates for likeproducts and for properties located within the same submarket. Factors such as visibility, co-tenancy and accessi-bility are some of the many sources of variation in market rates which should be considered.
Big Boxes: Contiguous retail space that is at least 23,000 square feet and located in any one of the identified prod-uct types. Retailers occupying big boxes include, but are not limited to, the following: category killers, specialtystores, discounters, furniture stores, grocery stores and theaters. Bowling alleys, automotive uses, roller rinks and ice-skating rinks were not included.
CAM: Common Area Maintenance
Product Types: Properties were classified according to one of the following nine retail product types. The InternationalCouncil of Shopping Centers defined the first six categories. Three additional categories were included to accuratelycategorize the remaining properties.
Neighborhood Center 30,000 to 150,000 square feet; supermarket anchored
Community Center 100,000 to 350,000 square feet; discount department store, supermarket or drug store anchored
Fashion/Specialty Center 80,000 to 250,000 square feet; fashion anchored
Power Center 250,000 to 600,000 square feet; category killer, home improvement and discount department store anchored
Theme Festival Center 80,000 to 250,000 square feet; restaurants, entertainment anchored
Outlet Center 50,000 to 400,000 square feet; manufacturer’s outlet store anchored
Freestanding Individual building not considered a shopping center
Mall Shopping center with area designed for pedestrian use only
Other Any center that does not fit into a typical category
Regional Mall Node: Submarket anchored by regional mall.
Small Shop: In-line retail space usually less than 10,000 square feet located in a multi-tenanted shopping center.
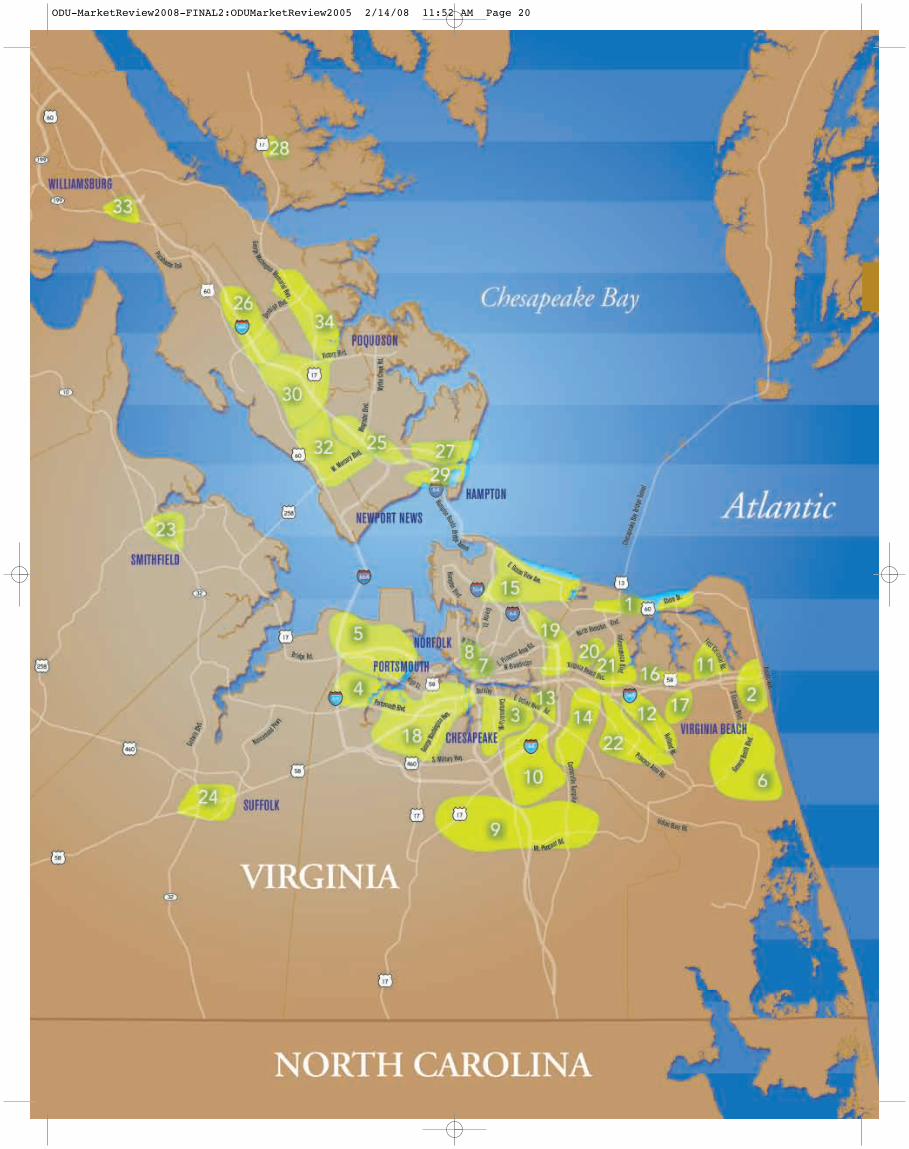
Submarkets: Hampton Roads was divided into thirty-six retail submarkets (twenty-six Southside submarkets and tenPeninsula submarkets) which reflected general concentrations, pockets or corridors of retail product type.Geographical boundaries of the retail submarkets were influenced by density of existing retail product, physical orgeographical obstacles, existing transportation networks, municipal boundaries, population concentrations andretailers’ perceptions of the MSA. Final determination of specific boundaries of each submarket was made by a sub-committee of the Real Estate Board comprised of retail real estate professionals who are actively involved in theMSA. Also highlighted were specific submarkets that are anchored by regional malls. A map which identifies thegeneral location of each submarket is included in the centerfold of this report.
Triple Net Lease: Type of lease under which a tenant pays its pro-rata share of real estate taxes, insurance and com-mon area maintenance.
DEFINITIONS OF TERMS
20
08
RE
TA
IL
ODU-MarketReview2008-FINAL2:ODUMarketReview2005 2/14/08 11:51 AM Page 13
14
During 2006, vacancy rates hit the lowest levels since the inception of the CREED market sur-vey while small shop rental rates reached the highest levels in the market. In 2007, theHampton Roads retail market reached another milestone: for the first time in CREED historythe retail market surpassed 50 million square feet of product all the while witnessing stronggrowth, a slight increase in the vacancy rates and increase in the average rental rate. Newand existing retailers searched for locations within established markets and followed the res-idential growth pattern creating hotbeds of activity in submarkets such as Northern Suffolk,Williamsburg and Southern Chesapeake.
Several large retail development projects opened in 2007, including Landstown Commons inVirginia Beach, The Marquis in Williamsburg, Bennett’s Creek in Suffolk, and CahoonCommons in Chesapeake.
Mixed use projects consisting of retail, office and residential continueto attract Tenants. The Virginia Beach Town Center saw the WestinHotel and the Sandler Center for the Performing Arts open in late2007 as well as retailers Johnston & Murphy and McCormick andSchmick. The City Center at Oyster Point in Newport News addedBanana Republic; The Towne Place in Greenbrier opened with Chicosand Jos A. Banks; Settlers Market in Williamsburg began clearing thesite and thus far is anchored by Trader Joes, Books A Million, Michaelsand Home Goods. All that remains of Coliseum Mall is Macy’s. Thesite has been scrapped and a new J C Penny’s has been built and willbe joined by Target and other retailers. These new retailers and thenew residential units will reemerge as The Peninsula Towne Center.
Grocery Stores continued to expand in Hampton Roads. Farm Fresh opened a new gour-met concept in downtown Norfolk called the Marketplace at Harbor Heights, as well as a tra-ditional store at Bennett’s Creek in Suffolk. Food Lion converted 8 stores to its higher endBloom concept and 10 stores to the value focused Bottom Dollar and continue to look foropportunities to grow all three banners. In Portsmouth, Food Lion relocated from TriangleShopping Center to a larger unit at Williams Court and is in the process of doing the samewith Airline Center. Wal-Mart has entered Hampton Roads with its Neighborhood Marketconcept and is under construction with its first store in Norfolk. Harris Teeter anchored thenew Indian Lakes Crossing and will also anchor the planned developments of BrennamanFarms in Virginia Beach and Harbourview Marketplace in Suffolk. Trader Joes has signed alease at Settlers Market in Williamsburg and Farm Fresh is opening the Marketplace concepton High Street in Williamsburg. Additional higher end grocers continue to explore theHampton Roads market for opportunities.
The Big Boxes continued expansion in Hampton Roads. Target led the way at Red MillWalk in Virginia Beach. Lowes purchased the former Giant Square shopping center and willblade the site for a new freestanding unit. Kohl’s opened in Landstown Commons inVirginia Beach and is under construction in Harborview East in Suffolk. Best Buy also
2 0 0 8 R E TA I L
YEAR IN REVIEW
HAMPTON ROADSReal Estate Market Review 2008
In 2007, the Hampton Roads retail market reached
another milestone: for the first time in CREED history the
retail market surpassed 50 million square feet of product
all the while witnessing strong growth, a slight increase in
the vacancy rates and increase in the average rental rate.
ODU-MarketReview2008-FINAL2:ODUMarketReview2005 2/14/08 11:51 AM Page 14
15
20
08
RE
TA
IL
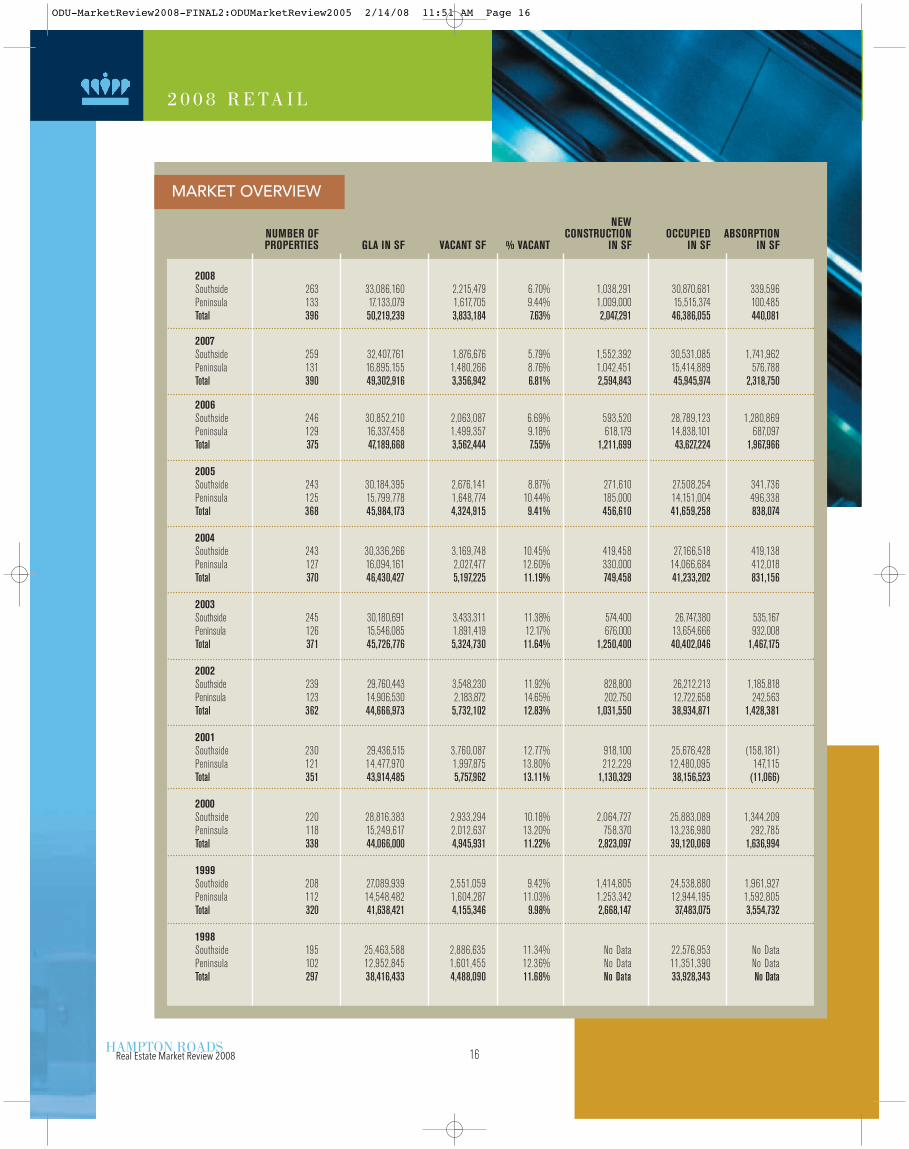
The Hampton Roads retail market contained approximately 50,219,239 square feet of gross leasable area (“GLA”)in 396 properties. The US Census Bureau indicates the population of Hampton Roads is approximately 1.7 Millionresulting in a 29.5 square feet of retail supply per person. Certain methodological differences (e.g., the inclusionof freestanding buildings and malls in this survey) make it difficult to compare per capita supply in the MSA to anational average statistic.
Hampton Roads consists of two markets, the Southside and Peninsula. The Southside market has approximately33,086,160 square feet, roughly 66% of the total square footage in the market, in 263 properties. The average ask-ing rent for small shop space increased by $.58 over 2006 to $16.68 triple net. In 2007, there was an increase in thevacancy rate by .91% to 6.70% as new construction added 1,038,291 square feet to the Southside market.
The Peninsula also experienced some exciting changes this past year. The 133 properties on the Peninsula thatwere surveyed combined for 17,133,079 square feet of product. The average asking price of small shop spaceincreased $.24 to $15.41 per square foot triple net. The vacancy rate also slightly increased by .68% to 9.44 % with1,009,000 square feet of new construction added to the Peninsula market.
Overall both markets performed well. The average rental rate for small shop space in Hampton Roads hasincreased to $16.05 triple net. While the market saw an increase in the overall vacancy rate, some of that can beattributed to the new projects that came on line in the 4th quarter rather than excessive turnover of small shop ten-ants as anchor tenants continue to look for opportunities in the market.
HAMPTON ROADS MARKET SURVEY
opened at Landstown and signed a lease at Marquis in Williamsburg. J C Penny opened at the PeninsulaTowne Center, Circuit City rolled out a new prototype at Janaf in Norfolk with their former location being backfilled by Petco. Bed, Bath and Beyond opened at Landstown and is under construction at Harborview East.Gold’s Gym opened in the Ghent section of Norfolk and Barnes and Noble opened a multi-level location with-in MacArthur Center.
ODU-MarketReview2008-FINAL2:ODUMarketReview2005 2/14/08 11:51 AM Page 15
MARKET OVERVIEW
16
NEWNUMBER OF CONSTRUCTION OCCUPIED ABSORPTIONPROPERTIES GLA IN SF VACANT SF % VACANT IN SF IN SF IN SF
2008Southside 263 33,086,160 2,215,479 6.70% 1,038,291 30,870,681 339,596
Peninsula 133 17,133,079 1,617,705 9.44% 1,009,000 15,515,374 100,485
Total 396 50,219,239 3,833,184 7.63% 2,047,291 46,386,055 440,081
2007Southside 259 32,407,761 1,876,676 5.79% 1,552,392 30,531,085 1,741,962
Peninsula 131 16,895,155 1,480,266 8.76% 1,042,451 15,414,889 576,788
Total 390 49,302,916 3,356,942 6.81% 2,594,843 45,945,974 2,318,750
2006Southside 246 30,852,210 2,063,087 6.69% 593,520 28,789,123 1,280,869
Peninsula 129 16,337,458 1,499,357 9.18% 618,179 14,838,101 687,097
Total 375 47,189,668 3,562,444 7.55% 1,211,699 43,627,224 1,967,966
2005Southside 243 30,184,395 2,676,141 8.87% 271,610 27,508,254 341,736
Peninsula 125 15,799,778 1,648,774 10.44% 185,000 14,151,004 496,338
Total 368 45,984,173 4,324,915 9.41% 456,610 41,659,258 838,074
2004Southside 243 30,336,266 3,169,748 10.45% 419,458 27,166,518 419,138
Peninsula 127 16,094,161 2,027,477 12.60% 330,000 14,066,684 412,018
Total 370 46,430,427 5,197,225 11.19% 749,458 41,233,202 831,156
2003Southside 245 30,180,691 3,433,311 11.38% 574,400 26,747,380 535,167
Peninsula 126 15,546,085 1,891,419 12.17% 676,000 13,654,666 932,008
Total 371 45,726,776 5,324,730 11.64% 1,250,400 40,402,046 1,467,175
2002Southside 239 29,760,443 3,548,230 11.92% 828,800 26,212,213 1,185,818
Peninsula 123 14,906,530 2,183,872 14.65% 202,750 12,722,658 242,563
Total 362 44,666,973 5,732,102 12.83% 1,031,550 38,934,871 1,428,381
2001Southside 230 29,436,515 3,760,087 12.77% 918,100 25,676,428 (158,181)
Peninsula 121 14,477,970 1,997,875 13.80% 212,229 12,480,095 147,115
Total 351 43,914,485 5,757,962 13.11% 1,130,329 38,156,523 (11,066)
2000Southside 220 28,816,383 2,933,294 10.18% 2,064,727 25,883,089 1,344,209
Peninsula 118 15,249,617 2,012,637 13.20% 758,370 13,236,980 292,785
Total 338 44,066,000 4,945,931 11.22% 2,823,097 39,120,069 1,636,994
1999Southside 208 27,089,939 2,551,059 9.42% 1,414,805 24,538,880 1,961,927
Peninsula 112 14,548,482 1,604,287 11.03% 1,253,342 12,944,195 1,592,805
Total 320 41,638,421 4,155,346 9.98% 2,668,147 37,483,075 3,554,732
1998Southside 195 25,463,588 2,886,635 11.34% No Data 22,576,953 No Data
Peninsula 102 12,952,845 1,601,455 12.36% No Data 11,351,390 No Data
Total 297 38,416,433 4,488,090 11.68% No Data 33,928,343 No Data
HAMPTON ROADSReal Estate Market Review 2008
2 0 0 8 R E TA I L
ODU-MarketReview2008-FINAL2:ODUMarketReview2005 2/14/08 11:51 AM Page 16
17
SOUTHSIDE BY SUBMARKET
20
08
RE
TA
IL
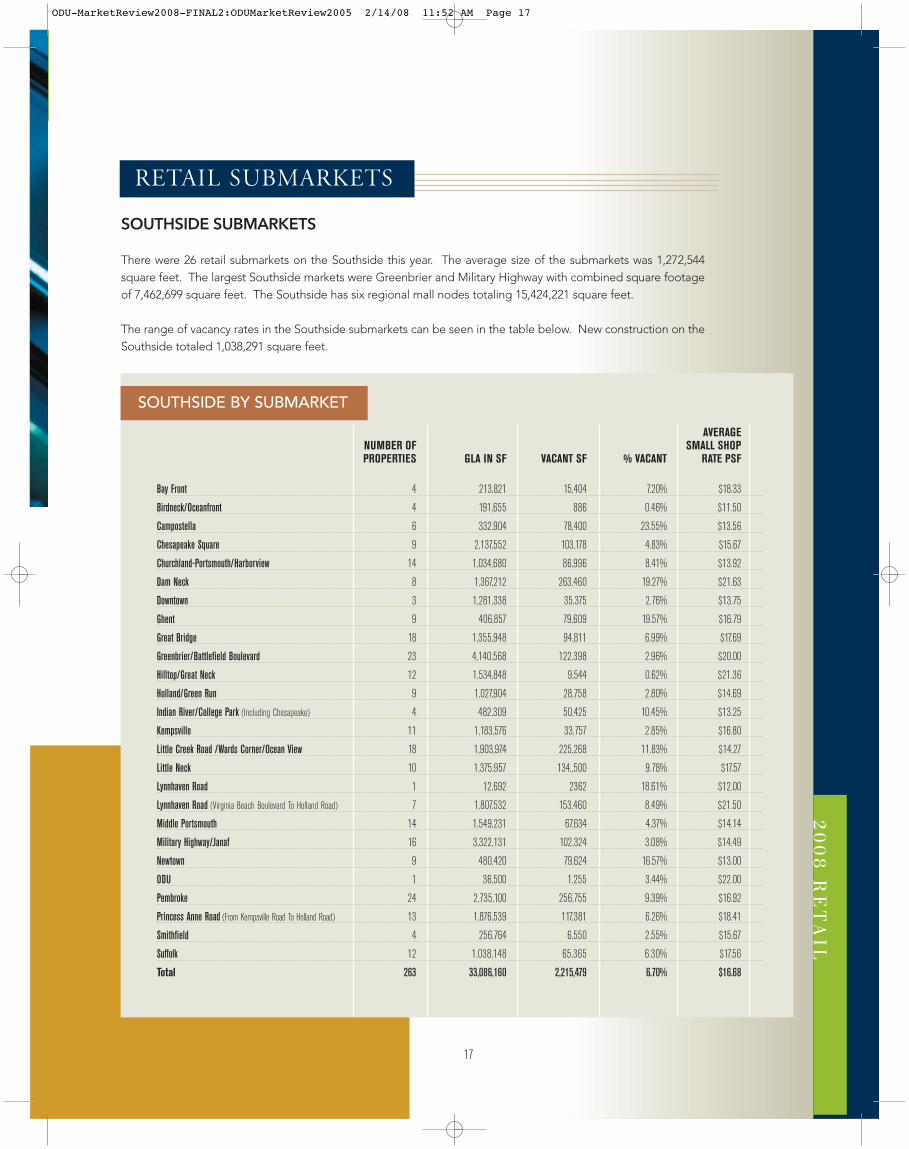
SOUTHSIDE SUBMARKETS
There were 26 retail submarkets on the Southside this year. The average size of the submarkets was 1,272,544square feet. The largest Southside markets were Greenbrier and Military Highway with combined square footageof 7,462,699 square feet. The Southside has six regional mall nodes totaling 15,424,221 square feet.
The range of vacancy rates in the Southside submarkets can be seen in the table below. New construction on theSouthside totaled 1,038,291 square feet.
RETAIL SUBMARKETS
AVERAGE NUMBER OF SMALL SHOPPROPERTIES GLA IN SF VACANT SF % VACANT RATE PSF
Bay Front 4 213,821 15,404 7.20% $18.33
Birdneck/Oceanfront 4 191,655 886 0.46% $11.50
Campostella 6 332,904 78,400 23.55% $13.56
Chesapeake Square 9 2,137,552 103,178 4.83% $15.67
Churchland-Portsmouth/Harborview 14 1,034,680 86,996 8.41% $13.92
Dam Neck 8 1,367,212 263,460 19.27% $21.63
Downtown 3 1,281,338 35,375 2.76% $13.75
Ghent 9 406,857 79,609 19.57% $16.79
Great Bridge 18 1,355,948 94,811 6.99% $17.69
Greenbrier/Battlefield Boulevard 23 4,140,568 122,398 2.96% $20.00
Hilltop/Great Neck 12 1,534,848 9,544 0.62% $21.36
Holland/Green Run 9 1,027,904 28,758 2.80% $14.69
Indian River/College Park (Including Chesapeake) 4 482,309 50,425 10.45% $13.25
Kempsville 11 1,183,576 33,757 2.85% $16.80
Little Creek Road /Wards Corner/Ocean View 18 1,903,974 225,268 11.83% $14.27
Little Neck 10 1,375,957 134,,500 9.78% $17.57
Lynnhaven Road 1 12,692 2362 18.61% $12.00
Lynnhaven Road (Virginia Beach Boulevard To Holland Road) 7 1,807,532 153,460 8.49% $21.50
Middle Portsmouth 14 1,549,231 67,634 4.37% $14.14
Military Highway/Janaf 16 3,322,131 102,324 3.08% $14.49
Newtown 9 480,420 79,624 16.57% $13.00
ODU 1 36,500 1,255 3.44% $22.00
Pembroke 24 2,735,100 256,755 9.39% $16.92
Princess Anne Road (From Kempsville Road To Holland Road) 13 1,876,539 117,381 6.26% $18.41
Smithfield 4 256,764 6,550 2.55% $15.67
Suffolk 12 1,038,148 65,365 6.30% $17.56
Total 263 33,086,160 2,215,479 6.70% $16.68
ODU-MarketReview2008-FINAL2:ODUMarketReview2005 2/14/08 11:52 AM Page 17
18
2 0 0 8 R E TA I L
HAMPTON ROADSReal Estate Market Review 2008
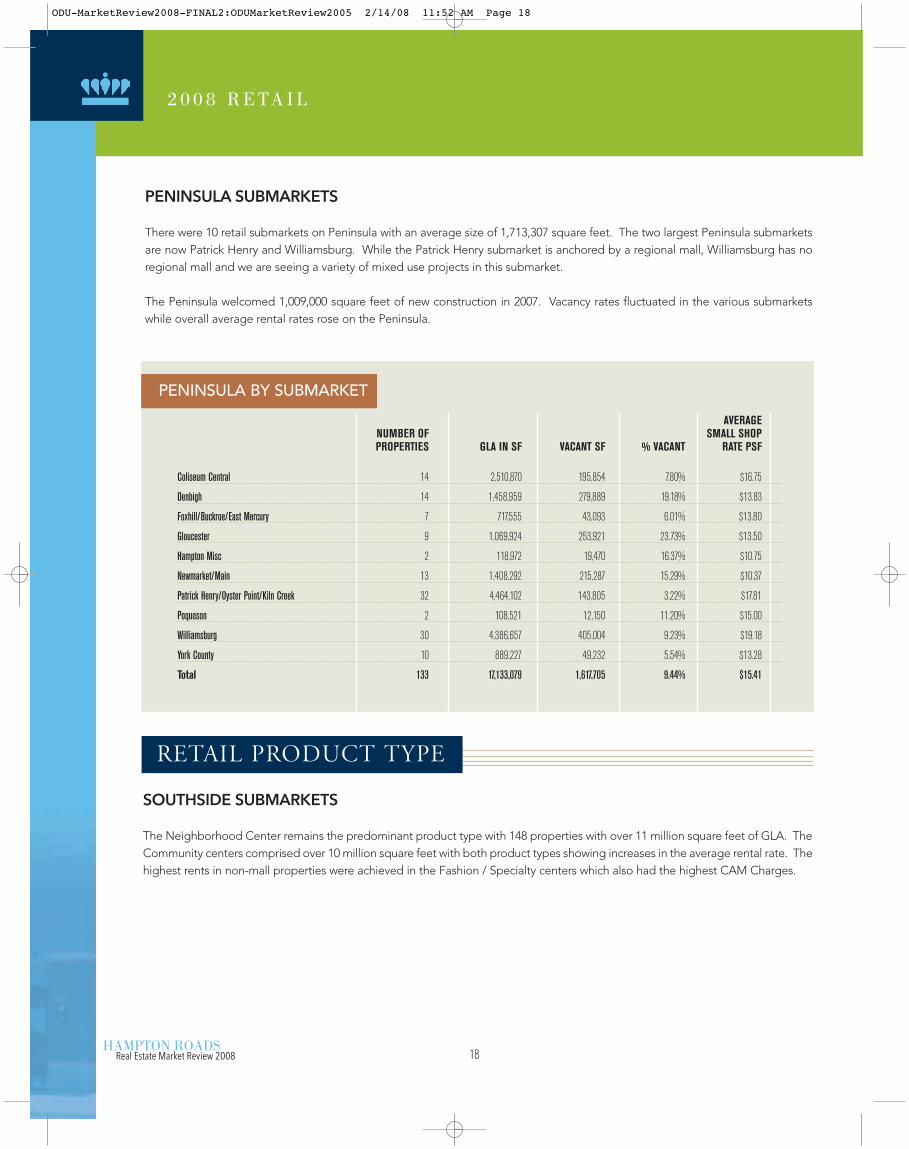
PENINSULA SUBMARKETS
There were 10 retail submarkets on Peninsula with an average size of 1,713,307 square feet. The two largest Peninsula submarketsare now Patrick Henry and Williamsburg. While the Patrick Henry submarket is anchored by a regional mall, Williamsburg has noregional mall and we are seeing a variety of mixed use projects in this submarket.
The Peninsula welcomed 1,009,000 square feet of new construction in 2007. Vacancy rates fluctuated in the various submarketswhile overall average rental rates rose on the Peninsula.
PENINSULA BY SUBMARKET
AVERAGE NUMBER OF SMALL SHOPPROPERTIES GLA IN SF VACANT SF % VACANT RATE PSF
Coliseum Central 14 2,510,870 195,854 7.80% $16.75
Denbigh 14 1,458,959 279,889 19.18% $13.83
Foxhill/Buckroe/East Mercury 7 717,555 43,093 6.01% $13.80
Gloucester 9 1,069,924 253,921 23.73% $13.50
Hampton Misc 2 118,972 19,470 16.37% $10.75
Newmarket/Main 13 1,408,292 215,287 15.29% $10.37
Patrick Henry/Oyster Point/Kiln Creek 32 4,464,102 143,805 3.22% $17.81
Poquoson 2 108,521 12,150 11.20% $15.00
Williamsburg 30 4,386,657 405,004 9.23% $19.18
York County 10 889,227 49,232 5.54% $13.28
Total 133 17,133,079 1,617,705 9.44% $15.41
SOUTHSIDE SUBMARKETS
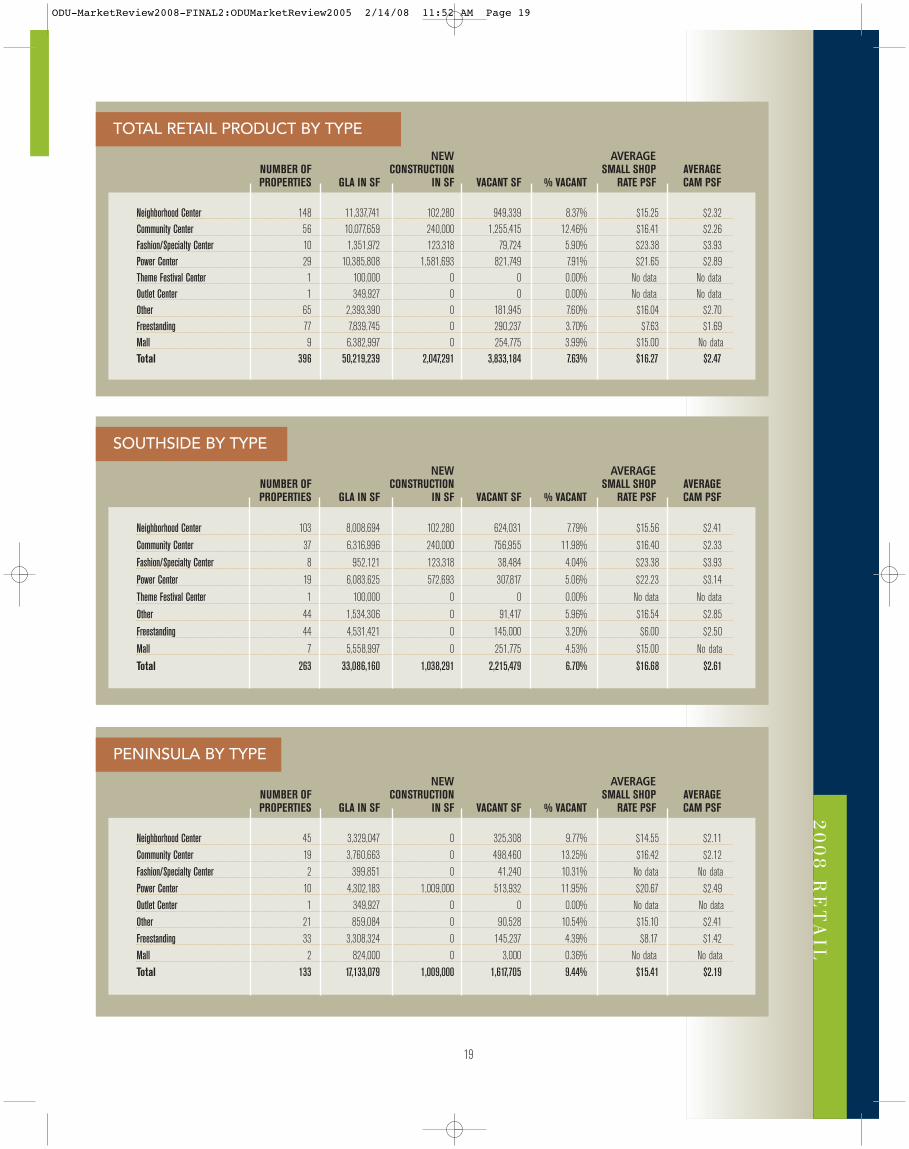
The Neighborhood Center remains the predominant product type with 148 properties with over 11 million square feet of GLA. TheCommunity centers comprised over 10 million square feet with both product types showing increases in the average rental rate. Thehighest rents in non-mall properties were achieved in the Fashion / Specialty centers which also had the highest CAM Charges.
RETAIL PRODUCT TYPE
ODU-MarketReview2008-FINAL2:ODUMarketReview2005 2/14/08 11:52 AM Page 18
19
20
08
RE
TA
IL
TOTAL RETAIL PRODUCT BY TYPE
NEW AVERAGENUMBER OF CONSTRUCTION SMALL SHOP AVERAGE PROPERTIES GLA IN SF IN SF VACANT SF % VACANT RATE PSF CAM PSF
Neighborhood Center 148 11,337,741 102,280 949,339 8.37% $15.25 $2.32
Community Center 56 10,077,659 240,000 1,255,415 12.46% $16.41 $2.26
Fashion/Specialty Center 10 1,351,972 123,318 79,724 5.90% $23.38 $3.93
Power Center 29 10,385,808 1,581,693 821,749 7.91% $21.65 $2.89
Theme Festival Center 1 100,000 0 0 0.00% No data No data
Outlet Center 1 349,927 0 0 0.00% No data No data
Other 65 2,393,390 0 181,945 7.60% $16.04 $2.70
Freestanding 77 7,839,745 0 290,237 3.70% $7.63 $1.69
Mall 9 6,382,997 0 254,775 3.99% $15.00 No data
Total 396 50,219,239 2,047,291 3,833,184 7.63% $16.27 $2.47
SOUTHSIDE BY TYPE
NEW AVERAGENUMBER OF CONSTRUCTION SMALL SHOP AVERAGE PROPERTIES GLA IN SF IN SF VACANT SF % VACANT RATE PSF CAM PSF
Neighborhood Center 103 8,008,694 102,280 624,031 7.79% $15.56 $2.41
Community Center 37 6,316,996 240,000 756,955 11.98% $16.40 $2.33
Fashion/Specialty Center 8 952,121 123,318 38,484 4.04% $23.38 $3.93
Power Center 19 6,083,625 572,693 307,817 5.06% $22.23 $3.14
Theme Festival Center 1 100,000 0 0 0.00% No data No data
Other 44 1,534,306 0 91,417 5.96% $16.54 $2.85
Freestanding 44 4,531,421 0 145,000 3.20% $6.00 $2.50
Mall 7 5,558,997 0 251,775 4.53% $15.00 No data
Total 263 33,086,160 1,038,291 2,215,479 6.70% $16.68 $2.61
PENINSULA BY TYPE
NEW AVERAGENUMBER OF CONSTRUCTION SMALL SHOP AVERAGE PROPERTIES GLA IN SF IN SF VACANT SF % VACANT RATE PSF CAM PSF
Neighborhood Center 45 3,329,047 0 325,308 9.77% $14.55 $2.11
Community Center 19 3,760,663 0 498,460 13.25% $16.42 $2.12
Fashion/Specialty Center 2 399,851 0 41,240 10.31% No data No data
Power Center 10 4,302,183 1,009,000 513,932 11.95% $20.67 $2.49
Outlet Center 1 349,927 0 0 0.00% No data No data
Other 21 859,084 0 90,528 10.54% $15.10 $2.41
Freestanding 33 3,308,324 0 145,237 4.39% $8.17 $1.42
Mall 2 824,000 0 3,000 0.36% No data No data
Total 133 17,133,079 1,009,000 1,617,705 9.44% $15.41 $2.19
ODU-MarketReview2008-FINAL2:ODUMarketReview2005 2/14/08 11:52 AM Page 19
ODU-MarketReview2008-FINAL2:ODUMarketReview2005 2/14/08 11:52 AM Page 20
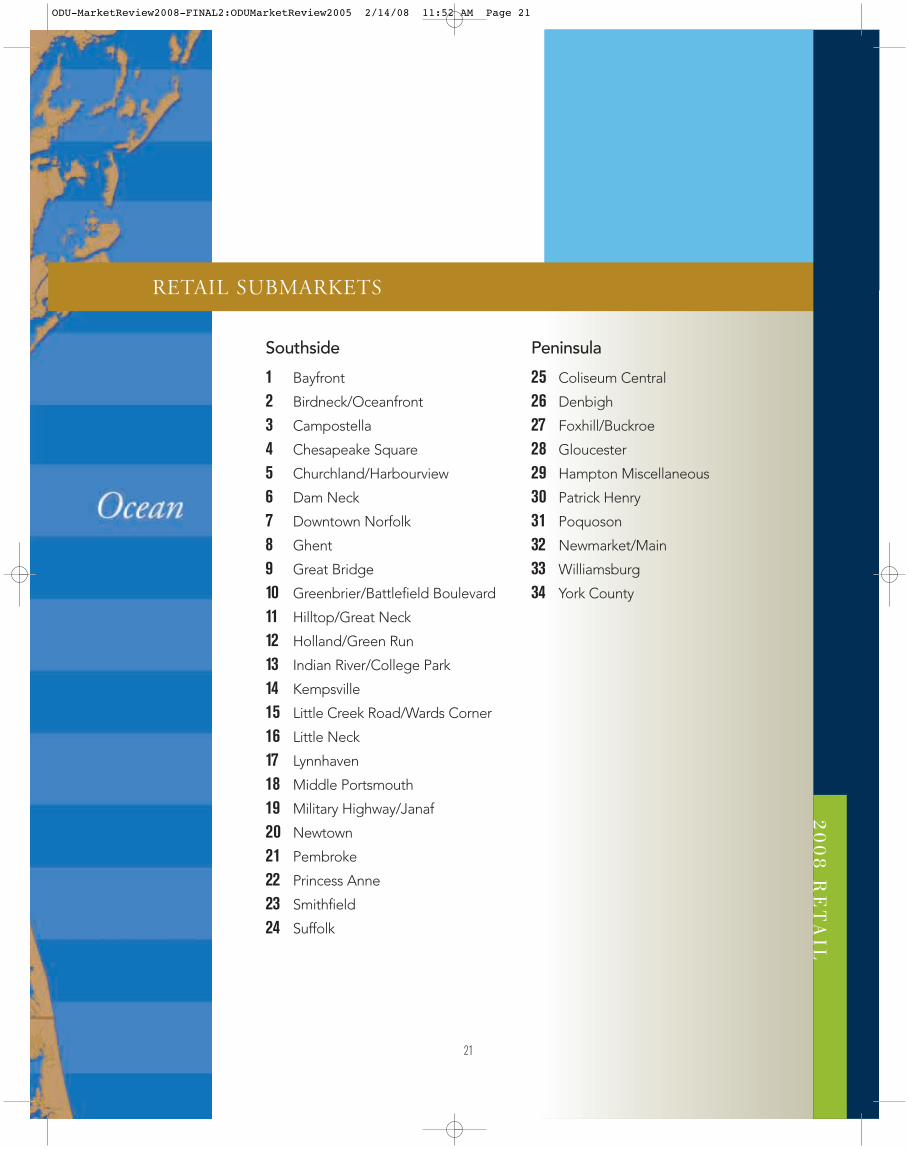
21
Southside
1 Bayfront
2 Birdneck/Oceanfront
3 Campostella
4 Chesapeake Square
5 Churchland/Harbourview
6 Dam Neck
7 Downtown Norfolk
8 Ghent
9 Great Bridge
10 Greenbrier/Battlefield Boulevard
11 Hilltop/Great Neck
12 Holland/Green Run
13 Indian River/College Park
14 Kempsville
15 Little Creek Road/Wards Corner
16 Little Neck
17 Lynnhaven
18 Middle Portsmouth
19 Military Highway/Janaf
20 Newtown
21 Pembroke
22 Princess Anne
23 Smithfield
24 Suffolk
Peninsula
25 Coliseum Central
26 Denbigh
27 Foxhill/Buckroe
28 Gloucester
29 Hampton Miscellaneous
30 Patrick Henry
31 Poquoson
32 Newmarket/Main
33 Williamsburg
34 York County
RETAIL SUBMARKETS
20
08
RE
TA
IL
ODU-MarketReview2008-FINAL2:ODUMarketReview2005 2/14/08 11:52 AM Page 21
VACANCY BY SUBMARKET
BIG BOX VACANCY
22
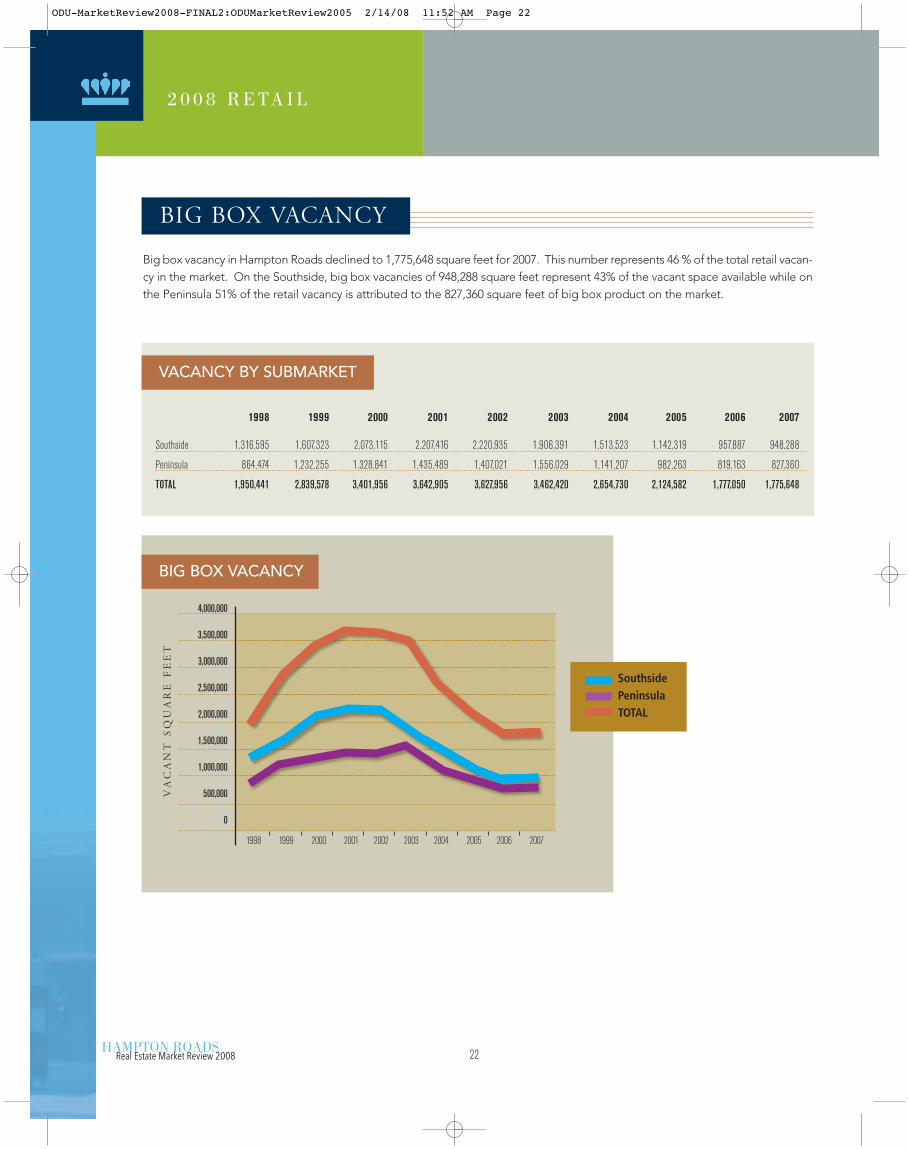
Big box vacancy in Hampton Roads declined to 1,775,648 square feet for 2007. This number represents 46 % of the total retail vacan-cy in the market. On the Southside, big box vacancies of 948,288 square feet represent 43% of the vacant space available while onthe Peninsula 51% of the retail vacancy is attributed to the 827,360 square feet of big box product on the market.
BIG BOX VACANCY
HAMPTON ROADSReal Estate Market Review 2008
1998 1999 2000 2001 2002 2003 2004 2005 2006 2007
Southside 1,316,595 1,607,323 2,073,115 2,207,416 2,220,935 1,906,391 1,513,523 1,142,319 957,887 948,288
Peninsula 864,474 1,232,255 1,328,841 1,435,489 1,407,021 1,556,029 1,141,207 982,263 819,163 827,360
TOTAL 1,950,441 2,839,578 3,401,956 3,642,905 3,627,956 3,462,420 2,654,730 2,124,582 1,777,050 1,775,648
4,000,000
3,500,000
3,000,000
2,500,000
2,000,000
1,500,000
1,000,000
500,000
0
SouthsidePeninsulaTOTAL
1998 1999 2000 2001 2002 2003 2004 2005 2006 2007
Va
ca
nt
S
qu
ar
e F
ee
t
2 0 0 8 R E TA I L
ODU-MarketReview2008-FINAL2:ODUMarketReview2005 2/14/08 11:52 AM Page 22
23
20
08
RE
TA
IL
Hampton Roads continued to expand in 2007 with a fair amount of growth and redevelopment taking place on the Peninsula. Asampling of the change Hampton Roads witnessed this year is as follows:
Chesapeake1. Cahoon Commons Crescent Development (Complete)2. Country Club Shops John Wood (Complete)3. The Shops at Chesapeake Square Stanton Partners (Planned)
Hampton 1. The Peninsula Town Center Mall Properties (Under Construction)
Newport News1. The Village of Stoney Run The Breeden Company (Complete)2. The Marketplace S.L. Nusbaum Realty Co (Planned)
Suffolk1. Harbourview East Landonomics (Under Construction)2. The Marketplace at Harbourview Hemisphere Development (Planned)3. Bennett’s Creek Stanton Partners / RDG (Complete)4. Obici Place RDG (Planned)5. The Shops at Godwin Marketplace S.L. Nusbaum/ Brinkley (Planned)6. Nansemond Crossing Spectrum Development (Planned)
Virginia Beach 1. Redmill Walk Ellis Gibson Development (Under Construction)2. Landstown Commons The Goodman Company (Complete)3. Indian Lakes Crossing Armada Hoffler (Complete)4. The Shops at Town Center S.L. Nusbaum (Planned)
Williamsburg1. Settlers Market AIG (Under Construction)2. High Street Rossland (Under Construction)3. Quarterpath Crossing S.L. Nusbaum (Planned)4. Marquis Premier ( Phase 1 Open)
NEW DEVELOPMENT
ODU-MarketReview2008-FINAL2:ODUMarketReview2005 2/14/08 11:52 AM Page 23
24
2 0 0 8 R E TA I L
HAMPTON ROADS
SOUTHSIDE
BAY FRONTBayside I & II A 79,397
Cape Henry Plaza A 58,424
Kroger H 47,000
Marina Shores G 29,000
BIRDNECK / OCEANFRONTBirdneck SC A 65,460
Farm Fresh H 29,296
Harris Teeter H 48,000
Linkhorn Shops A 48,899
CAMPOSTELLA Atlantic Commons A 63,393
Bainbridge Marketplace A 46,444
Campostella Corner A 43,375
George Washington Commons A 44,942
Holly Point SC A 65,321
Southgate Plaza A 69,429
CHESAPEAKE SQUAREBJ's H 115,660
Chesapeake Center B 296,832
Chesapeake Square Mall I 800,000
Crossroads @ Chesp. Sq. D 225,000
Food Lion @ Chesp. Sq. H 45,000
Home Depot H 130,060
Lowes H 115,000
Taylor Road Plaza A 60,000
Wal-Mart Supercenter / Sam's Club H 350,000
CHURCHLAND / PORTSMOUTH / HARBOURVIEWAcademy Crossing G 45,483
Churchland Blvd SC (Formerly Farmco Plaza) G 52,966
Churchland Place G 21,000
Churchland SC A 149,741
Churchland Square A 64,989
Grand H 30,000
Harbourview Station East D 217,308
Harbourview Station West D 83,007
Marketcenter at Harbourview A 65,750
Marketplace Square G 12,461
Poplar Hill Plaza B 102,326
Sterling Commons A 75,660
Towne Point Square A 58,989
Western Branch CrossingLowes (Churchland) H 55,000
DAM NECKCourthouse Walk A 21,600
Dam Neck Crossing B 138,571
Dam Neck Square A 67,917
General Booth Plaza A 73,320
Red Mill Commons D 586,575
Red Mill Walk B 240,000
Sandbridge SC A 66,800
Strawbridge Marketplace A 172,429
DOWNTOWNChurch Street Crossing A 51,000
MacArthur Center Mall I 1,100,000
Waterside Festival Marketplace I 130,338
GHENT21st Street Pavilion G 21,000
Center Shops A 129,966
Colley Village A 44,585
Farm Fresh H 40,000
Ghent Place G 13,000
Harris Teeter H 27,000
Palace Shops I, II C 71,794
Palace Station G 38,000
The Corner Shops G 21,512
GREAT BRIDGE Cahoon Commons D 215,000
Cedar Lakes Center A 35,396
Centerville Crossing A 55,000
Crossings at Deep Creek A 68,970
Dominion Marketplace A 73,103
Dominion Plaza SC A 63,733
Former Winn Dixie H 50,000
Glenwood Square A 73,859
Great Bridge SC A 158,000
Hanbury Village A 100,560
Harbor Watch Shoppes G 21,505
Las Gaviotas A 82,000
Millwood Plaza G 16,969
Mt. Pleasant Shopping Center A 100,000
Mt. Pleasant Village A 39,970
Wilson Village A 52,500
Woodford Shoppes B 9,760
Woodford Square B 139,623
GREENBRIER / BATTLEFIELD BOULEVARD Battlefield Marketplace G 30,000
Chesapeake Crossing B 287,679
Crossways Center I & Eden Way Shops D 438,725
Crossways II D 152,686
Edinburgh Commons North D 195,111
Edinburgh East D 133,000
Gainsborough Square A 88,862
Greenbrier Mall I 809,017
Greenbrier Market Center D 487,580
Greenbrier South SC A 97,500
Home Depot H 130,060
K-Mart / OfficeMax H 165,000
Knell's Ridge Square G 40,000
Lowes H 114,000
Orchard Square A 88,910
Parkview @ Greenbrier A 83,711
Regal Cinemas H 60,763
The Shoppes at Greenbrier G 40,000
Townplace at Greenbrier C 127,109
Village Square G 15,000
Volvo Parkway SC G 41,874
Walmart Way Crossing G 80,160
Wal-Mart / Sam's Club / Kohl's D 433,821
HILLTOP / GREAT NECK Great Neck Square A 93,887
Great Neck Village A 73,836
Hilltop East C 100,000
Hilltop North B 202,511
Hilltop Plaza B 152,025
Hilltop Square B 270,093
Hilltop West G 60,000
La Promenade C 63,280
Marketplace at Hilltop C 113,000
Regency Hilltop B 236,549
Renaissance Place G 47,667
Target H 122,000
HOLLAND / GREEN RUNAuburn Place A 44,846
Chimney Hill B 207,175
Green Run Square A 60,000
Holland Plaza SC A 165,867
Holland Windsor Crossing (Super K-Mart) B 237,000
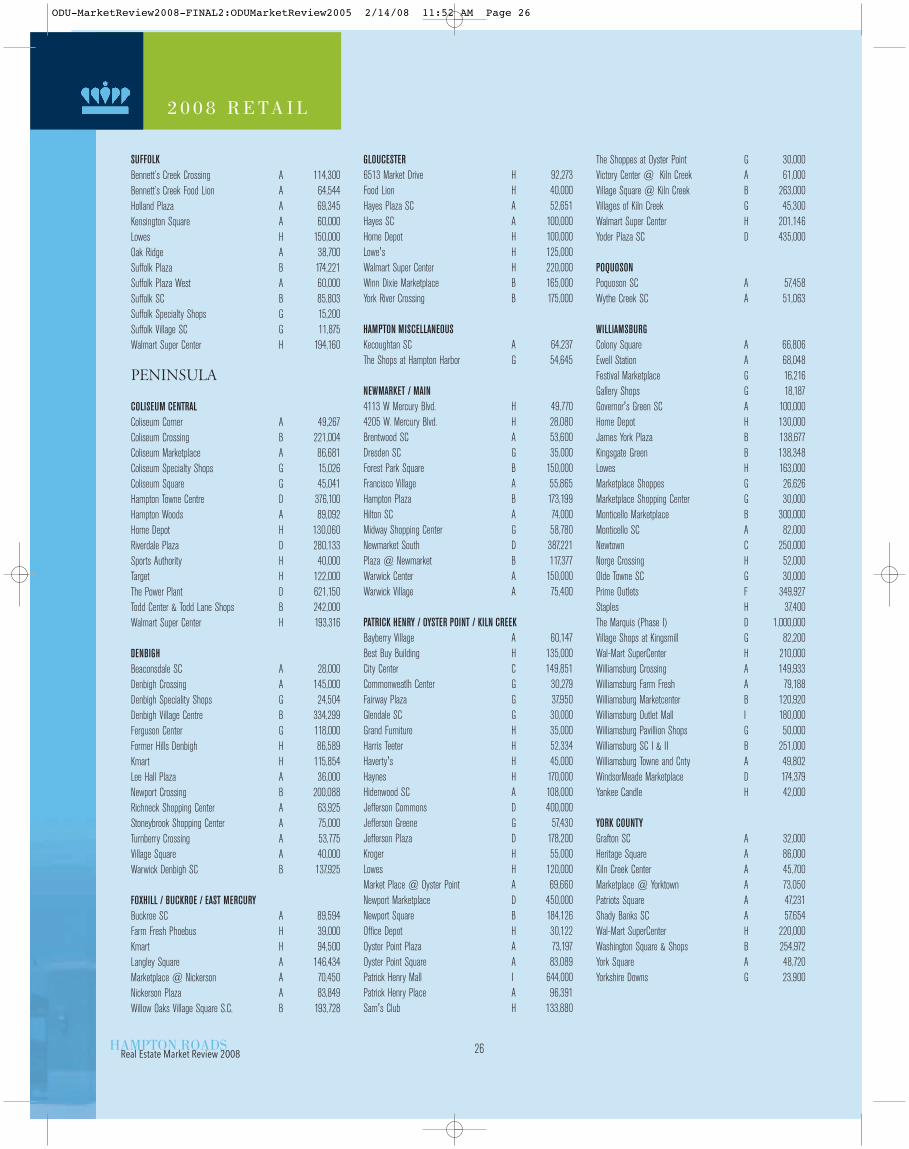
The following is a list of the properties included in this year’ssurvey listed by submarket with a code representing the type ofproperty. The GLA of the property is also listed.
A Neighborhood Center F Outlet CenterB Community Center G OtherC Fashion/Specialty Center H FreestandingD Power Center I MallE Theme Festival
Real Estate Market Review 2008
ODU-MarketReview2008-FINAL2:ODUMarketReview2005 2/14/08 11:52 AM Page 24
25
Lowes H 125,323
Lynnhaven Green A 50,838
Shipps Corner A 63,355
Timberlake SC A 73,500
INDIAN RIVER / COLLEGE PARKCollege Park I & II B 181,902
Indian River Plaza B 126,017
Indian River SC A 123,752
Tidewater Plaza A 50,638
KEMPSVILLE Arrowhead Plaza A 97,006
Fairfield SC B 239,763
Kemps Corner Shoppes G 25,929
Kemps River Center A 62,507
Kemps River Crossing B 245,268
Kempsville Crossing A 111,394
Kempsville Plaza A 60,778
Parkway Marketplace A 26,602
Providence Square SC A 135,915
University Shoppes A 26,100
Woods Corner A 152,314
LITTLE CREEK ROAD / WARDS CORNER / OCEAN VIEWAmes / Kroger B 140,568
Dollar Tree Shopping Center A 51,415
East Beach Shoppes A 63,000
Farm Fresh - Little Creek H 66,000
Glenwood Shoppes A 53,255
Little Creek East SC B 202,338
Little Creek Square A 82,300
Meadowbrook S C G 27,260
Mid-Town SC A 75,768
Mid-Way SC G 31,000
Ocean View SC A 73,658
Roosevelt Gardens SC A 109,175
Southern SC B 258,035
Suburban Park B 127,450
Super Walmart H 225,000
Tidewater I & II SC B 126,212
Wards Corner Strip A 61,540
Wedgewood SC A 130,000
LITTLE NECK Ames Plaza B 177,549
Birchwood SC A 358,635
Home Depot H 130,060
Kroger H 45,000
London Bridge Plaza B 120,000
Lowes H 160,000
Lynnhaven Convenience G 36,100
Lynnhaven Shopping Center B 140,000
Princess Anne Plaza West C 77,558
Regatta Bay Shops G 60,000
Sam's Club Plaza D 248,604
LYNNHAVEN ROAD Lynnhaven Crossing G 55,550
Lynnhaven East B 97,303
Lynnhaven Mall I 1,293,100
Lynnhaven North B 176,254
Lynnshores Shopping Center G 12,692
Lynnway Place G 30,213
Parkway Plaza G 42,000
Walmart H 113,112
MIDDLE PORTSMOUTHAfton SC A 106,500
Airline Center A 69,000
Airline Plaza A 99,549
Elmhurst Square A 45,842
Gilmerton Square G 43,236
Manor Commerce Center G 67,060
Manor Village G 14,573
Olde Towne Market Place A 38,200
Rodman SC A 45,000
Super Walmart H 200,000
Triangle SC G 82,430
Victory Crossing D 445,758
Victory West Shopping Center A 167,102
Williams Court B 214,739
MILITARY HIGHWAY / JANAFBest Square B 140,030
Broad Creek SC D 205,417
Bromley SC A 55,330
CostCo H 110,000
Dump / Mega Office G 115,854
Farm Fresh H 60,000
Food Lion #170 H 41,000
Grand Outlet H 35,000
Janaf D 878,381
Lowes H 115,000
Military Crossing D 195,003
Military Triangle G 10,061
Northampton Business Center
(former 5760 North Hampton Blvd.) G 80,000
Super K-Mart & Shoppes B 200,000
Super Walmart H 224,513
The Gallery @ Military Circle I 856,542
NEWTOWNCypress Plaza SC A 59,012
Cypress Point A 117,958
Diamond Springs Shoppes G 24,000
Newpointe SC A 92,978
Newtown Baker Crossing A 91,687
Newtown Center G 19,876
Newtown Convenience Center G 19,800
Thomas Corner SC G 23,557
Weblin Square G 31,552
ODUUniversity Village G 36,500
PEMBROKEAragona SC A 69,700
Best Buy H 45,000
Bloom Brothers Furniture H 58,000
Circuit City H 38,414
Collins Square A 111,370
Columbus Village East A 63,000
Columbus Village Entertainment Center E 100,000
Dean Plaza (Former HQ) D 140,000
Giant Square B 150,000
Goodwill H 34,000
Haverty's H 55,000
Haygood SC B 160,129
Haynes H 228,000
Hunter's Mill Shoppes G 22,827
Loehmann's Plaza C 139,380
Northern Super Center G 36,588
Pembroke East B 27,200
Pembroke Mall I 570,000
Pembroke Meadows SC A 81,592
Pembroke Place B 165,000
Pembroke Plaza G 34,900
Roomstore H 50,000
The Town Center of Virginia Beach C 260,000
Value City H 95,000
PRINCESS ANNE ROADCourthouse Marketplace A 122,000
Home Depot H 260,000
Kempsville Marketplace A 71,460
Landstown Commons D 500,000
Lynnhaven Square S C G 22,933
Parkway SC A 64,820
Pleasant Valley Marketplace A 86,107
Princess Anne Marketplace B 209,500
Princess One SC A 84,725
Salem Crossing D 392,407
Salem Lakes SC A 37,087
Woodtide SC A 25,500
SMITHFIELDCypress Run SC G 25,000
Eagle Harbor A 77,400
Smithfield Plaza B 89,120
Smithfield Square A 65,244
ODU-MarketReview2008-FINAL2:ODUMarketReview2005 2/14/08 11:52 AM Page 25
SUFFOLKBennett’s Creek Crossing A 114,300
Bennett’s Creek Food Lion A 64,544
Holland Plaza A 69,345
Kensington Square A 60,000
Lowes H 150,000
Oak Ridge A 38,700
Suffolk Plaza B 174,221
Suffolk Plaza West A 60,000
Suffolk SC B 85,803
Suffolk Specialty Shops G 15,200
Suffolk Village SC G 11,875
Walmart Super Center H 194,160
PENINSULA
COLISEUM CENTRALColiseum Corner A 49,267
Coliseum Crossing B 221,004
Coliseum Marketplace A 86,681
Coliseum Specialty Shops G 15,026
Coliseum Square G 45,041
Hampton Towne Centre D 376,100
Hampton Woods A 89,092
Home Depot H 130,060
Riverdale Plaza D 280,133
Sports Authority H 40,000
Target H 122,000
The Power Plant D 621,150
Todd Center & Todd Lane Shops B 242,000
Walmart Super Center H 193,316
DENBIGHBeaconsdale SC A 28,000
Denbigh Crossing A 145,000
Denbigh Speciality Shops G 24,504
Denbigh Village Centre B 334,299
Ferguson Center G 118,000
Former Hills Denbigh H 86,589
Kmart H 115,854
Lee Hall Plaza A 36,000
Newport Crossing B 200,088
Richneck Shopping Center A 63,925
Stoneybrook Shopping Center A 75,000
Turnberry Crossing A 53,775
Village Square A 40,000
Warwick Denbigh SC B 137,925
FOXHILL / BUCKROE / EAST MERCURYBuckroe SC A 89,594
Farm Fresh Phoebus H 39,000
Kmart H 94,500
Langley Square A 146,434
Marketplace @ Nickerson A 70,450
Nickerson Plaza A 83,849
Willow Oaks Village Square S.C. B 193,728
GLOUCESTER6513 Market Drive H 92,273
Food Lion H 40,000
Hayes Plaza SC A 52,651
Hayes SC A 100,000
Home Depot H 100,000
Lowe's H 125,000
Walmart Super Center H 220,000
Winn Dixie Marketplace B 165,000
York River Crossing B 175,000
HAMPTON MISCELLANEOUSKecoughtan SC A 64,237
The Shops at Hampton Harbor G 54,645
NEWMARKET / MAIN4113 W Mercury Blvd. H 49,770
4205 W. Mercury Blvd. H 28,080
Brentwood SC A 53,600
Dresden SC G 35,000
Forest Park Square B 150,000
Francisco Village A 55,865
Hampton Plaza B 173,199
Hilton SC A 74,000
Midway Shopping Center G 58,780
Newmarket South D 387,221
Plaza @ Newmarket B 117,377
Warwick Center A 150,000
Warwick Village A 75,400
PATRICK HENRY / OYSTER POINT / KILN CREEK Bayberry Village A 60,147
Best Buy Building H 135,000
City Center C 149,851
Commonweatlh Center G 30,279
Fairway Plaza G 37,950
Glendale SC G 30,000
Grand Furniture H 35,000
Harris Teeter H 52,334
Haverty's H 45,000
Haynes H 170,000
Hidenwood SC A 108,000
Jefferson Commons D 400,000
Jefferson Greene G 57,430
Jefferson Plaza D 178,200
Kroger H 55,000
Lowes H 120,000
Market Place @ Oyster Point A 69,660
Newport Marketplace D 450,000
Newport Square B 184,126
Office Depot H 30,122
Oyster Point Plaza A 73,197
Oyster Point Square A 83,089
Patrick Henry Mall I 644,000
Patrick Henry Place A 96,391
Sam's Club H 133,880
The Shoppes at Oyster Point G 30,000
Victory Center @ Kiln Creek A 61,000
Village Square @ Kiln Creek B 263,000
Villages of Kiln Creek G 45,300
Walmart Super Center H 201,146
Yoder Plaza SC D 435,000
POQUOSONPoquoson SC A 57,458
Wythe Creek SC A 51,063
WILLIAMSBURGColony Square A 66,806
Ewell Station A 68,048
Festival Marketplace G 16,216
Gallery Shops G 18,187
Governor's Green SC A 100,000
Home Depot H 130,000
James York Plaza B 138,677
Kingsgate Green B 138,348
Lowes H 163,000
Marketplace Shoppes G 26,626
Marketplace Shopping Center G 30,000
Monticello Marketplace B 300,000
Monticello SC A 82,000
Newtown C 250,000
Norge Crossing H 52,000
Olde Towne SC G 30,000
Prime Outlets F 349,927
Staples H 37,400
The Marquis (Phase I) D 1,000,000
Village Shops at Kingsmill G 82,200
Wal-Mart SuperCenter H 210,000
Williamsburg Crossing A 149,933
Williamsburg Farm Fresh A 79,188
Williamsburg Marketcenter B 120,920
Williamsburg Outlet Mall I 180,000
Williamsburg Pavillion Shops G 50,000
Williamsburg SC I & II B 251,000
Williamsburg Towne and Cnty A 49,802
WindsorMeade Marketplace D 174,379
Yankee Candle H 42,000
YORK COUNTYGrafton SC A 32,000
Heritage Square A 86,000
Kiln Creek Center A 45,700
Marketplace @ Yorktown A 73,050
Patriots Square A 47,231
Shady Banks SC A 57,654
Wal-Mart SuperCenter H 220,000
Washington Square & Shops B 254,972
York Square A 48,720
Yorkshire Downs G 23,900
2 0 0 8 R E TA I L
26HAMPTON ROADSReal Estate Market Review 2008
ODU-MarketReview2008-FINAL2:ODUMarketReview2005 2/14/08 11:52 AM Page 26