Embed Size (px)
Citation preview

FOR ADVISOR USE ONLY
Alex Bellefleur, M.Ec., CFA Chief Economist and Strategist Mackenzie Multi-Asset Strategies Team
Regional Equity Indices
31-Dec-18 Index Level 29-Mar-19
Total Return* 31-Dec-18 29-Mar-19 YTD Price Return YTD Total Return*
S&P/TSX -8.9% 14,322.86 16,102.09 12.4% 13.3%
Dow Jones Industrial -3.5% 23,327.46 25,928.68 11.2% 11.8%
S&P 500 -4.4% 2,506.85 2,834.40 13.1% 13.6%
Nasdaq -2.8% 6,635.28 7,729.32 16.5% 16.8%
MSCI All Country World -9.0% 455.66 508.55 11.6% 12.3%
MSCI Europe -10.1% 114.20 127.91 12.0% 13.0%
MSCI EAFE -13.4% 1,719.88 1,875.43 9.0% 10.1%
MSCI Emerging Markets Index -14.3% 965.78 1,058.13 9.6% 9.9%
Currencies 31-Dec-18 29-Mar-19 % Change
CAD/USD 0.73 0.75 2.2%
CAD/EUR 0.64 0.67 4.4%
EUR/USD 1.15 1.12 -2.2%
GBP/USD 1.28 1.30 2.2%
USD/JPY 109.69 110.86 1.1%
Bond Yields 31-Dec-18 29-Mar-19 bps Change
10 yr Canada Govt. 1.97% 1.62% -35
10 yr U.S. Treasury 2.68% 2.41% -28
10 yr Germany Govt. 0.24% -0.07% -31
10 yr Japan Govt. 0.00% -0.08% -8
30 yr Canada Govt. 2.18% 1.89% -29
30 yr U.S. Treasury 3.01% 2.81% -20
Commodities 31-Dec-18 29-Mar-19 % Change
Gold USD/oz. 1,282.45 1,292.30 0.8%
Oil USD/bbl. 45.41 60.14 32.4%
Source: Bloomberg. Index returns are in local currency. *Total return is price return plus re-investment of dividends
MARKET REVIEW: Q1 2019

2 Market Review: Q1 2019 | FOR ADVISOR USE ONLY
The S&P/TSX gained 13.3% in the first quarter of 2019. This followed an 11% decline in the fourth quarter of 2018 and represented the TSX’s best quarter since 2000. Interestingly, cannabis stocks represented six of the TSX’s ten best performers in the first quarter. Canadian equities appear to have benefited from the perceived shift to a more dovish stance by global central banks, including the Bank of Canada. This boosted the market’s forward-looking assessment of prospects for Canadian companies.
S&P/TSX Composite Index – for the YTD March 31, 2019
13,000
14,000
15,000
16,000
17,000
Mar. 2019Feb. 2019Jan. 2019Dec. 2018
16,102
16,251
14,213
14,323
Source: Bloomberg
S&P/TSX Composite Index – for the 10 years ending December 31, 2018
5,000
8,000
11,000
14,000
17,000
20,000
Dec. 2018Dec. 2017Dec. 2016Dec. 2015Dec. 2014Dec. 2013Dec. 2012Dec. 2011Dec. 2010Dec. 2009Dec. 2008
14,323
7,567
16,567
8,988
Source: Bloomberg
CANADIAN EQUITIES

3 Market Review: Q1 2019 | FOR ADVISOR USE ONLY
The Energy sector rose by 15.6%, helped by the significant advance in crude oil prices during the first quarter. Western Canada Select spot oil crude oil prices rose from under $30/barrel to over $50/barrel, helping to close some of the price gap with West Texas Intermediate which had opened up during 2018. This benefited Canadian Energy sector equities. The Industrials sector also did well, with a gain of 15.3% during the quarter. This cyclical sector did well in response to the central bank shift to a more accommodative stance, helping it to recover from a poor 2018.
S&P/TSX Returns by Sector
-20
-10
0
10
20
30
40
50
60
S&P/TSX Composite
IndexHealth Care IT Real Estate Utilities Energy Industrials
Cons. Staples Financials
Telecom Services Cons.Disc. Materials
YTD 2019 13.3 49.1 26.0 17.5 16.1 15.6 15.3 10.6 10.4 10.0 9.8 8.5
FY 2018 -8.9 -15.9 13.0 2.0 -8.9 -18.3 -2.4 2.0 -9.3 -0.8 -16.0 -9.3
Source: Bloomberg. FY 2018 - for the 1 year ending December 31, 2018; YTD 2019 - for the year to date ending March 31, 2019

4 Market Review: Q1 2019 | FOR ADVISOR USE ONLY
The S&P 500 gained 13.7% in the first quarter. There were continued signs of a slowdown in U.S. economic growth throughout the quarter. However, the equity market was comforted by the Federal Reserve’s shift to a more accommodative stance. Comments by Federal Reserve Chair Jerome Powell suggesting that the central bank would adopt a “patient” approach reinforced the market’s view of the likelihood of a soft landing in the economy and in corporate earnings. Growing expectations of a looming trade deal between the U.S. and China appeared to help U.S. equities’ performance in Q1. As a result, cyclical sectors, such as Information Technology (+19.9%) or Industrials (+17.2%), did particularly well during the quarter.
S&P 500 Returns by Sector
-20
-11
-2
7
16
25
S&P500 ITReal
Estate Industrials EnergyCons. Disc.
Telecom Services
Cons. Staples Utilities Materials Financials
Health Care
YTD 2019 13.6 19.9 17.5 17.2 16.4 15.7 14.0 12.0 10.8 10.3 8.6 6.6
FY 2018 -4.4 -0.3 -2.2 -13.3 -18.1 0.8 -12.6 -8.4 4.1 -14.7 -13.0 6.5
Source: Bloomberg FY 2018 - for the 1 year ending December 31, 2018; YTD 2019 - for the year to date ending March 31, 2019
S&P 500 Index – for the YTD March 31, 2019
2,200
2,600
3,000
Mar. 2019Feb. 2019Jan. 2019Dec. 2018
2,834
2,448
2,855
2,507
Source: Bloomberg
U.S. EQUITIES

5 Market Review: Q1 2019 | FOR ADVISOR USE ONLY
U.S. small-capitalization equities also performed well, with the Russell 2000 gaining 14.1%. The cyclicality of small-cap stocks was a positive factor in Q1, helping the asset class recoup some of the losses incurred during a difficult 2018.
Dow Jones Index – for the YTD March 31, 2019
21,000
24,000
27,000
Mar. 2019Feb. 2019Jan. 2019Dec. 2018
25,929
22,686
26,092
23,327
Source: Bloomberg
Nasdaq Index – for the YTD March 31, 2019
6,000
7,000
8,000
Mar. 2019Feb. 2019Jan. 2019Dec. 2018
7,729
6,464
7,839
6,635
Source: Bloomberg
Russell 2000 Index – for the YTD March 31, 2019
1,000
1,500
2,000
Mar. 2019Feb. 2019Jan. 2019Dec. 2018
1,540
1,331
1,590
1,349
Source: Bloomberg
6 Market Review: Q1 2019 | FOR ADVISOR USE ONLY
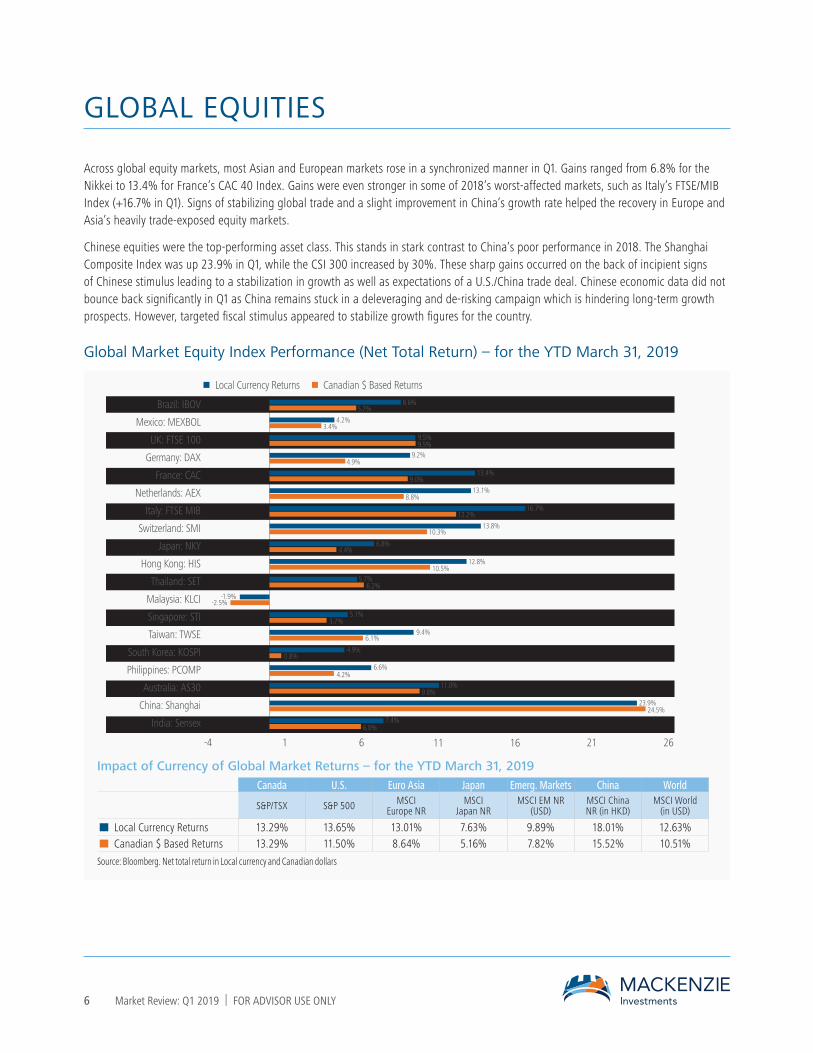
Across global equity markets, most Asian and European markets rose in a synchronized manner in Q1. Gains ranged from 6.8% for the Nikkei to 13.4% for France’s CAC 40 Index. Gains were even stronger in some of 2018’s worst-affected markets, such as Italy’s FTSE/MIB Index (+16.7% in Q1). Signs of stabilizing global trade and a slight improvement in China’s growth rate helped the recovery in Europe and Asia’s heavily trade-exposed equity markets.
Chinese equities were the top-performing asset class. This stands in stark contrast to China’s poor performance in 2018. The Shanghai Composite Index was up 23.9% in Q1, while the CSI 300 increased by 30%. These sharp gains occurred on the back of incipient signs of Chinese stimulus leading to a stabilization in growth as well as expectations of a U.S./China trade deal. Chinese economic data did not bounce back significantly in Q1 as China remains stuck in a deleveraging and de-risking campaign which is hindering long-term growth prospects. However, targeted fiscal stimulus appeared to stabilize growth figures for the country.
Global Market Equity Index Performance (Net Total Return) – for the YTD March 31, 2019
-4 1 6 11 16 21 26
India: Sensex
China: Shanghai
Australia: AS30
Philippines: PCOMP
South Korea: KOSPI
Taiwan: TWSE
Singapore: STI
Malaysia: KLCI
Thailand: SET
Hong Kong: HIS
Japan: NKY
Switzerland: SMI
Italy: FTSE MIB
Netherlands: AEX
France: CAC
Germany: DAX
UK: FTSE 100
Mexico: MEXBOL
Brazil: IBOV 8.6%5.7%
4.2%3.4%
9.5%9.5%
13.4%9.0%
13.1%8.8%
16.7%12.2%
13.8%10.3%
6.8%4.4%
12.8%10.5%
5.7%6.2%
-1.9%-2.5%
5.1%3.7%
9.4%6.1%
4.9%0.8%
6.6%4.2%
11.0%9.8%
7.4%6.0%
23.9%24.5%
9.2%4.9%
Local Currency Returns Canadian $ Based Returns
Impact of Currency of Global Market Returns – for the YTD March 31, 2019Canada U.S. Euro Asia Japan Emerg. Markets China World
S&P/TSX S&P 500 MSCI Europe NR
MSCI Japan NR
MSCI EM NR (USD)
MSCI China NR (in HKD)
MSCI World (in USD)
Local Currency Returns 13.29% 13.65% 13.01% 7.63% 9.89% 18.01% 12.63% Canadian $ Based Returns 13.29% 11.50% 8.64% 5.16% 7.82% 15.52% 10.51%
Source: Bloomberg. Net total return in Local currency and Canadian dollars
GLOBAL EQUITIES
7 Market Review: Q1 2019 | FOR ADVISOR USE ONLY
INTEREST RATES
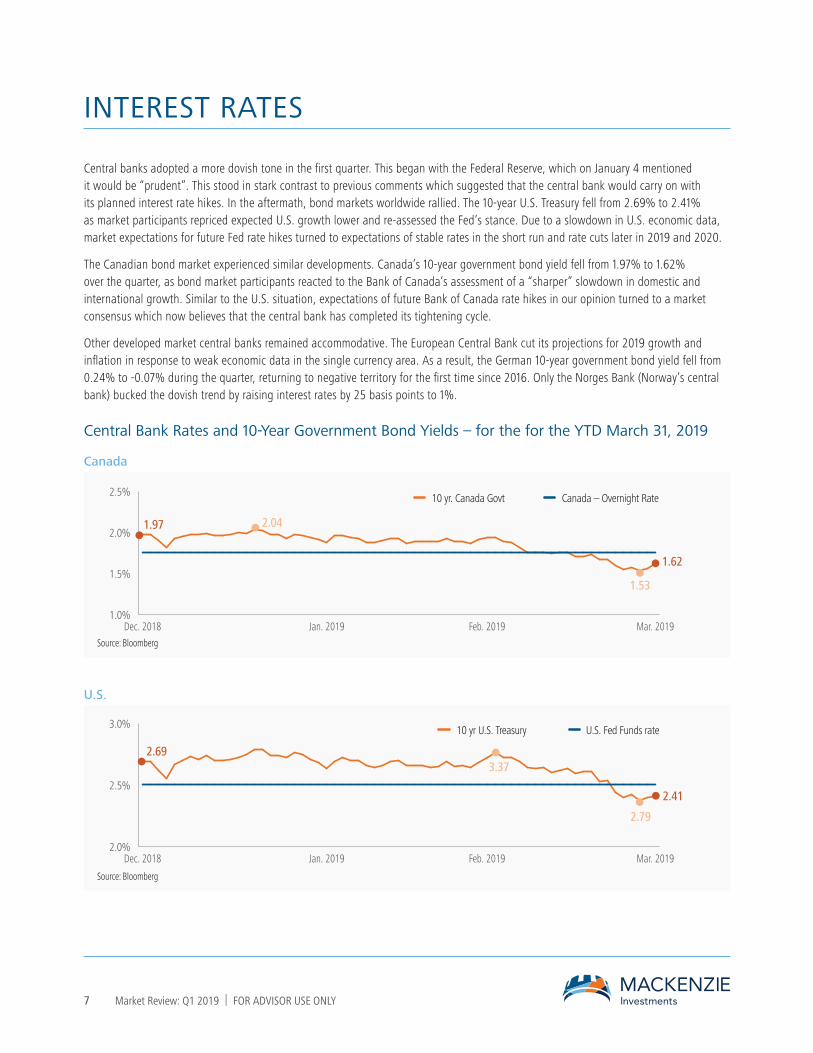
Central banks adopted a more dovish tone in the first quarter. This began with the Federal Reserve, which on January 4 mentioned it would be “prudent”. This stood in stark contrast to previous comments which suggested that the central bank would carry on with its planned interest rate hikes. In the aftermath, bond markets worldwide rallied. The 10-year U.S. Treasury fell from 2.69% to 2.41% as market participants repriced expected U.S. growth lower and re-assessed the Fed’s stance. Due to a slowdown in U.S. economic data, market expectations for future Fed rate hikes turned to expectations of stable rates in the short run and rate cuts later in 2019 and 2020.
The Canadian bond market experienced similar developments. Canada’s 10-year government bond yield fell from 1.97% to 1.62% over the quarter, as bond market participants reacted to the Bank of Canada’s assessment of a “sharper” slowdown in domestic and international growth. Similar to the U.S. situation, expectations of future Bank of Canada rate hikes in our opinion turned to a market consensus which now believes that the central bank has completed its tightening cycle.
Other developed market central banks remained accommodative. The European Central Bank cut its projections for 2019 growth and inflation in response to weak economic data in the single currency area. As a result, the German 10-year government bond yield fell from 0.24% to -0.07% during the quarter, returning to negative territory for the first time since 2016. Only the Norges Bank (Norway’s central bank) bucked the dovish trend by raising interest rates by 25 basis points to 1%.
Central Bank Rates and 10-Year Government Bond Yields – for the for the YTD March 31, 2019
Canada
1.0%
1.5%
2.0%
2.5%
Mar. 2019Feb. 2019Jan. 2019Dec. 2018
10 yr. Canada Govt Canada – Overnight Rate
1.62
1.53
2.041.97
Source: Bloomberg
U.S.
10 yr U.S. Treasury U.S. Fed Funds rate
2.0%
2.5%
3.0%
Mar. 2019Feb. 2019Jan. 2019Dec. 2018
2.41
3.37
2.79
2.69
Source: Bloomberg

8 Market Review: Q1 2019 | FOR ADVISOR USE ONLY
Central Bank Rates
Australia
USA (Upper Range)
Canada
England
ECB0.0%
0.5%
1.0%
1.5%
2.0%
2.5%
3.0%
Mar. 2019Feb. 2019Jan. 2019Dec. 2018Source: Bloomberg
10-Year Government Bond Yields
US
Cana
da
Mex
ico (U
SD)
Americas Europe Asia
Germ
any
Brita
in
Fran
ce Italy
Spai
n
Gree
ce
Switz
erla
nd
Japa
n
Austr
alia
New
Zeal
and
Hong
kong
Sout
h Ko
rea
Indi
a
Mar. 2019Dec. 2018
-1.0%
1.0%
3.0%
5.0%
7.0%
9.0%
Source: Bloomberg
9 Market Review: Q1 2019 | FOR ADVISOR USE ONLY
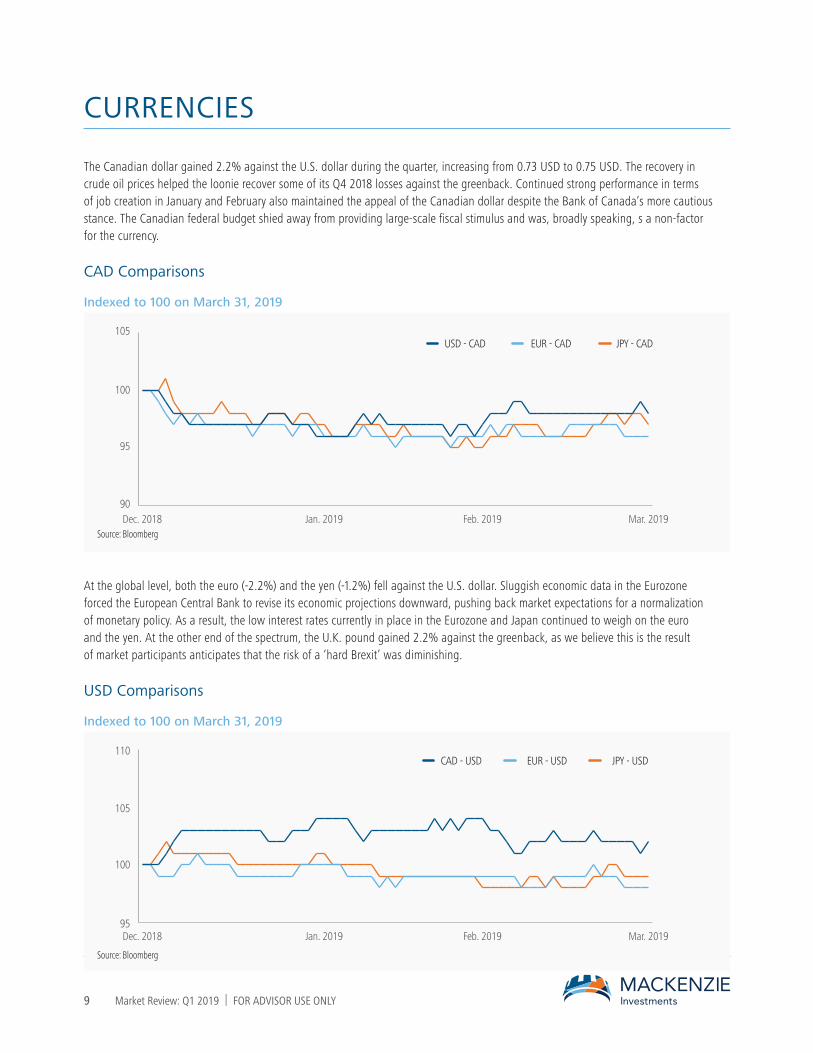
The Canadian dollar gained 2.2% against the U.S. dollar during the quarter, increasing from 0.73 USD to 0.75 USD. The recovery in crude oil prices helped the loonie recover some of its Q4 2018 losses against the greenback. Continued strong performance in terms of job creation in January and February also maintained the appeal of the Canadian dollar despite the Bank of Canada’s more cautious stance. The Canadian federal budget shied away from providing large-scale fiscal stimulus and was, broadly speaking, s a non-factor for the currency.
CAD Comparisons
Indexed to 100 on March 31, 2019
USD - CAD EUR - CAD JPY - CAD
90
95
100
105
Mar. 2019Feb. 2019Jan. 2019Dec. 2018Source: Bloomberg
At the global level, both the euro (-2.2%) and the yen (-1.2%) fell against the U.S. dollar. Sluggish economic data in the Eurozone forced the European Central Bank to revise its economic projections downward, pushing back market expectations for a normalization of monetary policy. As a result, the low interest rates currently in place in the Eurozone and Japan continued to weigh on the euro and the yen. At the other end of the spectrum, the U.K. pound gained 2.2% against the greenback, as we believe this is the result of market participants anticipates that the risk of a ‘hard Brexit’ was diminishing.
USD Comparisons
Indexed to 100 on March 31, 2019
CAD - USD EUR - USD JPY - USD
95
100
105
110
Mar. 2019Feb. 2019Jan. 2019Dec. 2018
Source: Bloomberg
CURRENCIES
10 Market Review: Q1 2019 | FOR ADVISOR USE ONLY
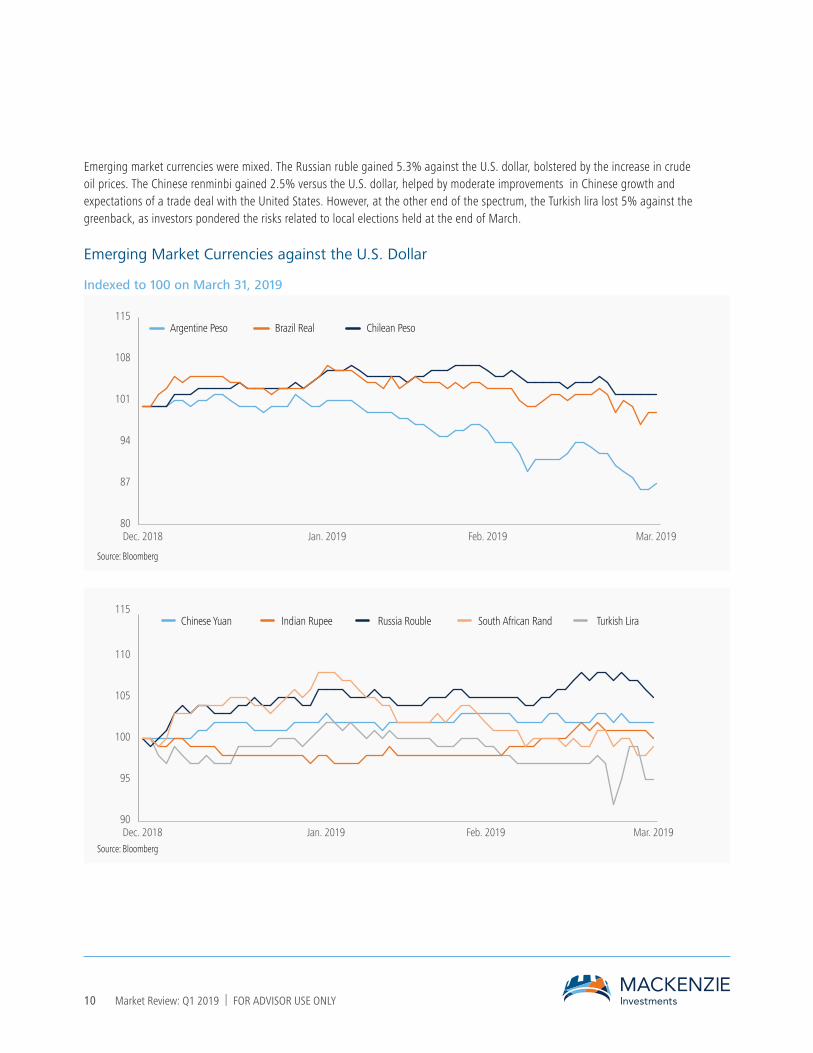
Emerging market currencies were mixed. The Russian ruble gained 5.3% against the U.S. dollar, bolstered by the increase in crude oil prices. The Chinese renminbi gained 2.5% versus the U.S. dollar, helped by moderate improvements in Chinese growth and expectations of a trade deal with the United States. However, at the other end of the spectrum, the Turkish lira lost 5% against the greenback, as investors pondered the risks related to local elections held at the end of March.
Emerging Market Currencies against the U.S. Dollar
Indexed to 100 on March 31, 2019
Chilean PesoBrazil RealArgentine Peso
80
87
94
101
108
115
Mar. 2019Feb. 2019 Jan. 2019Dec. 2018
Source: Bloomberg
Turkish LiraSouth African RandRussia RoubleIndian RupeeChinese Yuan
90
95
100
105
110
115
Mar. 2019Feb. 2019Jan. 2019Dec. 2018Source: Bloomberg

11 Market Review: Q1 2019 | FOR ADVISOR USE ONLY
COMMODITIES
The Bloomberg Commodity Index gained 5.7% during the first quarter. This increase reflects a perceived improvement in China’s growth rate, as commodities remain heavily tied to Chinese demand. Meanwhile, the central bank shift to a more dovish stance helped alleviate certain fears about the global economy, helping commodity prices recover.
Bloomberg Commodity Index – for the for the YTD March 31, 2019
70.0
82.5
95.0
Mar. 2019Feb. 2019Jan. 2019Dec. 2018
81.1
76.7
82.4
Source: Bloomberg
Crude oil gained 32.4% during the quarter. This happened following steep price declines in the fourth quarter of 2018. A reduction in oil inventories across certain countries as well as discipline by OPEC member producing countries helped contain supply. On the demand side, we believe market participants were encouraged by what was perceived as a stabilization in China.
Crude Oil – for the for the YTD March 31, 2019
40
55
70
Mar. 2019Feb. 2019Jan. 2019Dec. 2018
60.1
45.4
Source: Bloomberg
Gold Bullion – for the for the YTD March 31, 2019
1,200
1,300
1,400
Mar. 2019Feb. 2019Jan. 2019Dec. 2018
1,2921,282
1,341
1,276
Source: Bloomberg
9473
96
MF3
003
4/19
FOR ADVISOR USE ONLY. No portion of this communication may be reproduced or distributed to the public as it does not comply with investor sales communication rules. Mackenzie disclaims any responsibility for any advisor sharing this with investors. Commissions, trailing commissions, management fees and expenses all may be associated with mutual fund investments. Please read the prospectus before investing. Mutual funds are not guaranteed, their values change frequently and past performance may not be repeated. This document may contain forward-looking information which reflect our or third party current expectations or forecasts of future events. Forward-looking information is inherently subject to, among other things, risks, uncertainties and assumptions that could cause actual results to differ materially from those expressed herein. These risks, uncertainties and assumptions include, without limitation, general economic, political and market factors, interest and foreign exchange rates, the volatility of equity and capital markets, business competition, technological change, changes in government regulations, changes in tax laws, unexpected judicial or regulatory proceedings and catastrophic events. Please consider these and other factors carefully and not place undue reliance on forward-looking information. The forward-looking information contained herein is current only as of March 29, 2019. There should be no expectation that such information will in all circumstances be updated, supplemented or revised whether as a result of new information, changing circumstances, future events or otherwise.
The content of this Commentary (including facts, views, opinions, recommendations, descriptions of or references to, products or securities) is not to be used or construed as investment advice, as an offer to sell or the solicitation of an offer to buy, or an endorsement, recommendation or sponsorship of any entity or security cited. Although we endeavour to ensure its accuracy and completeness, we assume no responsibility for any reliance upon it.