Embed Size (px)
DESCRIPTION
This is a Market Research Project on "Why Some TV Commercials are better than the others?"
Citation preview
P a g e | 1
MARKET RESEARCH REPORT
M A R K E T R E S E A R C H
by Prof. S. Bharadwaj
T E R M – I I I / P R O J E C T R E P O R T
P G D M [ 2 0 1 3 – 1 5 ]
WHY SOME TV COMMERCIALS
ARE MORE POPULAR THAN
OTHERS
GROUP II
MALHAR LAKDAWALA [DM 15129]
NIDHI AGARWAL [DM15132]
RISHI RAJ [DM15141]
ROHIT KUMAR GOEL [DM15142]
S. RUKMANI [DM15144]
SHIVENDRA SINGH [DM15152]
P a g e | 2
MARKET RESEARCH REPORT
CONTENTS
S.NO. TITLE PAGE NO.
I ABSTRACT 3
II INTRODUCTION 4
III LITERATURE REVIEW 5
IV HYPOTHESES 6
V METHODOLOGY 7
VI SAMPLING METHOD 12
VII DATA ANALYSIS 16
VIII RESULTS 28
IX REFERENCES 29
X APPENDIX 30
P a g e | 3
MARKET RESEARCH REPORT
I. ABSTRACT
This research looks at the reasons why certain television commercials become more
popular than certain others. This paper lists down and analyses the various factors
and appeals behind popularity of television commercials.
In the present scenario, the television is flooded with commercials, but there are
certain ones that attract people more. Also, in a highly competitive market, it is
common practice for companies to go for commercials that are unique, innovative
and against the tradition. Yet it is often seen that such campaigns fail. And there
are some other companies whose advertisements gain popularity without having
any special or unique element.
The aim of this research project is to analyse and understand the reason for this
selective popularity and ultimately zero in on the factors that the popularity of a
television commercial depends on. Understanding these factors is essential as it
can help marketers decide which aspects of a television commercial to focus and
determine what kinds of advertising campaigns are likely be more effective and
popular.
P a g e | 4
MARKET RESEARCH REPORT
II. INTRODUCTION
Television commercials are one of the biggest medium of reaching out to consumers in
a mass format. All advertisers and agencies dream of coming up with that one campaign
or slogan that will be remembered for generations. In their lifetime, people see
thousands of television commercials but only some become popular and memorable.
For instance, even age-old commercials of brands like Fevicol, Nirma, Surf Excel etc.
are still widely remembered; they were very catchy and extremely popular among
Indian audiences.
It is interesting to see how clever and beautiful advertisements companies come up
with to promote themselves through their campaigns. There are several approaches
followed by companies to make their advertising campaigns effective and their
television commercials popular. And these strategies and approaches have seen
changing and evolving trends since the beginning of time. Over the years, companies
and brands launching these commercials have been developing a far more ‘risky’
approach which has brought the whole market closer to the edge of advertising
brilliance.
Besides hard work, there are usually four key elements in all the popular
advertisements:
Disruptive and relevant visual
Strong brand identification
A brilliant headline
“Something else”
This something else is a variable. This research project intends to determine what the
factors which collectively form this variable are. Over the course of our research, we
aim to understand the various drivers behind the popularity of a television commercial
and chalk out definite factors that determine a commercial’s popularity.
Why some advertisements become more popular than some others? The objective of
this research is to answer this question by seeking to systematically discover
commonalities among popular television commercials. By understanding the shared
characteristics of popular advertisements, one can understand why certain
advertisements become widely successful.
P a g e | 5
MARKET RESEARCH REPORT
III. LITERATURE REVIEW
In the paper ‘An Experimental Study on the Relationship between Consumer
Involvement and Advertising Effectiveness’, the research was conducted to find out
the factors that leads to effective TV Commercial strategies. The study reviewed
consumer perceptions of TV commercial content by conducting focus group
discussions. Respondents were selected using random sampling for conducting survey.
The research was conducted on TV commercials that required customer’s high
involvement, medium involvement and low involvement. The research found out that,
the level of consumer involvement in an advertisement was related to the effective
advertising of a product. One of the findings was that, for the high involvement product
such as automobiles the product information which satisfies the consumer knowledge
requirement is an important factor for effective advertising.
In the paper ‘Infomercials and advertising effectiveness: And empirical study – Brett
A. S. Martin, Andrew C. Bhimy, Tom Agee’ , the purpose of the study was to examine
what features of an advertisement influence consumers to consider the advertisement
as interesting, entertaining, helpful and worth watching. The data for the research was
collected by means of a survey sent to 2670 customers. The survey focused on questions
covering perceptions of advertising effectiveness and how often the respondent watches
advertisements. The research found out that the advertisements were seen as effective
by consumers who valued product demonstration & comparison and bonus offers in the
advertisements.
A Research paper on “The Effects of Length, Content, and Repetition on Television
Commercial Effectiveness”, presented by Surendra N. Singh and Catherine A. Cole in
the Journal of Marketing Research compared the length per se effect of fifteen second
ads and 30 second ads with different message appeals (informational and emotional).
They find that informational commercials both 15 seconds and 30 seconds have same
effect whereas emotional 30 second have more effect than 15 seconds in gaining the
viewer’s attention.
C. Whan Park & Mark Young in their research paper, “Consumer Response to
Television Commercials: The Impact of Involvement and Background Music on Brand
Attitude Formation” have presented that high involvement can be differentiated into
two types (cognitive vs. affective). By manipulating involvement level and type (low
involvement, cognitive involvement, affective involvement), they have examined how
music, as a peripheral persuasion cue, affects the process of brand attitude formation.
The article talks about brand formation but during the experiment they used Television
commercials background music to examine the brand attitude formation.
A paper by Heath in the Advertising Research Foundation (ARF) in a white paper in
2006, has defined engagement i.e. “engagement is turning on a prospect to a brand idea
enhanced by the surrounding context”. In this paper, the authors defined level of
attention as the amount of conscious thinking directed at an advertisement at any
particular time. The study found that attitudes can be changed without active conscious
processing, the level of engagement a consumer has with advertising will be entirely

P a g e | 6
MARKET RESEARCH REPORT
dictated by the amount of feeling or emotion being used. The stated TV advertising can
be highly effective when it communicates creative values and ideas through emotional
content.

P a g e | 7
MARKET RESEARCH REPORT
IV. HYPOTHESIS
H1A: There is no difference between the engagement levels of the audience, while
seeing an ad which is emotionally pitched or informatively pitched.
H1B: There is difference between the engagement levels of the audience, while seeing
an ad which is emotionally pitched or informatively pitched.
H2A: The engagement level of the viewer is indifferent for a 15sec ad and for a 30
sec ad
H2B: The engagement level of the viewer is different for a 15sec ad and for a 30 sec
ad
H3A: The mismatch between the message conveyed in the ad and the Brand
Personality does not affect the engagement level of the viewers.
H3B: The mismatch between the message conveyed in the ad and the Brand
Personality does affect the engagement level of the viewers.
H4A: Background music has no impact on engagement level of audience
H4B: Background music has impact on engagement level of audience
P a g e | 8
MARKET RESEARCH REPORT
V. METHODOLOGY
The Sample
Respondents were majorly from Great Lakes Institute of Management.
Data Collection Method
To conduct the study, primary data was used to analyse the preference of attributes on
viewers in making a TV Commercial more popular. Primary data was collected by using
a focus-group discussion and experimental survey.
Research Instrument
The experimental survey based questionnaire was divided into four sections:
information v/s emotional pitch, length of TV commercial, TV commercial message
mismatch and background music – factors that drive TV commercial popularity.
Data Analysis
Descriptive analysis was used to analyse the background as well as the respondents’
profiles pertaining to their evaluation of brand loyalty.
Focus Group Discussion
We did a focus group discussion on why some TV commercials were more popular than
others. We had 5 members participating in the discussion with Nidhi as the moderator.
We announced the topic under consideration and Nidhi made sure the group did not go
off track. There were times when the discussion drifted to what advertisements the
participants liked but the group was quickly brought back on track. The participants in
this focus group discussion were:
1. Abhineet
2. Kaushal
3. Sriram
4. Sumitabh
5. Swati
As the discussion proceeded, the members were probed further whenever they seemed
to run out of points. This helped in bringing in new perspectives to the matter. Thus a
more detailed analysis of what aspects of popular advertisements impacted the people
could be made.
P a g e | 9
MARKET RESEARCH REPORT
A brief of the group discussion is described below:
ABHINEET
He looked at two different aspects of advertisements:
1. The emotional appeal
2. The humor appeal
KAUSHAL
The following were the factors that he considered as important in making an
advertisement popular:
1. Advertisements that give you a patriotic feel
2. Music
3. Catchy taglines
4. Competing or rival advertisements like Pepsi vs Coca Cola and Oreo vs
KitKat
SRIRAM
According to him,
1. Advertisements that cause an emotional attachment
2. Humor
3. Celebrities
4. Animated characters
5. Corporate Social Responsibility based advertisements
He felt that though the competing advertisements concept that was suggested by
Kaushal was a subtle way of putting across the message, it cannot really be
appreciated.
SUMITABH
He felt that the following factors caused the popularity of the advertisements:
1. Ads with a twist – an element of surprise
2. Music
3. Timing or the context when the advertisement was released
4. Visualization
5. Any ad that targets the empowerment of youth
SWATI
Swati’s opinion in this matter was:
1. Anything unique or different that catches your attention. But cannot be too out
of the world like the Axe Effect ad.
P a g e | 10
MARKET RESEARCH REPORT
2. The intention must have come out clearly.
Following this 20 minute focus group discussion, we narrowed the possible factors
down to five factors that are responsible for the popularity of certain television
commercials:
1. Emotional appeal
2. Comical element
3. Element of surprise
4. Rational justification
5. Visual appeal
6. Memorable Jingles
7. Use of celebrities/iconic characters
Quantitative Research Instrument
To measure the popularity of television commercials, we conducted an experiment
where we have chosen the engagement level of audience as our dependent variable (in
terms of measuring popularity) and emotional appeal, informative appeal, duration of
commercial, background music and message mismatch as our independent variables.
For the experiment, we formed two sets of questionnaire. While the first set had
advertisements that were good representations of the four independent variables, the
second one had the bad advertisements. The sample population was also divided into
two. While one half got the first questionnaire, the second half got the other
questionnaire.
Advertisements
Voltas AC (Emotional Appeal):
http://www.youtube.com/watch?v=3q7AaQcXC3g (SET A)
This commercial was chosen for the emotional appeal category, where a son gifts his
father a Voltas AC and father is reluctant to use the ac due to the high electricity
charges, the son calls his father to check upon him and inquires about the ac the father
is hesitant about it, the son ask him to read the letter which he has sent with the ACs,
father finds the letter and starts reading the letter in which son has asked his father to
use the AC without any hesitation as this AC after several running hours of consumes
very less electricity. The father becomes emotional realizing how much his son cares
for him.
Panasonic AC (Informational Appeal):
http://www.youtube.com/watch?v=djGpyGoOTOs (SET B)
This Commercial waschosen for the informational appeal category, where the model
(Katrina Kaif) talks about the Panasonic AC which has multiple features like
providing virus free air, has smart human sensor and at the same time consumes 60%
less electricity.
P a g e | 11
MARKET RESEARCH REPORT
Flipkart 15sec:
http://www.youtube.com/watch?v=FOhuH2e2IbQ (Set A)
This commercial was chosen under 15 second Ad category, where 2 young kids enact
a news debate scene - like famous anchor Mr. Arnab Goswami where the news anchor
forces the interviewee to say that Flipkart is the new destination for the shopping.
Flipkart 30sec:
http://www.youtube.com/watch?v=Fq2jCV_QsEA (SET B)
This commercial was chosen under 30 second Ad category, where a kids enacts a
family scene where a delivery boy delivers a flipkart product and father enquires
about it, the son replies its grandfather’s mobile which they have bought online and
explains the father how simple it is to shop online. The father is reluctant as in how to
buy products just by seeing the photo online, at which the mother replies she married
him just by seeing him, and the narration comes “ flipkart - shopping ka naya address
“
Vodafone Crazy Feet Ad:
http://www.youtube.com/watch?v=WuANjdF5WxQ (SET A)
This commercial was chosen under message mismatch category where the ad is on
some African dance moves going viral around the world, and then Vodafone internet
packages information is shown.
Vodafone ZooZoo Ad:
http://www.youtube.com/watch?v=t4aCvzqTM2o (SET B)
This commercial was chosen under message mismatch category. The ad is on
Vodafone ZOOZOO, where a man brings gifts for his family and inadvertently gives
wrong gifts so the family starts crying ; the man realizes his mistake and distributes
gift accordingly. Then the Vodafone speak about his gift vouchers which is designed
as per the needs of the customer.
Han han mein crazy hoon:
http://www.youtube.com/watch?v=jyEWtpYtpv4 (SET A)
This commercial was chosen under the engagement category in terms of background
music, this ad has jingle “ Haan haan mein crazy hoon” running in the background
and different people are drinking coke and doing crazy things to help different people.

P a g e | 12
MARKET RESEARCH REPORT
Aaj Ki Raat:
http://www.youtube.com/watch?v=IKG44qyp1iU (SET B)
This commercial was chosen under the engagement category in terms of background
music, this ad shows Imran khan who is feeling thirsty and sees a shadow in front of
his apartment, he uses his torch and creates his shadow to take the coke bottle and
the person in the shadow tries to protect it. The ad runs a bollywood film song “Aaj ki
raat “ in the background.
P a g e | 13
MARKET RESEARCH REPORT
VI. SAMPLING METHOD
Population
By population we mean the entire set of people with whom we want to understand the
factors which affect the popularity if a TV Commercial.
Our population will be mostly people from age group 16-50 years old. We will try to
pick equal no. of females and males for our survey as behaviour of gender also plays
important role.
Margin of error
Our margin of error will be 5% which is the most commonly used margin of error in
the previous study, which means that we would like our estimate of TV commercial to
we can go from 1-10% for a margin of error depending on our survey. Increasing our
margin of error above 10% is not recommended.
Confidence Interval
A confidence interval is the likelihood that the sample which we picked mattered in the
results we get the calculation is usually done in the following way. If we picked 30
more samples randomly from your population, how often would the results we get in
our one sample significantly differs those other 30 samples? A 95% confidence interval
means that we will get the same results 95% of the time. 95% is the most commonly
used confidence interval but if we can go for 90% or 99% confidence interval
depending on our survey. Decreasing confidence interval below 90% is not
recommended.
Formula for Sample size
N = ( Zs/e)^2
N= Sample Size
Z = Confidence level at 95% is 1.96
s = Standard deviation
e = Margin of error (5%)
Standard Deviation from the past record: 0.36
N= (Zs/e)^2
Sample Size = {(1.96x 0.36x) / 5%}^2
= 200
P a g e | 14
MARKET RESEARCH REPORT
Response Rate
When we send our survey to fill not everyone will fill it. The percentage of people who
do actually fill out a survey that they receive is known as the Response rate. Estimating
our response rate will help us to determine the total number of surveys we will need to
send out to obtain the required number of completed surveys. Response rates vary
widely depending on a number of factors such as the relationship with your target
audience, survey length and complexity, incentives, and topic of our survey.
We will go for online survey due to location constraint. For online surveys in which
there is no prior relationship with recipients, a response rate of between 20-30% is
considered to be highly successful.
No. of surveys to be send
We have divided the sample size by the response rate.
No. of surveys to be send = Sample Size/ Response rate
= 200/40%= 375
We need 150 people to fill out your survey and we assume that 40 % of these people
whom we send the survey will actually fill it out, then you need to send it to 150/40%
= 375 people.
We know that 20-30% response rate is considered to be good response rate but we have
taken it to be 40% which is quite high because we are mainly going to send these
surveys to friends and friends of friends that’s why survey filling rate will be high.
Sampling Techniques
We will go for probabilistic sampling method and in it we will go for Simple Random
Sampling because it is:
Least biased of all sampling techniques, there is no subjectivity - each member
of the total population has an equal chance of being selected
Can be obtained using random number tables
Microsoft Excel has a function to produce random number
The function is simply:
=RAND()
Type that into a cell and it will produce a random number in that cell. Copy the formula
throughout a selection of cells and it will produce random numbers.
We can modify the formula to obtain whatever range we wish.

P a g e | 15
MARKET RESEARCH REPORT
Sample Profile
The sample set we chose for this experiment consisted of a total of 170 respondents.
Gender Distribution
Of these 170 respondents, 128 were male and 42 were female.
Age Group Distribution
If we look at the distribution of the sample across different age groups, 110 were
between the age group 15-25, 52 respondents belonged to the age group 26-30, 6
respondents were between ages 31-35, and 2 was older than 35 years of age.
Male75%
Female25%
Gender distribution
Male Female
15-25
26-30
31-35> 35
Age Group Distribution
15-25 26-30 31-35 > 35

P a g e | 16
MARKET RESEARCH REPORT
Income distribution
12 Respondents belonged to the group with an annual family income of 0-3 lakh, 52
respondents lay in the income group of 3-7 lakh, 70 respondents had an annual family
income between 7-15 lakh, and 36 respondents’ annual family income was above 15
lakhs. All these figures are in Indian Rupees.
0-3 L58%
3-7 L23%
7 - 15 L10%
> 15 L9%
Income Group Distribution
0-3 L 3-7 L 7 - 15 L > 15 L
P a g e | 17
MARKET RESEARCH REPORT
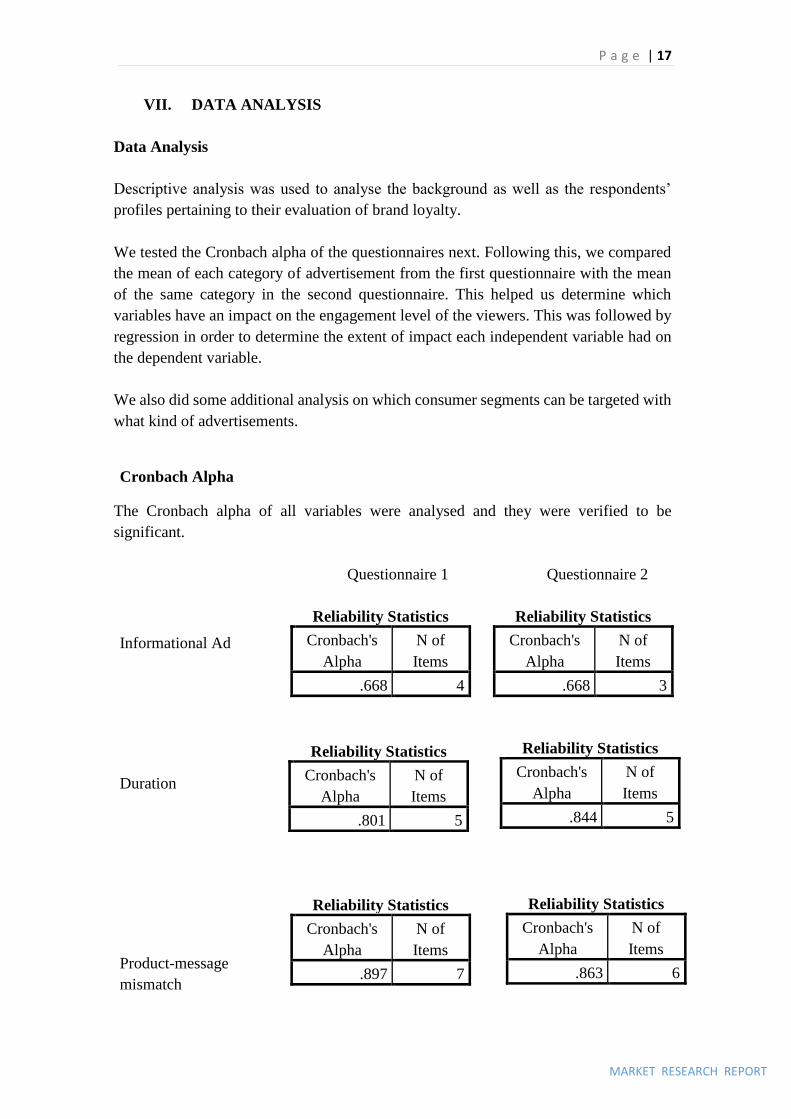
VII. DATA ANALYSIS
Data Analysis
Descriptive analysis was used to analyse the background as well as the respondents’
profiles pertaining to their evaluation of brand loyalty.
We tested the Cronbach alpha of the questionnaires next. Following this, we compared
the mean of each category of advertisement from the first questionnaire with the mean
of the same category in the second questionnaire. This helped us determine which
variables have an impact on the engagement level of the viewers. This was followed by
regression in order to determine the extent of impact each independent variable had on
the dependent variable.
We also did some additional analysis on which consumer segments can be targeted with
what kind of advertisements.
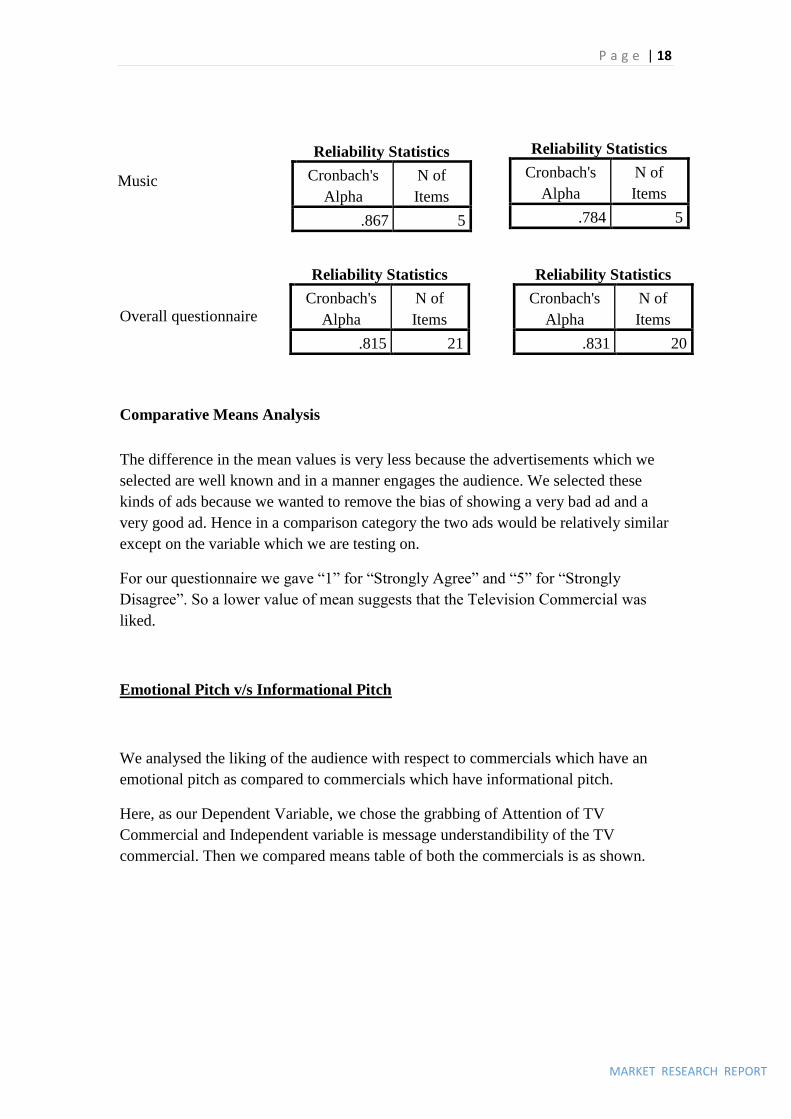
Cronbach Alpha
The Cronbach alpha of all variables were analysed and they were verified to be
significant.
Questionnaire 1 Questionnaire 2
Informational Ad
Duration
Product-message
mismatch
Reliability Statistics
Cronbach's
Alpha
N of
Items
.668 4
Reliability Statistics
Cronbach's
Alpha
N of
Items
.668 3
Reliability Statistics
Cronbach's
Alpha
N of
Items
.801 5
Reliability Statistics
Cronbach's
Alpha
N of
Items
.844 5
Reliability Statistics
Cronbach's
Alpha
N of
Items
.897 7
Reliability Statistics
Cronbach's
Alpha
N of
Items
.863 6
P a g e | 18
MARKET RESEARCH REPORT
Music
Overall questionnaire
Comparative Means Analysis
The difference in the mean values is very less because the advertisements which we
selected are well known and in a manner engages the audience. We selected these
kinds of ads because we wanted to remove the bias of showing a very bad ad and a
very good ad. Hence in a comparison category the two ads would be relatively similar
except on the variable which we are testing on.
For our questionnaire we gave “1” for “Strongly Agree” and “5” for “Strongly
Disagree”. So a lower value of mean suggests that the Television Commercial was
liked.
Emotional Pitch v/s Informational Pitch
We analysed the liking of the audience with respect to commercials which have an
emotional pitch as compared to commercials which have informational pitch.
Here, as our Dependent Variable, we chose the grabbing of Attention of TV
Commercial and Independent variable is message understandibility of the TV
commercial. Then we compared means table of both the commercials is as shown.
Reliability Statistics
Cronbach's
Alpha
N of
Items
.867 5
Reliability Statistics
Cronbach's
Alpha
N of
Items
.784 5
Reliability Statistics
Cronbach's
Alpha
N of
Items
.815 21
Reliability Statistics
Cronbach's
Alpha
N of
Items
.831 20
P a g e | 19
MARKET RESEARCH REPORT
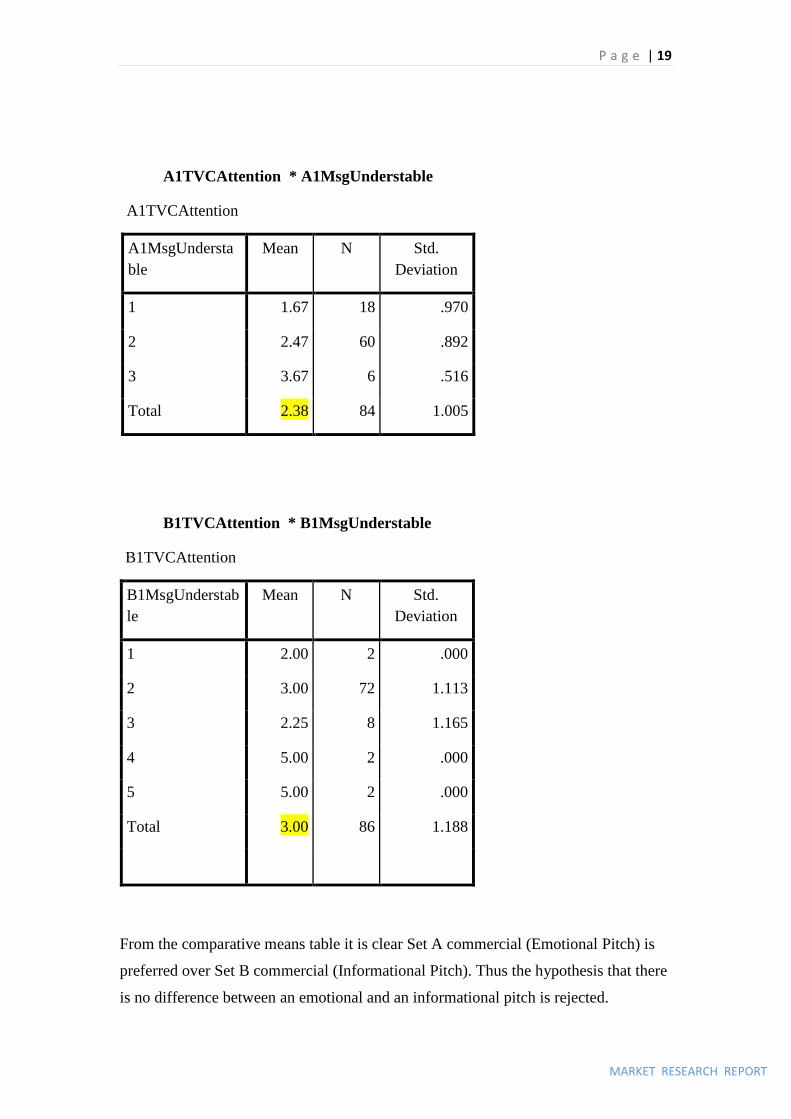
A1TVCAttention * A1MsgUnderstable
A1TVCAttention
A1MsgUndersta
ble
Mean N Std.
Deviation
1 1.67 18 .970
2 2.47 60 .892
3 3.67 6 .516
Total 2.38 84 1.005
B1TVCAttention * B1MsgUnderstable
B1TVCAttention
B1MsgUnderstab
le
Mean N Std.
Deviation
1 2.00 2 .000
2 3.00 72 1.113
3 2.25 8 1.165
4 5.00 2 .000
5 5.00 2 .000
Total 3.00 86 1.188
From the comparative means table it is clear Set A commercial (Emotional Pitch) is
preferred over Set B commercial (Informational Pitch). Thus the hypothesis that there
is no difference between an emotional and an informational pitch is rejected.
P a g e | 20
MARKET RESEARCH REPORT
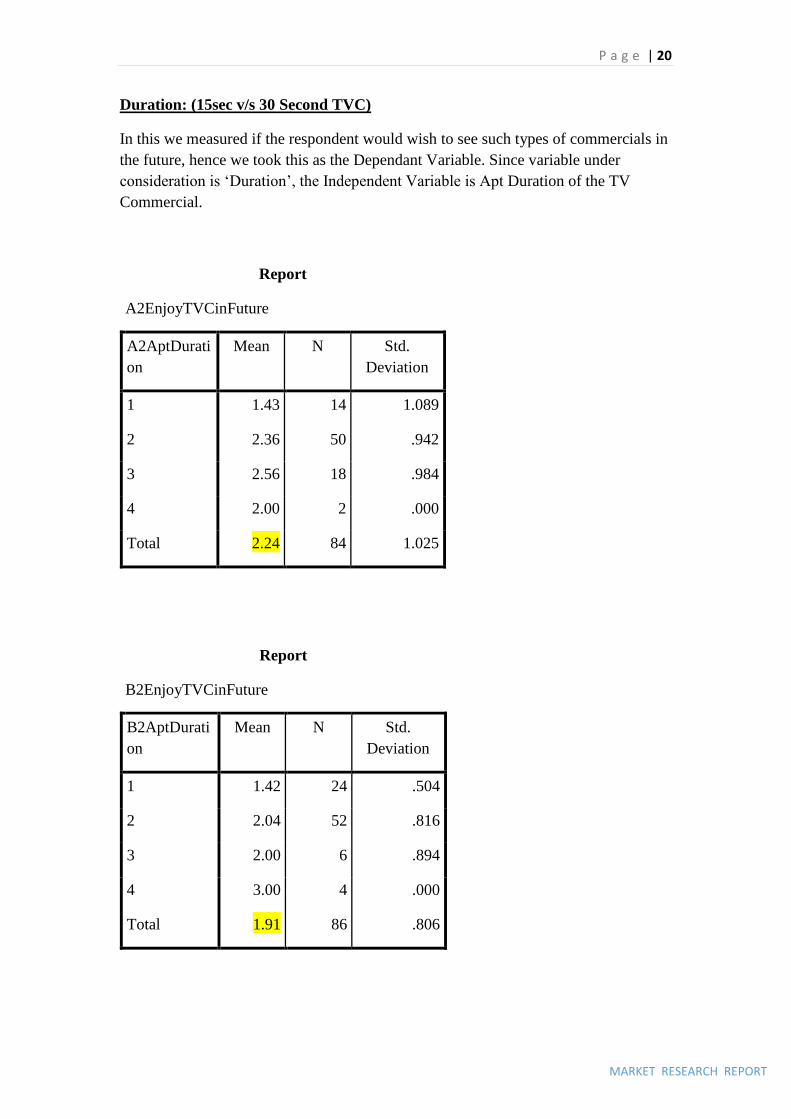
Duration: (15sec v/s 30 Second TVC)
In this we measured if the respondent would wish to see such types of commercials in
the future, hence we took this as the Dependant Variable. Since variable under
consideration is ‘Duration’, the Independent Variable is Apt Duration of the TV
Commercial.
Report
A2EnjoyTVCinFuture
A2AptDurati
on
Mean N Std.
Deviation
1 1.43 14 1.089
2 2.36 50 .942
3 2.56 18 .984
4 2.00 2 .000
Total 2.24 84 1.025
Report
B2EnjoyTVCinFuture
B2AptDurati
on
Mean N Std.
Deviation
1 1.42 24 .504
2 2.04 52 .816
3 2.00 6 .894
4 3.00 4 .000
Total 1.91 86 .806
P a g e | 21
MARKET RESEARCH REPORT
As we can see from the comparative means table, that TVC B (30 sec) is more
preferable than TVC A (15 sec). Thus the hypothesis that advertisement length has no
effect on the engagement level of the audience is rejected.
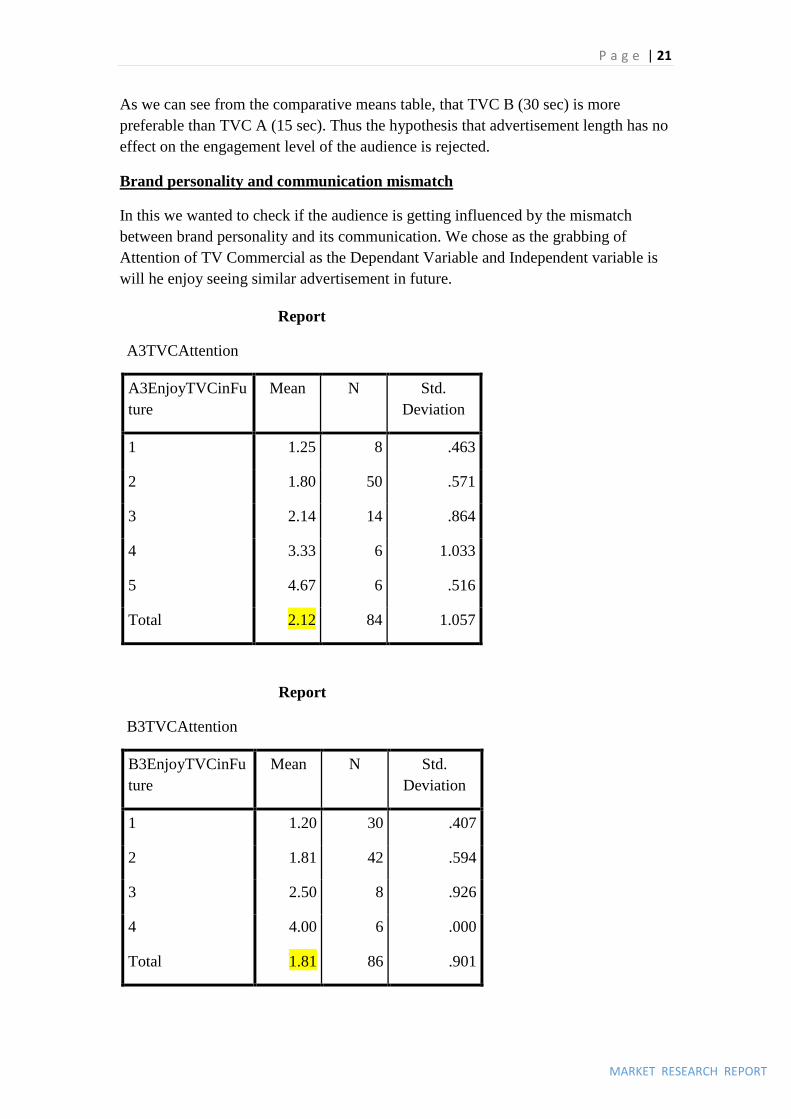
Brand personality and communication mismatch
In this we wanted to check if the audience is getting influenced by the mismatch
between brand personality and its communication. We chose as the grabbing of
Attention of TV Commercial as the Dependant Variable and Independent variable is
will he enjoy seeing similar advertisement in future.
Report
A3TVCAttention
A3EnjoyTVCinFu
ture
Mean N Std.
Deviation
1 1.25 8 .463
2 1.80 50 .571
3 2.14 14 .864
4 3.33 6 1.033
5 4.67 6 .516
Total 2.12 84 1.057
Report
B3TVCAttention
B3EnjoyTVCinFu
ture
Mean N Std.
Deviation
1 1.20 30 .407
2 1.81 42 .594
3 2.50 8 .926
4 4.00 6 .000
Total 1.81 86 .901
P a g e | 22
MARKET RESEARCH REPORT
It can be seen from the statistics table that Set B (Brand personality and
communication in line) advertisement engaged more than Set A (Brand personality
and communication mismatch) advertisement. The hypothesis that Brand personality
and communication mismatch has no effect on the engagement level of the audience
is rejected.
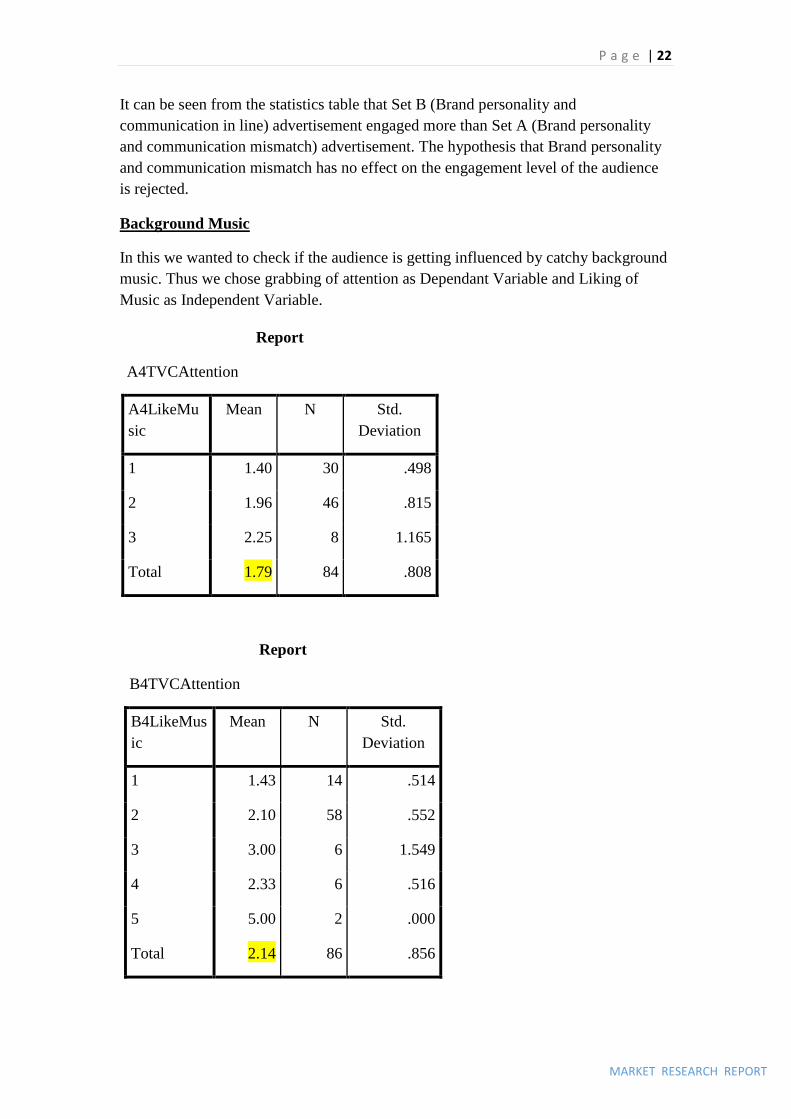
Background Music
In this we wanted to check if the audience is getting influenced by catchy background
music. Thus we chose grabbing of attention as Dependant Variable and Liking of
Music as Independent Variable.
Report
A4TVCAttention
A4LikeMu
sic
Mean N Std.
Deviation
1 1.40 30 .498
2 1.96 46 .815
3 2.25 8 1.165
Total 1.79 84 .808
Report
B4TVCAttention
B4LikeMus
ic
Mean N Std.
Deviation
1 1.43 14 .514
2 2.10 58 .552
3 3.00 6 1.549
4 2.33 6 .516
5 5.00 2 .000
Total 2.14 86 .856
P a g e | 23
MARKET RESEARCH REPORT
As we can see from the table, that Set A (with Catchy Background Music) engaged
more than Set B (without Catchy Background Music). Thus our hypothesis that there
is no effect on engagement level of audience with or without catchy Background
Music stands rejected.
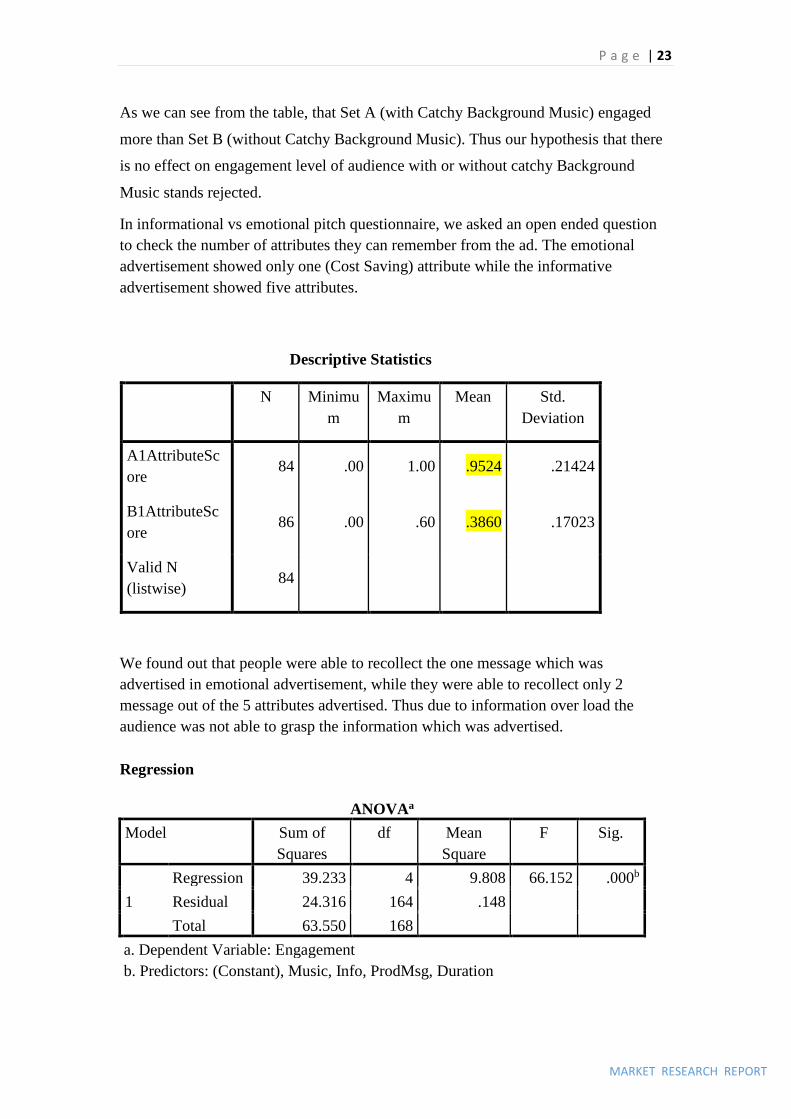
In informational vs emotional pitch questionnaire, we asked an open ended question
to check the number of attributes they can remember from the ad. The emotional
advertisement showed only one (Cost Saving) attribute while the informative
advertisement showed five attributes.
Descriptive Statistics
N Minimu
m
Maximu
m
Mean Std.
Deviation
A1AttributeSc
ore 84 .00 1.00 .9524 .21424
B1AttributeSc
ore 86 .00 .60 .3860 .17023
Valid N
(listwise) 84
We found out that people were able to recollect the one message which was
advertised in emotional advertisement, while they were able to recollect only 2
message out of the 5 attributes advertised. Thus due to information over load the
audience was not able to grasp the information which was advertised.
Regression
ANOVAa
Model Sum of
Squares
df Mean
Square
F Sig.
1
Regression 39.233 4 9.808 66.152 .000b
Residual 24.316 164 .148
Total 63.550 168
a. Dependent Variable: Engagement
b. Predictors: (Constant), Music, Info, ProdMsg, Duration
P a g e | 24
MARKET RESEARCH REPORT
From the ANOVA results of regression which says significant, it can be seen that the
collective bunch of four independent variables that we have taken are related to the
dependent variable. There is a linear relationship between the four independent
variables and the dependent variable.
Model Summary
Mode
l
R R Square Adjusted R
Square
Std. Error of
the Estimate
1 .786a .617 .608 .38506
a. Predictors: (Constant), Music, Info, ProdMsg, Duration
The R square value of 0.617 indicates that around 60% of the variance is explained by
the independent variables while the remaining 40% is random variance.
Coefficientsa
Model Unstandardized
Coefficients
Standardized
Coefficients
t Sig.
B Std. Error Beta
1
(Constant) -.511 .181 -2.824 .005
Info .311 .043 .355 7.163 .000
Duration .260 .054 .247 4.786 .000
ProdMsg .300 .042 .363 7.205 .000
Music .358 .047 .393 7.656 .000
a. Dependent Variable: Engagement
The Beta Values shown in the table is for all the advertisements. The signs of all
standardized beta coefficients are positive, indicating that all four IVs are positively
related to the DV. Also, the significance column confirms that all four attributes taken
into consideration in the questionnaire are significant. Hence, all four factors must be
incorporated in an advertisement.
Also, looking at the unstandardized coefficients, it can be seen that music has the
highest impact on engagement as the B value is the highest: 0.358. This is followed by
the informational aspect with B = 0.311. Next in line is that the product and message
must be related as its B = 0.300. Lastly, it is duration with B = 0.260.
P a g e | 25
MARKET RESEARCH REPORT
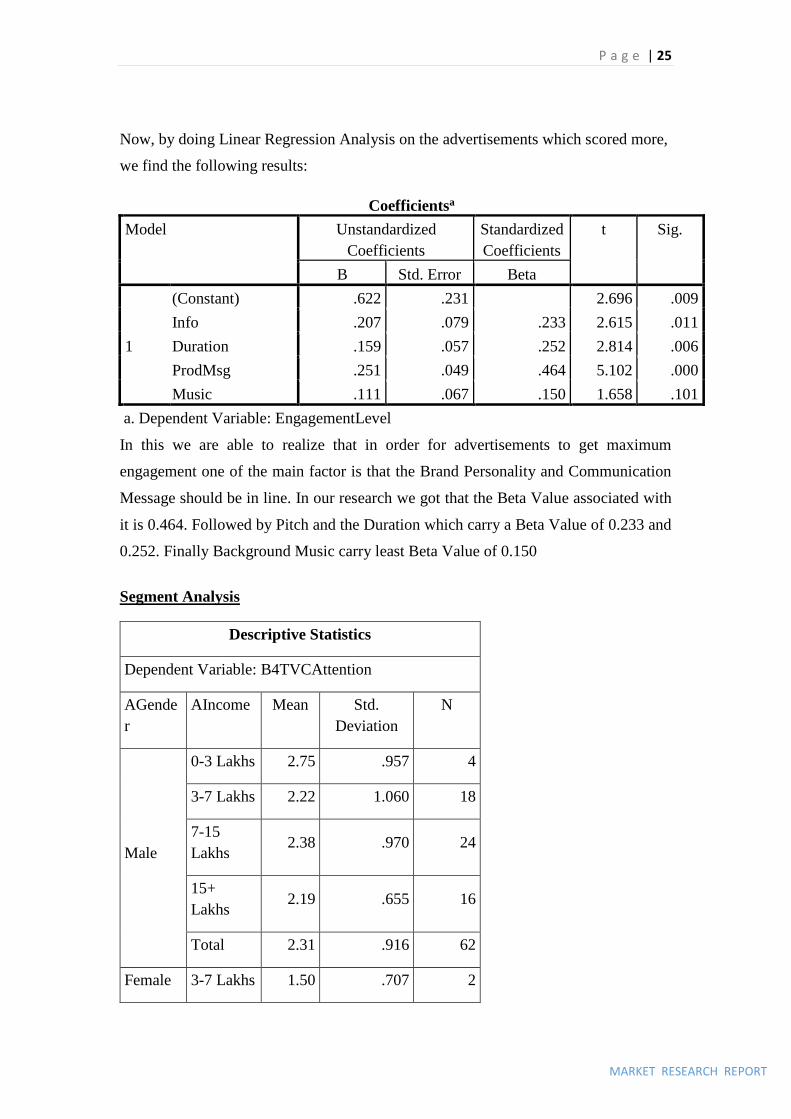
Now, by doing Linear Regression Analysis on the advertisements which scored more,
we find the following results:
Coefficientsa
Model Unstandardized
Coefficients
Standardized
Coefficients
t Sig.
B Std. Error Beta
1
(Constant) .622 .231 2.696 .009
Info .207 .079 .233 2.615 .011
Duration .159 .057 .252 2.814 .006
ProdMsg .251 .049 .464 5.102 .000
Music .111 .067 .150 1.658 .101
a. Dependent Variable: EngagementLevel
In this we are able to realize that in order for advertisements to get maximum
engagement one of the main factor is that the Brand Personality and Communication
Message should be in line. In our research we got that the Beta Value associated with
it is 0.464. Followed by Pitch and the Duration which carry a Beta Value of 0.233 and
0.252. Finally Background Music carry least Beta Value of 0.150
Segment Analysis
Descriptive Statistics
Dependent Variable: B4TVCAttention
AGende
r
AIncome Mean Std.
Deviation
N
Male
0-3 Lakhs 2.75 .957 4
3-7 Lakhs 2.22 1.060 18
7-15
Lakhs 2.38 .970 24
15+
Lakhs 2.19 .655 16
Total 2.31 .916 62
Female 3-7 Lakhs 1.50 .707 2
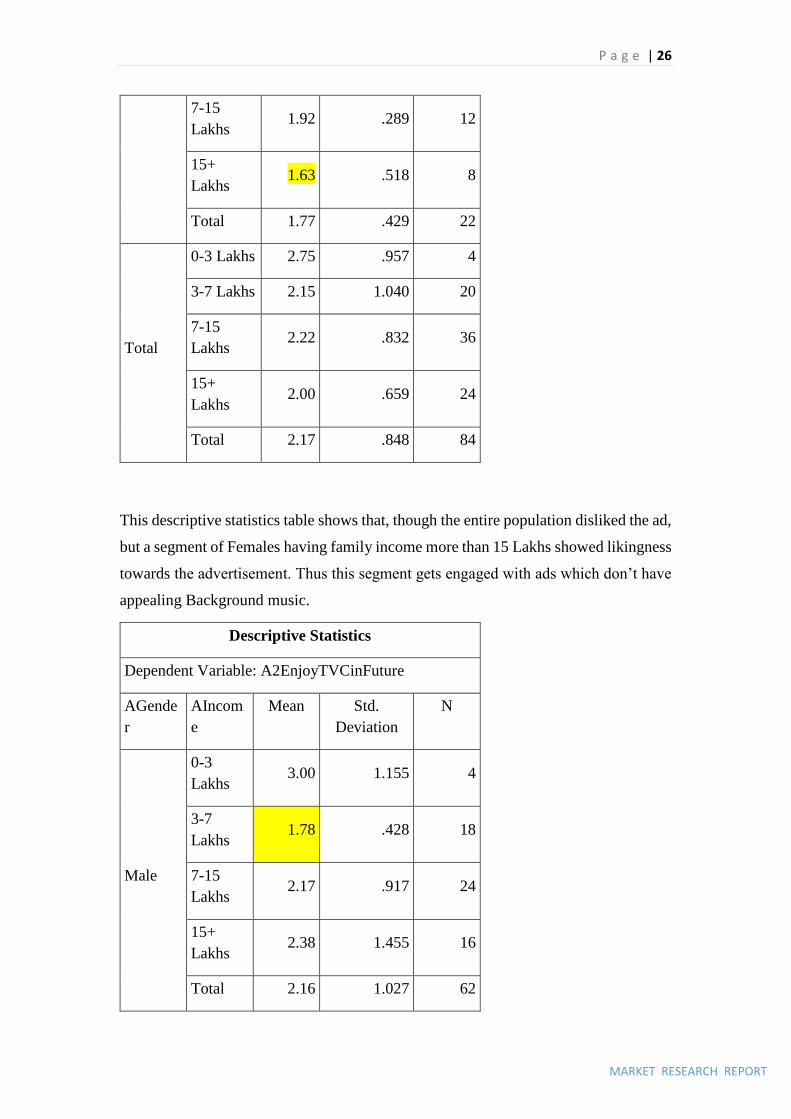
P a g e | 26
MARKET RESEARCH REPORT
7-15
Lakhs 1.92 .289 12
15+
Lakhs 1.63 .518 8
Total 1.77 .429 22
Total
0-3 Lakhs 2.75 .957 4
3-7 Lakhs 2.15 1.040 20
7-15
Lakhs 2.22 .832 36
15+
Lakhs 2.00 .659 24
Total 2.17 .848 84
This descriptive statistics table shows that, though the entire population disliked the ad,
but a segment of Females having family income more than 15 Lakhs showed likingness
towards the advertisement. Thus this segment gets engaged with ads which don’t have
appealing Background music.
Descriptive Statistics
Dependent Variable: A2EnjoyTVCinFuture
AGende
r
AIncom
e
Mean Std.
Deviation
N
Male
0-3
Lakhs 3.00 1.155 4
3-7
Lakhs 1.78 .428 18
7-15
Lakhs 2.17 .917 24
15+
Lakhs 2.38 1.455 16
Total 2.16 1.027 62
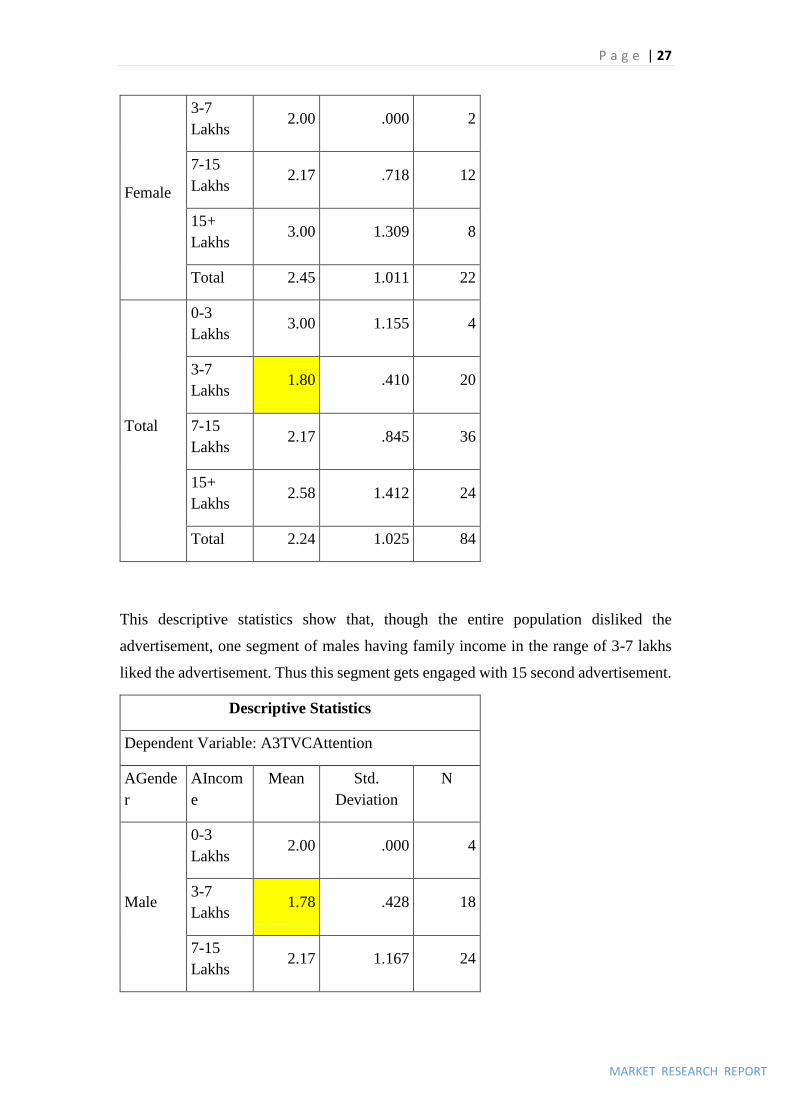
P a g e | 27
MARKET RESEARCH REPORT
Female
3-7
Lakhs 2.00 .000 2
7-15
Lakhs 2.17 .718 12
15+
Lakhs 3.00 1.309 8
Total 2.45 1.011 22
Total
0-3
Lakhs 3.00 1.155 4
3-7
Lakhs 1.80 .410 20
7-15
Lakhs 2.17 .845 36
15+
Lakhs 2.58 1.412 24
Total 2.24 1.025 84
This descriptive statistics show that, though the entire population disliked the
advertisement, one segment of males having family income in the range of 3-7 lakhs
liked the advertisement. Thus this segment gets engaged with 15 second advertisement.
Descriptive Statistics
Dependent Variable: A3TVCAttention
AGende
r
AIncom
e
Mean Std.
Deviation
N
Male
0-3
Lakhs 2.00 .000 4
3-7
Lakhs 1.78 .428 18
7-15
Lakhs 2.17 1.167 24
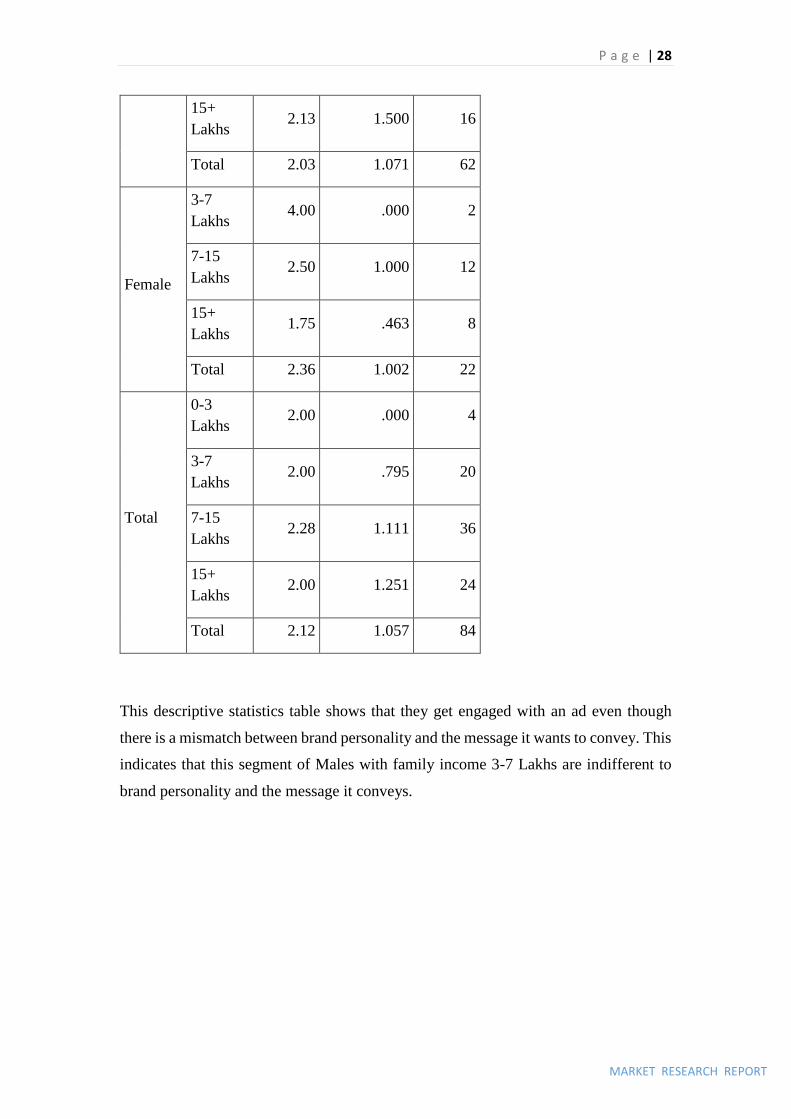
P a g e | 28
MARKET RESEARCH REPORT
15+
Lakhs 2.13 1.500 16
Total 2.03 1.071 62
Female
3-7
Lakhs 4.00 .000 2
7-15
Lakhs 2.50 1.000 12
15+
Lakhs 1.75 .463 8
Total 2.36 1.002 22
Total
0-3
Lakhs 2.00 .000 4
3-7
Lakhs 2.00 .795 20
7-15
Lakhs 2.28 1.111 36
15+
Lakhs 2.00 1.251 24
Total 2.12 1.057 84
This descriptive statistics table shows that they get engaged with an ad even though
there is a mismatch between brand personality and the message it wants to convey. This
indicates that this segment of Males with family income 3-7 Lakhs are indifferent to
brand personality and the message it conveys.
P a g e | 29
MARKET RESEARCH REPORT
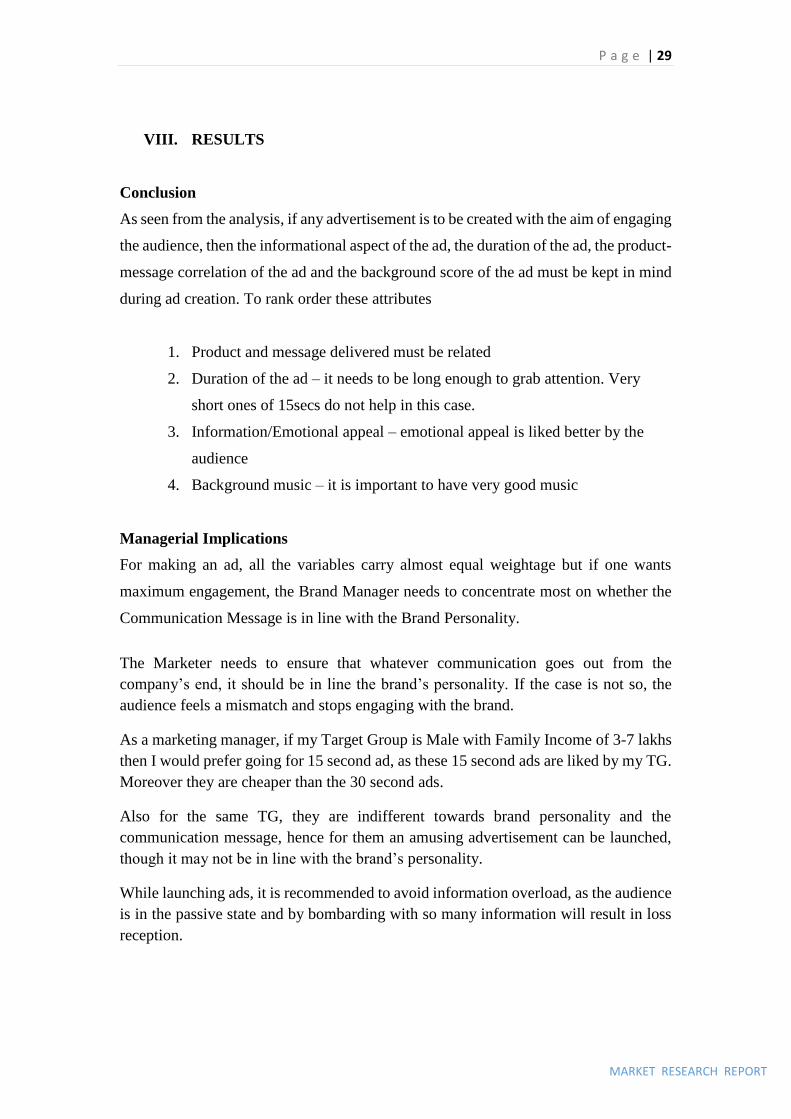
VIII. RESULTS
Conclusion
As seen from the analysis, if any advertisement is to be created with the aim of engaging
the audience, then the informational aspect of the ad, the duration of the ad, the product-
message correlation of the ad and the background score of the ad must be kept in mind
during ad creation. To rank order these attributes
1. Product and message delivered must be related
2. Duration of the ad – it needs to be long enough to grab attention. Very
short ones of 15secs do not help in this case.
3. Information/Emotional appeal – emotional appeal is liked better by the
audience
4. Background music – it is important to have very good music
Managerial Implications
For making an ad, all the variables carry almost equal weightage but if one wants
maximum engagement, the Brand Manager needs to concentrate most on whether the
Communication Message is in line with the Brand Personality.
The Marketer needs to ensure that whatever communication goes out from the
company’s end, it should be in line the brand’s personality. If the case is not so, the
audience feels a mismatch and stops engaging with the brand.
As a marketing manager, if my Target Group is Male with Family Income of 3-7 lakhs
then I would prefer going for 15 second ad, as these 15 second ads are liked by my TG.
Moreover they are cheaper than the 30 second ads.
Also for the same TG, they are indifferent towards brand personality and the
communication message, hence for them an amusing advertisement can be launched,
though it may not be in line with the brand’s personality.
While launching ads, it is recommended to avoid information overload, as the audience
is in the passive state and by bombarding with so many information will result in loss
reception.

P a g e | 30
MARKET RESEARCH REPORT
Future Scope:
The research can be extended by taking other different variables like influence on ad
by humour, celebrities, surprise element, etc. Also for us the majority audience were
from the age group 15-25 and 25-30. This can also be extended to people from other
age groups to get a more comprehensive picture.
P a g e | 31
MARKET RESEARCH REPORT
IX. REFERENCES
- An Experimental Study on the Relationship between Consumer Involvement
and Advertising Effectiveness - by Shwu-Ing Wu,
- Infomercials and advertising effectiveness: And empirical study – Brett A. S.
Martin, Andrew C. Bhimy, Tom Agee
- The Effects of Length, Content, and Repetition on Television Commercial
Effectiveness, Surendra N. Singh and Catherine A. Cole, Journal Marketing
Research, February 1993, (91-104).
- Consumer Response to Television Commercials: The Impact of Involvement
and Background Music on Brand Attitude Formation, C. Whan Park and S.
Mark Young, Journal Marketing Research, February 1986, (11-24)
- Heath, R. (2009). “Emotional Engagement: How Television Builds Big Brands
at Low Attention.” Journal of Advertising Research 49(1): 62.
P a g e | 32
MARKET RESEARCH REPORT
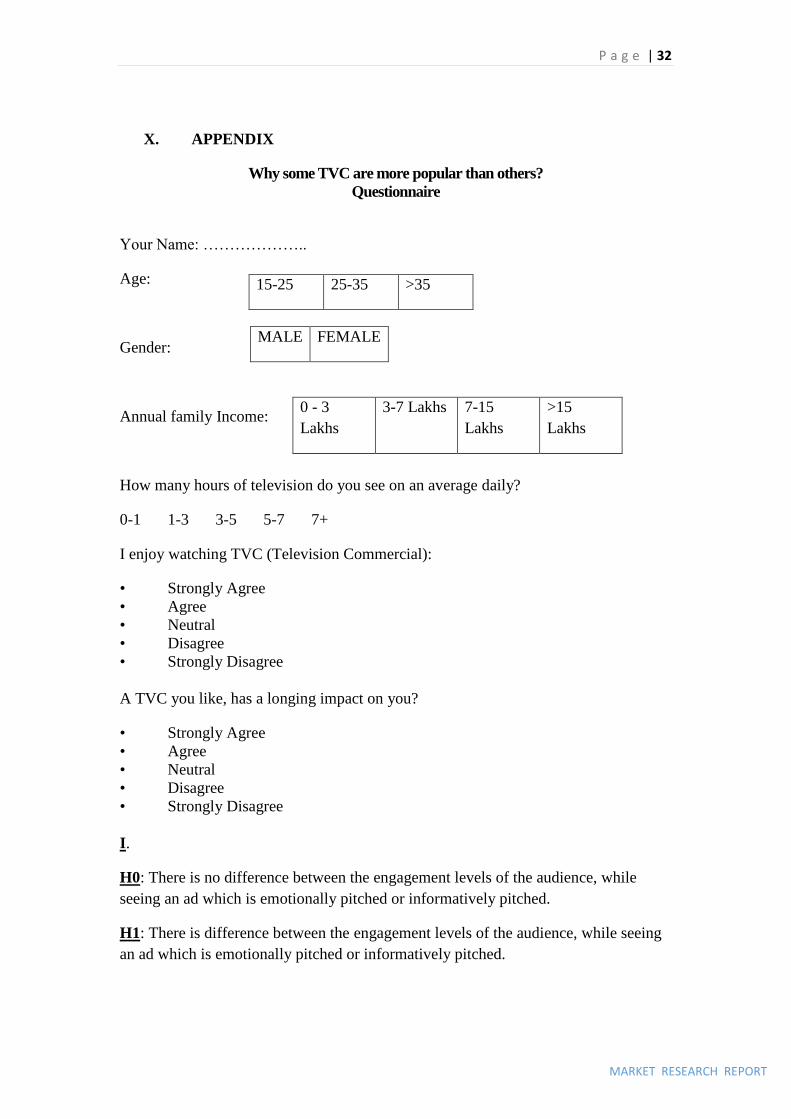
X. APPENDIX
Why some TVC are more popular than others?
Questionnaire
Your Name: ………………..
Age:
Gender:
Annual family Income:
How many hours of television do you see on an average daily?
0-1 1-3 3-5 5-7 7+
I enjoy watching TVC (Television Commercial):
• Strongly Agree
• Agree
• Neutral
• Disagree
• Strongly Disagree
A TVC you like, has a longing impact on you?
• Strongly Agree
• Agree
• Neutral
• Disagree
• Strongly Disagree
I.
H0: There is no difference between the engagement levels of the audience, while
seeing an ad which is emotionally pitched or informatively pitched.
H1: There is difference between the engagement levels of the audience, while seeing
an ad which is emotionally pitched or informatively pitched.
15-25 25-35 >35
MALE FEMALE
0 - 3
Lakhs
3-7 Lakhs 7-15
Lakhs
>15
Lakhs
P a g e | 33
MARKET RESEARCH REPORT
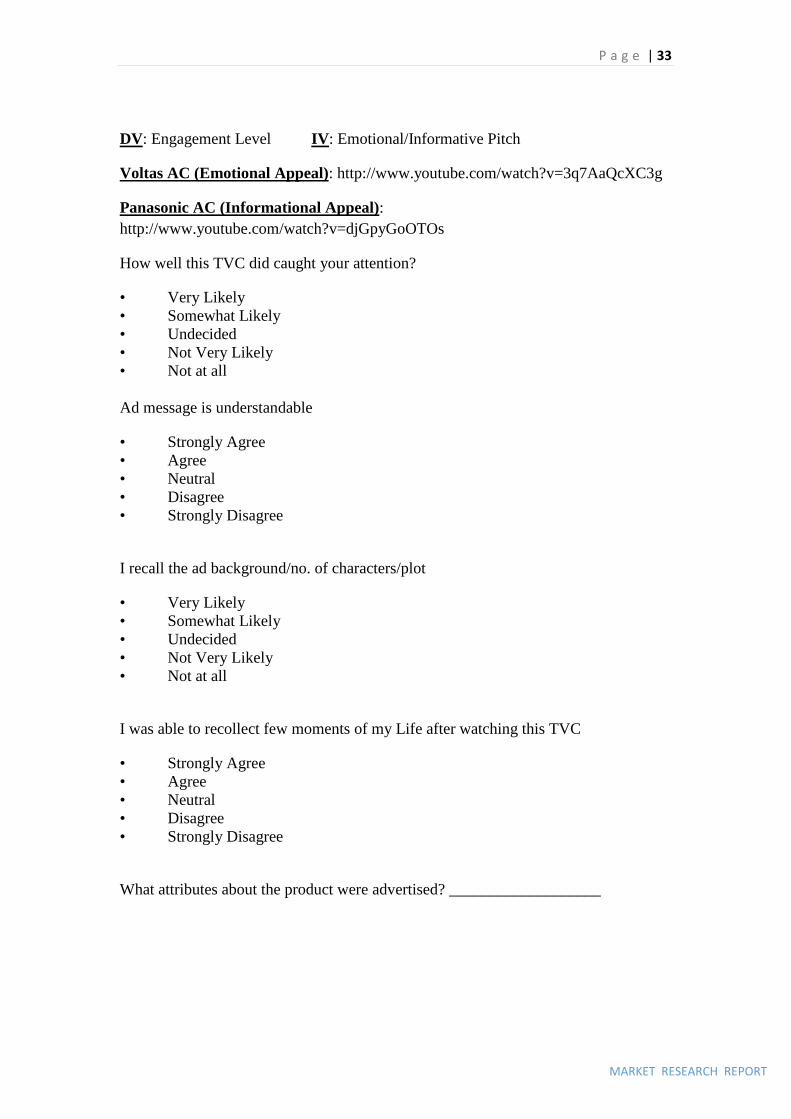
DV: Engagement Level IV: Emotional/Informative Pitch
Voltas AC (Emotional Appeal): http://www.youtube.com/watch?v=3q7AaQcXC3g
Panasonic AC (Informational Appeal):
http://www.youtube.com/watch?v=djGpyGoOTOs
How well this TVC did caught your attention?
• Very Likely
• Somewhat Likely
• Undecided
• Not Very Likely
• Not at all
Ad message is understandable
• Strongly Agree
• Agree
• Neutral
• Disagree
• Strongly Disagree
I recall the ad background/no. of characters/plot
• Very Likely
• Somewhat Likely
• Undecided
• Not Very Likely
• Not at all
I was able to recollect few moments of my Life after watching this TVC
• Strongly Agree
• Agree
• Neutral
• Disagree
• Strongly Disagree
What attributes about the product were advertised? ___________________
P a g e | 34
MARKET RESEARCH REPORT
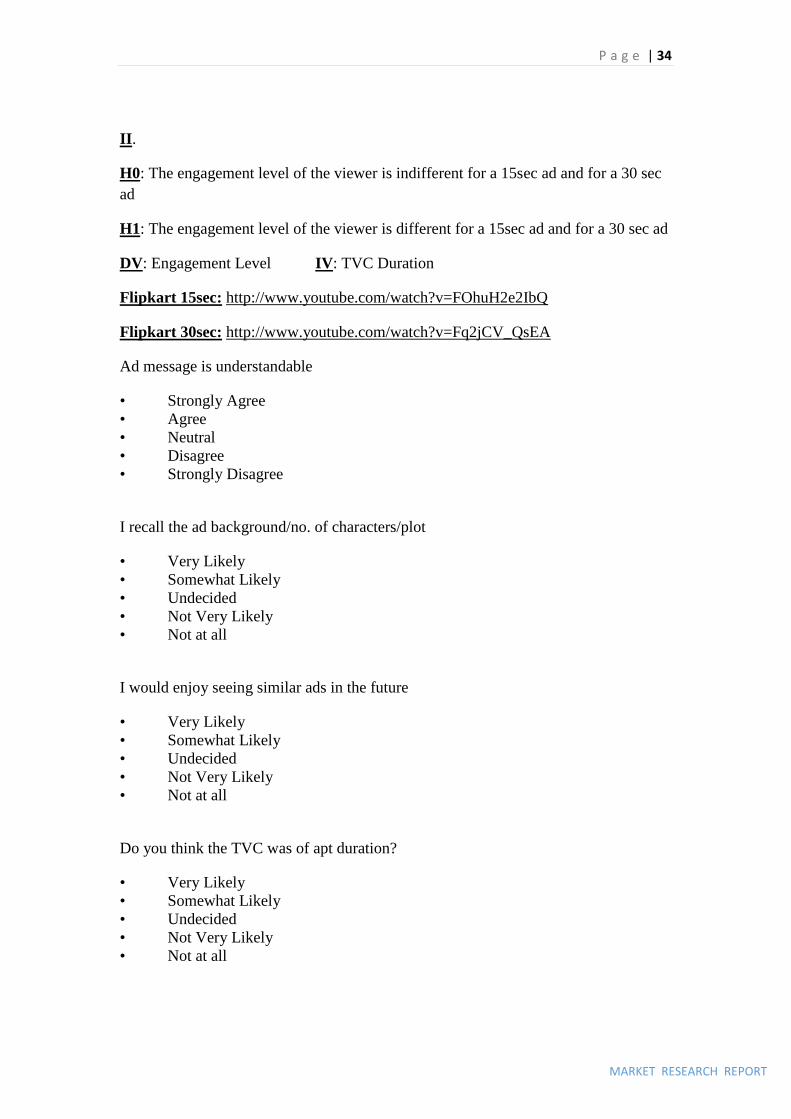
II.
H0: The engagement level of the viewer is indifferent for a 15sec ad and for a 30 sec
ad
H1: The engagement level of the viewer is different for a 15sec ad and for a 30 sec ad
DV: Engagement Level IV: TVC Duration
Flipkart 15sec: http://www.youtube.com/watch?v=FOhuH2e2IbQ
Flipkart 30sec: http://www.youtube.com/watch?v=Fq2jCV_QsEA
Ad message is understandable
• Strongly Agree
• Agree
• Neutral
• Disagree
• Strongly Disagree
I recall the ad background/no. of characters/plot
• Very Likely
• Somewhat Likely
• Undecided
• Not Very Likely
• Not at all
I would enjoy seeing similar ads in the future
• Very Likely
• Somewhat Likely
• Undecided
• Not Very Likely
• Not at all
Do you think the TVC was of apt duration?
• Very Likely
• Somewhat Likely
• Undecided
• Not Very Likely
• Not at all

P a g e | 35
MARKET RESEARCH REPORT
Would you talk to someone else about the ad?
• Very Likely
• Somewhat Likely
• Undecided
• Not Very Likely
• Not at all
III.
H0: The mismatch between the message conveyed in the ad and the Brand Personality
does not affect the engagement level of the viewers.
H1: The mismatch between the message conveyed in the ad and the Brand Personality
does affect the engagement level of the viewers.
DV: Engagement Level IV: Message mismatch conveyed
Vodafone Crazy Feet Ad: http://www.youtube.com/watch?v=WuANjdF5WxQ
Vodafone ZooZoo Ad: http://www.youtube.com/watch?v=t4aCvzqTM2o
Ad message is understandable
• Strongly Agree
• Agree
• Neutral
• Disagree
• Strongly Disagree
I recall the ad background/no. of characters/plot
• Very Likely
• Somewhat Likely
• Undecided
• Not Very Likely
• Not at all
I would enjoy seeing similar ads in the future
• Very Likely
• Somewhat Likely
• Undecided
• Not Very Likely
• Not at all
P a g e | 36
MARKET RESEARCH REPORT
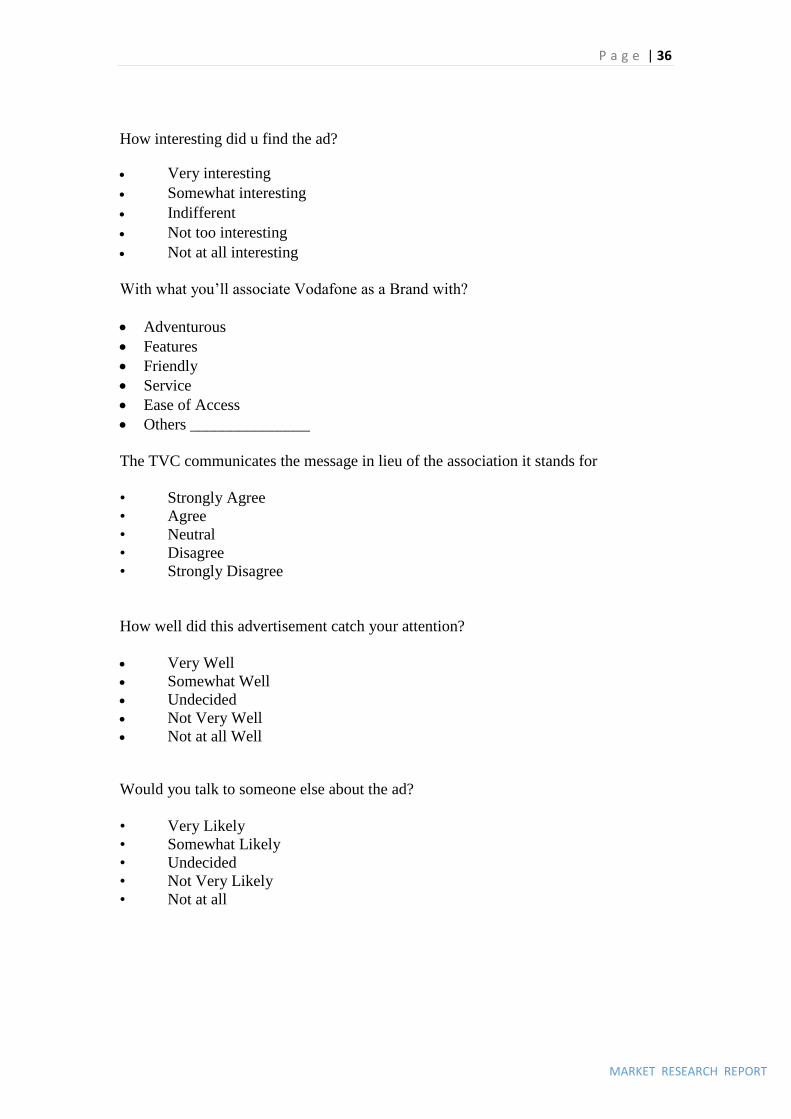
How interesting did u find the ad?
Very interesting
Somewhat interesting
Indifferent
Not too interesting
Not at all interesting
With what you’ll associate Vodafone as a Brand with?
Adventurous
Features
Friendly
Service
Ease of Access
Others _______________
The TVC communicates the message in lieu of the association it stands for
• Strongly Agree
• Agree
• Neutral
• Disagree
• Strongly Disagree
How well did this advertisement catch your attention?
Very Well
Somewhat Well
Undecided
Not Very Well
Not at all Well
Would you talk to someone else about the ad?
• Very Likely
• Somewhat Likely
• Undecided
• Not Very Likely
• Not at all
P a g e | 37
MARKET RESEARCH REPORT
IV.
H0 – Background music has no impact on engagement level of audience
H1 – Background music has impact on engagement level of audience
DV: Engagement Level IV: Background Music
Ha ha me crazy hu: http://www.youtube.com/watch?v=jyEWtpYtpv4
Aaj Ki Raat: http://www.youtube.com/watch?v=IKG44qyp1iU
Ad message is understandable
• Strongly Agree
• Agree
• Neutral
• Disagree
• Strongly Disagree
I would enjoy seeing similar ads in the future
• Very Likely
• Somewhat Likely
• Undecided
• Not Very Likely
• Not at all
How interesting did u find the ad?
Very interesting
Somewhat interesting
Indifferent
Not too interesting
Not at all interesting
How well did this advertisement catch your attention?
Very Well
Somewhat Well
Undecided
Not Very Well
Not at all Well
P a g e | 38
MARKET RESEARCH REPORT
Do you like the music of the TV Commercial?
Strongly Agree
Agree
Neutral
Disagree
Strongly Disagree
Would you like to listen the ad without the Video?
Strongly Agree
Agree
Neutral
Disagree
Strongly Disagree