Embed Size (px)
Citation preview
Latin America &The Caribbean
MARKET REPORT
2014DECEMBER
Gran Torre Costanera, Chile.
NAI GLOBAL
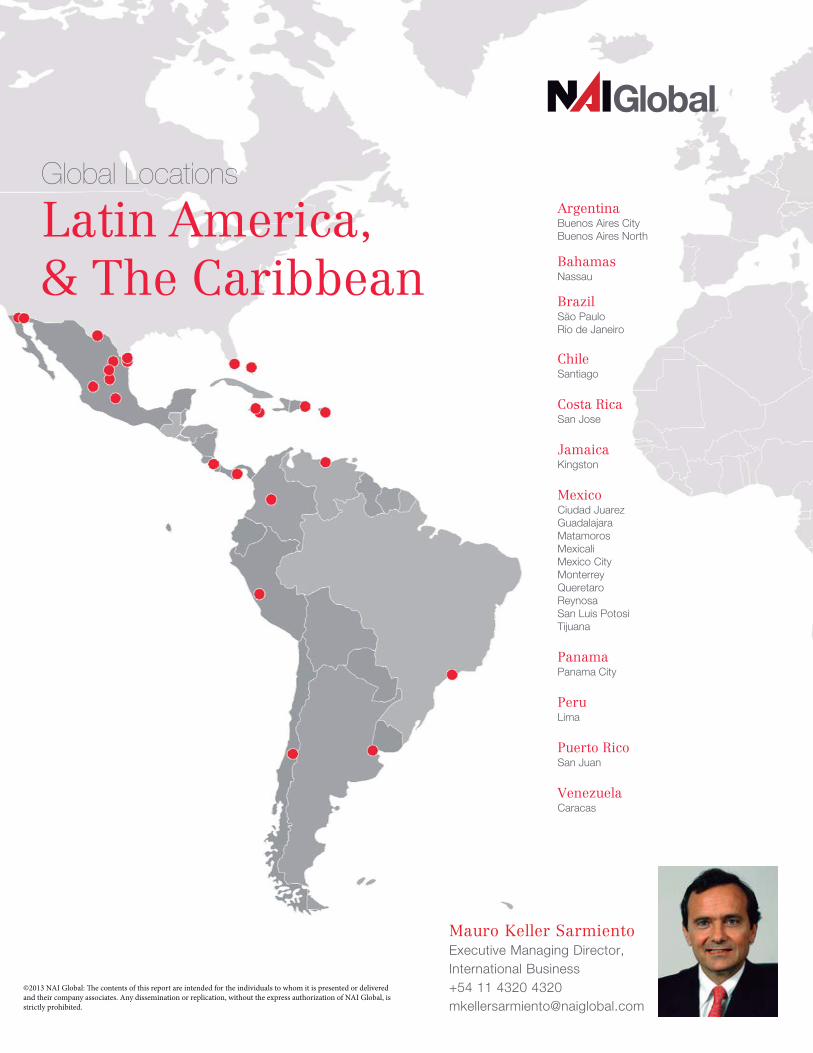
Global Locations
Latin America,& The Caribbean
ArgentinaBuenos Aires City
Buenos Aires North
BahamasNassau
BrazilSäo Paulo
Rio de Janeiro
ChileSantiago
Costa RicaSan Jose
JamaicaKingston
MexicoCiudad Juarez
Guadalajara
Matamoros
Mexicali
Mexico City
Monterrey
Queretaro
Reynosa
San Luis Potosi
Tijuana
PanamaPanama City
PeruLima
Puerto RicoSan Juan
VenezuelaCaracas
Mauro Keller Sarmiento Executive Managing Director,
International Business
+54 11 4320 4320
[email protected] their company associates. Any dissemination or replication, without the express authorization of NAI Global, is strictly prohibited.
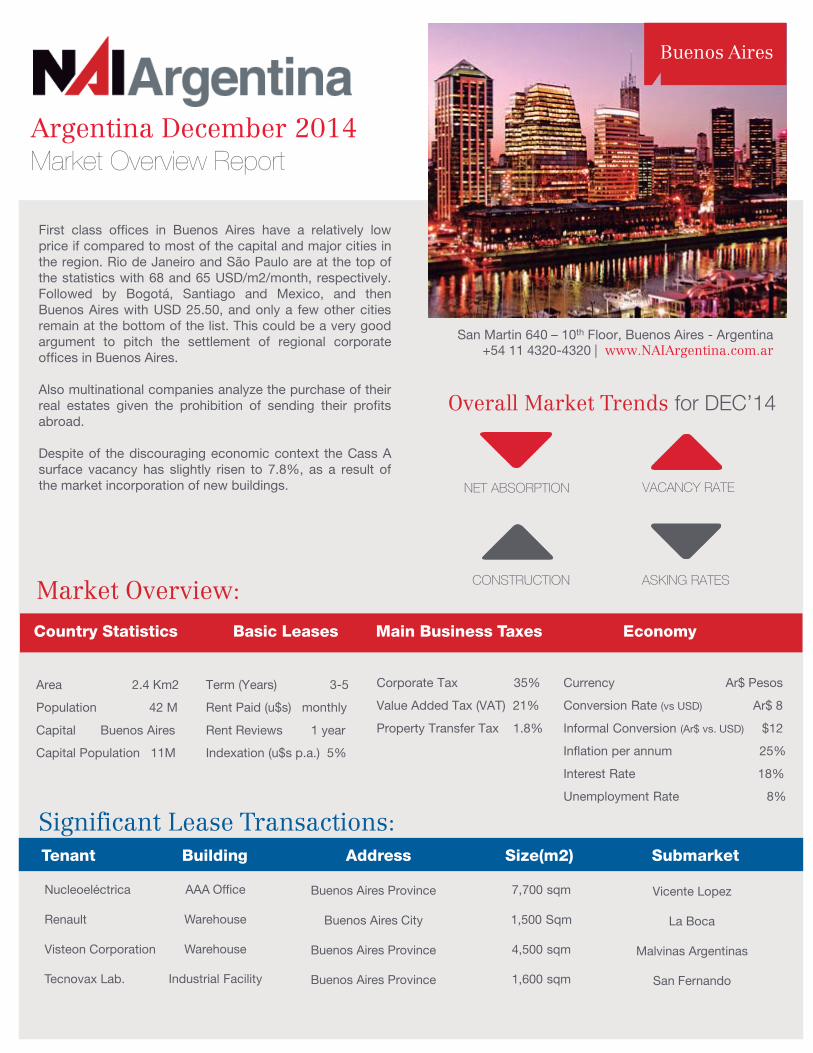
Argentina December 2014 Market Overview Report
Buenos Aires
San Martin 640 – 10th Floor, Buenos Aires - Argentina +54 11 4320-4320 | www.NAIArgentina.com.ar
Overall Market Trends for DEC’14
NET ABSORPTION
CONSTRUCTION
VACANCY RATE
ASKING RATES Market Overview:
Significant Lease Transactions: Tenant Building Address Size(m2) Submarket
Corporate Tax 35%
Value Added Tax (VAT) 21%
Property Transfer Tax 1.8%
Country Statistics Basic Leases Main Business Taxes Economy
First class offices in Buenos Aires have a relatively low price if compared to most of the capital and major cities in the region. Rio de Janeiro and São Paulo are at the top of the statistics with 68 and 65 USD/m2/month, respectively. Followed by Bogotá, Santiago and Mexico, and then Buenos Aires with USD 25.50, and only a few other cities remain at the bottom of the list. This could be a very good argument to pitch the settlement of regional corporate offices in Buenos Aires. Also multinational companies analyze the purchase of their real estates given the prohibition of sending their profits abroad. Despite of the discouraging economic context the Cass A surface vacancy has slightly risen to 7.8%, as a result of the market incorporation of new buildings.
Area 2.4 Km2
Population 42 M
Capital Buenos Aires
Capital Population 11M
Term (Years) 3-5
Rent Paid (u$s) monthly
Rent Reviews 1 year
Indexation (u$s p.a.) 5%
Currency Ar$ Pesos
Conversion Rate (vs USD) Ar$ 8
Informal Conversion (Ar$ vs. USD) $12
Inflation per annum 25%
Interest Rate 18%
Unemployment Rate 8%
Nucleoeléctrica Renault Visteon Corporation Tecnovax Lab.
AAA Office
Warehouse
Warehouse
Industrial Facility
Buenos Aires Province
Buenos Aires City
Buenos Aires Province
Buenos Aires Province
Vicente Lopez
La Boca
Malvinas Argentinas
San Fernando
7,700 sqm
1,500 Sqm
4,500 sqm
1,600 sqm
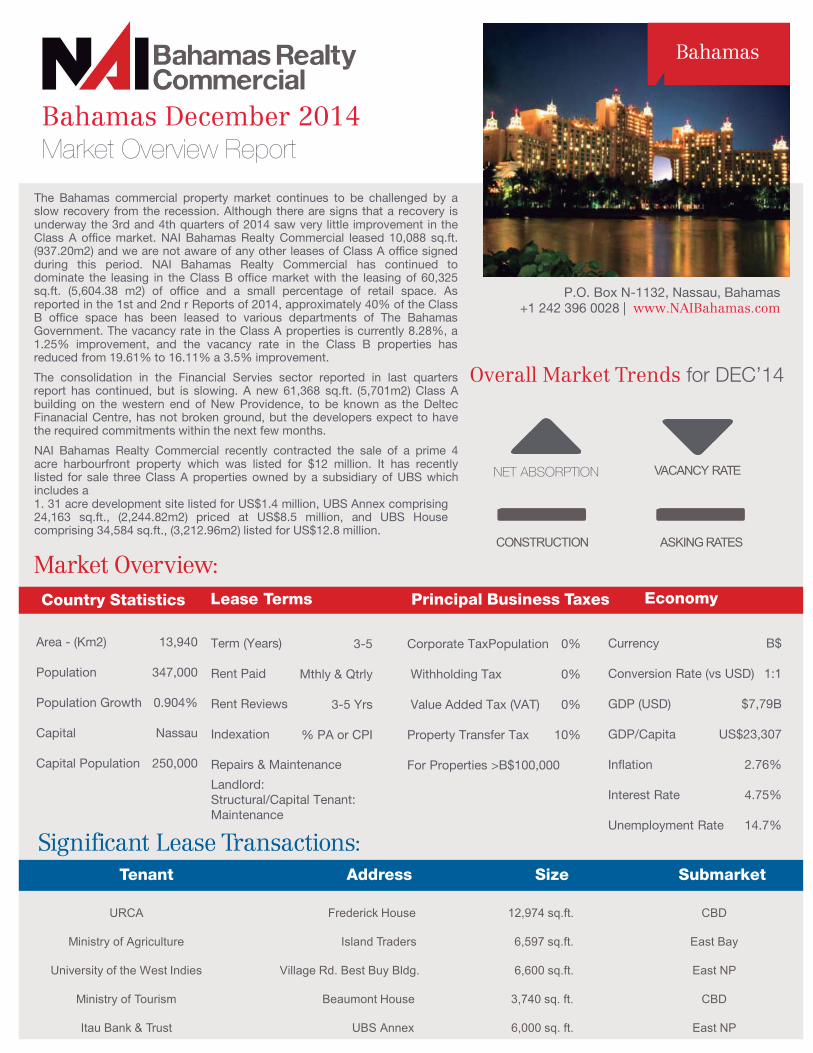
The Bahamas commercial property market continues to be challenged by a slow recovery from the recession. Although there are signs that a recovery is underway the 3rd and 4th quarters of 2014 saw very little improvement in the Class A office market. NAI Bahamas Realty Commercial leased 10,088 sq.ft. (937.20m2) and we are not aware of any other leases of Class A office signed during this period. NAI Bahamas Realty Commercial has continued to dominate the leasing in the Class B office market with the leasing of 60,325 sq.ft. (5,604.38 m2) of office and a small percentage of retail space. As reported in the 1st and 2nd r Reports of 2014, approximately 40% of the Class B office space has been leased to various departments of The Bahamas Government. The vacancy rate in the Class A properties is currently 8.28%, a 1.25% improvement, and the vacancy rate in the Class B properties has reduced from 19.61% to 16.11% a 3.5% improvement.
The consolidation in the Financial Servies sector reported in last quarters report has continued, but is slowing. A new 61,368 sq.ft. (5,701m2) Class A building on the western end of New Providence, to be known as the Deltec Finanacial Centre, has not broken ground, but the developers expect to have the required commitments within the next few months.
NAI Bahamas Realty Commercial recently contracted the sale of a prime 4 acre harbourfront property which was listed for $12 million. It has recently listed for sale three Class A properties owned by a subsidiary of UBS which includes a 1. 31 acre development site listed for US$1.4 million, UBS Annex comprising 24,163 sq.ft., (2,244.82m2) priced at US$8.5 million, and UBS House comprising 34,584 sq.ft., (3,212.96m2) listed for US$12.8 million.
.
NET ABSORPTION
CONSTRUCTION ASKING RATES
VACANCY RATE
Country Statistics Lease Terms Principal Business Taxes Economy
Market Overview:
Significant Lease Transactions: Tenant Address Size Submarket
URCA Frederick House 12,974 sq.ft. CBD
Ministry of Agriculture Island Traders 6,597 sq.ft. East Bay
University of the West Indies Village Rd. Best Buy Bldg. 6,600 sq.ft. East NP
Ministry of Tourism Beaumont House 3,740 sq. ft. CBD
Itau Bank & Trust UBS Annex 6,000 sq. ft. East NP
Bahamas December 2014 Market Overview Report
Overall Market Trends for DEC’14
P.O. Box N-1132, Nassau, Bahamas +1 242 396 0028 | www.NAIBahamas.com
Area - (Km2)
Population
Population Growth
Capital
Capital Population
13,940
347,000
0.904%
Nassau
250,000
Term (Years)
Rent Paid
Rent Reviews
Indexation
Repairs & Maintenance
Landlord: Structural/Capital Tenant: Maintenance
3-5
Mthly & Qtrly
3-5 Yrs
% PA or CPI
Corporate TaxPopulation
Withholding Tax
Value Added Tax (VAT)
Property Transfer Tax
For Properties >B$100,000
0%
0%
0%
10%
Currency
Conversion Rate (vs USD)
GDP (USD)
GDP/Capita
Inflation
Interest Rate
Unemployment Rate
B$
1:1
$7,79B
US$23,307
2.76%
4.75%
14.7%
Bahamas
Brazil December 2014 Market Overview Report
Overall Market Trends for DEC’14
NET ABSORPTION
CONSTRUCTION
VACANCY RATE
ASKING RATES
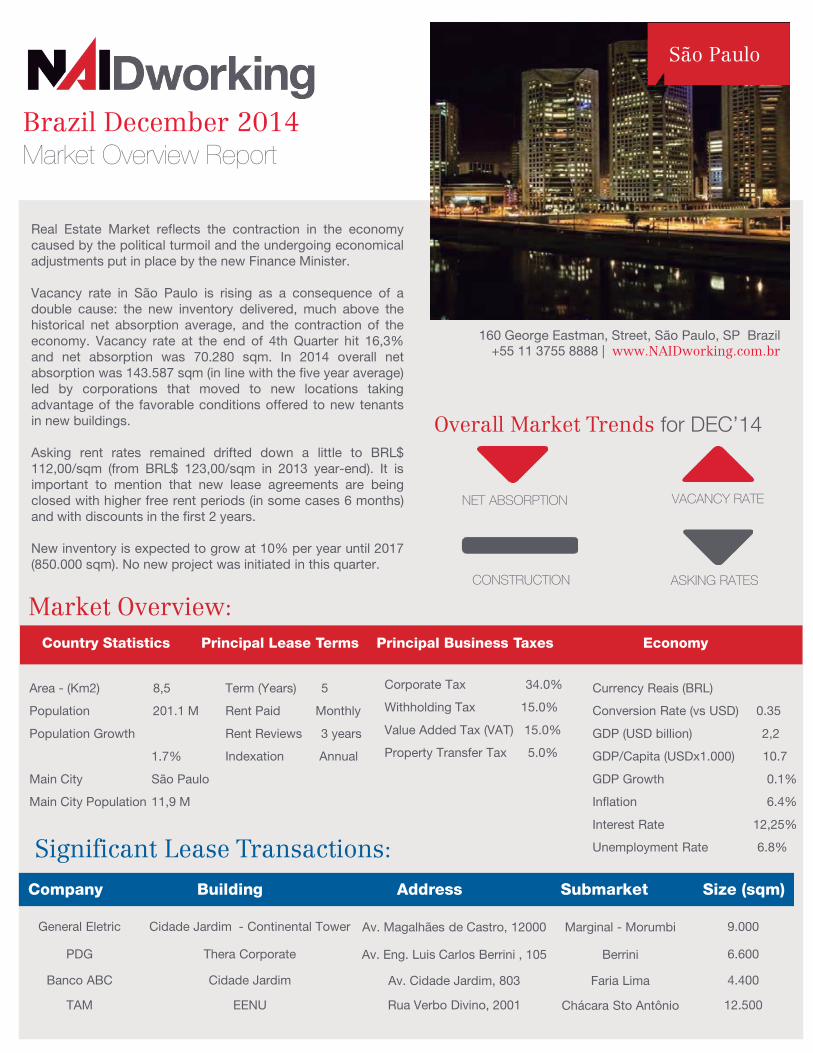
Real Estate Market reflects the contraction in the economy caused by the political turmoil and the undergoing economical adjustments put in place by the new Finance Minister. Vacancy rate in São Paulo is rising as a consequence of a double cause: the new inventory delivered, much above the historical net absorption average, and the contraction of the economy. Vacancy rate at the end of 4th Quarter hit 16,3% and net absorption was 70.280 sqm. In 2014 overall net absorption was 143.587 sqm (in line with the five year average) led by corporations that moved to new locations taking advantage of the favorable conditions offered to new tenants in new buildings. Asking rent rates remained drifted down a little to BRL$ 112,00/sqm (from BRL$ 123,00/sqm in 2013 year-end). It is important to mention that new lease agreements are being closed with higher free rent periods (in some cases 6 months) and with discounts in the first 2 years. New inventory is expected to grow at 10% per year until 2017 (850.000 sqm). No new project was initiated in this quarter.
Market Overview:
Significant Lease Transactions:
Company Building Address Submarket Size (sqm)
Country Statistics Principal Lease Terms Principal Business Taxes Economy
Area - (Km2) 8,5
Population 201.1 M
Population Growth
1.7%
Main City São Paulo
Main City Population 11,9 M
Term (Years) 5
Rent Paid Monthly
Rent Reviews 3 years
Indexation Annual
Corporate Tax 34.0%
Withholding Tax 15.0%
Value Added Tax (VAT) 15.0%
Property Transfer Tax 5.0%
Currency Reais (BRL)
Conversion Rate (vs USD) 0.35
GDP (USD billion) 2,2
GDP/Capita (USDx1.000) 10.7
GDP Growth 0.1%
Inflation 6.4%
Interest Rate 12,25%
Unemployment Rate 6.8%
General Eletric Cidade Jardim - Continental Tower Av. Magalhães de Castro, 12000 Marginal - Morumbi 9.000
PDG Thera Corporate Av. Eng. Luis Carlos Berrini , 105 Berrini 6.600
Banco ABC Cidade Jardim Av. Cidade Jardim, 803 Faria Lima 4.400
TAM EENU Rua Verbo Divino, 2001 Chácara Sto Antônio 12.500
160 George Eastman, Street, São Paulo, SP Brazil +55 11 3755 8888 | www.NAIDworking.com.br
São Paulo
Chile December 2014 Market Overview Report
ASKING RATES
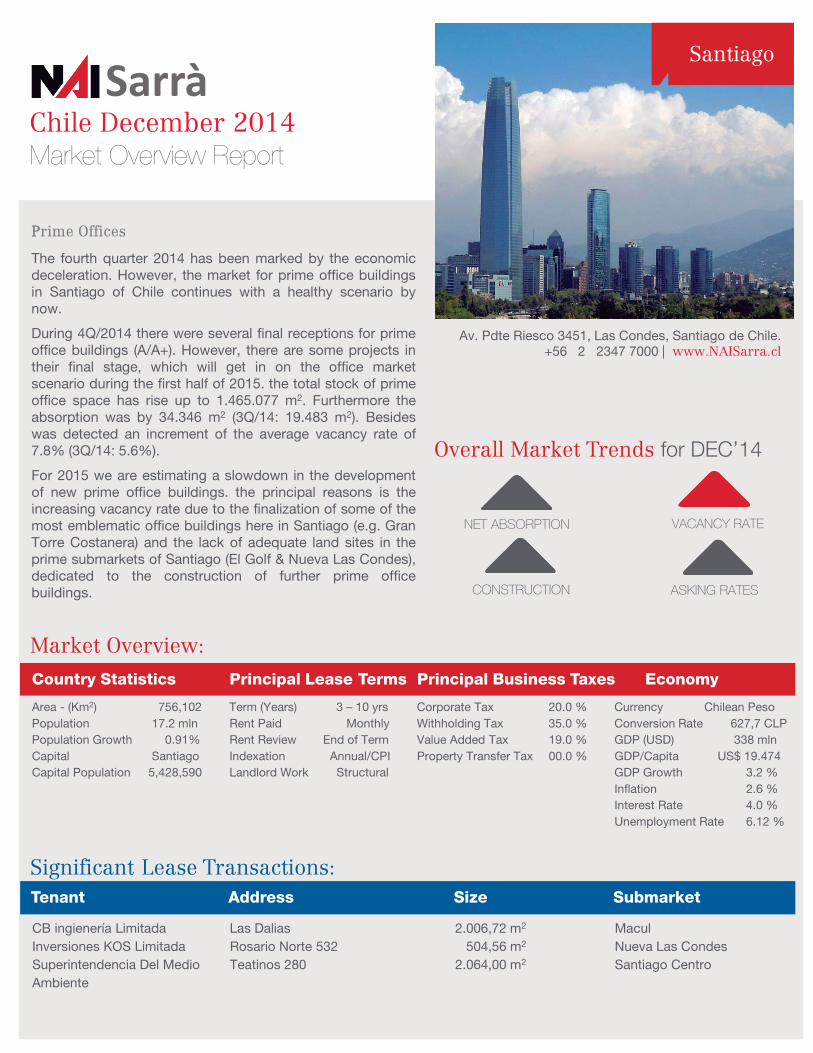
The fourth quarter 2014 has been marked by the economic deceleration. However, the market for prime office buildings in Santiago of Chile continues with a healthy scenario by now.
During 4Q/2014 there were several final receptions for prime office buildings (A/A+). However, there are some projects in their final stage, which will get in on the office market scenario during the first half of 2015. the total stock of prime office space has rise up to 1.465.077 m2. Furthermore the absorption was by 34.346 m2 (3Q/14: 19.483 m2). Besides was detected an increment of the average vacancy rate of 7.8% (3Q/14: 5.6%).
For 2015 we are estimating a slowdown in the development of new prime office buildings. the principal reasons is the increasing vacancy rate due to the finalization of some of the most emblematic office buildings here in Santiago (e.g. Gran Torre Costanera) and the lack of adequate land sites in the prime submarkets of Santiago (El Golf & Nueva Las Condes), dedicated to the construction of further prime office buildings.
Market Overview:
CB ingienería Limitada Las Dalias 2.006,72 m2 Macul Inversiones KOS Limitada Rosario Norte 532 504,56 m2 Nueva Las Condes Superintendencia Del Medio Teatinos 280 2.064,00 m2 Santiago Centro Ambiente
Significant Lease Transactions: Tenant Address Size Submarket
Area - (Km2) 756,102 Term (Years) 3 – 10 yrs Corporate Tax 20.0 % Currency Chilean Peso Population 17.2 mln Rent Paid Monthly Withholding Tax 35.0 % Conversion Rate 627,7 CLP Population Growth 0.91% Rent Review End of Term Value Added Tax 19.0 % GDP (USD) 338 mln Capital Santiago Indexation Annual/CPI Property Transfer Tax 00.0 % GDP/Capita US$ 19.474 Capital Population 5,428,590 Landlord Work Structural GDP Growth 3.2 %
Inflation 2.6 % Interest Rate 4.0 % Unemployment Rate 6.12 %
Country Statistics Principal Lease Terms Principal Business Taxes Economy
Sarrà
NET ABSORPTION
CONSTRUCTION
VACANCY RATE
PPrime Offices
Overall Market Trends for DEC’14
Av. Pdte Riesco 3451, Las Condes, Santiago de Chile. +56 2 2347 7000 | www.NAISarra.cl
Santiago
Costa Rica December 2014 Market Overview Report
NET ABSORPTION
CONSTRUCTION
VACANCY RATE
ASKING RATES
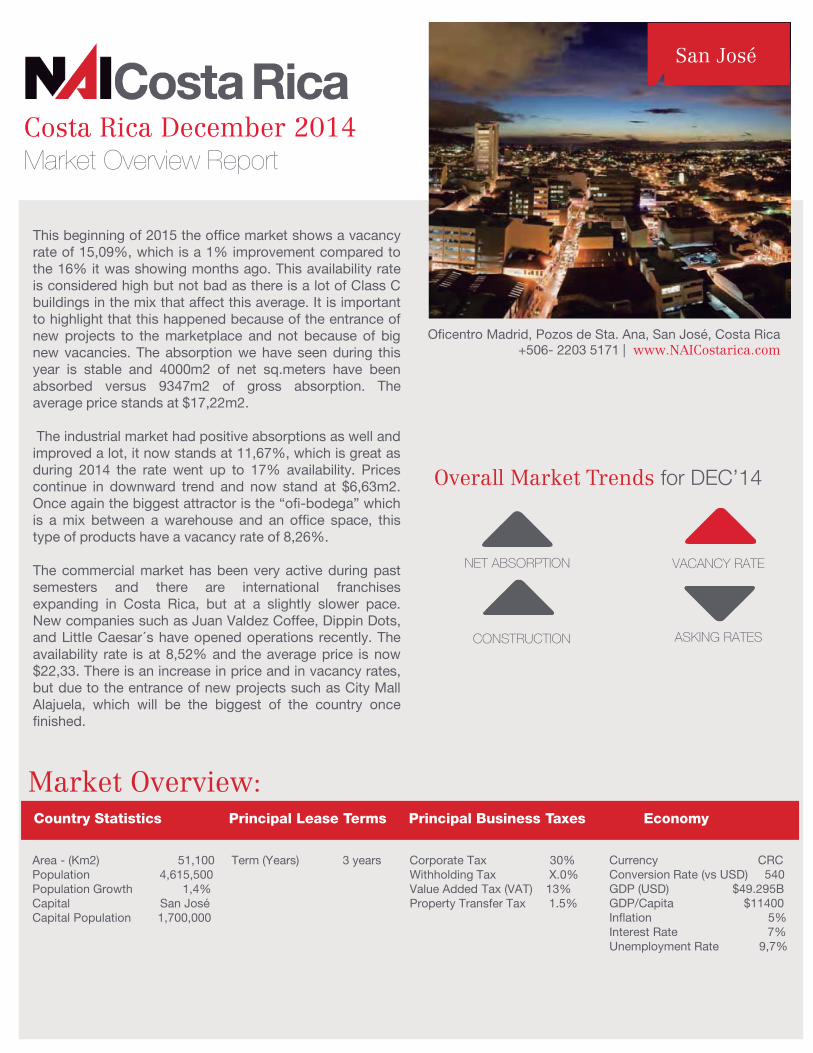
This beginning of 2015 the office market shows a vacancy rate of 15,09%, which is a 1% improvement compared to the 16% it was showing months ago. This availability rate is considered high but not bad as there is a lot of Class C buildings in the mix that affect this average. It is important to highlight that this happened because of the entrance of new projects to the marketplace and not because of big new vacancies. The absorption we have seen during this year is stable and 4000m2 of net sq.meters have been absorbed versus 9347m2 of gross absorption. The average price stands at $17,22m2. The industrial market had positive absorptions as well and improved a lot, it now stands at 11,67%, which is great as during 2014 the rate went up to 17% availability. Prices continue in downward trend and now stand at $6,63m2. Once again the biggest attractor is the “ofi-bodega” which is a mix between a warehouse and an office space, this type of products have a vacancy rate of 8,26%. The commercial market has been very active during past semesters and there are international franchises expanding in Costa Rica, but at a slightly slower pace. New companies such as Juan Valdez Coffee, Dippin Dots, and Little Caesar´s have opened operations recently. The availability rate is at 8,52% and the average price is now $22,33. There is an increase in price and in vacancy rates, but due to the entrance of new projects such as City Mall Alajuela, which will be the biggest of the country once finished.
Market Overview: Country Statistics Principal Lease Terms Principal Business Taxes Economy
Area - (Km2) 51,100 Population 4,615,500 Population Growth 1,4% Capital San José Capital Population 1,700,000
Term (Years) 3 years Corporate Tax 30% Withholding Tax X.0% Value Added Tax (VAT) 13% Property Transfer Tax 1.5%
Currency CRC Conversion Rate (vs USD) 540 GDP (USD) $49.295B GDP/Capita $11400 Inflation 5% Interest Rate 7% Unemployment Rate 9,7%
Overall Market Trends for DEC’14
Oficentro Madrid, Pozos de Sta. Ana, San José, Costa Rica +506- 2203 5171 | www.NAICostarica.com
San José
Jamaica December 2014 Market Overview Report
Overall Market Trends for DEC’14
NET ABSORPTION
CONSTRUCTION
VACANCY RATE
ASKING RATES
Market Overview:
Current Currency Ja Dolls GDP US$ 12,3442 GDP/Capita US$ 4,400 GDP Growth (forecast 2009) -3% Inflation 8.0% Interest Rate 3 Month 6.5% Unemployment Rate 13%
Economy Principal Business Taxes
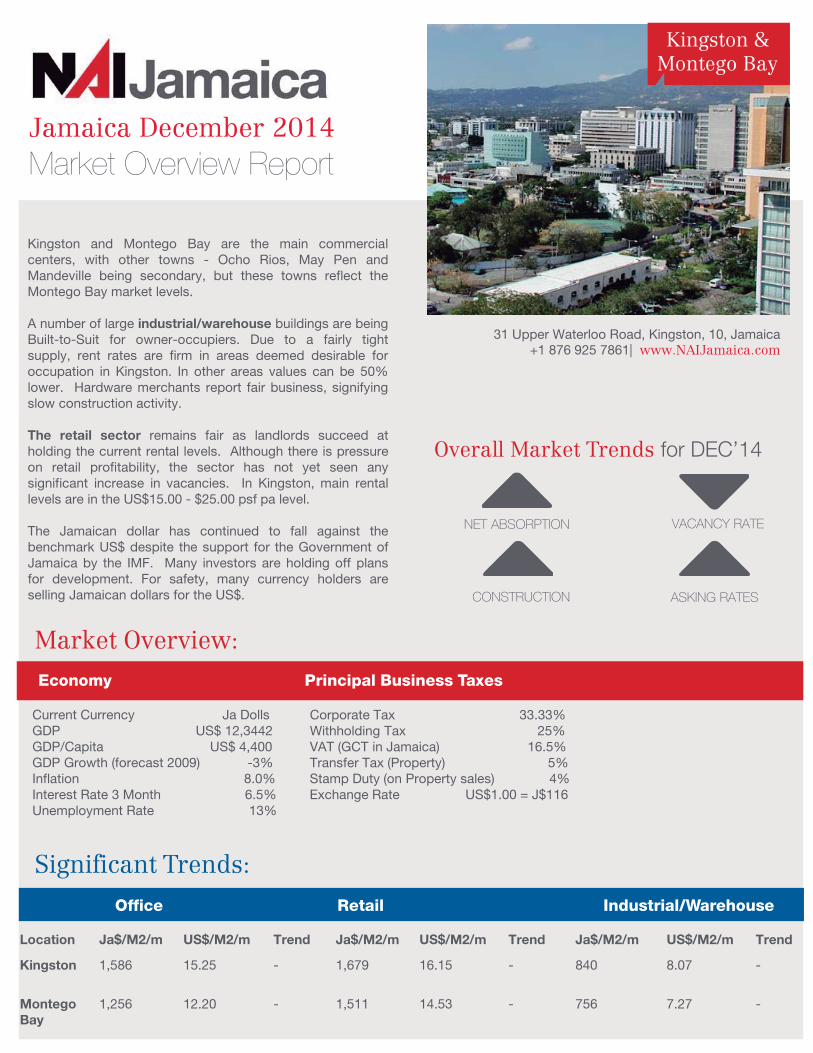
Kingston and Montego Bay are the main commercial centers, with other towns - Ocho Rios, May Pen and Mandeville being secondary, but these towns reflect the Montego Bay market levels. A number of large industrial/warehouse buildings are being Built-to-Suit for owner-occupiers. Due to a fairly tight supply, rent rates are firm in areas deemed desirable for occupation in Kingston. In other areas values can be 50% lower. Hardware merchants report fair business, signifying slow construction activity. The retail sector remains fair as landlords succeed at holding the current rental levels. Although there is pressure on retail profitability, the sector has not yet seen any significant increase in vacancies. In Kingston, main rental levels are in the US$15.00 - $25.00 psf pa level. The Jamaican dollar has continued to fall against the benchmark US$ despite the support for the Government of Jamaica by the IMF. Many investors are holding off plans for development. For safety, many currency holders are selling Jamaican dollars for the US$.
Corporate Tax 33.33% Withholding Tax 25% VAT (GCT in Jamaica) 16.5% Transfer Tax (Property) 5% Stamp Duty (on Property sales) 4% Exchange Rate US$1.00 = J$116
Location Ja$/M2/m US$/M2/m Trend Ja$/M2/m US$/M2/m Trend Ja$/M2/m US$/M2/m Trend
Kingston 1,586 15.25 - 1,679 16.15 - 840 8.07 -
Montego
Bay
1,256 12.20 - 1,511 14.53 - 756 7.27 -
Significant Trends:
31 Upper Waterloo Road, Kingston, 10, Jamaica +1 876 925 7861| www.NAIJamaica.com
Kingston & Montego Bay
Office Retail Industrial/Warehouse
Mexico December 2014 Market Overview Report
NET ABSORPTION
CONSTRUCTION
VACANCY RATE
ASKING RATES
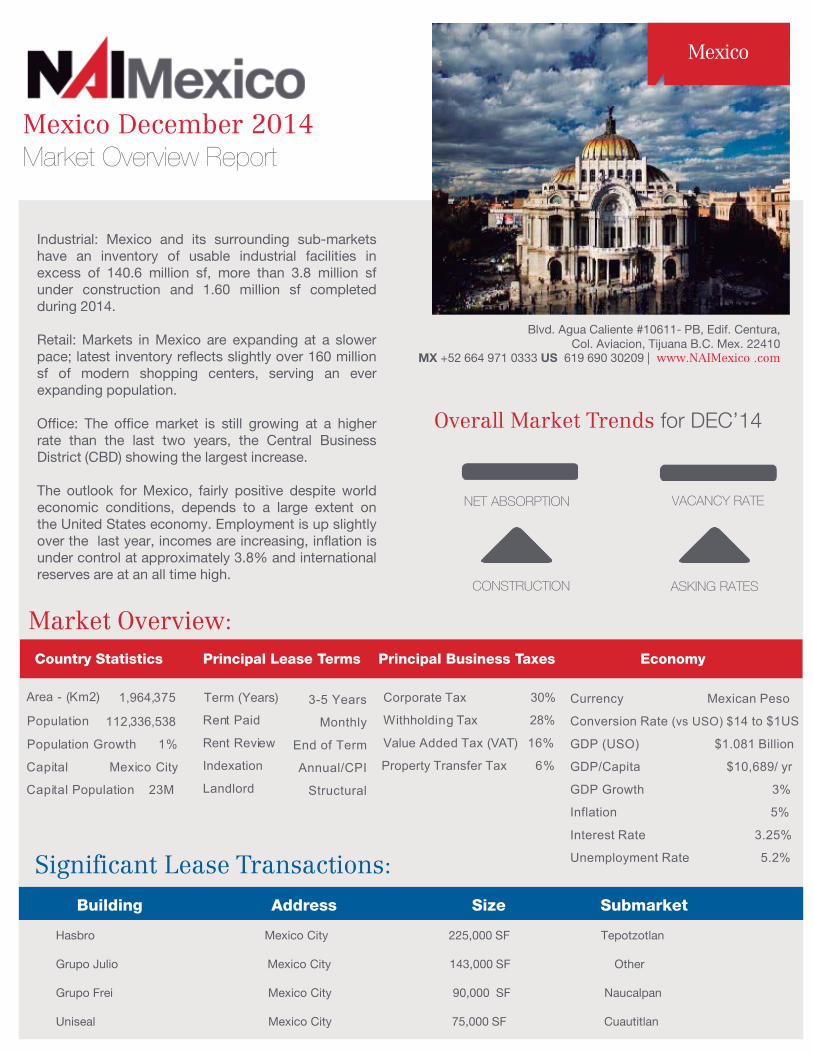
Industrial: Mexico and its surrounding sub-markets have an inventory of usable industrial facilities in excess of 140.6 million sf, more than 3.8 million sf under construction and 1.60 million sf completed during 2014. Retail: Markets in Mexico are expanding at a slower pace; latest inventory reflects slightly over 160 million sf of modern shopping centers, serving an ever expanding population. Office: The office market is still growing at a higher rate than the last two years, the Central Business District (CBD) showing the largest increase. The outlook for Mexico, fairly positive despite world economic conditions, depends to a large extent on the United States economy. Employment is up slightly over the last year, incomes are increasing, inflation is under control at approximately 3.8% and international reserves are at an all time high.
Market Overview:
Significant Lease Transactions:
Building Address Size Submarket
Country Statistics Principal Lease Terms Principal Business Taxes Economy Area - (Km2) 1,964,375
Population 112,336,538
Population Growth 1%
Capital Mexico City
Capital Population 23M
Term (Years)
Rent Paid
Rent Review
Indexation
Landlord
Corporate Tax 30%
Withholding Tax 28%
Value Added Tax (VAT) 16%
Property Transfer Tax 6%
Hasbro Mexico City 225,000 SF Tepotzotlan Grupo Julio Mexico City 143,000 SF Other Grupo Frei Mexico City 90,000 SF Naucalpan Uniseal Mexico City 75,000 SF Cuautitlan
Me ico December 2014
Currency Mexican Peso
Conversion Rate (vs USO) $14 to $1US
GDP (USO) $1.081 Billion
GDP/Capita $10,689/ yr
GDP Growth 3%
Inflation 5%
Interest Rate 3.25%
Unemployment Rate 5.2%
3-5 Years
Monthly
End of Term
Annual/CPI
Structural
Overall Market Trends for DEC’14
Blvd. Agua Caliente #10611- PB, Edif. Centura, Col. Aviacion, Tijuana B.C. Mex. 22410
MX +52 664 971 0333 US 619 690 30209 | www.NAIMexico .com
Mexico
Panama December 2014 Market Overview Report
NET ABSORPTION
CONSTRUCTION
VACANCY RATE
ASKING RATES
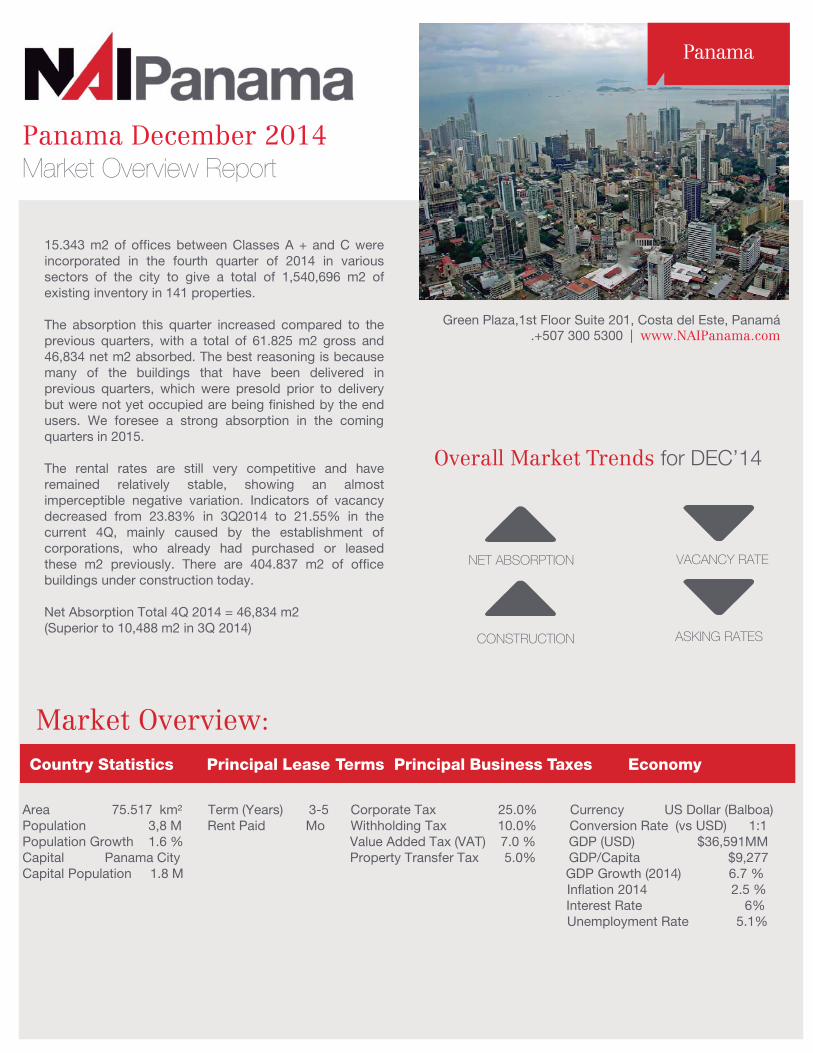
15.343 m2 of offices between Classes A + and C were incorporated in the fourth quarter of 2014 in various sectors of the city to give a total of 1,540,696 m2 of existing inventory in 141 properties. The absorption this quarter increased compared to the previous quarters, with a total of 61.825 m2 gross and 46,834 net m2 absorbed. The best reasoning is because many of the buildings that have been delivered in previous quarters, which were presold prior to delivery but were not yet occupied are being finished by the end users. We foresee a strong absorption in the coming quarters in 2015. The rental rates are still very competitive and have remained relatively stable, showing an almost imperceptible negative variation. Indicators of vacancy decreased from 23.83% in 3Q2014 to 21.55% in the current 4Q, mainly caused by the establishment of corporations, who already had purchased or leased these m2 previously. There are 404.837 m2 of office buildings under construction today. Net Absorption Total 4Q 2014 = 46,834 m2 (Superior to 10,488 m2 in 3Q 2014)
Market Overview: Country Statistics Principal Lease Terms Principal Business Taxes Economy
Area 75.517 km2 Term (Years) 3-5 Corporate Tax 25.0% Currency US Dollar (Balboa) Population 3,8 M Rent Paid Mo Withholding Tax 10.0% Conversion Rate (vs USD) 1:1 Population Growth 1.6 % Value Added Tax (VAT) 7.0 % GDP (USD) $36,591MM Capital Panama City Property Transfer Tax 5.0% GDP/Capita $9,277 Capital Population 1.8 M GDP Growth (2014) 6.7 % Inflation 2014 2.5 % Interest Rate 6% Unemployment Rate 5.1%
Overall Market Trends for DEC’14
Green Plaza,1st Floor Suite 201, Costa del Este, Panamá .+507 300 5300 | www.NAIPanama.com
Panama
Peru December 2014 Market Overview Report
NET ABSORPTION
CONSTRUCTION
VACANCY RATE
ASKING RATES
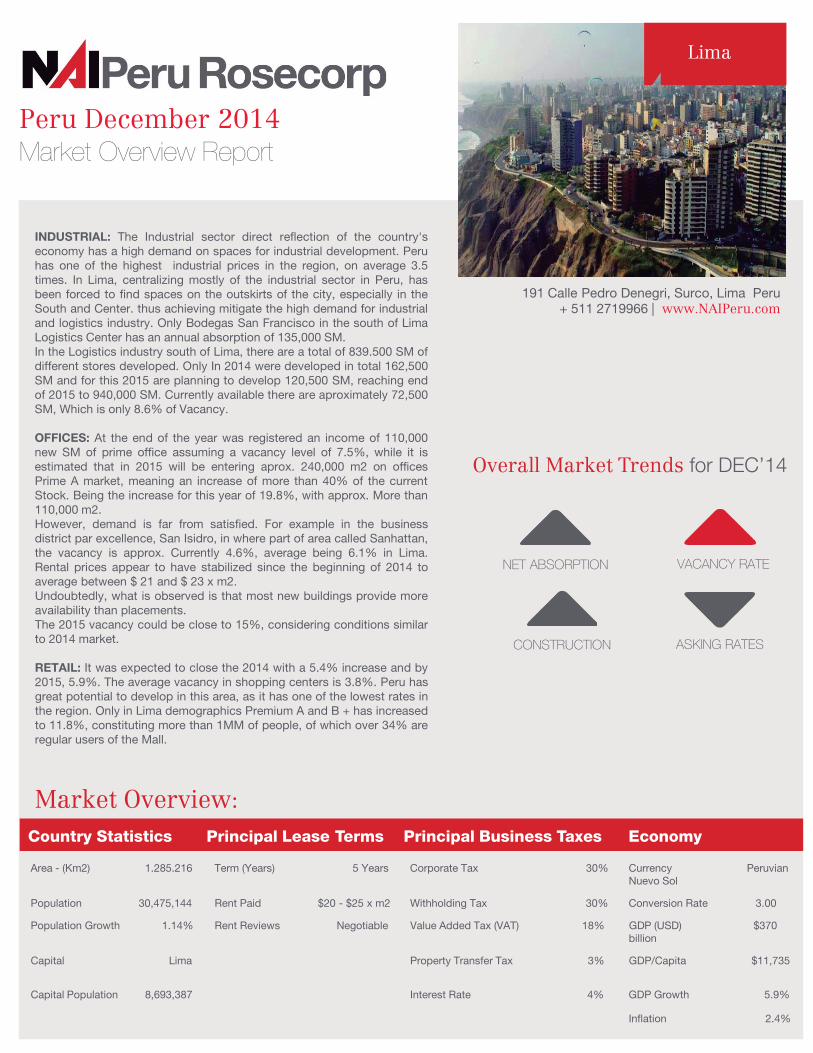
INDUSTRIAL: The Industrial sector direct reflection of the country's economy has a high demand on spaces for industrial development. Peru has one of the highest industrial prices in the region, on average 3.5 times. In Lima, centralizing mostly of the industrial sector in Peru, has been forced to find spaces on the outskirts of the city, especially in the South and Center. thus achieving mitigate the high demand for industrial and logistics industry. Only Bodegas San Francisco in the south of Lima Logistics Center has an annual absorption of 135,000 SM. In the Logistics industry south of Lima, there are a total of 839.500 SM of different stores developed. Only In 2014 were developed in total 162,500 SM and for this 2015 are planning to develop 120,500 SM, reaching end of 2015 to 940,000 SM. Currently available there are aproximately 72,500 SM, Which is only 8.6% of Vacancy. OFFICES: At the end of the year was registered an income of 110,000 new SM of prime office assuming a vacancy level of 7.5%, while it is estimated that in 2015 will be entering aprox. 240,000 m2 on offices Prime A market, meaning an increase of more than 40% of the current Stock. Being the increase for this year of 19.8%, with approx. More than 110,000 m2. However, demand is far from satisfied. For example in the business district par excellence, San Isidro, in where part of area called Sanhattan, the vacancy is approx. Currently 4.6%, average being 6.1% in Lima. Rental prices appear to have stabilized since the beginning of 2014 to average between $ 21 and $ 23 x m2. Undoubtedly, what is observed is that most new buildings provide more availability than placements. The 2015 vacancy could be close to 15%, considering conditions similar to 2014 market.
RETAIL: It was expected to close the 2014 with a 5.4% increase and by 2015, 5.9%. The average vacancy in shopping centers is 3.8%. Peru has great potential to develop in this area, as it has one of the lowest rates in the region. Only in Lima demographics Premium A and B + has increased to 11.8%, constituting more than 1MM of people, of which over 34% are regular users of the Mall.
Market Overview:
Area - (Km2) 1.285.216 Term (Years) 5 Years Corporate Tax 30% Currency Peruvian Nuevo Sol
Population 30,475,144 Rent Paid $20 - $25 x m2 Withholding Tax 30% Conversion Rate 3.00
Population Growth 1.14% Rent Reviews Negotiable Value Added Tax (VAT) 18% GDP (USD) $370 billion
Capital Lima Property Transfer Tax 3% GDP/Capita $11,735
Capital Population 8,693,387 Interest Rate 4% GDP Growth 5.9%
Inflation 2.4%
Overall Market Trends for DEC’14
191 Calle Pedro Denegri, Surco, Lima Peru + 511 2719966 | www.NAIPeru.com
Lima
Country Statistics Principal Lease Terms Principal Business Taxes Economy
Puerto Rico December 2014 Market Overview Report
NET ABSORPTION
CONSTRUCTION
VACANCY RATE
ASKING RATES
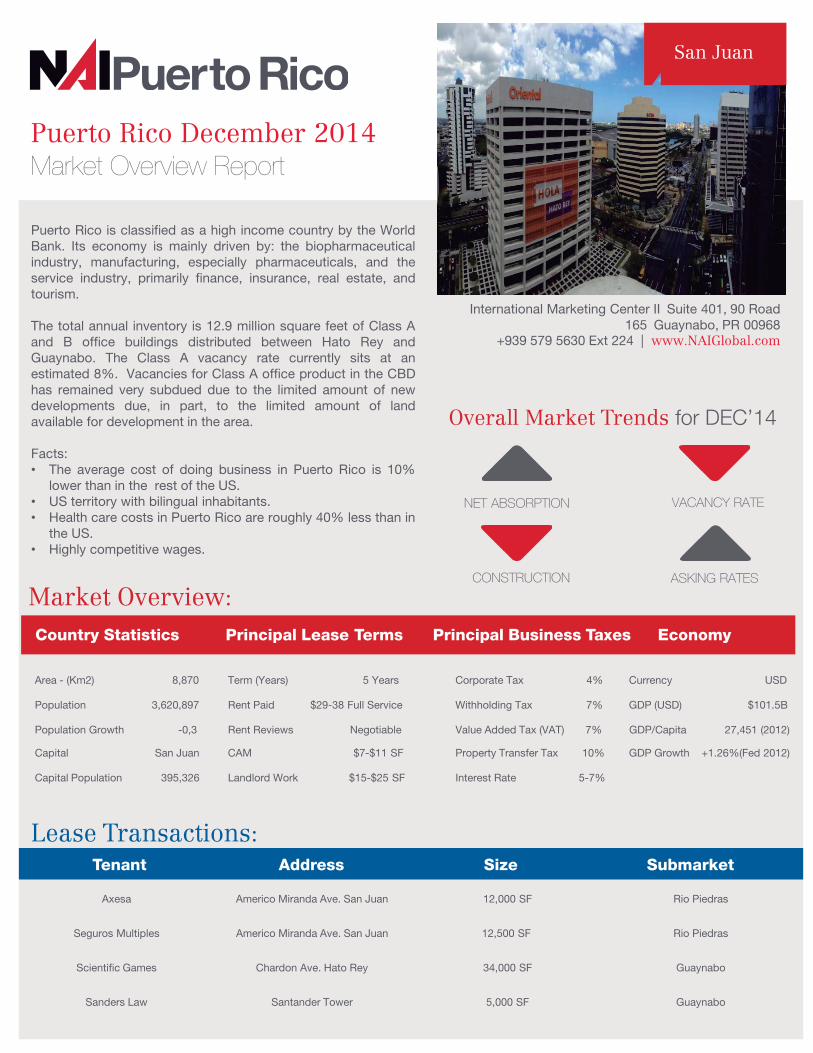
Puerto Rico is classified as a high income country by the World Bank. Its economy is mainly driven by: the biopharmaceutical industry, manufacturing, especially pharmaceuticals, and the service industry, primarily finance, insurance, real estate, and tourism. The total annual inventory is 12.9 million square feet of Class A and B office buildings distributed between Hato Rey and Guaynabo. The Class A vacancy rate currently sits at an estimated 8%. Vacancies for Class A office product in the CBD has remained very subdued due to the limited amount of new developments due, in part, to the limited amount of land available for development in the area. Facts: • The average cost of doing business in Puerto Rico is 10%
lower than in the rest of the US. • US territory with bilingual inhabitants. • Health care costs in Puerto Rico are roughly 40% less than in
the US. • Highly competitive wages.
Market Overview:
Lease Transactions:
Country Statistics Principal Lease Terms Principal Business Taxes Economy
Area - (Km2) 8,870 Term (Years) 5 Years Corporate Tax 4% Currency USD
Population 3,620,897 Rent Paid $29-38 Full Service Withholding Tax 7% GDP (USD) $101.5B
Population Growth -0,3 Rent Reviews Negotiable Value Added Tax (VAT) 7% GDP/Capita 27,451 (2012)
Capital San Juan CAM $7-$11 SF Property Transfer Tax 10% GDP Growth +1.26%(Fed 2012)
Capital Population 395,326 Landlord Work $15-$25 SF Interest Rate 5-7%
Axesa Americo Miranda Ave. San Juan 12,000 SF Rio Piedras
Seguros Multiples Americo Miranda Ave. San Juan 12,500 SF Rio Piedras
Scientific Games Chardon Ave. Hato Rey 34,000 SF Guaynabo
Sanders Law Santander Tower 5,000 SF Guaynabo
Overall Market Trends for DEC’14
International Marketing Center II Suite 401, 90 Road 165 Guaynabo, PR 00968
+939 579 5630 Ext 224 | www.NAIGlobal.com
San Juan
Tenant Address Size Submarket
Area - (Km2)Population Population GrowthCapital
916445 km30,400,000
2.42%Caracas
Term(Years)Rent Reviews
3 YearsEnd of term
Corporate Tax 34%Value Added Tax (VAT) 12.0%Property Transfer Tax 5.0%Interest Rate 24%
438MM$US$ 14.400
CurrencyConversion Rate (vs USD) US$49,96
BS
GDP (USD)GDP/Capita (2013)
NET ABSORPTION
CONSTRUCTION ASKING RATES
VACANCY RATE
Venezuela
(sicad II)
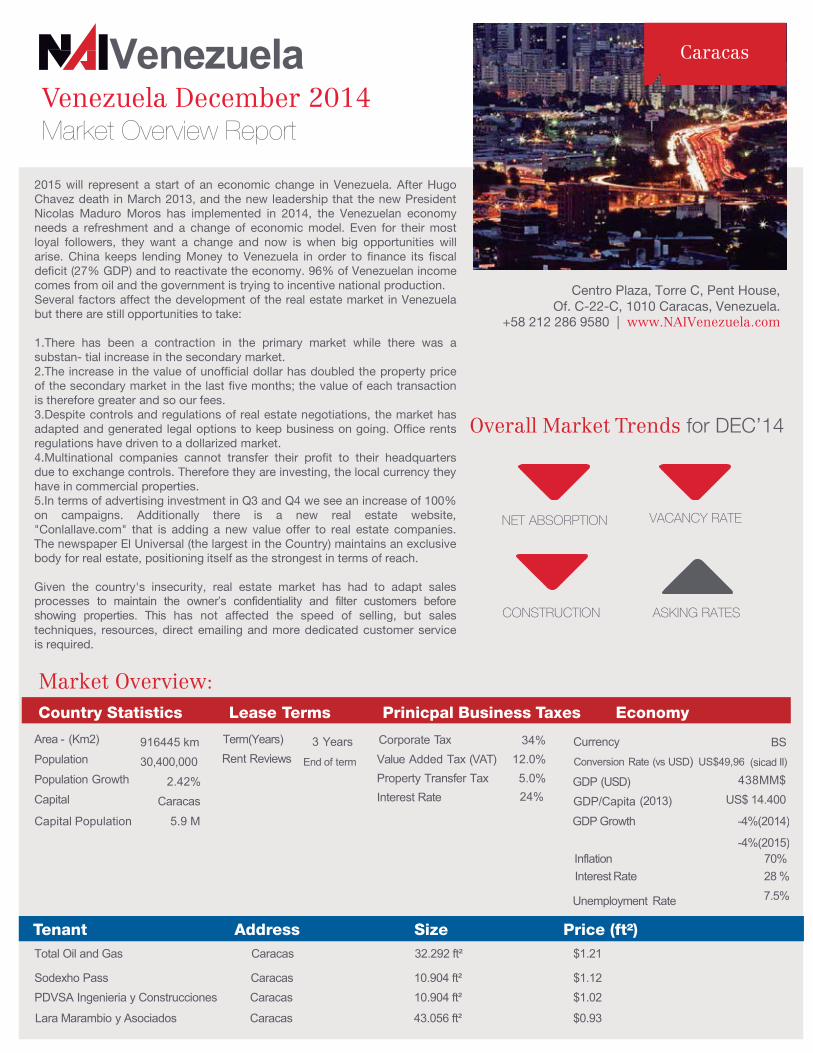
2015 will represent a start of an economic change in Venezuela. After Hugo Chavez death in March 2013, and the new leadership that the new President Nicolas Maduro Moros has implemented in 2014, the Venezuelan economy needs a refreshment and a change of economic model. Even for their most loyal followers, they want a change and now is when big opportunities will arise. China keeps lending Money to Venezuela in order to finance its fiscal deficit (27% GDP) and to reactivate the economy. 96% of Venezuelan income comes from oil and the government is trying to incentive national production. Several factors affect the development of the real estate market in Venezuela but there are still opportunities to take: 1.There has been a contraction in the primary market while there was a substan- tial increase in the secondary market. 2.The increase in the value of unofficial dollar has doubled the property price of the secondary market in the last five months; the value of each transaction is therefore greater and so our fees. 3.Despite controls and regulations of real estate negotiations, the market has adapted and generated legal options to keep business on going. Office rents regulations have driven to a dollarized market. 4.Multinational companies cannot transfer their profit to their headquarters due to exchange controls. Therefore they are investing, the local currency they have in commercial properties. 5.In terms of advertising investment in Q3 and Q4 we see an increase of 100% on campaigns. Additionally there is a new real estate website, "Conlallave.com" that is adding a new value offer to real estate companies. The newspaper El Universal (the largest in the Country) maintains an exclusive body for real estate, positioning itself as the strongest in terms of reach.
Given the country's insecurity, real estate market has had to adapt sales processes to maintain the owner’s confidentiality and filter customers beforeshowing properties. This has not affected the speed of selling, but sales techniques, resources, direct emailing and more dedicated customer service is required.
Venezuela December 2014 Market Overview Report
Overall Market Trends for DEC’14
Market Overview: Country Statistics Lease Terms Prinicpal Business Taxes Economy
Centro Plaza, Torre C, Pent House, Of. C-22-C, 1010 Caracas, Venezuela.
+58 212 286 9580 | www.NAIVenezuela.com
Caracas
Capital Population 5.9 M GDP Growth -4%(2014)
-4%(2015)Inflation 70% Interest Rate 28 %
Unemployment Rate 7.5% Tenant Address Size Price (ft²) Total Oil and Gas Caracas 32.292 ft² $1.21
Sodexho Pass Caracas 10.904 ft² $1.12PDVSA Ingenieria y Construcciones Caracas 10.904 ft² $1.02
Lara Marambio y Asociados Caracas 43.056 ft² $0.93

All actively managed to work wherever you do.
Q
717 Fifth Avenue,12th FloorNew York, New York 10022tel +1 212 405 2500www.naiglobal.com
The world’s largest commercial real estate network.
Over 380 million square feet of property managed.All actively managed to work wherever you do.
Latin America & The Caribbean
MARKET REPORTDECEMBER 2014