Embed Size (px)
Citation preview
Market Outlook and Emergence of Market Outlook and Emergence of ValueValue--Added OpportunitiesAdded Opportunities
Hot Topics on Peanuts Seminar2005 Georgia Peanut TourDr. Nathan B. Smith, University of Georgia
Dr. Stanley M. Fletcher, University of Georgia
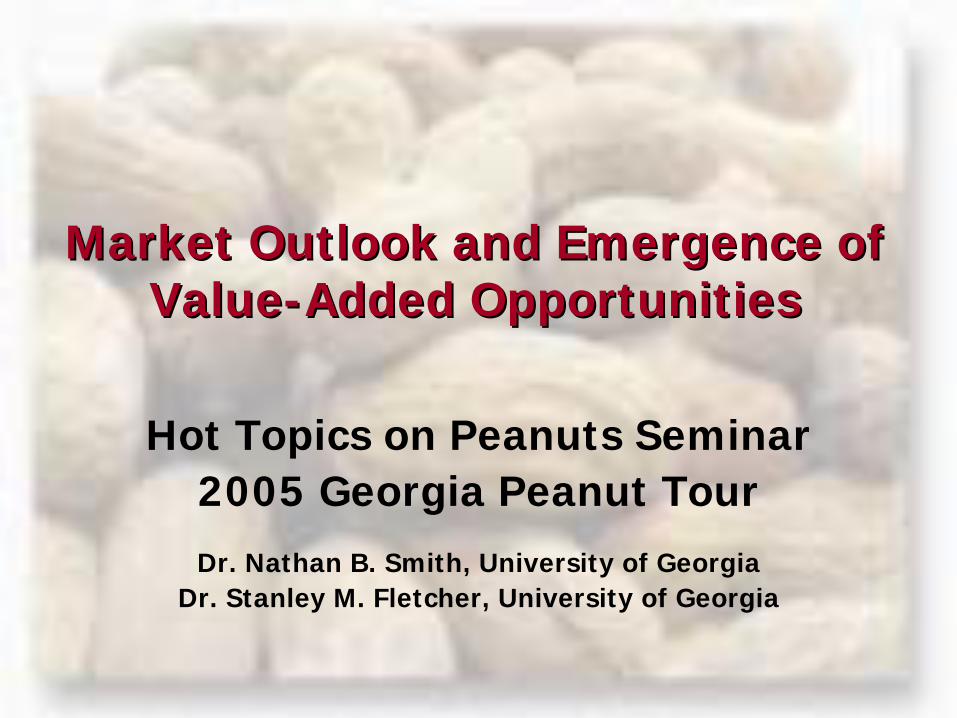
Current Peanut Situation• Initial peanut crop estimate forecasts record US
production (2.56 million tons) and yield (3190lb/ac). • High “watermark”? FSA reported acreage…
– Georgia ~ 750,000 acres (780,000 NASS projection)– US 1.62 million (1.65 million NASS)
• Continue to see historically strong growth in food use.• Lower shelled and farmer stock contract prices.• Spring contracts on limited tonnage.• Biggest crop concerns are majority of crop planted in
2½ - 3 weeks & potential for tropical storms at harvest.
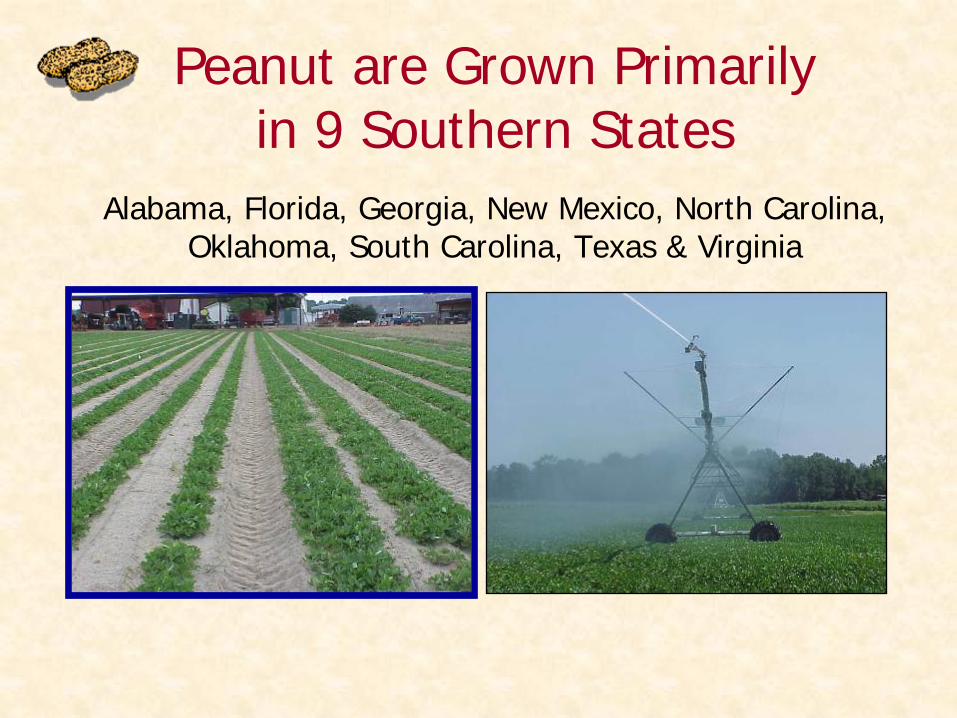
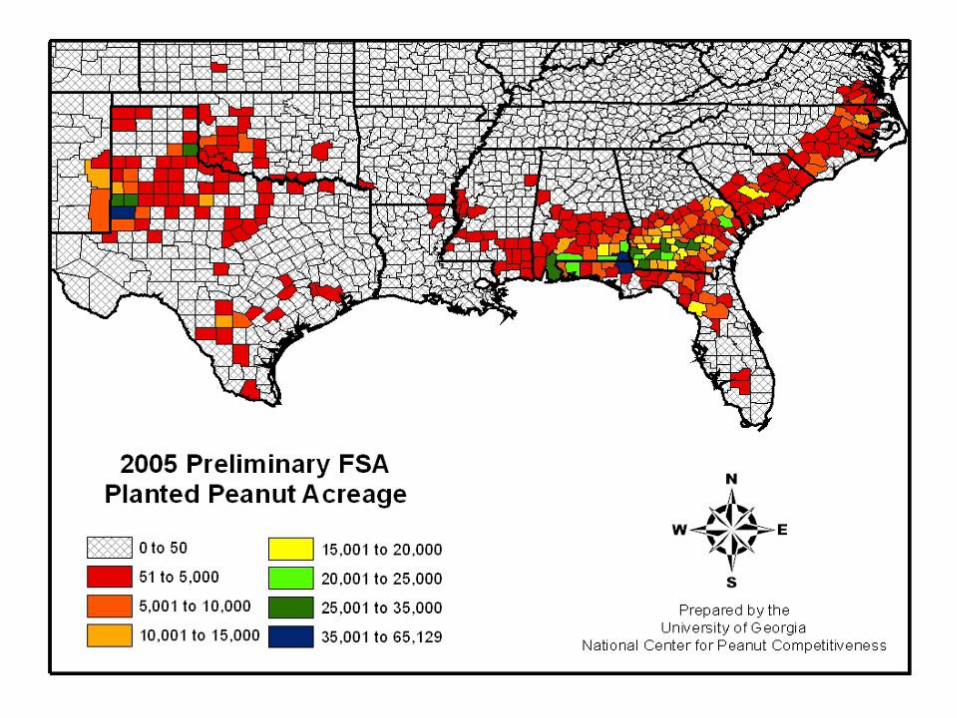
Peanut are Grown Primarily in 9 Southern States
Alabama, Florida, Georgia, New Mexico, North Carolina, Oklahoma, South Carolina, Texas & Virginia
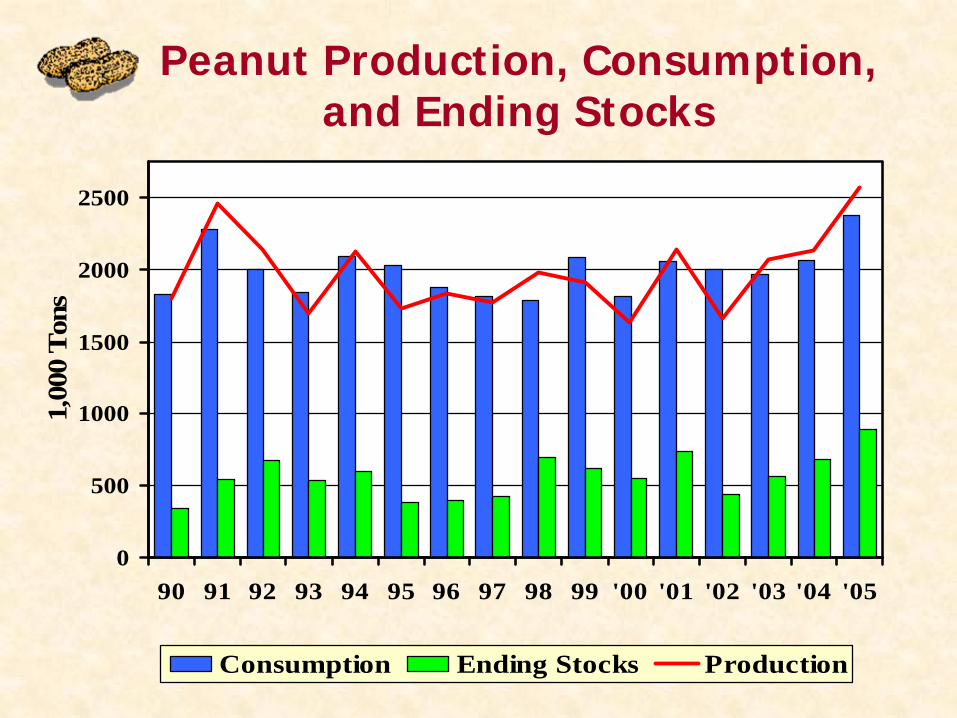
Peanut Production, Consumption, and Ending Stocks
0
500
1000
1500
2000
2500
90 91 92 93 94 95 96 97 98 99 '00 '01 '02 '03 '04 '05
1,00
0 T
ons
Consumption Ending Stocks Production
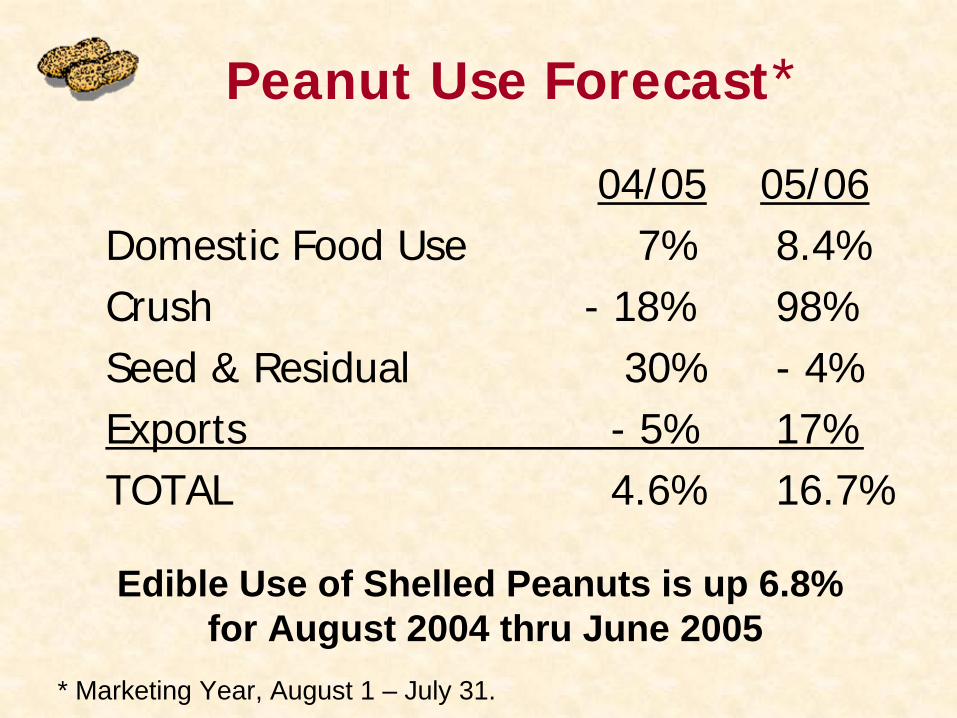
Peanut Use Forecast*
04/05 05/06Domestic Food Use 7% 8.4%Crush - 18% 98%Seed & Residual 30% - 4%Exports - 5% 17%TOTAL 4.6% 16.7%
* Marketing Year, August 1 – July 31.
Edible Use of Shelled Peanuts is up 6.8% for August 2004 thru June 2005
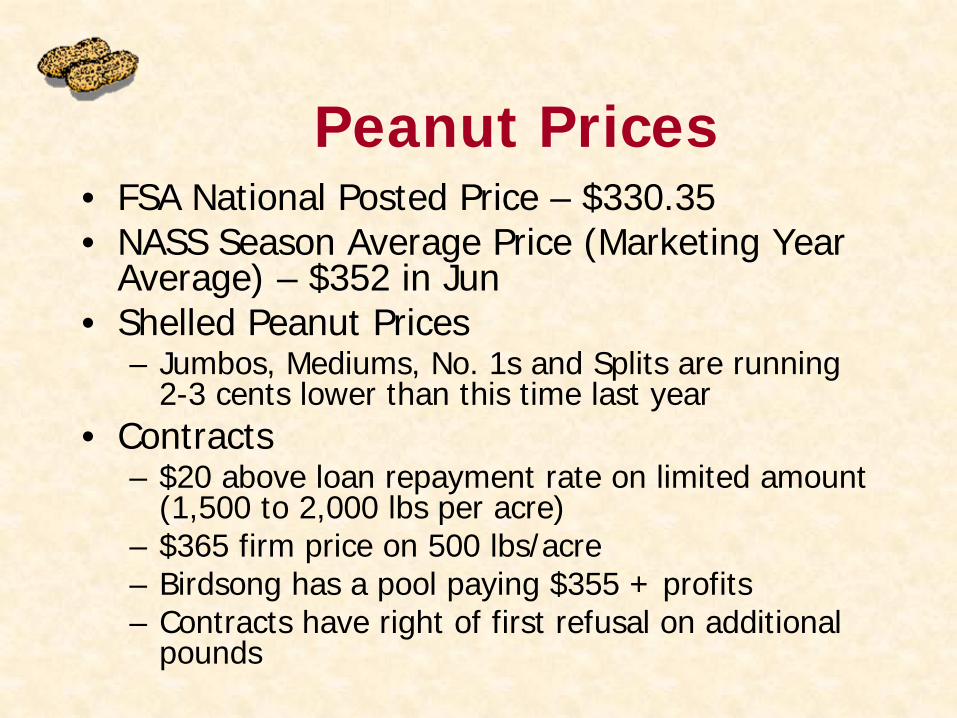
Peanut Prices• FSA National Posted Price – $330.35 • NASS Season Average Price (Marketing Year
Average) – $352 in Jun • Shelled Peanut Prices
– Jumbos, Mediums, No. 1s and Splits are running 2-3 cents lower than this time last year
• Contracts – $20 above loan repayment rate on limited amount
(1,500 to 2,000 lbs per acre)– $365 firm price on 500 lbs/acre– Birdsong has a pool paying $355 + profits– Contracts have right of first refusal on additional
pounds
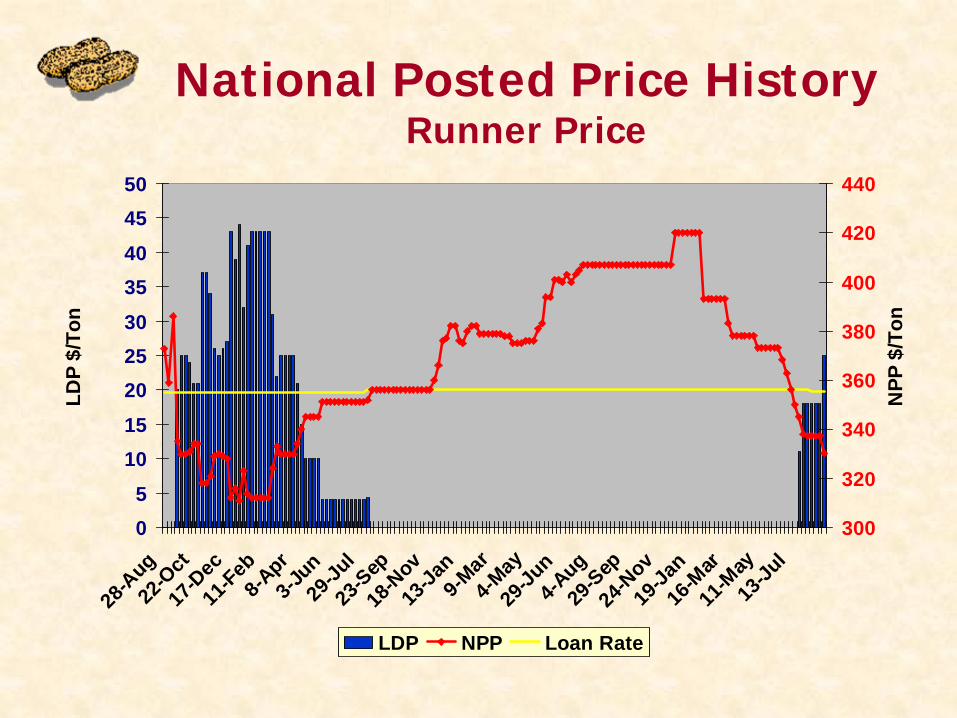
National Posted Price History Runner Price
05
1015
202530
3540
4550
28-A
ug22
-Oct
17-D
ec11
-Feb8-A
pr3-J
un29
-Jul
23-S
ep18
-Nov
13-Ja
n9-M
ar4-M
ay29
-Jun
4-Aug
29-S
ep24
-Nov
19-Ja
n16
-Mar
11-M
ay13
-Jul
LDP
$/To
n
300
320
340
360
380
400
420
440
NPP
$/T
on
LDP NPP Loan Rate
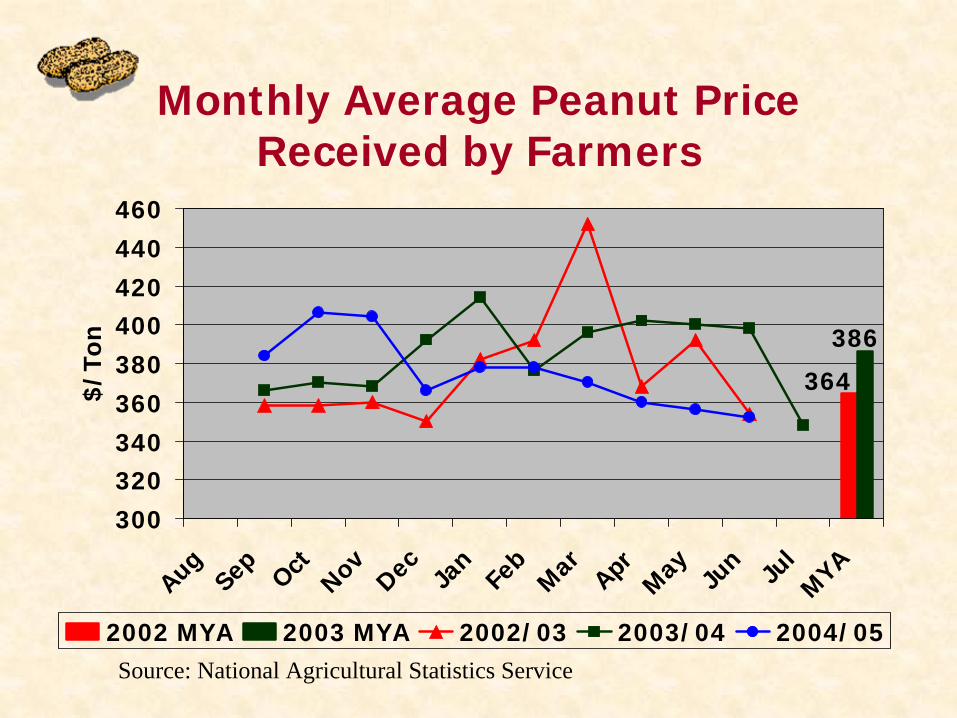
Monthly Average Peanut Price Received by Farmers
364
386
300320340360380400420440460
AugSep OctNovDec Ja
nFe
bMar AprMay Ju
n Jul
MYA$/
Ton
2002 MYA 2003 MYA 2002/03 2003/04 2004/05Source: National Agricultural Statistics Service
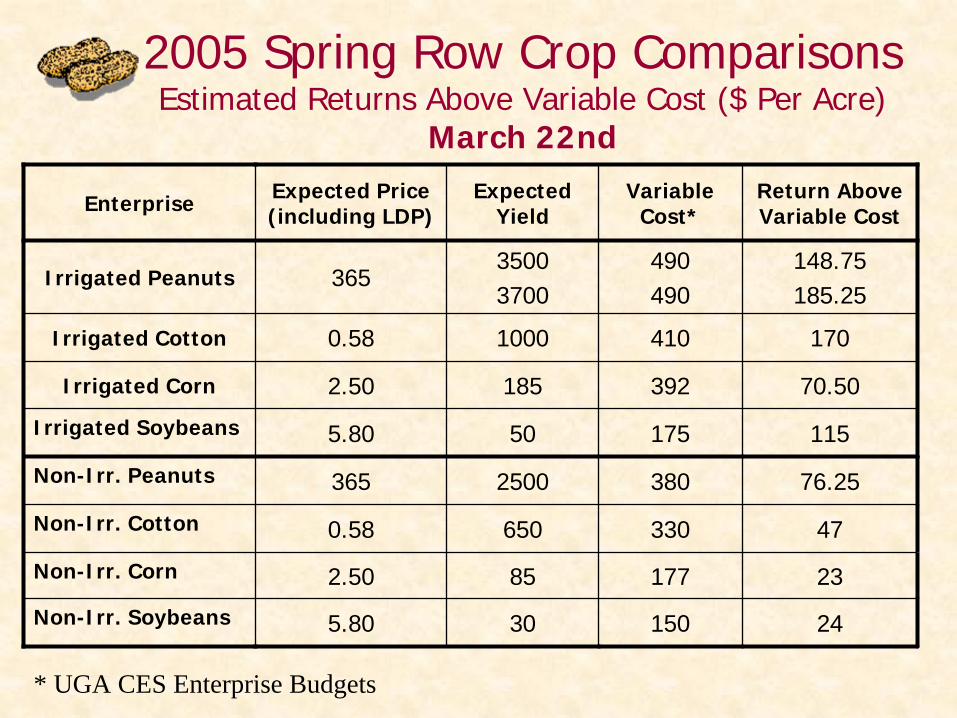
2005 Spring Row Crop Comparisons Estimated Returns Above Variable Cost ($ Per Acre)
March 22nd
Enterprise Expected Price (including LDP)
Expected Yield
Variable Cost*
Return Above Variable Cost
Irrigated Peanuts 36535003700
490490
148.75185.25
Irrigated Cotton 0.58 1000 410 170
Irrigated Corn 2.50 185 392 70.50
Irrigated Soybeans 5.80 50 175 115
Non-Irr. Peanuts 365 2500 380 76.25
Non-Irr. Cotton 0.58 650 330 47
Non-Irr. Corn 2.50 85 177 23
Non-Irr. Soybeans 5.80 30 150 24
* UGA CES Enterprise Budgets
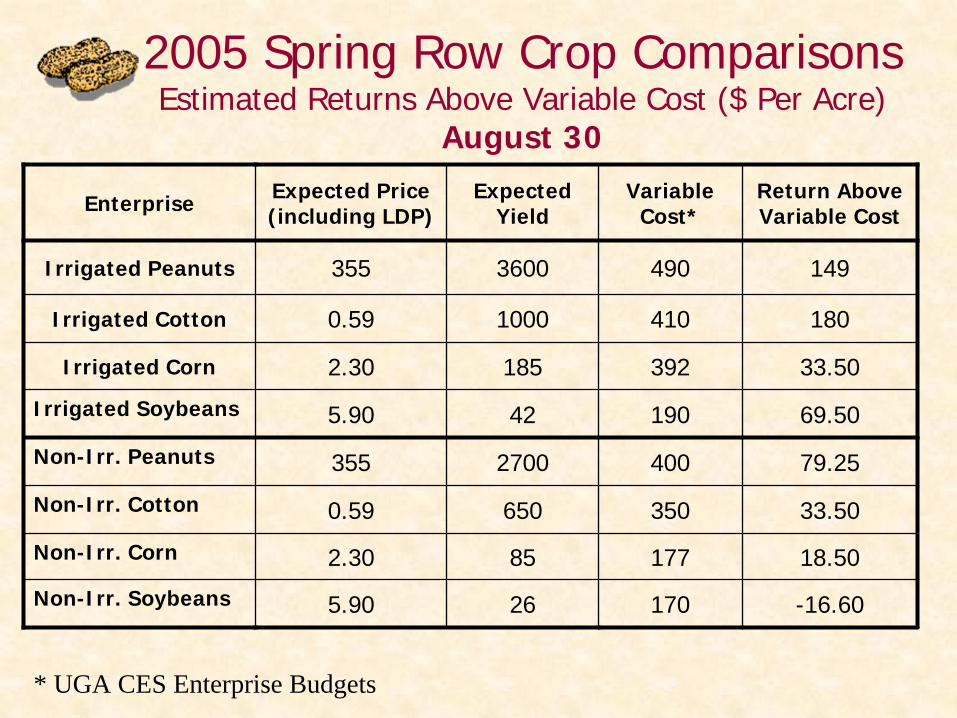
2005 Spring Row Crop Comparisons Estimated Returns Above Variable Cost ($ Per Acre)
August 30
Enterprise Expected Price (including LDP)
Expected Yield
Variable Cost*
Return Above Variable Cost
Irrigated Peanuts 355 3600 490 149
Irrigated Cotton 0.59 1000 410 180
Irrigated Corn 2.30 185 392 33.50
Irrigated Soybeans 5.90 42 190 69.50
Non-Irr. Peanuts 355 2700 400 79.25
Non-Irr. Cotton 0.59 650 350 33.50
Non-Irr. Corn 2.30 85 177 18.50
Non-Irr. Soybeans 5.90 26 170 -16.60
* UGA CES Enterprise Budgets
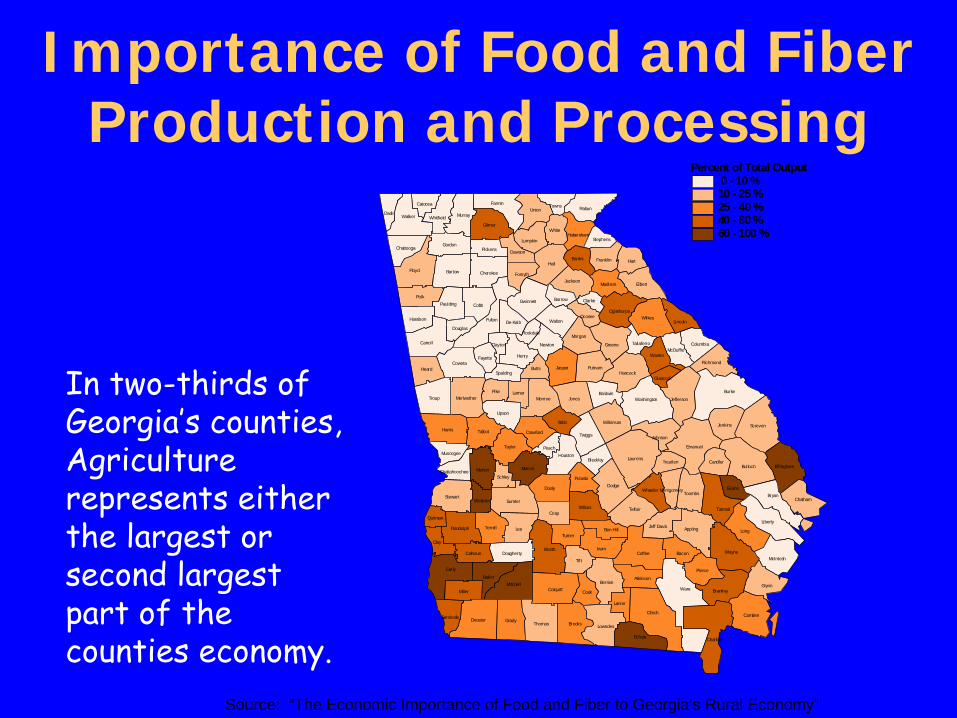
Importance of Food and Fiber Production and Processing
Ware
Burke
Clinch
Hall
Laurens
Early
Floyd
Worth
Bulloch
Lee
Charlton
Coffee
Fulton
Wayne
Tif t
Long
HarrisScreven
Emanuel
Decatur
Troup
Carroll
Liberty
Irwin
Polk
Dodge
Bryan
Grady
Colquitt
Wilkes
Dooly
Telfair
Brooks
Appling
Camden
Bartow
Cobb
Sumter
Gilmer
Jones
Thomas
Mitchell Glynn
Elbert
Walker
Tattnall
Taylor
Berrien
Echols
Talbot
Stewart
Coweta
RabunFannin
Union
Macon
Washington
Hart
Bibb
Jasper
Jefferson
Baker
Lowndes
Wilcox
Brantley
Monroe
Hancock
Greene
Henry
Marion
Crisp
Miller
Pierce
Murray
Terrell
Upson
Gwinnett
Heard
Twiggs
Pike
McIntosh
Gordon
Effingham
Clay
Morgan
Walton
Putnam
Jenkins
Toombs
Wilkinson
Meriwether
Randolph
Houston
Cook
Bacon
Cherokee
Turner
Chatham
Jackson
White
Oglethorpe
Atkinson
Warren
Banks
Paulding
Butts
Johnson
Newton
Crawford
Baldwin
Wheeler
Dade
Lincoln
Pulaski
Madison
Lumpkin
Franklin
Calhoun
Richmond
Whitfield
Jeff Davis
Candler
De Kalb
Forsyth
Dougherty
Haralson
Columbia
Lanier
Ben Hill
Chattooga
Lamar
Evans
McDuffie
Pickens
Towns
Seminole
Dawson
Fayette
Bleckley
Schley
Barrow
Oconee
Webster
Treutlen
Douglas
Habersham
Peach
Spalding
Catoosa
Muscogee
Taliaferro
Clarke
Clayton
Stephens
Montgomery
Quitman
Chattahoochee
Glascock
Rockdale
Percent of Total Output 0 - 10 %10 - 25 %25 - 40 %40 - 60 %60 - 100 %
In two-thirds of Georgia’s counties, Agriculture represents either the largest or second largest part of the counties economy.
Source: “The Economic Importance of Food and Fiber to Georgia’s Rural Economy”
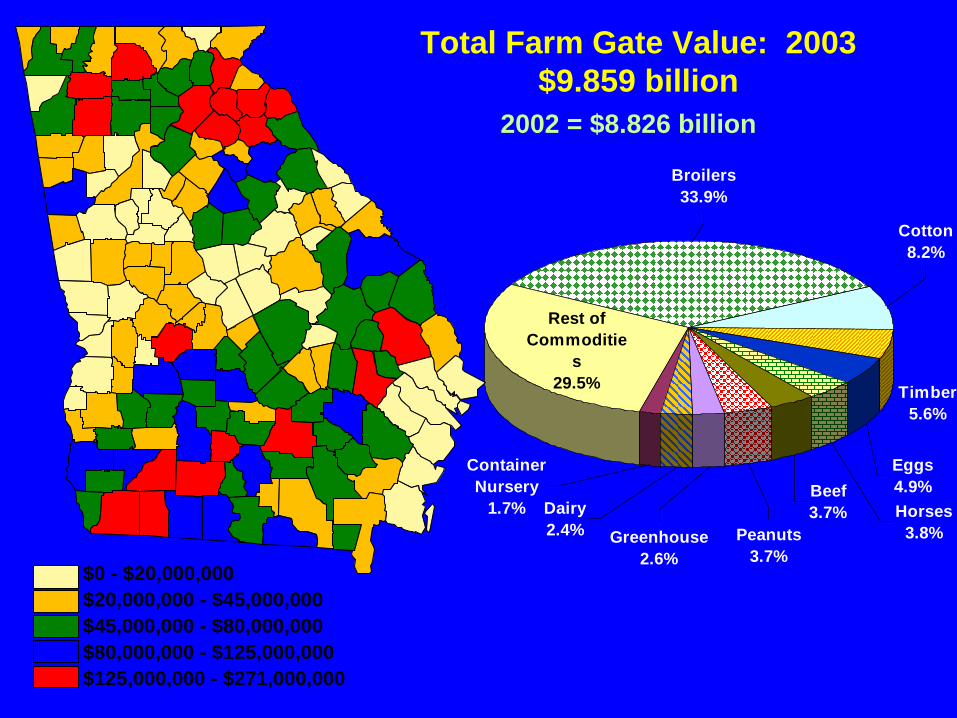
Total Farm Gate Value: 2003$9.859 billion
$0 - $20,000,000$20,000,000 - $45,000,000$45,000,000 - $80,000,000$80,000,000 - $125,000,000$125,000,000 - $271,000,000
Timber5.6%
Eggs4.9%Horses
3.8%
Beef3.7%
Peanuts3.7%
Greenhouse2.6%
Dairy2.4%
Container Nursery
1.7%
Rest of Commoditie
s29.5%
Cotton8.2%
Broilers33.9%
2002 = $8.826 billion
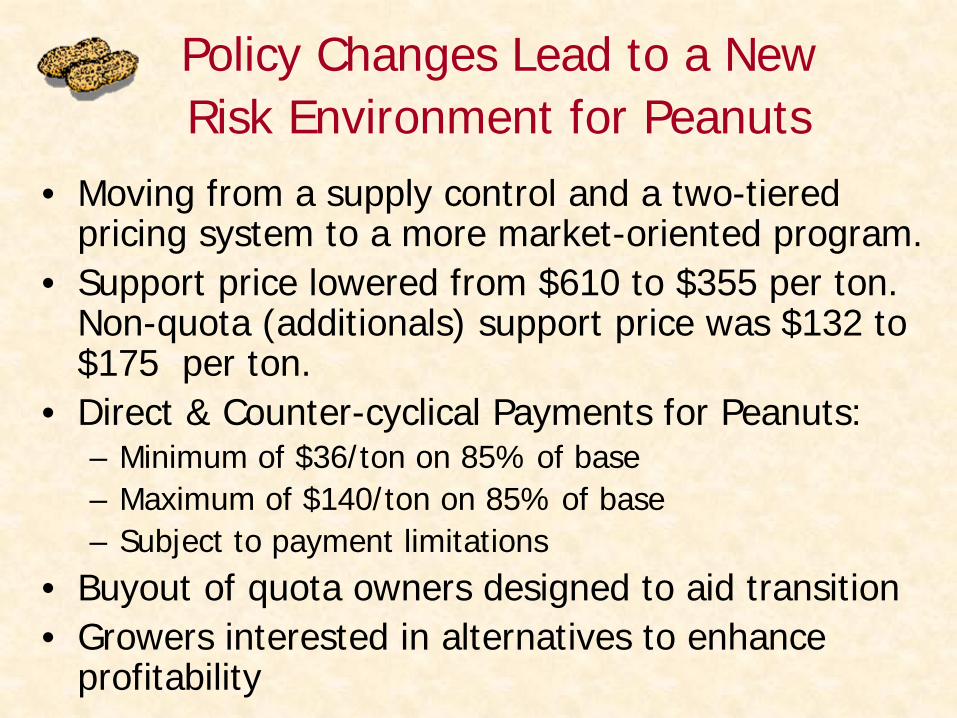
Policy Changes Lead to a New Risk Environment for Peanuts
• Moving from a supply control and a two-tiered pricing system to a more market-oriented program.
• Support price lowered from $610 to $355 per ton. Non-quota (additionals) support price was $132 to $175 per ton.
• Direct & Counter-cyclical Payments for Peanuts:– Minimum of $36/ton on 85% of base– Maximum of $140/ton on 85% of base– Subject to payment limitations
• Buyout of quota owners designed to aid transition• Growers interested in alternatives to enhance
profitability
Feasibility Studies• Producer Acceptance of a New Generation Shelling
Cooperative in Georgia– Ray, Fletcher, Thomas (UGA) surveyed GA peanut farmers in
2000 – 73% of respondents are favor Peanut NGC Inclined.• Feasibility of Southwest GA Peanut NGSC
– Hancock, Fletcher, Thomas (UGA, 2001) performed benefit cost analysis and study gave positive economic results.
• Tift Area GA Peanut NGC economic feasibility study– Ferland, Smith, Wolfe, Doherty and McKissick (UGA 2002)
conducted feasibility study of a Peanut NGC, estimated positive return if able to capture part of peanut market.
• Feasibility of peanut flour and oil production– Wolfe, Best, Escalante, McKissick (UGA, 2005) conducted an
feasibility study peanut venture involving production of peanut flour and oil for retail market.
Adding Value to the Peanut
• Shelling• Blanching• Peanut oil and meal• Peanut flour• Peanut butter • Confectionary• Snacks
Opportunity for Growers• New peanut program provided window of
opportunity for entry into shelling.• Major barrier to entry is investment cost and
operating capital required.
Grower-owned Shelling & Marketing
• Two groups of farmers have built new shelling plants in Georgia,– American Peanut Growers Group in Donalsonville– Tifton Quality Peanut in Tifton
• Commodity Marketing Associations designed to allow farmers to market peanuts in a pool:– GFA, SWPGA, VCPGA– Concordia – Ashburn, GA
• Bell Plantation– Peanut flour, peanut “thin”
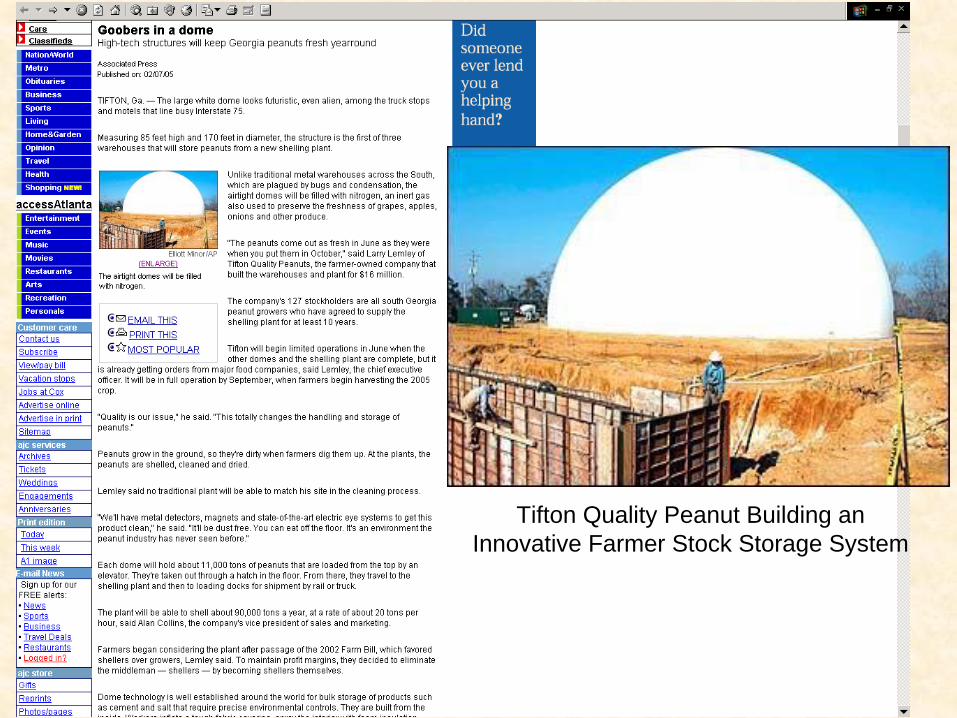
Tifton Quality Peanut Building anInnovative Farmer Stock Storage System
Response to New Risk Environment
• Heavy use of market contracts.• Price is tied to loan repayment rate.• Right of first refusal on surplus production.• Contracted peanuts go into market loan
which pays handling and storage fee. • Has “Act of God” clause for short deliveries.• Shift in where peanuts are grown.• New grower-owned ventures in peanut
processing and marketing.
Risk Management and Efficiency Gains
• Electronic warehouse receipts• Semi trailer hauling and drying • Electronic grading• Green weight grading• Cleaning and drying systems• Storage technology to reduce shrink and
damage • System is currently inefficient for segregation
by variety and grade
Control Beyond the Farm Gate
• THE DAY IS COMING OF IDENTITY PRESERVED.
• 14 varieties grown in Georgia in 2004,• Integration will happen, will farmer be
integrated or will they integrate up?• Aflatoxin, genetic traits such as hi-oleic,
size, color, taste…• Mandatory chemical testing
Thank You
www.ces.uga.edu/Agriculture/agecon/agecon.html
UGA Peanut Teamwww.ugapeanuts.com
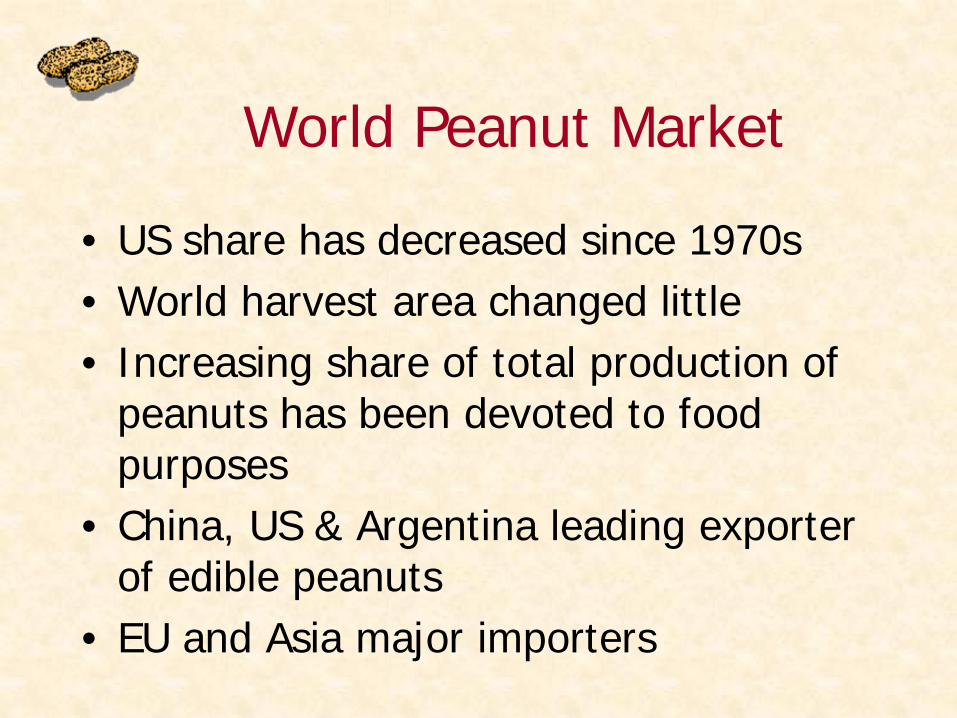
World Peanut Market
• US share has decreased since 1970s• World harvest area changed little• Increasing share of total production of
peanuts has been devoted to food purposes
• China, US & Argentina leading exporter of edible peanuts
• EU and Asia major importers
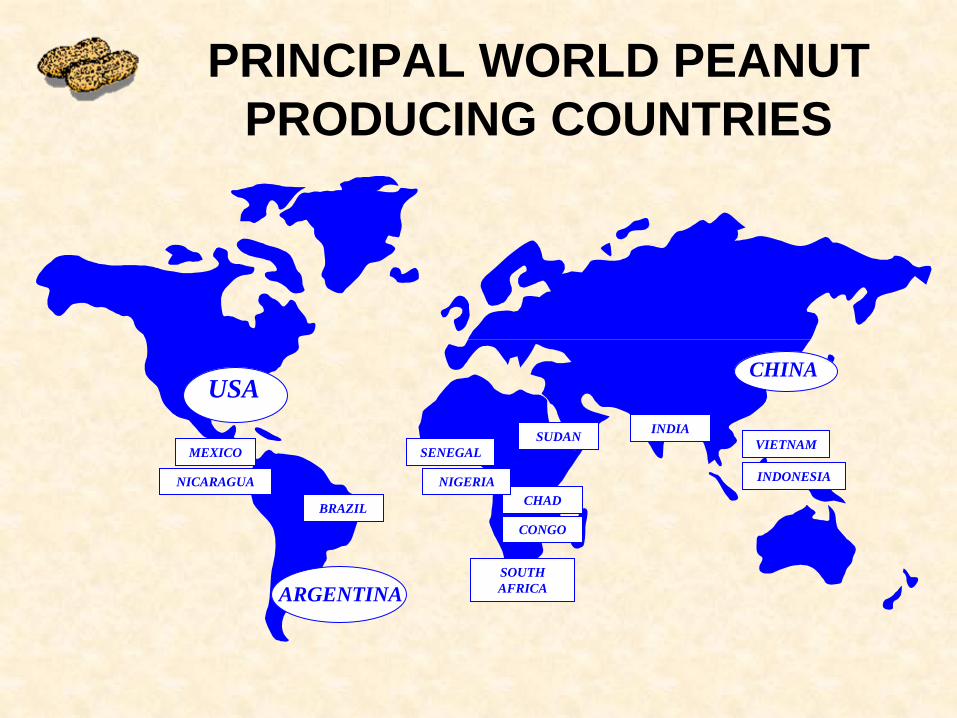
USA
ARGENTINA
CHINA
MEXICO
BRAZIL
SENEGALSUDAN
CHAD
SOUTH AFRICA
INDIAVIETNAM
PRINCIPAL WORLD PEANUT PRODUCING COUNTRIES
NICARAGUA NIGERIA
CONGO
INDONESIA
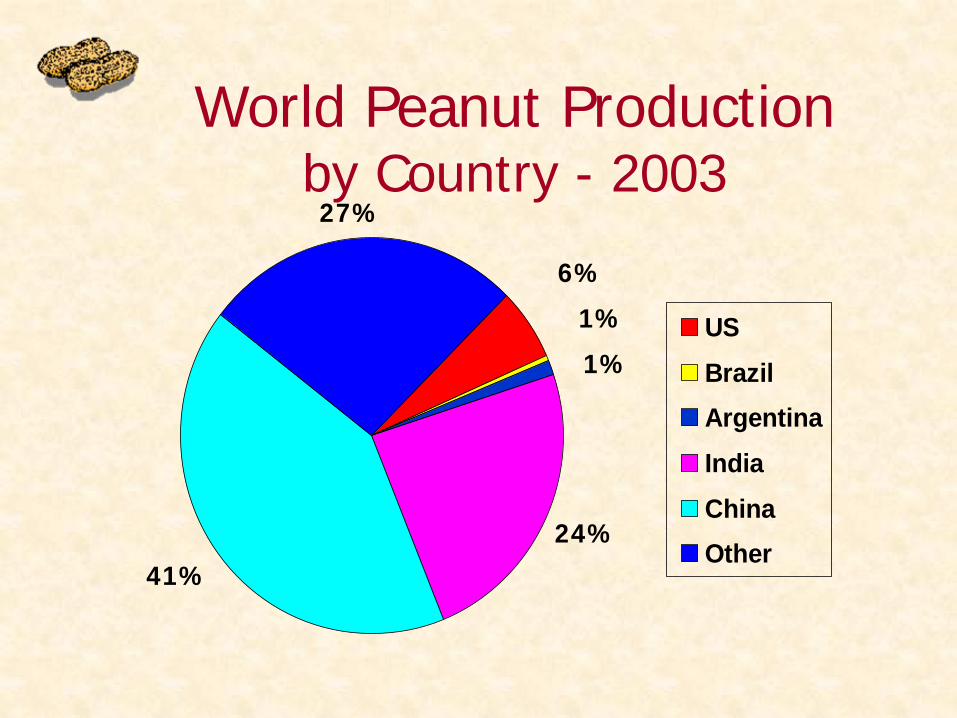
World Peanut Production by Country - 2003
6%
1%
1%
24%
41%
27%
USBrazilArgentinaIndiaChinaOther
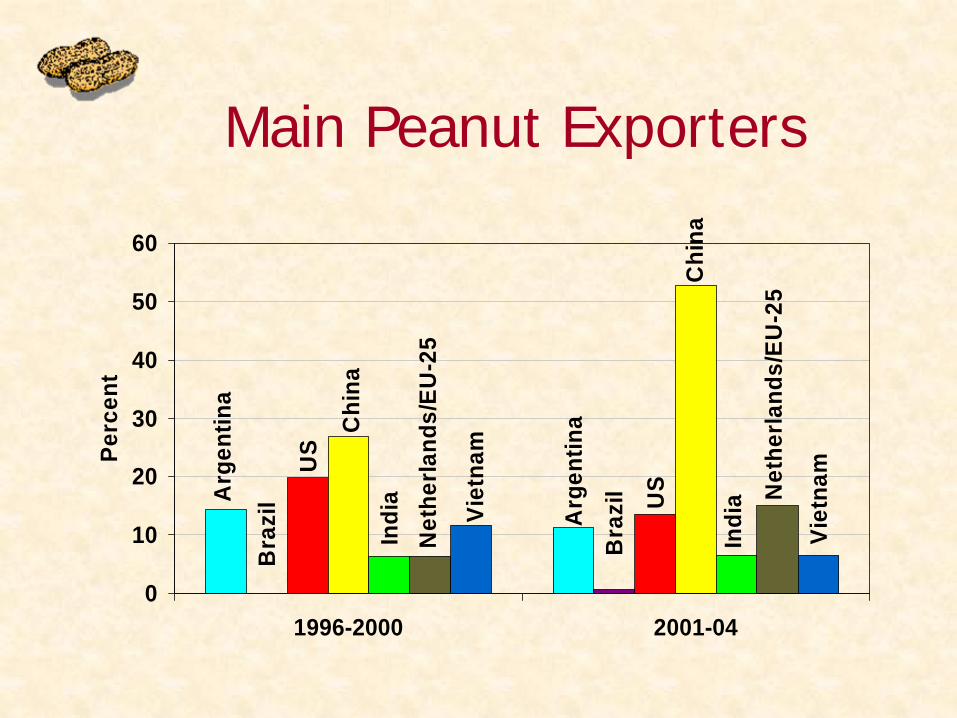
Main Peanut Exporters
Arg
entin
a
Arg
entin
a
Bra
zil
Bra
zil U
S
US
Chi
na
Chi
na
Indi
a
Indi
a Net
herla
nds/
EU-2
5
Net
herla
nds/
EU-2
5
Viet
nam
Viet
nam
0
10
20
30
40
50
60
1996-2000 2001-04
Perc
ent
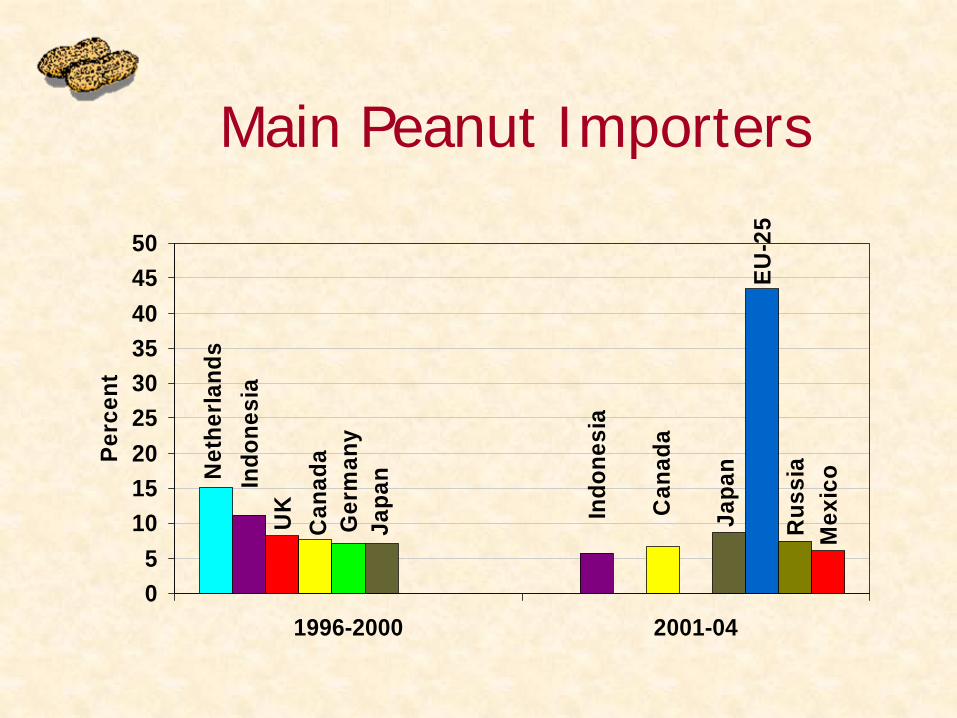
Main Peanut Importers
Rus
sia
Mex
icoN
ethe
rland
s
Indo
nesi
a
Indo
nesi
aU
K Can
ada
Can
ada
Ger
man
y
Japa
n
Japa
n
EU-2
5
05
101520253035404550
1996-2000 2001-04
Perc
ent