Embed Size (px)
Citation preview
T h e 2 0 0 9 U n i v e r s i T y of i l l ino i s

2
1
The 2009 University of illinois
2 rotation Decisions in a Turbulent Price and Cost environmentGary Schnitkey
7 What Acreage shifts Are needed in 2009?Darrel Good
10 Things Are Changing Again in Corn and soybean nematode ManagementTerry L. Niblack
16 Managing expensive nitrogen to Maximize ProfitabilityFabián G. Fernández
21 seed Costs and Corn Plant PopulationEmerson D. Nafziger
28 Managing Corn and soybean Diseases with fungicidesCarl A. Bradley
31 Maintaining Bt Durability with Cry Protein stacks and landscape/ seed Mixture refuges—is This enough?
Michael E. Gray
39 Turn out the lights—The Party’s overAaron G. Hager
45 “new Age” soybean insect ManagementKevin L. Steffey
College of Agricultural, Consumer and Environmental Sciences
Department of Crop Sciences
2
Rotation Decisions in a Turbulent Price and Cost Environment
Gary schnitkeyProfessor, Agricultural and Consumer
Economics300a Mumford [email protected]
A key decision faced by Illinois farmers is how many acres of corn and soybeans to plant in 2009. There is speculation that larger increases in corn production costs relative to soybean costs will cause farmers to
switch acres from corn to soybeans. Obviously, cost increases impact cropping decisions. However, gross revenues and resulting profitability should be the main factors impacting planting decisions. In this paper, relative corn and soybean profitability is examined. First, relative profitability from 2000 through 2007 is presented to place projected 2009 returns into a historical context. Then, 2009 projected returns are shown. Projected 2009 returns will vary with changes in fertilizer, corn, and soybean prices. Analyses of the impacts of these price changes are presented.
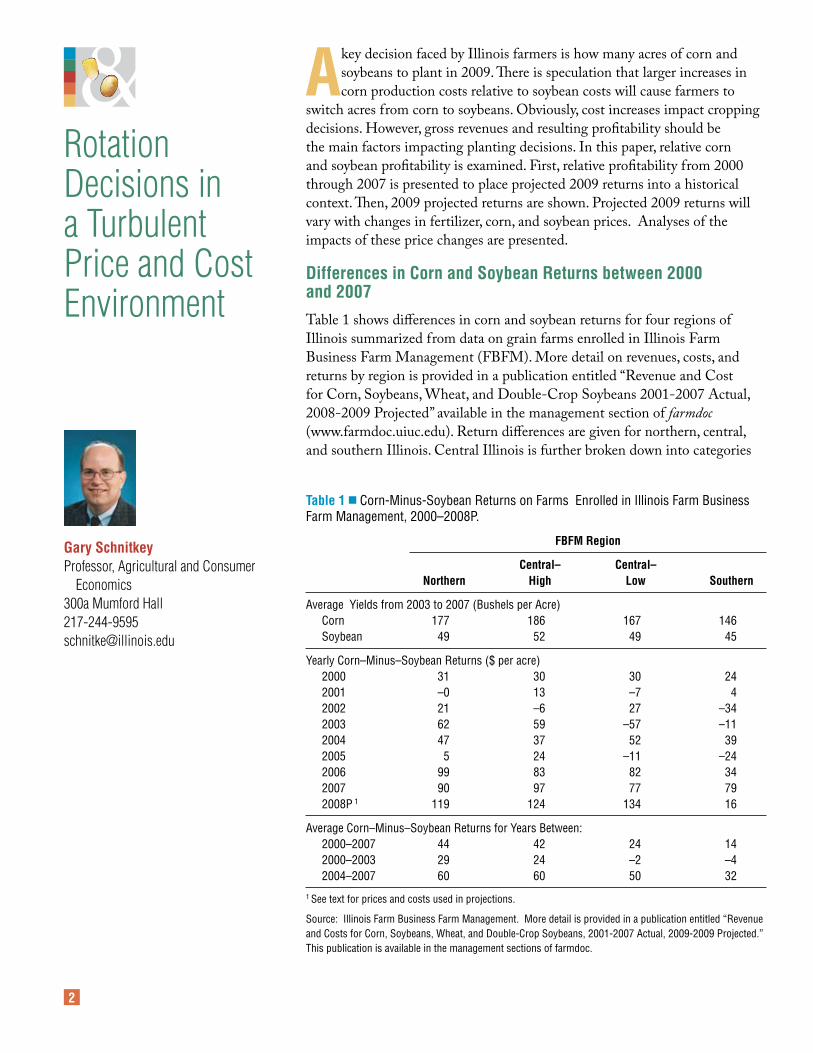
Differences in Corn and soybean returns between 2000 and 2007Table 1 shows differences in corn and soybean returns for four regions of Illinois summarized from data on grain farms enrolled in Illinois Farm Business Farm Management (FBFM). More detail on revenues, costs, and returns by region is provided in a publication entitled “Revenue and Cost for Corn, Soybeans, Wheat, and Double-Crop Soybeans 2001-2007 Actual, 2008-2009 Projected” available in the management section of farmdoc (www.farmdoc.uiuc.edu). Return differences are given for northern, central, and southern Illinois. Central Illinois is further broken down into categories
Table 1 ■ Corn-Minus-Soybean Returns on Farms Enrolled in Illinois Farm Business Farm Management, 2000–2008P.
fBfM region
Central– Central– northern high low southern
Average Yields from 2003 to 2007 (Bushels per Acre) Corn 177 186 167 146 Soybean 49 52 49 45
Yearly Corn–Minus–Soybean Returns ($ per acre) 2000 31 30 30 24 2001 –0 13 –7 4 2002 21 –6 27 –34 2003 62 59 –57 –11 2004 47 37 52 39 2005 5 24 –11 –24 2006 99 83 82 34 2007 90 97 77 79 2008P 1 119 124 134 16
Average Corn–Minus–Soybean Returns for Years Between: 2000–2007 44 42 24 14 2000–2003 29 24 –2 –4 2004–2007 60 60 50 32
1 See text for prices and costs used in projections.
Source: Illinois Farm Business Farm Management. More detail is provided in a publication entitled “Revenue and Costs for Corn, Soybeans, Wheat, and Double-Crop Soybeans, 2001-2007 Actual, 2009-2009 Projected.” This publication is available in the management sections of farmdoc.
3
...........................................................................................................
...........................................................................................................
...........................................................................................................
...........................................................................................................
...........................................................................................................
...........................................................................................................
...........................................................................................................
...........................................................................................................
...........................................................................................................
...........................................................................................................
...........................................................................................................
...........................................................................................................
...........................................................................................................
...........................................................................................................
...........................................................................................................
...........................................................................................................
...........................................................................................................
...........................................................................................................
...........................................................................................................
...........................................................................................................
...........................................................................................................
...........................................................................................................
...........................................................................................................
...........................................................................................................
...........................................................................................................
...........................................................................................................
...........................................................................................................
...........................................................................................................
...........................................................................................................
for high and low productivity farmland. Corn yields from 2000 through 2007 for the central-high category averaged 186 bushel per acre while central-low averaged 167 bushels per acre (see Table 1).
In 2000, corn-minus-soybean return was $31 per acre in northern Illinois (see Table 1). This means that corn returns exceeded soybean returns by $31 per acre. Positive corn-minus-soybean returns indicate that corn was more profitable than soybeans while negative numbers indicate that soybeans were more profitable.
Several points are evident from these corn-minus-soybean returns:
1. On average, corn was more profitable than soybeans in all regions. Between 2000 and 2007, corn-minus-soybean returns averaged $44 for northern Illinois and in no year did soybean returns exceed corn returns (see Table 1). In the central-high region, corn-minus-soybean returns between 2000 and 2007 averaged $42 and soybean returns exceeded corn returns only in one year (2002). In the central-low region, corn-minus-soybean returns averaged $24 per acre and soybean returns exceeded corn returns in three years (2001, 2003, and 2005). In southern Illinois, corn-minus-soybean returns averaged $14 per acre and soybean returns exceeded corn returns in three years (2002, 2003, and 2005).
2. The difference between corn-minus-soybean return is larger for the northern and central-high regions compared to the central-low and southern regions. The northern and central-high regions have relatively higher productive farmland than the central-low and southern regions. The northern and central-high regions had corn yields that averaged 177 bushel and 186 bushels, respectively while the central-low and southern regions averaged 167 bushel and 146 bushels, respectively (see Table 1). In recent years, corn yields have increased relatively more than soybean yields on higher productive soils, causing higher corn returns relative to soybean returns to increase on more productive farmland.
3. Corn-minus-soybean returns were larger in recent years. In northern Illinois, for example, corn-minus-soybean returns averaged $29 per acre between 2000 through 2003 (see Table 1). This amount increased by $20 to an average of $60 per acre between 2004 through 2007 (see Table 1). All regions experiences similar increases.
Table 1 also includes return estimates for 2008. In mid-November, returns had to be estimated as crop yields, commodity prices, and costs have not been summarized from farm records. The 2008 projections used November yield estimates from National Agricultural Statistical Service and cost estimates contained in the publication cited in the footnote to Table 1. A corn price of $4.00 and a soybean price of $9.50 were used in estimates.
Based on these yield, price, and cost estimates, corn-minus-soybean returns are estimated at $119 for northern Illinois, $124 for central-high region, $134 for the central-low region, and $16 for the southern region. Corn is projected to be more profitable than soybeans in all regions. Differences are the largest for northern, central-high, and central-low regions, primarily because corn yields were near average while soybean yields were projected to be below average.
4
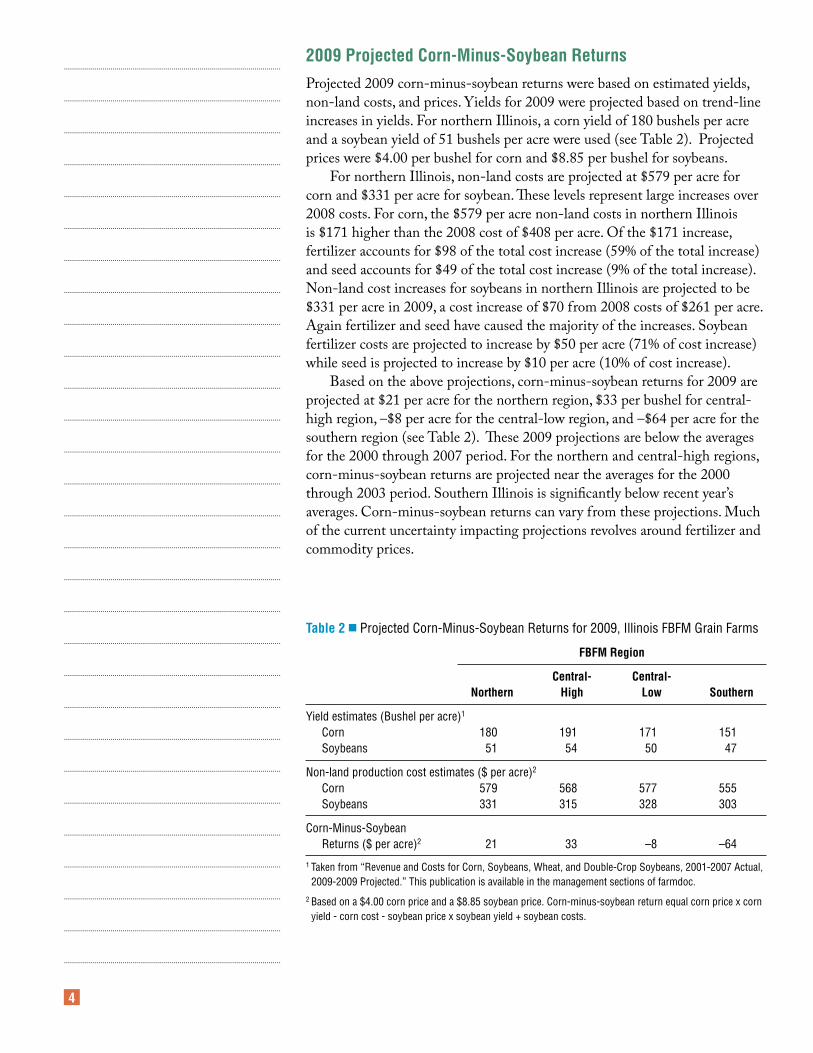
2009 Projected Corn-Minus-soybean returnsProjected 2009 corn-minus-soybean returns were based on estimated yields, non-land costs, and prices. Yields for 2009 were projected based on trend-line increases in yields. For northern Illinois, a corn yield of 180 bushels per acre and a soybean yield of 51 bushels per acre were used (see Table 2). Projected prices were $4.00 per bushel for corn and $8.85 per bushel for soybeans.
For northern Illinois, non-land costs are projected at $579 per acre for corn and $331 per acre for soybean. These levels represent large increases over 2008 costs. For corn, the $579 per acre non-land costs in northern Illinois is $171 higher than the 2008 cost of $408 per acre. Of the $171 increase, fertilizer accounts for $98 of the total cost increase (59% of the total increase) and seed accounts for $49 of the total cost increase (9% of the total increase). Non-land cost increases for soybeans in northern Illinois are projected to be $331 per acre in 2009, a cost increase of $70 from 2008 costs of $261 per acre. Again fertilizer and seed have caused the majority of the increases. Soybean fertilizer costs are projected to increase by $50 per acre (71% of cost increase) while seed is projected to increase by $10 per acre (10% of cost increase).
Based on the above projections, corn-minus-soybean returns for 2009 are projected at $21 per acre for the northern region, $33 per bushel for central-high region, –$8 per acre for the central-low region, and –$64 per acre for the southern region (see Table 2). These 2009 projections are below the averages for the 2000 through 2007 period. For the northern and central-high regions, corn-minus-soybean returns are projected near the averages for the 2000 through 2003 period. Southern Illinois is significantly below recent year’s averages. Corn-minus-soybean returns can vary from these projections. Much of the current uncertainty impacting projections revolves around fertilizer and commodity prices.
...........................................................................................................
...........................................................................................................
...........................................................................................................
...........................................................................................................
...........................................................................................................
...........................................................................................................
...........................................................................................................
...........................................................................................................
...........................................................................................................
...........................................................................................................
...........................................................................................................
...........................................................................................................
...........................................................................................................
...........................................................................................................
...........................................................................................................
...........................................................................................................
...........................................................................................................
...........................................................................................................
...........................................................................................................
...........................................................................................................
...........................................................................................................
...........................................................................................................
...........................................................................................................
...........................................................................................................
...........................................................................................................
...........................................................................................................
...........................................................................................................
...........................................................................................................
...........................................................................................................
Table 2 ■ Projected Corn-Minus-Soybean Returns for 2009, Illinois FBFM Grain Farms
fBfM region
Central- Central- northern high low southern
Yield estimates (Bushel per acre)1
Corn 180 191 171 151 Soybeans 51 54 50 47
Non-land production cost estimates ($ per acre)2
Corn 579 568 577 555 Soybeans 331 315 328 303
Corn-Minus-Soybean Returns ($ per acre)2 21 33 –8 –64
1 Taken from “Revenue and Costs for Corn, Soybeans, Wheat, and Double-Crop Soybeans, 2001-2007 Actual, 2009-2009 Projected.” This publication is available in the management sections of farmdoc.
2 Based on a $4.00 corn price and a $8.85 soybean price. Corn-minus-soybean return equal corn price x corn yield - corn cost - soybean price x soybean yield + soybean costs.
5
fertilizer pricesFertilizer costs contribute a great deal to 2009 cost increases. In northern Illinois, fertilizer costs per acre are projected at $210 for corn and $95 per acre for soybeans. The $210 cost for corn was based on per acre applications of 180 pounds of anhydrous ammonia, 127 pounds of diammonium phosphate (DAP) and 125 pounds of potash. Soybean fertilizer costs were based on per acre applications of 38 pounds of DAP and 163 pounds of potash. Fertilizer prices used in calculating costs were $1,000 per ton for anhydrous ammonia, $1,000 per ton for DAP, and $900 per ton for potash (Costs in budgets were rounded to nearest $5 increment).
Since financial and economic uncertainties became apparent in early fall, fertilizer prices have trended downward. Lower fertilizer prices could cause corn returns to increase relative to soybean returns, with nitrogen prices having the largest impact on relative corn and soybean returns. Using the above application rates, each $100 per ton decrease in the anhydrous ammonia price causes an $8.95 increase in the corn-minus-soybean return. This compares to a $3.55 increase in corn-minus-soybean returns for each $100 per ton decrease in the DAP price and $1.85 increase in corn-minus-soybean returns for a $100 per ton decrease in potash price.
Lower fertilizer prices will increase overall profits to Illinois grain farms. It will also impact relative profits. However, changes in commodity prices likely will have larger impacts on profits than fertilizer costs.
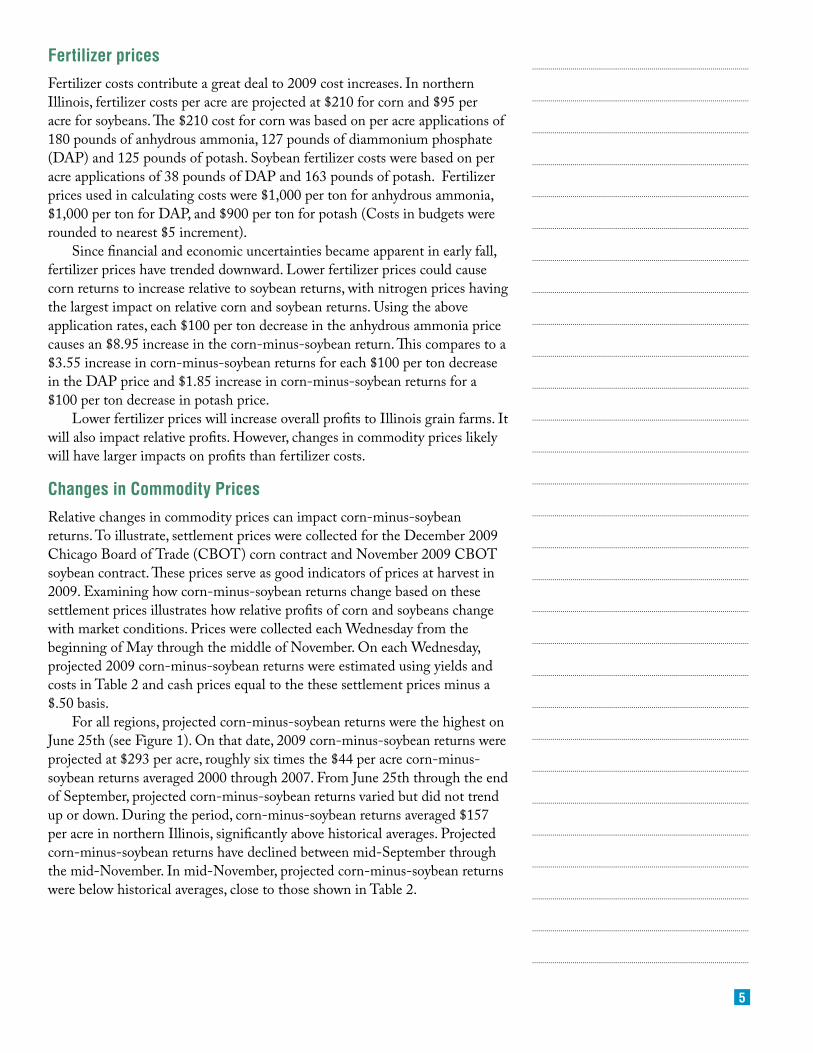
Changes in Commodity PricesRelative changes in commodity prices can impact corn-minus-soybean returns. To illustrate, settlement prices were collected for the December 2009 Chicago Board of Trade (CBOT) corn contract and November 2009 CBOT soybean contract. These prices serve as good indicators of prices at harvest in 2009. Examining how corn-minus-soybean returns change based on these settlement prices illustrates how relative profits of corn and soybeans change with market conditions. Prices were collected each Wednesday from the beginning of May through the middle of November. On each Wednesday, projected 2009 corn-minus-soybean returns were estimated using yields and costs in Table 2 and cash prices equal to the these settlement prices minus a $.50 basis.
For all regions, projected corn-minus-soybean returns were the highest on June 25th (see Figure 1). On that date, 2009 corn-minus-soybean returns were projected at $293 per acre, roughly six times the $44 per acre corn-minus-soybean returns averaged 2000 through 2007. From June 25th through the end of September, projected corn-minus-soybean returns varied but did not trend up or down. During the period, corn-minus-soybean returns averaged $157 per acre in northern Illinois, significantly above historical averages. Projected corn-minus-soybean returns have declined between mid-September through the mid-November. In mid-November, projected corn-minus-soybean returns were below historical averages, close to those shown in Table 2.
...........................................................................................................
...........................................................................................................
...........................................................................................................
...........................................................................................................
...........................................................................................................
...........................................................................................................
...........................................................................................................
...........................................................................................................
...........................................................................................................
...........................................................................................................
...........................................................................................................
...........................................................................................................
...........................................................................................................
...........................................................................................................
...........................................................................................................
...........................................................................................................
...........................................................................................................
...........................................................................................................
...........................................................................................................
...........................................................................................................
...........................................................................................................
...........................................................................................................
...........................................................................................................
...........................................................................................................
...........................................................................................................
...........................................................................................................
...........................................................................................................
...........................................................................................................
...........................................................................................................
6
figure 1 ■ Projected corn-minus-soybean returns given prices based on CBOT settlement prices.
Source: See text for how returns are calculated.
...........................................................................................................
...........................................................................................................
...........................................................................................................
...........................................................................................................
...........................................................................................................
...........................................................................................................
...........................................................................................................
...........................................................................................................
...........................................................................................................
...........................................................................................................
...........................................................................................................
...........................................................................................................
...........................................................................................................
...........................................................................................................
...........................................................................................................
...........................................................................................................
...........................................................................................................
...........................................................................................................
...........................................................................................................
...........................................................................................................
...........................................................................................................
...........................................................................................................
...........................................................................................................
...........................................................................................................
...........................................................................................................
...........................................................................................................
...........................................................................................................
...........................................................................................................
...........................................................................................................
$ pe
r acr
e$150
–$100
–$50
$0
$50
$100
$150
$200
$250
$300
$350
Date
5/7 5/21 6/4 6/8 7/2 7/16 7/30 8/13 8/27 9/10 9/24 10/8 10/22 11/5
Central-HighNorthernCentral-LowSouthern
summaryIn mid-November, projected corn-minus-soybean returns reflecting market conditions indicate that corn would be relatively more profitable than soybeans in northern and central Illinois. In Southern Illinois, soybeans are projected more profitable than corn. These projections differ from those made earlier in the year where corn was projected to be more profitable than soybeans. Much of the change may have been due to economic concerns resulting from financial problems becoming very apparent in March. From mid-November forward, markets may adjust to reflect more profitability for corn. These adjustments would be consistent with a need for corn plantings near 2008 levels.

7
What Acreage Shifts Are Needed in 2009?
Darrel GoodProfessor and Extension EcoomistDepartment of Agricultural and Consumer
6
Background
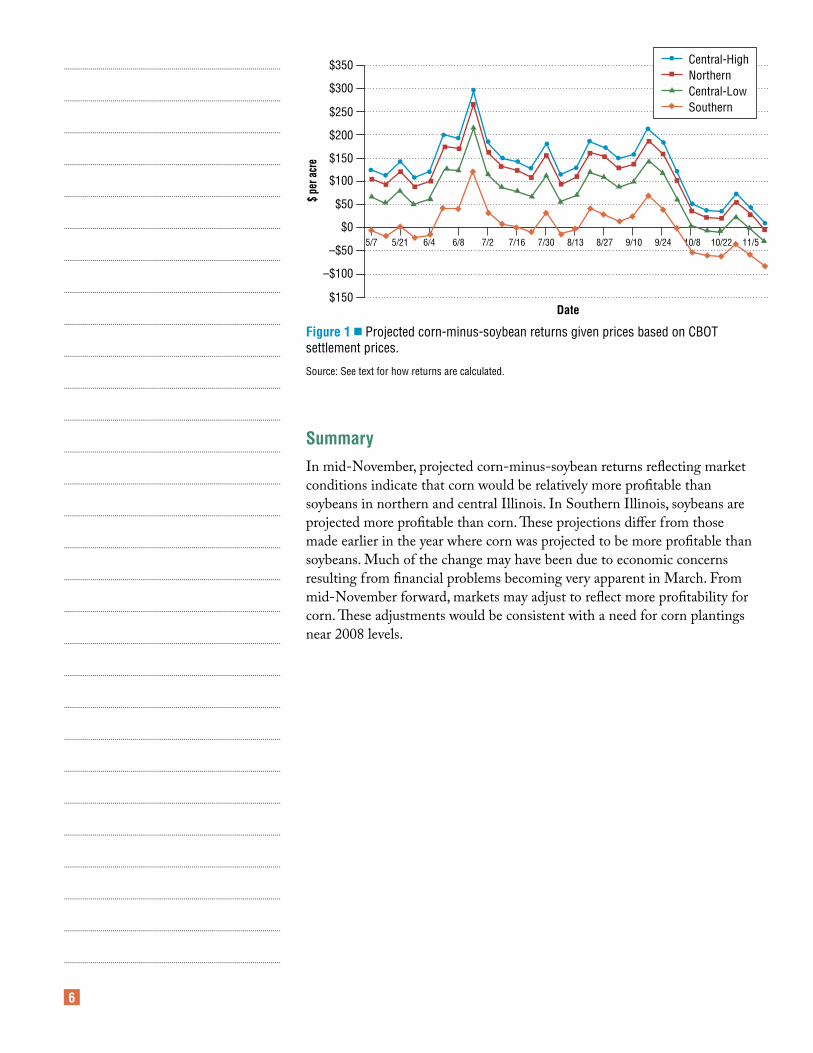
for the first half of the past decade, planted acreage of corn and soybeans in Illinois and in the U.S. were in relatively constant proportions. From 1999 through 2003, the ratio of planted acreage of corn to planted
acreage of soybeans in Illinois ranged from 1.02 to 1.09. That same ratio nationally ranged from 1.02 to 1.07. In those five years annual corn and soybean acreage in Illinois varied by only 400,000 acres. Nationally, corn acreage varied by 3.85 million and soybean acreage varied by only 870,000 acres. The range in annual acreage during that period never exceeded 5 percent of the average acreage for the period.
Beginning in 2004 and continuing through 2008, planted acreage of corn generally increased in relation to soybeans, but the ratios were in much wider ranges than during the previous 5 years. The ratio of corn to soybean acreage varied from 1.12 to 1.59 in Illinois and from 1.04 to 1.45 nationally. The pattern of corn and soybean acreage in Illinois and in the U.S. over the 10 year period is shown in Figures 1 and 2, respectively.
The increased volatility in corn and soybean acreage over the past five years reflected fluctuating marketing prices that in turn reflected relatively abundance or shortage of the two crops. In general, the rapid expansion in corn based ethanol production motivated the trend towards increased corn acreage. Price relationships, however, did not always provide the correct incentives for changes in planted acreage. The most notable example was 2006 when prices during the pre-plant period generally favored soybean production over corn production and producers in Illinois and the rest of the country responded to that signal. The prospective supply-demand balance sheets for corn and soybeans, however, suggested that such a shift was not required. As a result, there was a very large shift to corn and away from soybean acreage in 2007.
Acreage requirements for 2009The magnitude of corn and soybean acreage needed in 2009 depends on three factors:
1. The level of production that is deemed necessary,2. The relationship between planted acreage and harvested acreage, and 3. The average yield expected in 2009.
The size of crops needed in 2009 depends on the level of consumption expected during the 2009-10 marketing year and the magnitude of old crop supplies available at the beginning of that marketing year. That assessment of needed production can be made at a point in time, but could change over time as southern hemisphere crop conditions unfold and as domestic and foreign demand for U.S. corn and soybeans unfold into the spring of 2009.
As of early November 2008, the USDA projected consumption of U.S. corn during the 2008-09 marketing year at 12.535 billion bushels and year ending stocks at 1.124 billion bushels. If use in 2009-10 increased to 13 billion bushels on the basis of additional ethanol production capacity and a modest recovery in exports and if minimum year ending stocks are about one billion bushels, the 2009 crop would need to be near 12.90 billion bushels to meet all needs at “reasonable” prices. With a U.S. average yield of 155 bushels per acre,
8
production at that level would require harvested acreage of 83.2 million. The difference between planted acreage and acreage harvested for grain varies from year to year based on acreage either harvested for silage or abandoned. The typical difference is about 7.1 million acres, implying a need for 90.3 million acres to be planted to corn in 2009, about 4.4 million more than planted in 2008.
In early November, USDA projected the 2008-09 marketing year use of soybeans at 2.928 billion bushels and year ending stocks at 205 million. If use expanded to 3.01 billion bushels in 2009-10 based on a rebound in both the domestic crush and exports and if minimum year ending stocks are about 150 million bushels, the 2009 crop would need to total about 3.03 billion bushels. With a U.S. average yield of 42 bushels per acre, a crop of that size would require harvested acreage of about 72.2 million acres and planted area of about 73.2 million. That is about 2.7 million acres less than planted in 2008.
As of mid-November 2008 it appeared that there was a need to shift acreage away from soybeans to corn and to increased combined acreage of corn and soybeans by about 1.7 million acres in 2009. Early guesses were that the increased acreage would likely be accommodated by a decline in soft red winter wheat acreage.
...........................................................................................................
...........................................................................................................
...........................................................................................................
...........................................................................................................
...........................................................................................................
...........................................................................................................
...........................................................................................................
...........................................................................................................
...........................................................................................................
...........................................................................................................
...........................................................................................................
...........................................................................................................
...........................................................................................................
...........................................................................................................
...........................................................................................................
...........................................................................................................
...........................................................................................................
...........................................................................................................
...........................................................................................................
...........................................................................................................
...........................................................................................................
...........................................................................................................
...........................................................................................................
...........................................................................................................
...........................................................................................................
...........................................................................................................
...........................................................................................................
...........................................................................................................
figure 1 ■ Planted Acreage of Corn and Soybeans in Illinois
figure 2 ■ Planted Acreage of Corn and Soybeans in the U.S.
8
9
10
11
12
13
14
mill
ion
acre
s
1999
–00
2000
–01
2001
–02
2002
–03
2003
–04
2004
–05
2005
–06
2006
–07
2007
–08
2008
–09
soybeanscorn
60
65
70
75
80
85
90
95soybeanscorn
mill
ion
acre
s
1999
–00
2000
–01
2001
–02
2002
–03
2003
–04
2004
–05
2005
–06
2006
–07
2007
–08
2008
–09
9
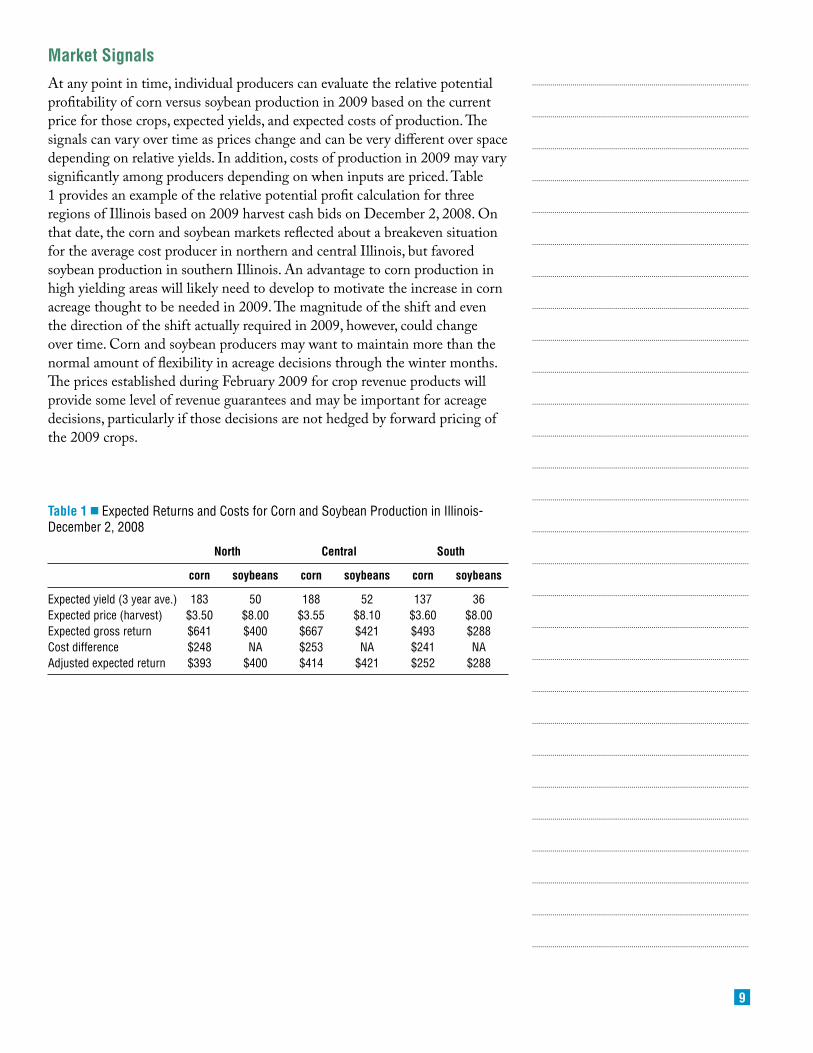
Market signalsAt any point in time, individual producers can evaluate the relative potential profitability of corn versus soybean production in 2009 based on the current price for those crops, expected yields, and expected costs of production. The signals can vary over time as prices change and can be very different over space depending on relative yields. In addition, costs of production in 2009 may vary significantly among producers depending on when inputs are priced. Table 1 provides an example of the relative potential profit calculation for three regions of Illinois based on 2009 harvest cash bids on December 2, 2008. On that date, the corn and soybean markets reflected about a breakeven situation for the average cost producer in northern and central Illinois, but favored soybean production in southern Illinois. An advantage to corn production in high yielding areas will likely need to develop to motivate the increase in corn acreage thought to be needed in 2009. The magnitude of the shift and even the direction of the shift actually required in 2009, however, could change over time. Corn and soybean producers may want to maintain more than the normal amount of flexibility in acreage decisions through the winter months. The prices established during February 2009 for crop revenue products will provide some level of revenue guarantees and may be important for acreage decisions, particularly if those decisions are not hedged by forward pricing of the 2009 crops.
...........................................................................................................
...........................................................................................................
...........................................................................................................
...........................................................................................................
...........................................................................................................
...........................................................................................................
...........................................................................................................
...........................................................................................................
...........................................................................................................
...........................................................................................................
...........................................................................................................
...........................................................................................................
...........................................................................................................
...........................................................................................................
...........................................................................................................
...........................................................................................................
...........................................................................................................
...........................................................................................................
...........................................................................................................
...........................................................................................................
...........................................................................................................
...........................................................................................................
...........................................................................................................
...........................................................................................................
...........................................................................................................
...........................................................................................................
...........................................................................................................
...........................................................................................................
Table 1 ■ Expected Returns and Costs for Corn and Soybean Production in Illinois-December 2, 2008
north Central south
corn soybeans corn soybeans corn soybeans
Expected yield (3 year ave.) 183 50 188 52 137 36Expected price (harvest) $3.50 $8.00 $3.55 $8.10 $3.60 $8.00 Expected gross return $641 $400 $667 $421 $493 $288 Cost difference $248 NA $253 NA $241 NAAdjusted expected return $393 $400 $414 $421 $252 $288
10
3
in Illinois, nematodes are perhaps the most common yet among the most troublesome pests of both corn and soybean, primarily because they are themselves invisible and the symptoms of nematode damage are easy
to misdiagnose or dismiss. Yet nematodes can and do reduce the yields of both crops every year, costing Illinois producers hundreds of millions. Corn nematode problems are becoming more frequent due to recent changes in corn production practices, while the soybean cyst nematode (SCN) remains the most costly pathogen of soybean in Illinois. Based on reliable diagnosis, nematode management can help protect the profitability of our major crops.
soybean Cyst nematode Management: Back to BasicsWhat could be easier than managing a soybean crop in a field infested with the soybean cyst nematode (SCN)? Just plant a SCN-resistant variety and forget about it, right? Without regular soil sampling, this approach could easily lead to trouble because SCN can adapt fairly quickly to SCN-resistant varieties. Nematologists and plant pathologists along with soybean growers through soybean checkoff boards throughout the Soybean Belt are pushing for a back-to-basics message about SCN: “take the test, beat the pest.”
The situation that is behind this push is reflected in Illinois, based on responses of Illinois farmers to a survey on SCN management. During a previous year’s Corn & Soybean Classic presentation, I asked the audience how many of them had SCN-infested fields. The answer was that more than 60% knew they had SCN-infested fields. This shows an exceptional level of awareness of SCN that most other Soybean Belt states can’t match. Furthermore, more than 60% took action to manage SCN by planting SCN-
Things Are Changing Again in Corn and Soybean Nematode Management
Terry l. niblackProfessor and NematologistDepartment of Crop SciencesN-531 Turner [email protected]
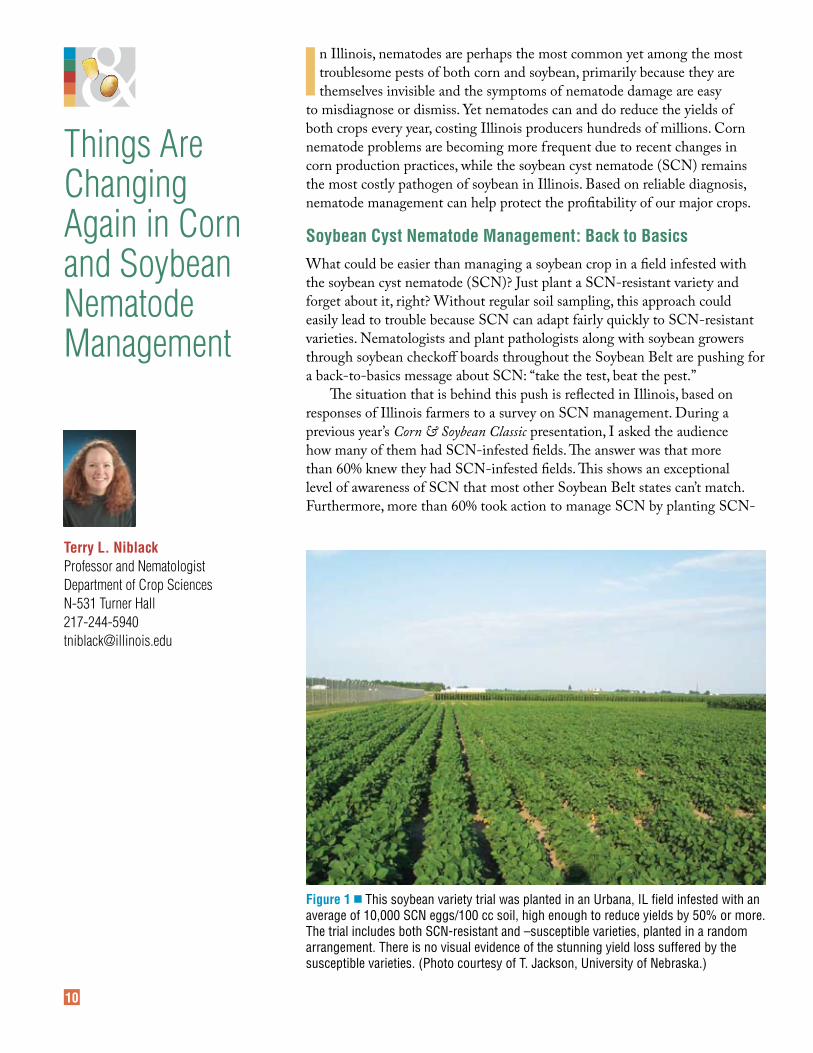
figure 1 ■ This soybean variety trial was planted in an Urbana, IL field infested with an average of 10,000 SCN eggs/100 cc soil, high enough to reduce yields by 50% or more. The trial includes both SCN-resistant and –susceptible varieties, planted in a random arrangement. There is no visual evidence of the stunning yield loss suffered by the susceptible varieties. (Photo courtesy of T. Jackson, University of Nebraska.)
11
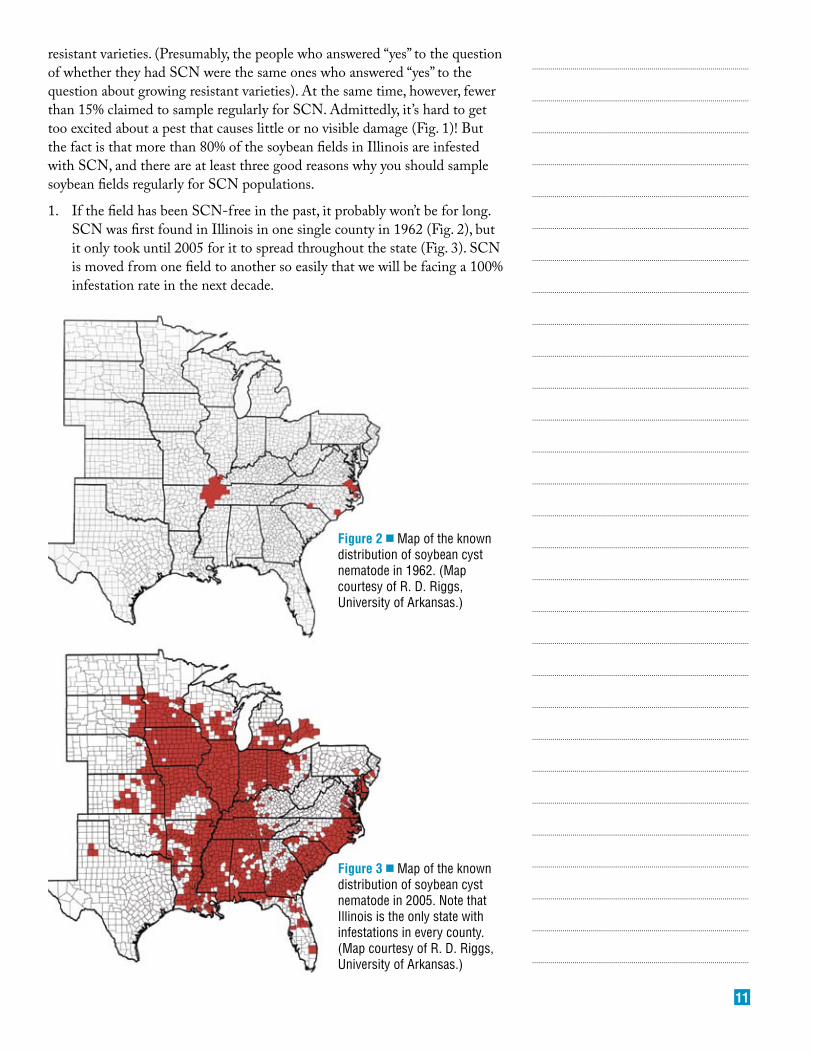
figure 3 ■ Map of the known distribution of soybean cyst nematode in 2005. Note that Illinois is the only state with infestations in every county. (Map courtesy of R. D. Riggs, University of Arkansas.)
...........................................................................................................
...........................................................................................................
...........................................................................................................
...........................................................................................................
...........................................................................................................
...........................................................................................................
...........................................................................................................
...........................................................................................................
...........................................................................................................
...........................................................................................................
...........................................................................................................
...........................................................................................................
...........................................................................................................
...........................................................................................................
...........................................................................................................
...........................................................................................................
...........................................................................................................
...........................................................................................................
...........................................................................................................
...........................................................................................................
...........................................................................................................
...........................................................................................................
...........................................................................................................
...........................................................................................................
...........................................................................................................
...........................................................................................................
...........................................................................................................
...........................................................................................................
...........................................................................................................
resistant varieties. (Presumably, the people who answered “yes” to the question of whether they had SCN were the same ones who answered “yes” to the question about growing resistant varieties). At the same time, however, fewer than 15% claimed to sample regularly for SCN. Admittedly, it’s hard to get too excited about a pest that causes little or no visible damage (Fig. 1)! But the fact is that more than 80% of the soybean fields in Illinois are infested with SCN, and there are at least three good reasons why you should sample soybean fields regularly for SCN populations.
1. If the field has been SCN-free in the past, it probably won’t be for long. SCN was first found in Illinois in one single county in 1962 (Fig. 2), but it only took until 2005 for it to spread throughout the state (Fig. 3). SCN is moved from one field to another so easily that we will be facing a 100% infestation rate in the next decade.
figure 2 ■ Map of the known distribution of soybean cyst nematode in 1962. (Map courtesy of R. D. Riggs, University of Arkansas.)
12
2. It is much easier to keep SCN numbers low than it is to drive high numbers down. Periodic soil sampling is the only way to know what is happening with the population. Keep in mind that SCN can cause 30% or more yield loss without causing any visible symptoms (Fig. 1).
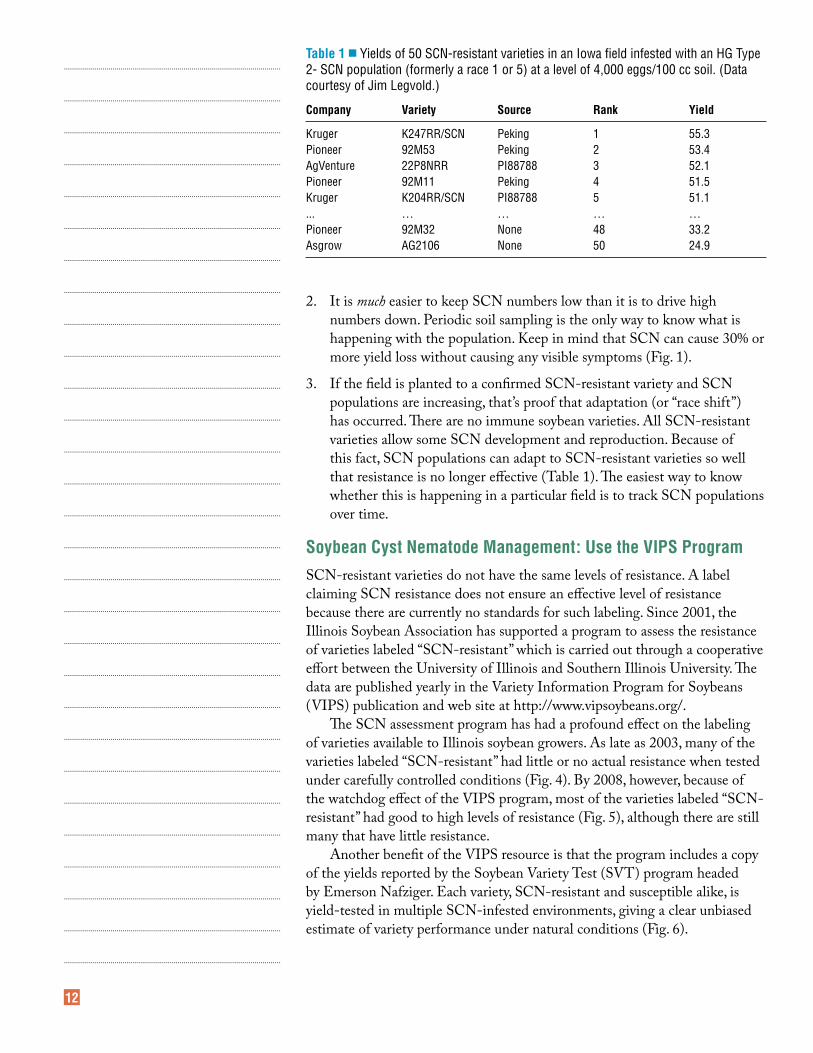
3. If the field is planted to a confirmed SCN-resistant variety and SCN populations are increasing, that’s proof that adaptation (or “race shift”) has occurred. There are no immune soybean varieties. All SCN-resistant varieties allow some SCN development and reproduction. Because of this fact, SCN populations can adapt to SCN-resistant varieties so well that resistance is no longer effective (Table 1). The easiest way to know whether this is happening in a particular field is to track SCN populations over time.
soybean Cyst nematode Management: Use the viPs ProgramSCN-resistant varieties do not have the same levels of resistance. A label claiming SCN resistance does not ensure an effective level of resistance because there are currently no standards for such labeling. Since 2001, the Illinois Soybean Association has supported a program to assess the resistance of varieties labeled “SCN-resistant” which is carried out through a cooperative effort between the University of Illinois and Southern Illinois University. The data are published yearly in the Variety Information Program for Soybeans (VIPS) publication and web site at http://www.vipsoybeans.org/.
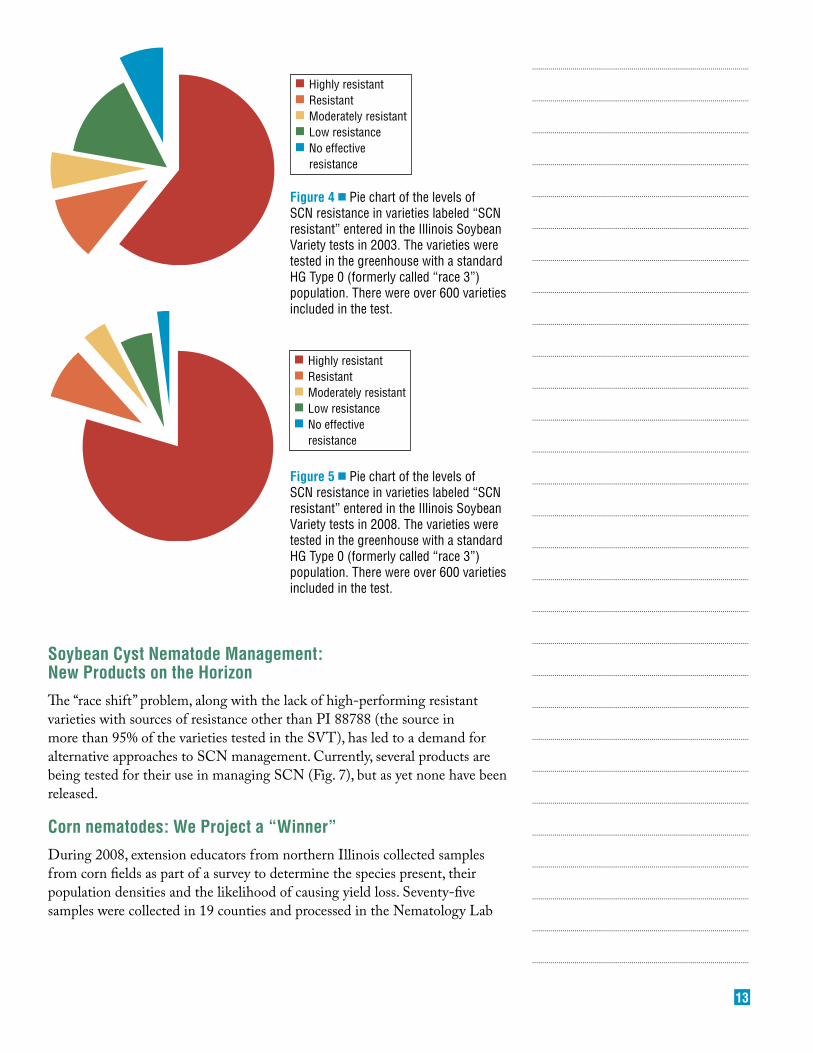
The SCN assessment program has had a profound effect on the labeling of varieties available to Illinois soybean growers. As late as 2003, many of the varieties labeled “SCN-resistant” had little or no actual resistance when tested under carefully controlled conditions (Fig. 4). By 2008, however, because of the watchdog effect of the VIPS program, most of the varieties labeled “SCN-resistant” had good to high levels of resistance (Fig. 5), although there are still many that have little resistance.
Another benefit of the VIPS resource is that the program includes a copy of the yields reported by the Soybean Variety Test (SVT) program headed by Emerson Nafziger. Each variety, SCN-resistant and susceptible alike, is yield-tested in multiple SCN-infested environments, giving a clear unbiased estimate of variety performance under natural conditions (Fig. 6).
...........................................................................................................
...........................................................................................................
...........................................................................................................
...........................................................................................................
...........................................................................................................
...........................................................................................................
...........................................................................................................
...........................................................................................................
...........................................................................................................
...........................................................................................................
...........................................................................................................
...........................................................................................................
...........................................................................................................
...........................................................................................................
...........................................................................................................
...........................................................................................................
...........................................................................................................
...........................................................................................................
...........................................................................................................
...........................................................................................................
...........................................................................................................
...........................................................................................................
...........................................................................................................
...........................................................................................................
...........................................................................................................
...........................................................................................................
...........................................................................................................
...........................................................................................................
...........................................................................................................
Table 1 ■ Yields of 50 SCN-resistant varieties in an Iowa field infested with an HG Type 2- SCN population (formerly a race 1 or 5) at a level of 4,000 eggs/100 cc soil. (Data courtesy of Jim Legvold.)
Company variety source rank yield
Kruger K247RR/SCN Peking 1 55.3Pioneer 92M53 Peking 2 53.4AgVenture 22P8NRR PI88788 3 52.1Pioneer 92M11 Peking 4 51.5Kruger K204RR/SCN PI88788 5 51.1... … … … …Pioneer 92M32 None 48 33.2Asgrow AG2106 None 50 24.9
13
...........................................................................................................
...........................................................................................................
...........................................................................................................
...........................................................................................................
...........................................................................................................
...........................................................................................................
...........................................................................................................
...........................................................................................................
...........................................................................................................
...........................................................................................................
...........................................................................................................
...........................................................................................................
...........................................................................................................
...........................................................................................................
...........................................................................................................
...........................................................................................................
...........................................................................................................
...........................................................................................................
...........................................................................................................
...........................................................................................................
...........................................................................................................
...........................................................................................................
...........................................................................................................
...........................................................................................................
...........................................................................................................
...........................................................................................................
...........................................................................................................
...........................................................................................................
...........................................................................................................
soybean Cyst nematode Management: new Products on the horizonThe “race shift” problem, along with the lack of high-performing resistant varieties with sources of resistance other than PI 88788 (the source in more than 95% of the varieties tested in the SVT), has led to a demand for alternative approaches to SCN management. Currently, several products are being tested for their use in managing SCN (Fig. 7), but as yet none have been released.
Corn nematodes: We Project a “Winner”During 2008, extension educators from northern Illinois collected samples from corn fields as part of a survey to determine the species present, their population densities and the likelihood of causing yield loss. Seventy-five samples were collected in 19 counties and processed in the Nematology Lab
Highly resistantResistantModerately resistantLow resistanceNo effectiveresistance
Highly resistantResistantModerately resistantLow resistanceNo effectiveresistance
figure 4 ■ Pie chart of the levels of SCN resistance in varieties labeled “SCN resistant” entered in the Illinois Soybean Variety tests in 2003. The varieties were tested in the greenhouse with a standard HG Type 0 (formerly called “race 3”) population. There were over 600 varieties included in the test.
figure 5 ■ Pie chart of the levels of SCN resistance in varieties labeled “SCN resistant” entered in the Illinois Soybean Variety tests in 2008. The varieties were tested in the greenhouse with a standard HG Type 0 (formerly called “race 3”) population. There were over 600 varieties included in the test.
14
...........................................................................................................
...........................................................................................................
...........................................................................................................
...........................................................................................................
...........................................................................................................
...........................................................................................................
...........................................................................................................
...........................................................................................................
...........................................................................................................
...........................................................................................................
...........................................................................................................
...........................................................................................................
...........................................................................................................
...........................................................................................................
...........................................................................................................
...........................................................................................................
...........................................................................................................
...........................................................................................................
...........................................................................................................
...........................................................................................................
...........................................................................................................
...........................................................................................................
...........................................................................................................
...........................................................................................................
...........................................................................................................
...........................................................................................................
...........................................................................................................
...........................................................................................................
...........................................................................................................
56
58
60
62
64
66
68
70
72
74
76
78
R S
RegionMonmouthGoodfieldDwight
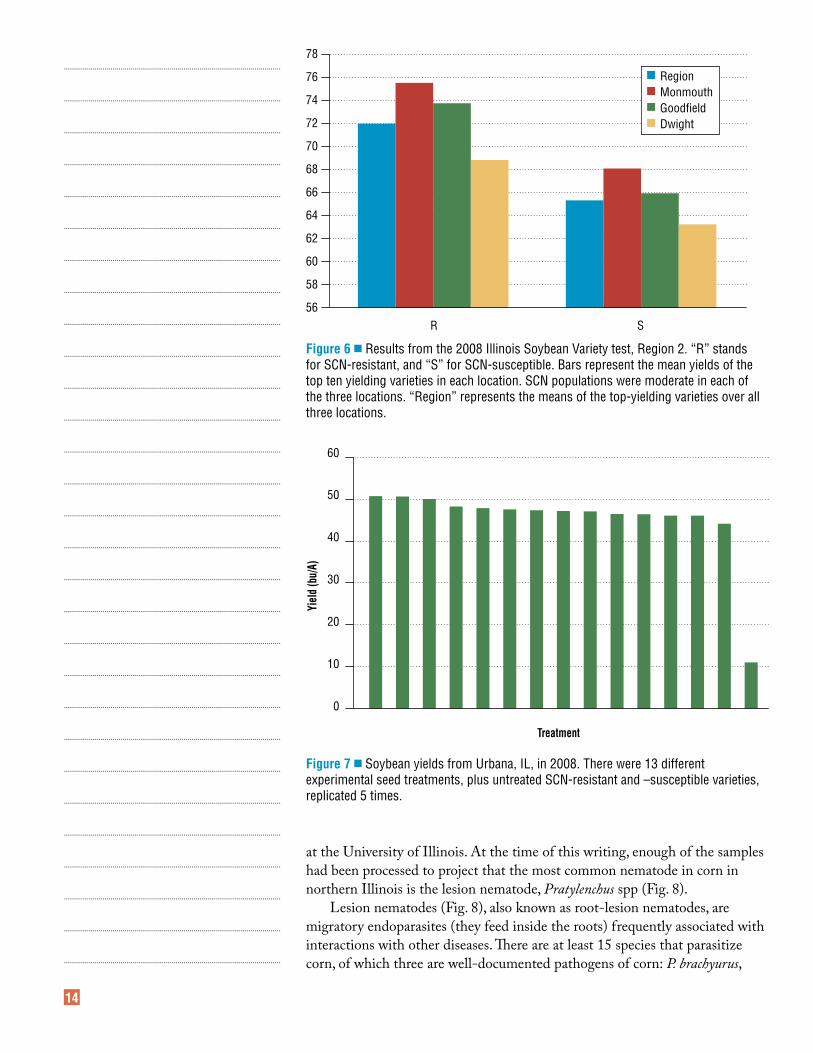
figure 6 ■ Results from the 2008 Illinois Soybean Variety test, Region 2. “R” stands for SCN-resistant, and “S” for SCN-susceptible. Bars represent the mean yields of the top ten yielding varieties in each location. SCN populations were moderate in each of the three locations. “Region” represents the means of the top-yielding varieties over all three locations.
Treatment
60
50
40
30
20
10
0
Yiel
d (b
u/A)
figure 7 ■ Soybean yields from Urbana, IL, in 2008. There were 13 different experimental seed treatments, plus untreated SCN-resistant and –susceptible varieties, replicated 5 times.
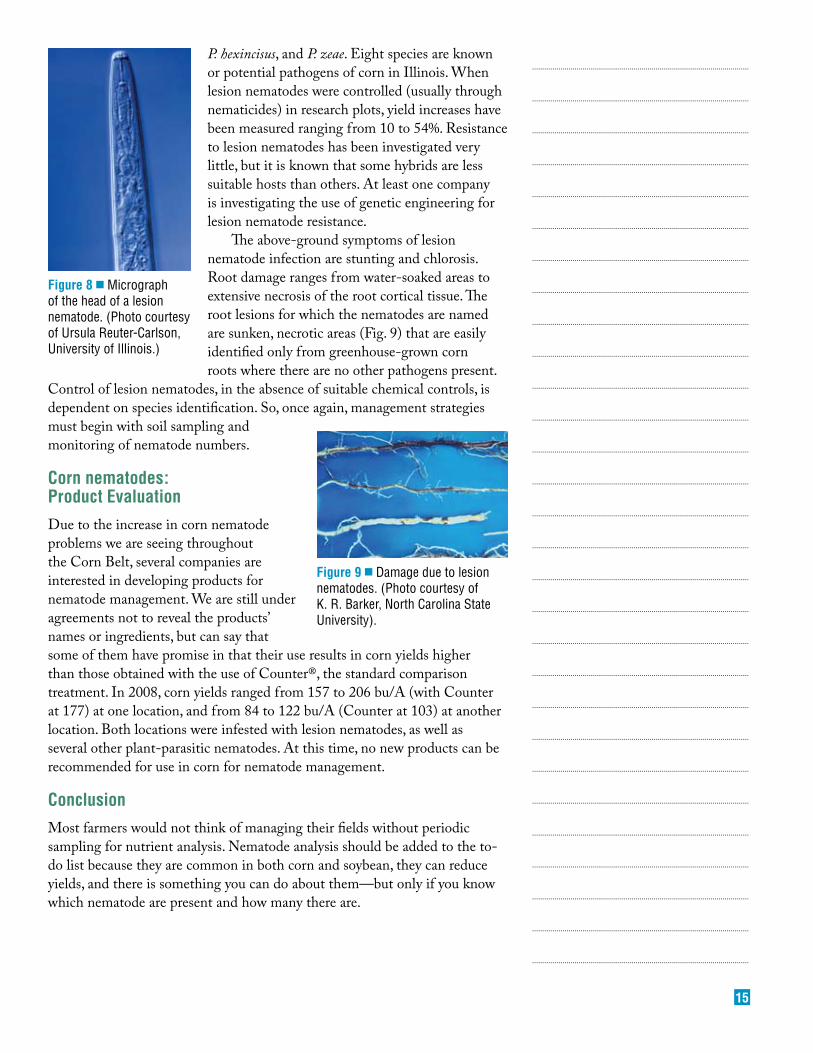
at the University of Illinois. At the time of this writing, enough of the samples had been processed to project that the most common nematode in corn in northern Illinois is the lesion nematode, Pratylenchus spp (Fig. 8).
Lesion nematodes (Fig. 8), also known as root-lesion nematodes, are migratory endoparasites (they feed inside the roots) frequently associated with interactions with other diseases. There are at least 15 species that parasitize corn, of which three are well-documented pathogens of corn: P. brachyurus,
15
P. hexincisus, and P. zeae. Eight species are known or potential pathogens of corn in Illinois. When lesion nematodes were controlled (usually through nematicides) in research plots, yield increases have been measured ranging from 10 to 54%. Resistance to lesion nematodes has been investigated very little, but it is known that some hybrids are less suitable hosts than others. At least one company is investigating the use of genetic engineering for lesion nematode resistance.
The above-ground symptoms of lesion nematode infection are stunting and chlorosis. Root damage ranges from water-soaked areas to extensive necrosis of the root cortical tissue. The root lesions for which the nematodes are named are sunken, necrotic areas (Fig. 9) that are easily identified only from greenhouse-grown corn roots where there are no other pathogens present.
Control of lesion nematodes, in the absence of suitable chemical controls, is dependent on species identification. So, once again, management strategies must begin with soil sampling and monitoring of nematode numbers.
Corn nematodes: Product evaluationDue to the increase in corn nematode problems we are seeing throughout the Corn Belt, several companies are interested in developing products for nematode management. We are still under agreements not to reveal the products’ names or ingredients, but can say that some of them have promise in that their use results in corn yields higher than those obtained with the use of Counter®, the standard comparison treatment. In 2008, corn yields ranged from 157 to 206 bu/A (with Counter at 177) at one location, and from 84 to 122 bu/A (Counter at 103) at another location. Both locations were infested with lesion nematodes, as well as several other plant-parasitic nematodes. At this time, no new products can be recommended for use in corn for nematode management.
ConclusionMost farmers would not think of managing their fields without periodic sampling for nutrient analysis. Nematode analysis should be added to the to-do list because they are common in both corn and soybean, they can reduce yields, and there is something you can do about them—but only if you know which nematode are present and how many there are.
...........................................................................................................
...........................................................................................................
...........................................................................................................
...........................................................................................................
...........................................................................................................
...........................................................................................................
...........................................................................................................
...........................................................................................................
...........................................................................................................
...........................................................................................................
...........................................................................................................
...........................................................................................................
...........................................................................................................
...........................................................................................................
...........................................................................................................
...........................................................................................................
...........................................................................................................
...........................................................................................................
...........................................................................................................
...........................................................................................................
...........................................................................................................
...........................................................................................................
...........................................................................................................
...........................................................................................................
...........................................................................................................
...........................................................................................................
...........................................................................................................
...........................................................................................................
...........................................................................................................
figure 9 ■ Damage due to lesion nematodes. (Photo courtesy of K. R. Barker, North Carolina State University).
figure 8 ■ Micrograph of the head of a lesion nematode. (Photo courtesy of Ursula Reuter-Carlson, University of Illinois.)
16
4
Managing Expensive Nitrogen to Maximize Profitability
fabián G. fernándezAssistant Professor of Soil FertilityDepartment of Crop SciencesN-315 Turner [email protected]
nitrogen (N) fertilization is one of the largest expenses for corn (Zea mays L.) production. Application of N is critical because it typically improves yield significantly. Applying less N than what will be needed
by the crop results in reduced yield and profits. Nitrogen is also a nutrient that can have negative impacts on the environment. Over applying N typically does not cause a yield reduction, but can result in environmental degradation and reduction in return on investment. For these reasons, when choosing an N rate, producers need to evaluate both the profitability and environmental stewardship aspects.
The goal of N management for corn should be to supply the appropriate amount to meet crop needs. In the past, a yield goal approach was used to determine the amount of N to be applied. Nitrogen rate recommendations in Illinois were based from the formula 1.2 lb N/ bushel x bushels of proven yield of continuous corn, and an adjustment for previous legume crop. This approach was discontinued because, among other reasons, recent N response trials showed poor relationship between the N rate and the economic optimum N rate (EONR). The EONR is the point where the last increment of N returns a yield increase large enough to pay for the additional N. The new guideline system for N rates was developed by measuring grain yield response to N rates across many sites and years throughout Illinois and conducting an economic interpretation of those responses. The traditional soybean N credit is no longer used in the new guideline system because trials where corn followed soybean already accounted for that credit.
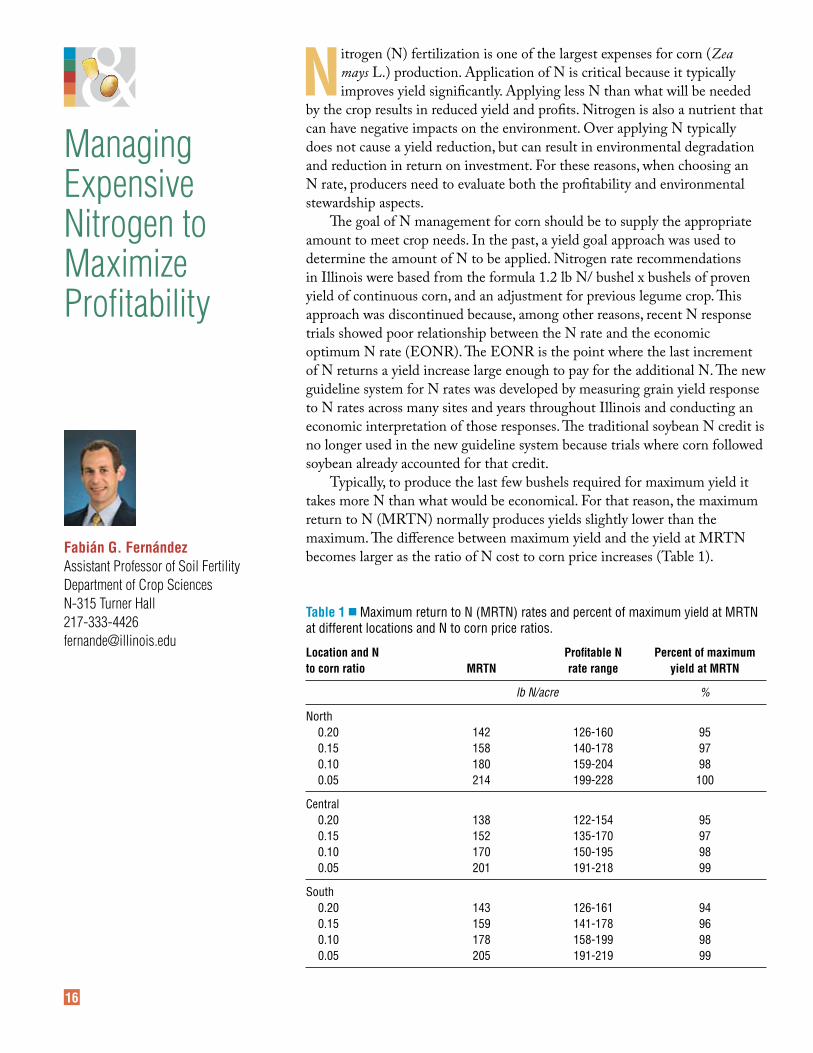
Typically, to produce the last few bushels required for maximum yield it takes more N than what would be economical. For that reason, the maximum return to N (MRTN) normally produces yields slightly lower than the maximum. The difference between maximum yield and the yield at MRTN becomes larger as the ratio of N cost to corn price increases (Table 1).
Table 1 ■ Maximum return to N (MRTN) rates and percent of maximum yield at MRTN at different locations and N to corn price ratios.
location and n Profitable n Percent of maximum to corn ratio MrTn rate range yield at MrTn
lb N/acre %
North 0.20 142 126-160 95 0.15 158 140-178 97 0.10 180 159-204 98 0.05 214 199-228 100
Central 0.20 138 122-154 95 0.15 152 135-170 97 0.10 170 150-195 98 0.05 201 191-218 99
South 0.20 143 126-161 94 0.15 159 141-178 96 0.10 178 158-199 98 0.05 205 191-219 99
17
...........................................................................................................
...........................................................................................................
...........................................................................................................
...........................................................................................................
...........................................................................................................
...........................................................................................................
...........................................................................................................
...........................................................................................................
...........................................................................................................
...........................................................................................................
...........................................................................................................
...........................................................................................................
...........................................................................................................
...........................................................................................................
...........................................................................................................
...........................................................................................................
...........................................................................................................
...........................................................................................................
...........................................................................................................
...........................................................................................................
...........................................................................................................
...........................................................................................................
...........................................................................................................
...........................................................................................................
...........................................................................................................
...........................................................................................................
...........................................................................................................
...........................................................................................................
...........................................................................................................
However, this should not be a point of great concern if the goal is to maximize the return on the investment, and not on getting the highest possible yield.
There are many factors, some which we cannot control, that lead to uncertainty as to how much N will be needed to meet crop needs from year to year. When N was inexpensive, it was common to apply extra N above the MRTN rate to cope with the uncertainty. Since N was inexpensive, this resulted in minor reduction in net return. As N becomes more expensive relative to corn, applying N rates above the MRTN results in considerable economic losses. Thus, this approach should be reconsidered not only to ensure greater economic returns, but also to avoid over application of N that can lead to environmental concerns. The new N rate guideline system helps reduce economic loss from both over application of N that leads to less return on investment, and under application of N that results in reduction of yield potential. The new system also offers a range of N rates within $1 of the MRTN to accommodate the risk aversion or tolerance of different individuals. It is important to remember, however, that while the MRTN provides the best estimate of N rate to minimize risk, there is still some risk level that the producer bears in order to maximize his/her economic return from N. Just as with previous N rate recommendation systems, one must accept that it is unlikely that the new N rate guidelines will accurately predict N needs for all fields in all years or even in any field in any year. Thus, the use of the current guideline system should be coupled with an understanding of N management to maximize N use efficiency.
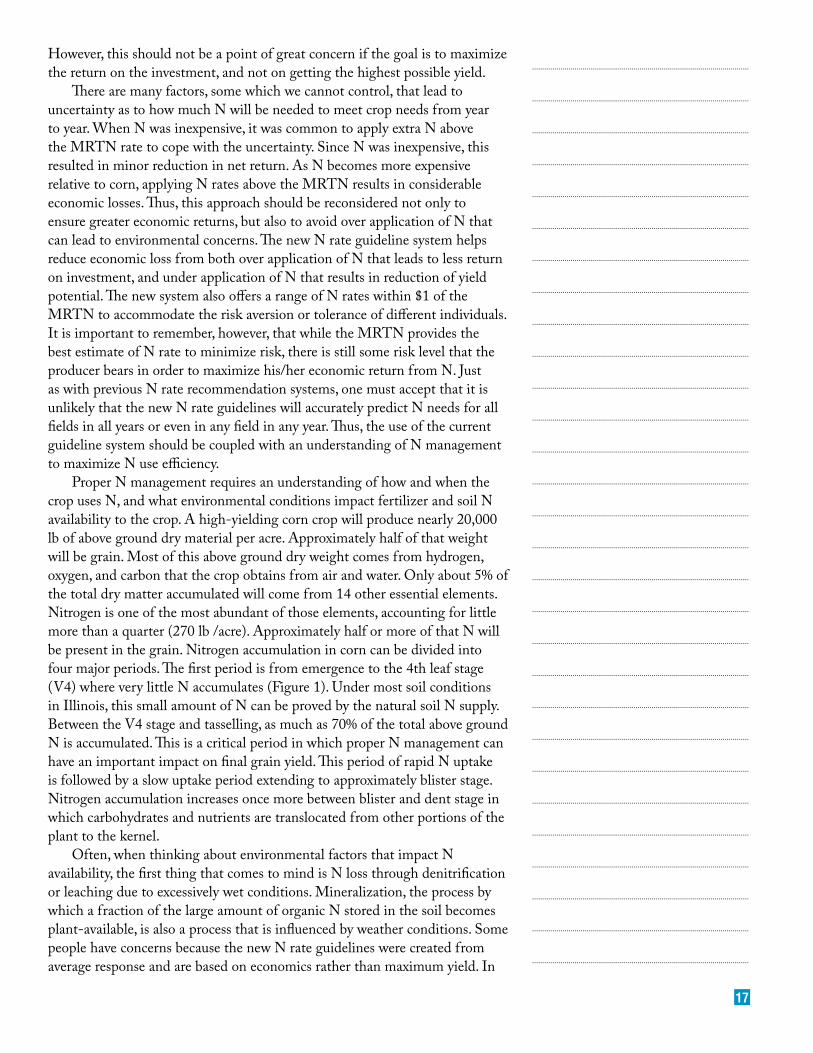
Proper N management requires an understanding of how and when the crop uses N, and what environmental conditions impact fertilizer and soil N availability to the crop. A high-yielding corn crop will produce nearly 20,000 lb of above ground dry material per acre. Approximately half of that weight will be grain. Most of this above ground dry weight comes from hydrogen, oxygen, and carbon that the crop obtains from air and water. Only about 5% of the total dry matter accumulated will come from 14 other essential elements. Nitrogen is one of the most abundant of those elements, accounting for little more than a quarter (270 lb /acre). Approximately half or more of that N will be present in the grain. Nitrogen accumulation in corn can be divided into four major periods. The first period is from emergence to the 4th leaf stage (V4) where very little N accumulates (Figure 1). Under most soil conditions in Illinois, this small amount of N can be proved by the natural soil N supply. Between the V4 stage and tasselling, as much as 70% of the total above ground N is accumulated. This is a critical period in which proper N management can have an important impact on final grain yield. This period of rapid N uptake is followed by a slow uptake period extending to approximately blister stage. Nitrogen accumulation increases once more between blister and dent stage in which carbohydrates and nutrients are translocated from other portions of the plant to the kernel.
Often, when thinking about environmental factors that impact N availability, the first thing that comes to mind is N loss through denitrification or leaching due to excessively wet conditions. Mineralization, the process by which a fraction of the large amount of organic N stored in the soil becomes plant-available, is also a process that is influenced by weather conditions. Some people have concerns because the new N rate guidelines were created from average response and are based on economics rather than maximum yield. In
18
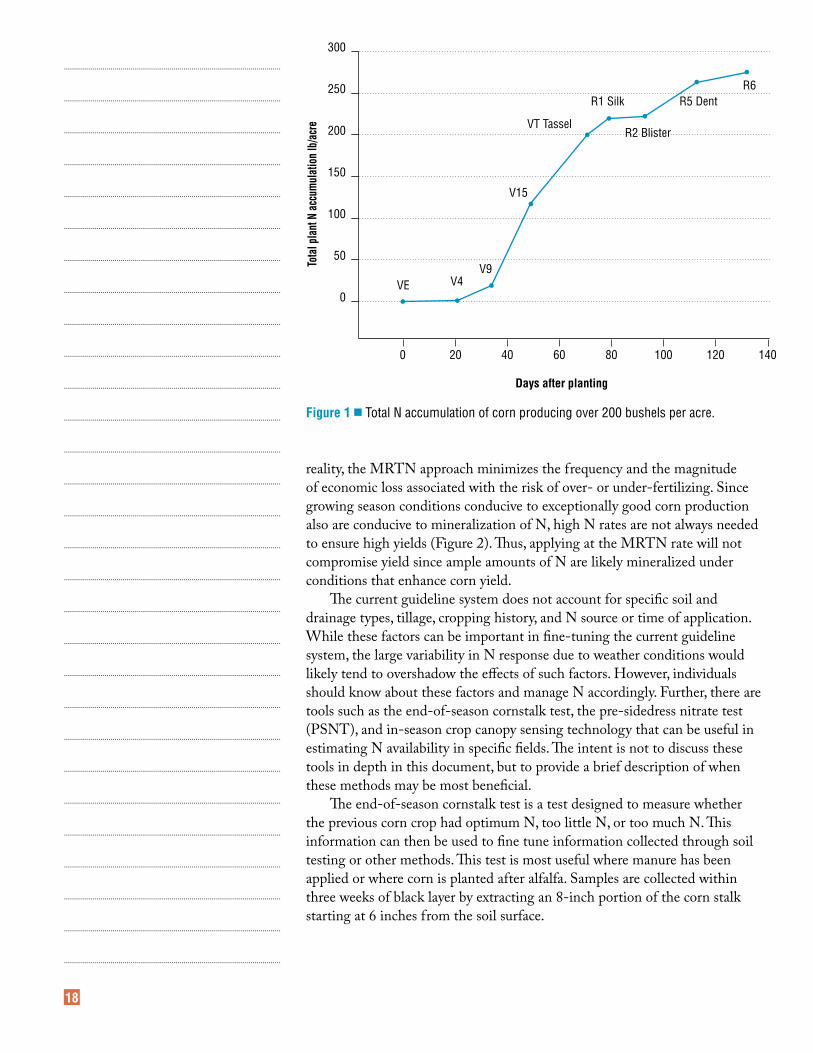
reality, the MRTN approach minimizes the frequency and the magnitude of economic loss associated with the risk of over- or under-fertilizing. Since growing season conditions conducive to exceptionally good corn production also are conducive to mineralization of N, high N rates are not always needed to ensure high yields (Figure 2). Thus, applying at the MRTN rate will not compromise yield since ample amounts of N are likely mineralized under conditions that enhance corn yield.
The current guideline system does not account for specific soil and drainage types, tillage, cropping history, and N source or time of application. While these factors can be important in fine-tuning the current guideline system, the large variability in N response due to weather conditions would likely tend to overshadow the effects of such factors. However, individuals should know about these factors and manage N accordingly. Further, there are tools such as the end-of-season cornstalk test, the pre-sidedress nitrate test (PSNT), and in-season crop canopy sensing technology that can be useful in estimating N availability in specific fields. The intent is not to discuss these tools in depth in this document, but to provide a brief description of when these methods may be most beneficial.
The end-of-season cornstalk test is a test designed to measure whether the previous corn crop had optimum N, too little N, or too much N. This information can then be used to fine tune information collected through soil testing or other methods. This test is most useful where manure has been applied or where corn is planted after alfalfa. Samples are collected within three weeks of black layer by extracting an 8-inch portion of the corn stalk starting at 6 inches from the soil surface.
figure 1 ■ Total N accumulation of corn producing over 200 bushels per acre.
...........................................................................................................
...........................................................................................................
...........................................................................................................
...........................................................................................................
...........................................................................................................
...........................................................................................................
...........................................................................................................
...........................................................................................................
...........................................................................................................
...........................................................................................................
...........................................................................................................
...........................................................................................................
...........................................................................................................
...........................................................................................................
...........................................................................................................
...........................................................................................................
...........................................................................................................
...........................................................................................................
...........................................................................................................
...........................................................................................................
...........................................................................................................
...........................................................................................................
...........................................................................................................
...........................................................................................................
...........................................................................................................
...........................................................................................................
...........................................................................................................
...........................................................................................................
...........................................................................................................
Tota
l pla
nt N
acc
umul
atio
n lb
/acr
e0
50
100
150
200
250
300
Days after planting
0 20 40 60 80 100 120 140
VE V4V9
V15
VT Tassel
R1 Silk
R2 Blister
R5 DentR6
19
figure 2 ■ Corn grain yield at EONR at 0.10 N to corn price ratio. Adapted from Sawyer et al., 2006.
The PSNT is designed to help make more accurate N fertilization at sidedress. This test is most useful in fields that have received manure in recent years, or where organic N has been added. The test can also be used to help assess N loss from pre-plant N applications in excessively wet springs. The test is performed with soil samples collected from the top 12 inches of the soil between the V4 and V6 development stage.
Sensing technologies are designed to estimate the relative N status of a growing crop by measuring plant color using different approaches. GreenSeeker from NTech Industries Inc., Crop Circle from Holland Scientific, and SPAD chlorophyll meter from Minolta are some of the instruments available. The measurements are typically done between V5 and VT development stages in order to supply needed N before the corn crop response to N declines or significant yield loss occurs due to delayed N application. For this technology to work it is necessary to establish non-limiting N strips in the field to use as N sufficiency reference to guide applications.
reference:Sawyer, J. et al. 2006. Concepts and rationale for regional nitrogen rate guidelines for
corn. On line at: http://www.extension.iastate.edu/Publications/PM2015.pdf. Last verified Nov14, 2008.
...........................................................................................................
...........................................................................................................
...........................................................................................................
...........................................................................................................
...........................................................................................................
...........................................................................................................
...........................................................................................................
...........................................................................................................
...........................................................................................................
...........................................................................................................
...........................................................................................................
...........................................................................................................
...........................................................................................................
...........................................................................................................
...........................................................................................................
...........................................................................................................
...........................................................................................................
...........................................................................................................
...........................................................................................................
...........................................................................................................
...........................................................................................................
...........................................................................................................
...........................................................................................................
...........................................................................................................
...........................................................................................................
...........................................................................................................
...........................................................................................................
...........................................................................................................
...........................................................................................................
Yiel
d at
EON
R, b
u/ac
re
0
100
200
300
EONR, lb N/acre
0 50 100 150 200 250
20
...........................................................................................................
...........................................................................................................
...........................................................................................................
...........................................................................................................
...........................................................................................................
...........................................................................................................
...........................................................................................................
...........................................................................................................
...........................................................................................................
...........................................................................................................
...........................................................................................................
...........................................................................................................
...........................................................................................................
...........................................................................................................
...........................................................................................................
...........................................................................................................
...........................................................................................................
...........................................................................................................
...........................................................................................................
...........................................................................................................
...........................................................................................................
...........................................................................................................
...........................................................................................................
...........................................................................................................
...........................................................................................................
...........................................................................................................
...........................................................................................................
...........................................................................................................
...........................................................................................................
sulfur research: Call for volunteers Volunteers are needed throughout Illinois who would like to participate in an on-farm research study to measure corn response to sulfur applications. While not widely spread, the frequency of sulfur deficiency in corn has increased over the years since it was first seen in Illinois three decades ago. This increase in frequency of sulfur deficiency is likely the result of several factors, including less use of sulfur-containing fertilizers, insecticides, and fungicides; less atmospheric sulfur deposition; greater removal rates by increasing grain yields; increased use of conservation tillage which may reduce sulfur availability; and fewer livestock operations causing less application of manure.
Requirements:soil conditions: In an effort to characterize sulfur response across the State, the study will be conducted in as many locations as possible under high-yielding environments. While soils with fine texture and high in organic matter will be included, priority will be given to sites with low organic matter (< 2%) and coarse (sandy) texture or both. These two criteria were selected because they influence the natural sulfur-supplying power of the soil and the ability to retain this nutrient within the rooting zone. Also, sites with suspect sulfur deficiency will be highly desirable. Fields that will not be considered in the study are those that have received manure or sulfur applications within the last 5 years.
equipment and sulfur sources: Volunteers will need to broadcast sulfur in strips using GPS to georeference the location of the treatment strip. Grain yield will need to be calculated using a yield monitor or weigh wagon.
Sulfur sources will be limited to either ammonium sulfate (NH4)2SO4 (21-0-0-24); two forms of MicroEssentialsTM sulfur (ME S), ME S15 (13-33-0-15) or ME S10 (12-40-0-10); and elemental sulfur (0-0-0-90). One or two sulfur rates will be applied in strips and each will be replicated at least three times. If the sulfur source contains other accompanying nutrients, the corresponding rates of those nutrients will need to be applied to other treatment strips to avoid a differential response to nutrients other than sulfur.
Volunteers will not be required to take plant or soil samples, but would need to allow the researcher to visit the strips approximately three times during the growing season.
If you are interested in participating please contact Fabián Fernández.
21
5
Seed Costs and Corn Plant Population
emerson D. nafzigerProfessor and Extension AgronomistDepartment of Crop SciencesW-301 Turner [email protected]
As reported in official yield surveys and by producers and seed companies, there has been a steady increase in corn plant populations in Illinois and the Corn Belt over the past two decades. While many producers report
that they plant populations in the lower to mid-30,000 range, the stand counts done as part of yield estimation by the National Agricultural Statistics Service report harvest populations averaging only about 28,000 in Illinois in the past two years. It is not clear why this gap exists, but there is no question that most producers view “high” population as a key to high yield. Seed companies have encouraged this trend, and some are suggesting that populations will increase even more over the coming years.
Seed company recommendations range from the mid-20,000s to the mid-30,000s or even higher, and are often different for different hybrids and for different soil productivity levels. A great deal of selection has been done by breeders to produce hybrids that tolerate high populations without excessive barrenness and without frequent and excessive lodging. This is not done simply to sell more seed, though that would not be an “unintended consequence.” Instead, selection under higher populations leads naturally to hybrids that can tolerate the stress of higher populations. Just because a hybrid can tolerate high populations does not automatically mean that it must be at high populations to produce its highest yields. There is, though, some evidence that hybrids are trending in that direction, and some hybrids perform best at high populations.
The tolerance to stress from high populations bred into modern hybrids means greater tolerance to weather-related stress as well. Studies have shown, in fact, that today’s hybrids yield about the same as old hybrids if planted at very low populations of 10,000 or so, while modern hybrids yield much better than older ones at populations above 20,000, where competition between neighboring plants is increasing. While older hybrids tend to go barren as populations increase, newer hybrids have the ability to produce silks and to successfully produce high seed numbers per acre even at high levels of competition between plants.
We have conducted a series of plant population studies at six different locations in Illinois—three in the northern half of the state and three in the southern half—over the past several years. Most of these studies have included planting date, and results will allow us to update expectations regarding planting date and replant decisions. Here we will use data from planting dates of mid-May or earlier. Because different planting dates experience different growing conditions, we will treat them as separate trials. Many of these trials used the same hybrid, so hybrid is a minor factor. In most of the trials, harvest populations were established by hand-thinning, and ranged from 20,000 to 40,000 or 45,000 plants per acre.
Population responsesOne of the features of plant population response trials is that results tend to vary a lot depending on weather and soils. Figure 1 shows actual response curves from four different sites. There are four types of response curves:
1. The top curve shows yield increasing up to a certain population, then leveling off. This is a very typical response, especially under higher-yielding conditions.
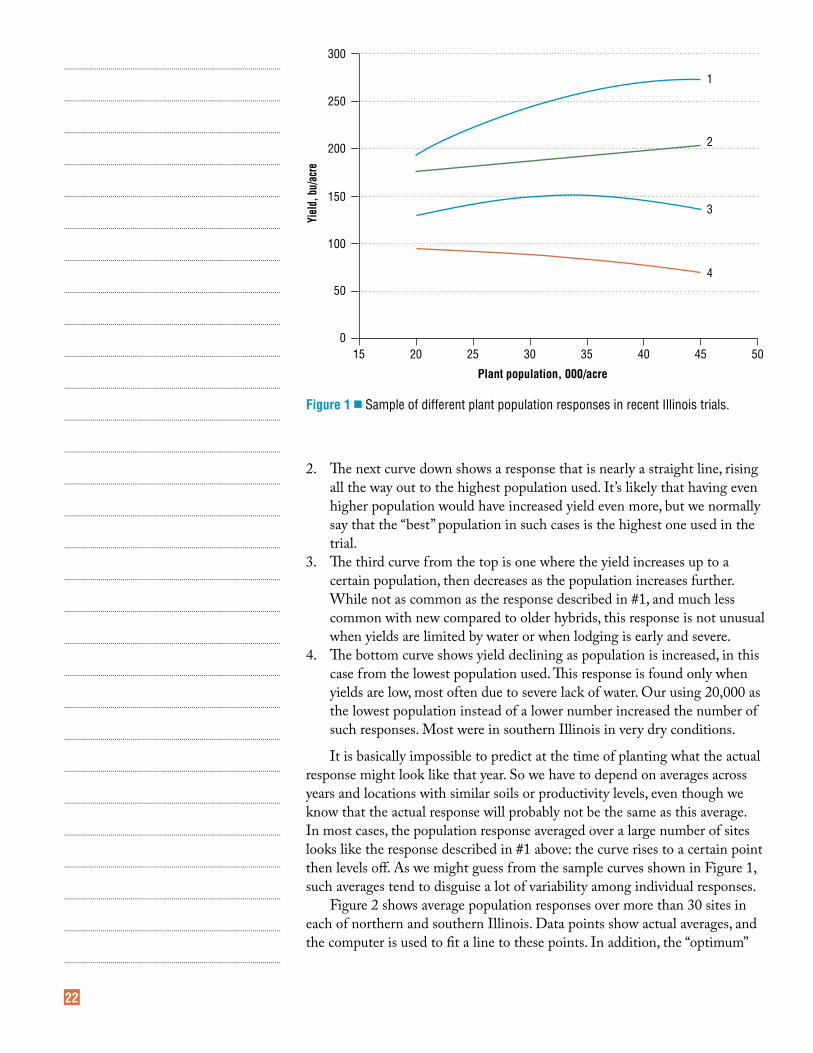
22
2. The next curve down shows a response that is nearly a straight line, rising all the way out to the highest population used. It’s likely that having even higher population would have increased yield even more, but we normally say that the “best” population in such cases is the highest one used in the trial.
3. The third curve from the top is one where the yield increases up to a certain population, then decreases as the population increases further. While not as common as the response described in #1, and much less common with new compared to older hybrids, this response is not unusual when yields are limited by water or when lodging is early and severe.
4. The bottom curve shows yield declining as population is increased, in this case from the lowest population used. This response is found only when yields are low, most often due to severe lack of water. Our using 20,000 as the lowest population instead of a lower number increased the number of such responses. Most were in southern Illinois in very dry conditions.
It is basically impossible to predict at the time of planting what the actual response might look like that year. So we have to depend on averages across years and locations with similar soils or productivity levels, even though we know that the actual response will probably not be the same as this average. In most cases, the population response averaged over a large number of sites looks like the response described in #1 above: the curve rises to a certain point then levels off. As we might guess from the sample curves shown in Figure 1, such averages tend to disguise a lot of variability among individual responses.
Figure 2 shows average population responses over more than 30 sites in each of northern and southern Illinois. Data points show actual averages, and the computer is used to fit a line to these points. In addition, the “optimum”
figure 1 ■ Sample of different plant population responses in recent Illinois trials.
...........................................................................................................
...........................................................................................................
...........................................................................................................
...........................................................................................................
...........................................................................................................
...........................................................................................................
...........................................................................................................
...........................................................................................................
...........................................................................................................
...........................................................................................................
...........................................................................................................
...........................................................................................................
...........................................................................................................
...........................................................................................................
...........................................................................................................
...........................................................................................................
...........................................................................................................
...........................................................................................................
...........................................................................................................
...........................................................................................................
...........................................................................................................
...........................................................................................................
...........................................................................................................
...........................................................................................................
...........................................................................................................
...........................................................................................................
...........................................................................................................
...........................................................................................................
...........................................................................................................
Yiel
d, b
u/ac
re
0
50
100
150
200
300
250
Plant population, 000/acre
15 20 25 30 35 40
1
2
3
4
45 50
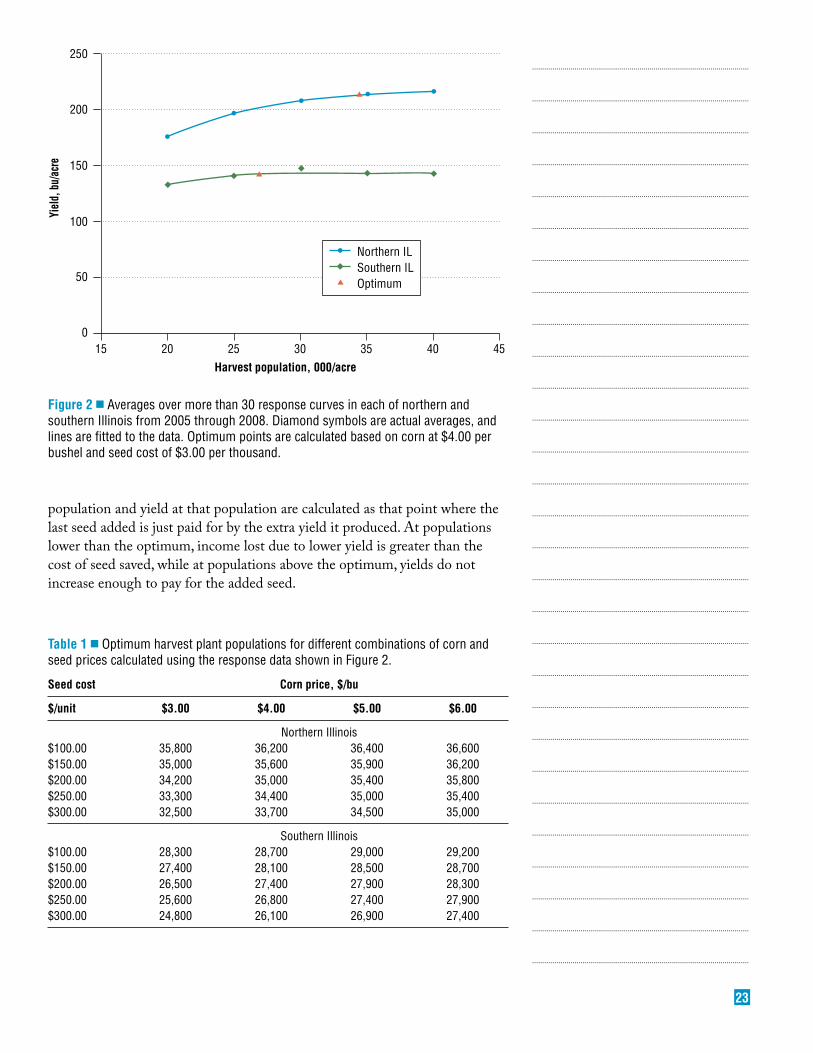
23
population and yield at that population are calculated as that point where the last seed added is just paid for by the extra yield it produced. At populations lower than the optimum, income lost due to lower yield is greater than the cost of seed saved, while at populations above the optimum, yields do not increase enough to pay for the added seed.
figure 2 ■ Averages over more than 30 response curves in each of northern and southern Illinois from 2005 through 2008. Diamond symbols are actual averages, and lines are fitted to the data. Optimum points are calculated based on corn at $4.00 per bushel and seed cost of $3.00 per thousand.
Yiel
d, b
u/ac
re
0
50
100
150
200
250
Harvest population, 000/acre15 20 25 30 35 40 45
Northern ILSouthern ILOptimum
...........................................................................................................
...........................................................................................................
...........................................................................................................
...........................................................................................................
...........................................................................................................
...........................................................................................................
...........................................................................................................
...........................................................................................................
...........................................................................................................
...........................................................................................................
...........................................................................................................
...........................................................................................................
...........................................................................................................
...........................................................................................................
...........................................................................................................
...........................................................................................................
...........................................................................................................
...........................................................................................................
...........................................................................................................
...........................................................................................................
...........................................................................................................
...........................................................................................................
...........................................................................................................
...........................................................................................................
...........................................................................................................
...........................................................................................................
...........................................................................................................
...........................................................................................................
...........................................................................................................
Table 1 ■ Optimum harvest plant populations for different combinations of corn and seed prices calculated using the response data shown in Figure 2.
seed cost Corn price, $/bu
$/unit $3.00 $4.00 $5.00 $6.00
Northern Illinois$100.00 35,800 36,200 36,400 36,600$150.00 35,000 35,600 35,900 36,200$200.00 34,200 35,000 35,400 35,800$250.00 33,300 34,400 35,000 35,400$300.00 32,500 33,700 34,500 35,000
Southern Illinois$100.00 28,300 28,700 29,000 29,200$150.00 27,400 28,100 28,500 28,700$200.00 26,500 27,400 27,900 28,300$250.00 25,600 26,800 27,400 27,900$300.00 24,800 26,100 26,900 27,400
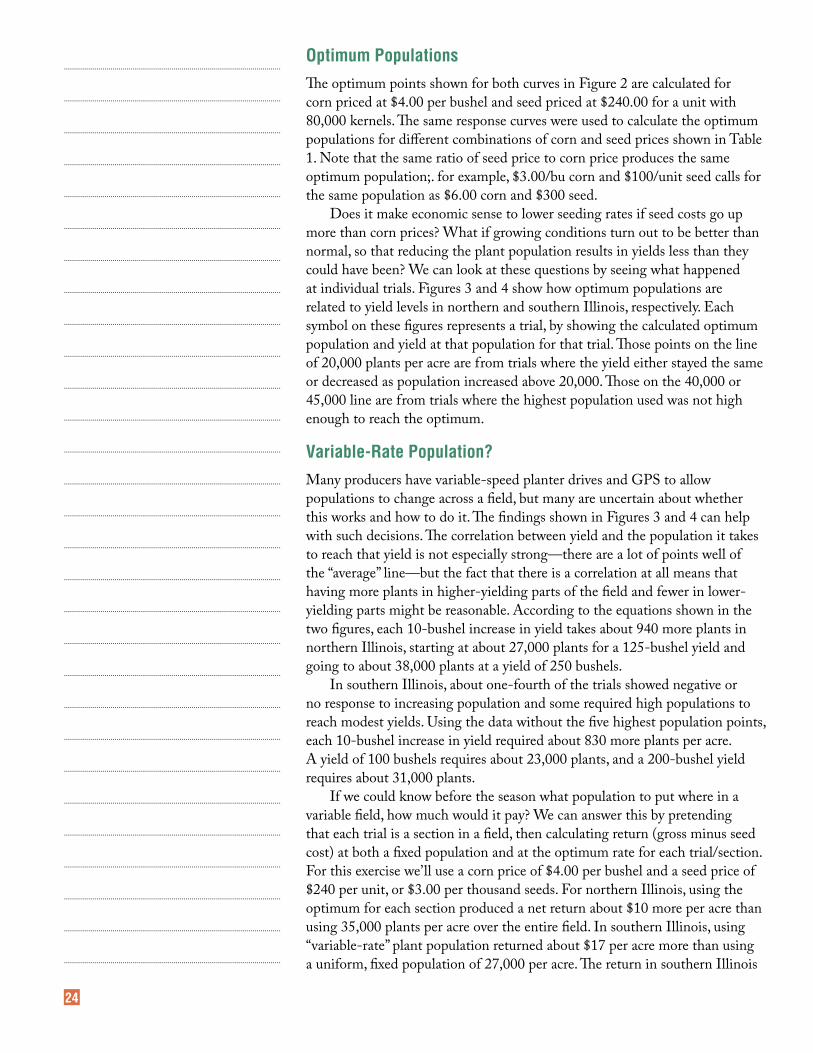
24
optimum PopulationsThe optimum points shown for both curves in Figure 2 are calculated for corn priced at $4.00 per bushel and seed priced at $240.00 for a unit with 80,000 kernels. The same response curves were used to calculate the optimum populations for different combinations of corn and seed prices shown in Table 1. Note that the same ratio of seed price to corn price produces the same optimum population;. for example, $3.00/bu corn and $100/unit seed calls for the same population as $6.00 corn and $300 seed.
Does it make economic sense to lower seeding rates if seed costs go up more than corn prices? What if growing conditions turn out to be better than normal, so that reducing the plant population results in yields less than they could have been? We can look at these questions by seeing what happened at individual trials. Figures 3 and 4 show how optimum populations are related to yield levels in northern and southern Illinois, respectively. Each symbol on these figures represents a trial, by showing the calculated optimum population and yield at that population for that trial. Those points on the line of 20,000 plants per acre are from trials where the yield either stayed the same or decreased as population increased above 20,000. Those on the 40,000 or 45,000 line are from trials where the highest population used was not high enough to reach the optimum.
variable-rate Population?Many producers have variable-speed planter drives and GPS to allow populations to change across a field, but many are uncertain about whether this works and how to do it. The findings shown in Figures 3 and 4 can help with such decisions. The correlation between yield and the population it takes to reach that yield is not especially strong—there are a lot of points well of the “average” line—but the fact that there is a correlation at all means that having more plants in higher-yielding parts of the field and fewer in lower-yielding parts might be reasonable. According to the equations shown in the two figures, each 10-bushel increase in yield takes about 940 more plants in northern Illinois, starting at about 27,000 plants for a 125-bushel yield and going to about 38,000 plants at a yield of 250 bushels.
In southern Illinois, about one-fourth of the trials showed negative or no response to increasing population and some required high populations to reach modest yields. Using the data without the five highest population points, each 10-bushel increase in yield required about 830 more plants per acre. A yield of 100 bushels requires about 23,000 plants, and a 200-bushel yield requires about 31,000 plants.
If we could know before the season what population to put where in a variable field, how much would it pay? We can answer this by pretending that each trial is a section in a field, then calculating return (gross minus seed cost) at both a fixed population and at the optimum rate for each trial/section. For this exercise we’ll use a corn price of $4.00 per bushel and a seed price of $240 per unit, or $3.00 per thousand seeds. For northern Illinois, using the optimum for each section produced a net return about $10 more per acre than using 35,000 plants per acre over the entire field. In southern Illinois, using “variable-rate” plant population returned about $17 per acre more than using a uniform, fixed population of 27,000 per acre. The return in southern Illinois
...........................................................................................................
...........................................................................................................
...........................................................................................................
...........................................................................................................
...........................................................................................................
...........................................................................................................
...........................................................................................................
...........................................................................................................
...........................................................................................................
...........................................................................................................
...........................................................................................................
...........................................................................................................
...........................................................................................................
...........................................................................................................
...........................................................................................................
...........................................................................................................
...........................................................................................................
...........................................................................................................
...........................................................................................................
...........................................................................................................
...........................................................................................................
...........................................................................................................
...........................................................................................................
...........................................................................................................
...........................................................................................................
...........................................................................................................
...........................................................................................................
...........................................................................................................
...........................................................................................................
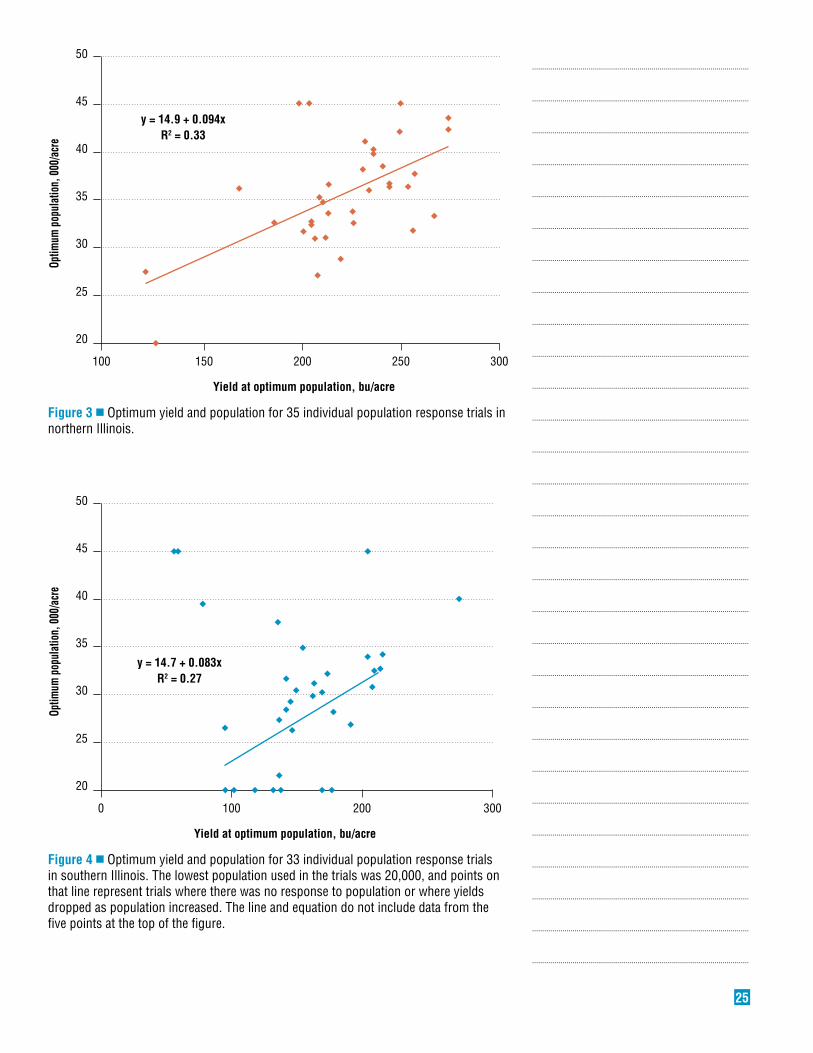
25
...........................................................................................................
...........................................................................................................
...........................................................................................................
...........................................................................................................
...........................................................................................................
...........................................................................................................
...........................................................................................................
...........................................................................................................
...........................................................................................................
...........................................................................................................
...........................................................................................................
...........................................................................................................
...........................................................................................................
...........................................................................................................
...........................................................................................................
...........................................................................................................
...........................................................................................................
...........................................................................................................
...........................................................................................................
...........................................................................................................
...........................................................................................................
...........................................................................................................
...........................................................................................................
...........................................................................................................
...........................................................................................................
...........................................................................................................
...........................................................................................................
...........................................................................................................
...........................................................................................................
Optim
um p
opul
atio
n, 0
00/a
cre
20
25
30
35
40
45
50
y = 14.9 + 0.094xR2 = 0.33
Yield at optimum population, bu/acre
100 150 200 250 300
Optim
um p
opul
atio
n, 0
00/a
cre
20
25
30
35
40
45
50
y = 14.7 + 0.083xR2 = 0.27
Yield at optimum population, bu/acre
0 100 200 300
figure 3 ■ Optimum yield and population for 35 individual population response trials in northern Illinois.
figure 4 ■ Optimum yield and population for 33 individual population response trials in southern Illinois. The lowest population used in the trials was 20,000, and points on that line represent trials where there was no response to population or where yields dropped as population increased. The line and equation do not include data from the five points at the top of the figure.
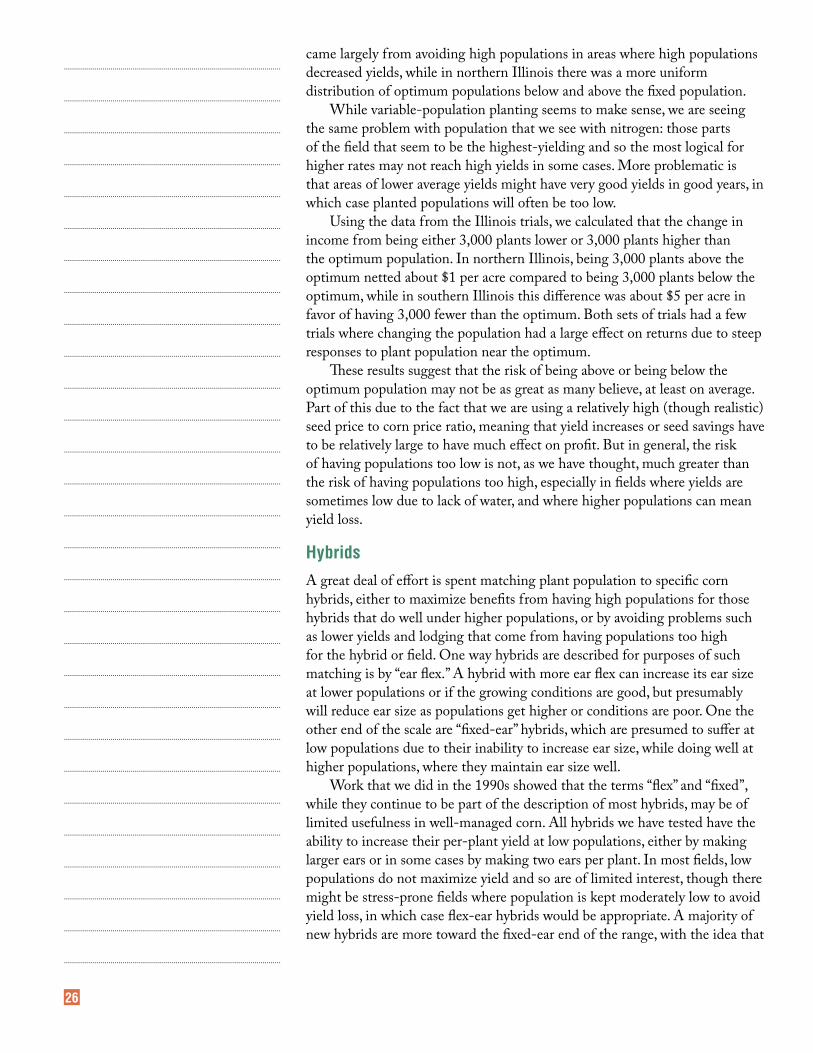
26
came largely from avoiding high populations in areas where high populations decreased yields, while in northern Illinois there was a more uniform distribution of optimum populations below and above the fixed population.
While variable-population planting seems to make sense, we are seeing the same problem with population that we see with nitrogen: those parts of the field that seem to be the highest-yielding and so the most logical for higher rates may not reach high yields in some cases. More problematic is that areas of lower average yields might have very good yields in good years, in which case planted populations will often be too low.
Using the data from the Illinois trials, we calculated that the change in income from being either 3,000 plants lower or 3,000 plants higher than the optimum population. In northern Illinois, being 3,000 plants above the optimum netted about $1 per acre compared to being 3,000 plants below the optimum, while in southern Illinois this difference was about $5 per acre in favor of having 3,000 fewer than the optimum. Both sets of trials had a few trials where changing the population had a large effect on returns due to steep responses to plant population near the optimum.
These results suggest that the risk of being above or being below the optimum population may not be as great as many believe, at least on average. Part of this due to the fact that we are using a relatively high (though realistic) seed price to corn price ratio, meaning that yield increases or seed savings have to be relatively large to have much effect on profit. But in general, the risk of having populations too low is not, as we have thought, much greater than the risk of having populations too high, especially in fields where yields are sometimes low due to lack of water, and where higher populations can mean yield loss.
hybridsA great deal of effort is spent matching plant population to specific corn hybrids, either to maximize benefits from having high populations for those hybrids that do well under higher populations, or by avoiding problems such as lower yields and lodging that come from having populations too high for the hybrid or field. One way hybrids are described for purposes of such matching is by “ear flex.” A hybrid with more ear flex can increase its ear size at lower populations or if the growing conditions are good, but presumably will reduce ear size as populations get higher or conditions are poor. One the other end of the scale are “fixed-ear” hybrids, which are presumed to suffer at low populations due to their inability to increase ear size, while doing well at higher populations, where they maintain ear size well.
Work that we did in the 1990s showed that the terms “flex” and “fixed”, while they continue to be part of the description of most hybrids, may be of limited usefulness in well-managed corn. All hybrids we have tested have the ability to increase their per-plant yield at low populations, either by making larger ears or in some cases by making two ears per plant. In most fields, low populations do not maximize yield and so are of limited interest, though there might be stress-prone fields where population is kept moderately low to avoid yield loss, in which case flex-ear hybrids would be appropriate. A majority of new hybrids are more toward the fixed-ear end of the range, with the idea that
...........................................................................................................
...........................................................................................................
...........................................................................................................
...........................................................................................................
...........................................................................................................
...........................................................................................................
...........................................................................................................
...........................................................................................................
...........................................................................................................
...........................................................................................................
...........................................................................................................
...........................................................................................................
...........................................................................................................
...........................................................................................................
...........................................................................................................
...........................................................................................................
...........................................................................................................
...........................................................................................................
...........................................................................................................
...........................................................................................................
...........................................................................................................
...........................................................................................................
...........................................................................................................
...........................................................................................................
...........................................................................................................
...........................................................................................................
...........................................................................................................
...........................................................................................................
...........................................................................................................
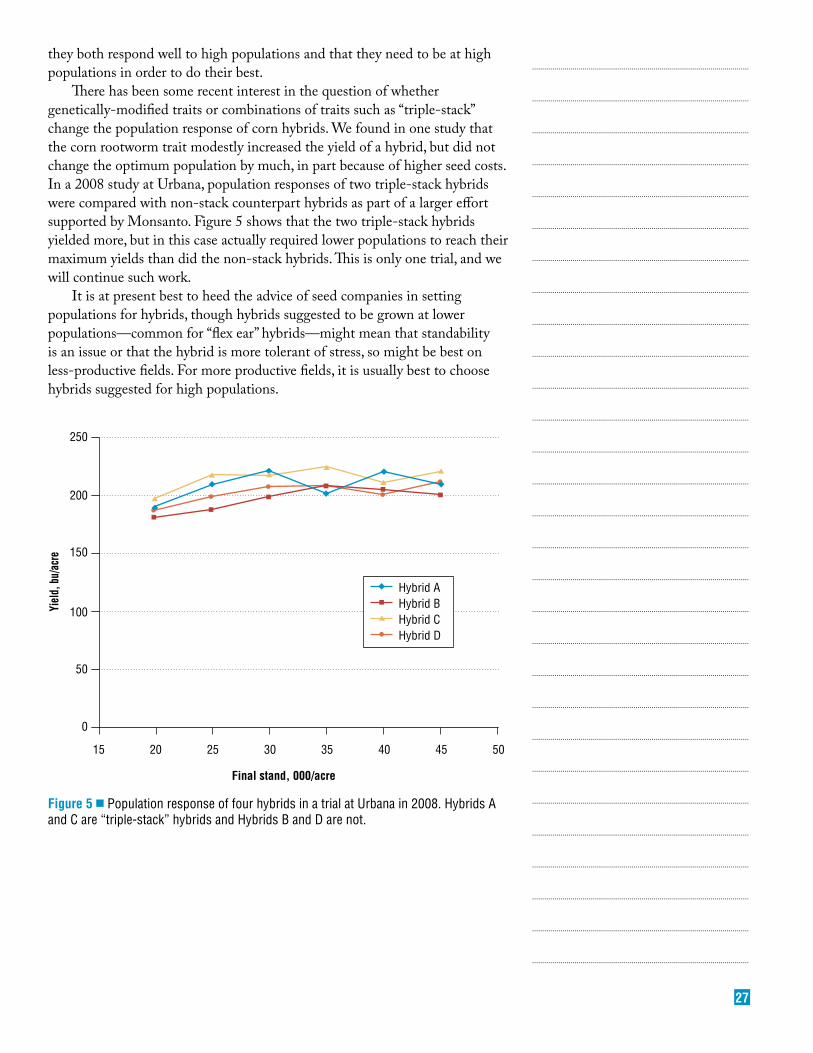
27
...........................................................................................................
...........................................................................................................
...........................................................................................................
...........................................................................................................
...........................................................................................................
...........................................................................................................
...........................................................................................................
...........................................................................................................
...........................................................................................................
...........................................................................................................
...........................................................................................................
...........................................................................................................
...........................................................................................................
...........................................................................................................
...........................................................................................................
...........................................................................................................
...........................................................................................................
...........................................................................................................
...........................................................................................................
...........................................................................................................
...........................................................................................................
...........................................................................................................
...........................................................................................................
...........................................................................................................
...........................................................................................................
...........................................................................................................
...........................................................................................................
...........................................................................................................
...........................................................................................................
figure 5 ■ Population response of four hybrids in a trial at Urbana in 2008. Hybrids A and C are “triple-stack” hybrids and Hybrids B and D are not.
they both respond well to high populations and that they need to be at high populations in order to do their best.
There has been some recent interest in the question of whether genetically-modified traits or combinations of traits such as “triple-stack” change the population response of corn hybrids. We found in one study that the corn rootworm trait modestly increased the yield of a hybrid, but did not change the optimum population by much, in part because of higher seed costs. In a 2008 study at Urbana, population responses of two triple-stack hybrids were compared with non-stack counterpart hybrids as part of a larger effort supported by Monsanto. Figure 5 shows that the two triple-stack hybrids yielded more, but in this case actually required lower populations to reach their maximum yields than did the non-stack hybrids. This is only one trial, and we will continue such work.
It is at present best to heed the advice of seed companies in setting populations for hybrids, though hybrids suggested to be grown at lower populations—common for “flex ear” hybrids—might mean that standability is an issue or that the hybrid is more tolerant of stress, so might be best on less-productive fields. For more productive fields, it is usually best to choose hybrids suggested for high populations.
Yiel
d, b
u/ac
re
0
50
100
150
200
250
Final stand, 000/acre
15 20 25 30 35 40 45 50
Hybrid AHybrid BHybrid CHybrid D
28
Managing Corn and Soybean Diseases with Fungicides
in the last few years, foliar fungicide use on corn and soybean in the Midwestern U.S. has increased dramatically. The primary fungicide class being applied to these crops is known as the “strobilurins.” Strobilurin
fungicides are a relatively new class of fungicides that have efficacy against a broad spectrum of pathogenic fungi. In general, strobilurin fungicides are considered to be preventative (should be applied prior to or at the beginning stages of disease). Another type of fungicide class that is sometimes mixed with a strobilurin fungicide is known as the “triazoles.” Triazole fungicides tend to be more systemic in the plant and may have better “curative” or post-infection activity than strobilurin fungicides. Solo strobilurin fungicide products currently registered for use on corn and soybean are Headline® and Quadris®. Combination strobilurin + triazole pre-mix products registered on corn and soybean include Stratego® and Quilt®. Tilt® fungicide (and a few other similar products with the same active ingredient—propiconazole) is the only solo triazole fungicide product registered for use on corn. Because of the threat of soybean rust, many triazole fungicides are now registered for use on soybean.
results of University fungicide TrialsCorn2007 • A summary of corn fungicide trials conducted in 2007 by universities in twelve states (Illinois, Indiana, Iowa, Kansas, Kentucky, Maryland, Minnesota, Missouri, Nebraska, North Dakota, Ohio, and Wisconsin) and one Canadian province (Ontario) was developed. This summary included trials that evaluated Headline, Quilt, or Stratego fungicide, which resulted into 168 data points. In this summary, the yield differences between fungicide-treated and non-treated plots ranged from –29 to 2 bu/A, and the average yield difference was 3 bu/A in favor of fungicide-treated plots. When hybrid susceptibility to gray leaf spot was considered in this summary, corn hybrids with good to excellent resistance to gray leaf spot and treated with a fungicide had 3 bu/A greater yield than untreated areas; however, corn hybrids with fair to poor resistance to gray leaf spot and treated with a fungicide had 6 bu/A greater yield than untreated areas.
Results of Illinois corn fungicide trials in 2007 were similar to the national summary, in which the average difference between fungicide-treated and non-treated plots was 3 bu/A in favor of fungicide-treated plots. In these trials, differences in rainfall during July and August in different regions of the state influenced the results of fungicide trials conducted in those regions. Fungicide trials in southern Illinois, central Illinois, and northern Illinois resulted in a 1, 3, and 5 bu/A yield advantage with fungicides, respectively. The magnitude of the yield difference in each region was closely-related to the amount of rainfall in each region during July and August.
2008 • At the time this article was written, not all of the University of Illinois fungicide trials had been harvested; thus, the 2008 results presented herein are “preliminary.” Results from these trials showed a yield response range from –17 to 32 bu/A, with the average yield response to a fungicide at 6.3 bu/A (Fig. 1).
Carl A. BradleyAssistant Professor and Extension
Specialist in Plant PathologyDepartment of Crop SciencesN-533B Turner [email protected]
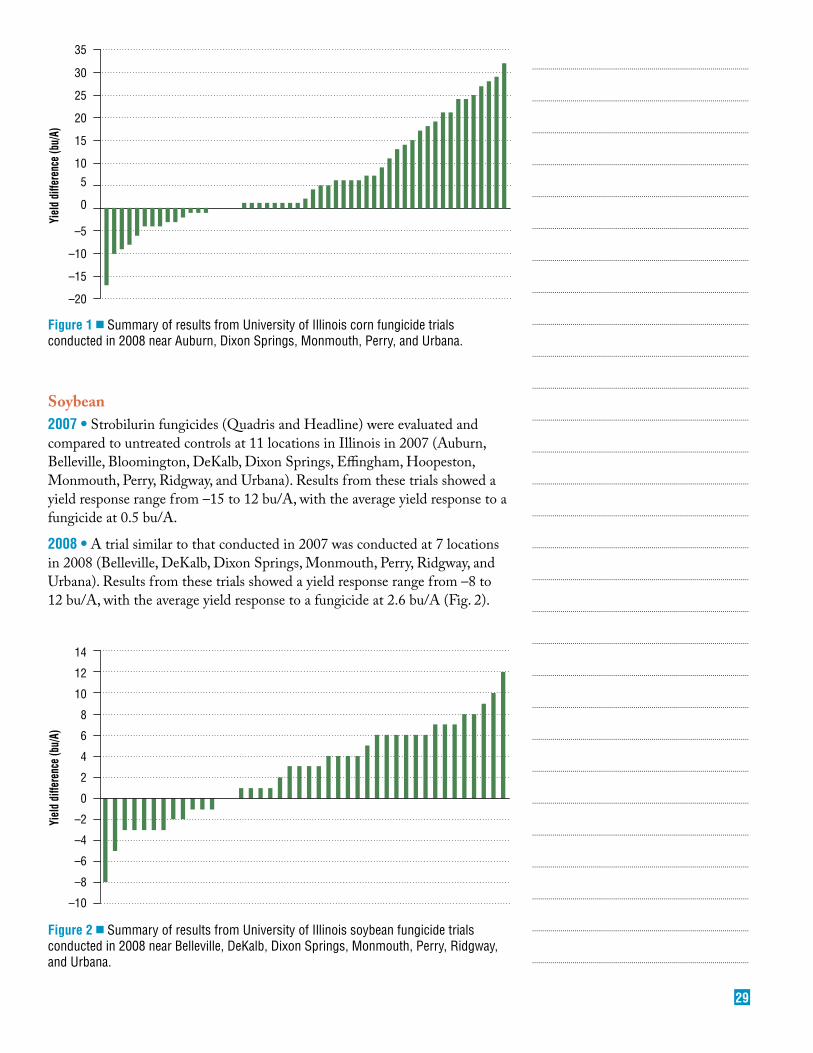
29
Soybean2007 • Strobilurin fungicides (Quadris and Headline) were evaluated and compared to untreated controls at 11 locations in Illinois in 2007 (Auburn, Belleville, Bloomington, DeKalb, Dixon Springs, Effingham, Hoopeston, Monmouth, Perry, Ridgway, and Urbana). Results from these trials showed a yield response range from –15 to 12 bu/A, with the average yield response to a fungicide at 0.5 bu/A.
2008 • A trial similar to that conducted in 2007 was conducted at 7 locations in 2008 (Belleville, DeKalb, Dixon Springs, Monmouth, Perry, Ridgway, and Urbana). Results from these trials showed a yield response range from –8 to 12 bu/A, with the average yield response to a fungicide at 2.6 bu/A (Fig. 2).
...........................................................................................................
...........................................................................................................
...........................................................................................................
...........................................................................................................
...........................................................................................................
...........................................................................................................
...........................................................................................................
...........................................................................................................
...........................................................................................................
...........................................................................................................
...........................................................................................................
...........................................................................................................
...........................................................................................................
...........................................................................................................
...........................................................................................................
...........................................................................................................
...........................................................................................................
...........................................................................................................
...........................................................................................................
...........................................................................................................
...........................................................................................................
...........................................................................................................
...........................................................................................................
...........................................................................................................
...........................................................................................................
...........................................................................................................
...........................................................................................................
...........................................................................................................
...........................................................................................................
figure 1 ■ Summary of results from University of Illinois corn fungicide trials conducted in 2008 near Auburn, Dixon Springs, Monmouth, Perry, and Urbana.
figure 2 ■ Summary of results from University of Illinois soybean fungicide trials conducted in 2008 near Belleville, DeKalb, Dixon Springs, Monmouth, Perry, Ridgway, and Urbana.
35
30
25
20
15
10
5
0
–5
–10
–15
–20
Yiel
d di
ffere
nce
(bu/
A)
–10
–8
–6
–4
–2
0
2
4
6
8
10
12
14
Yiel
d di
ffere
nce
(bu/
A)
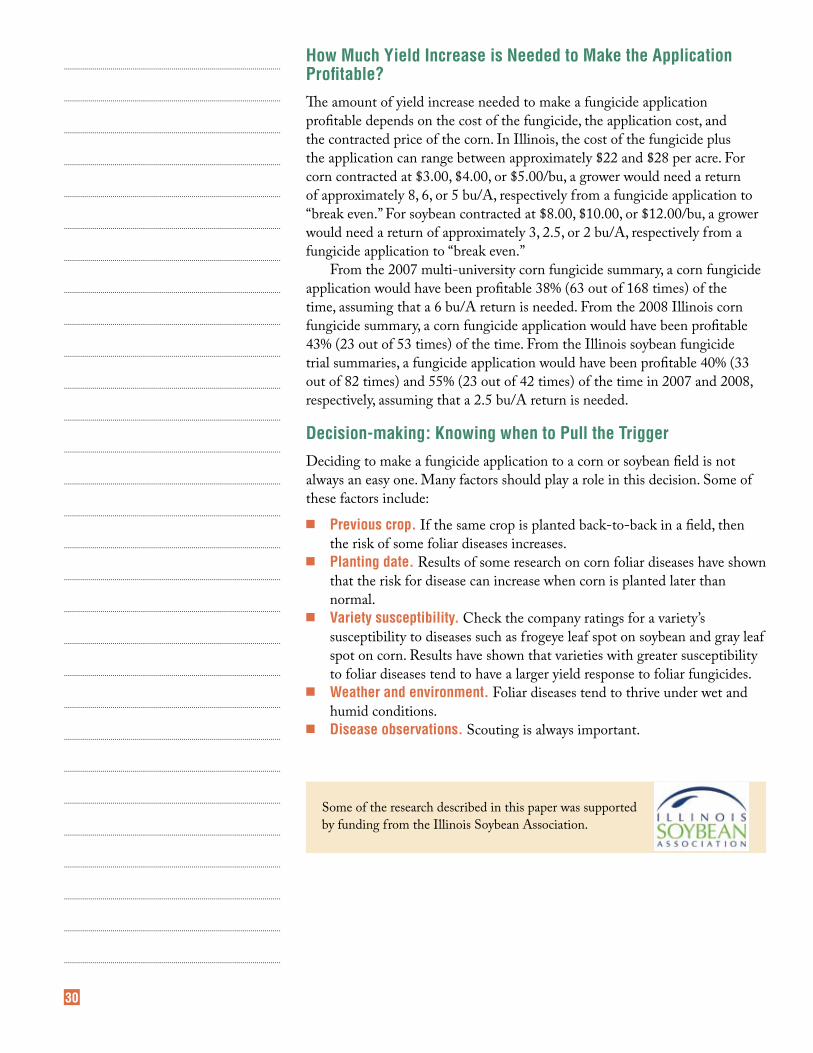
30
how Much yield increase is needed to Make the Application Profitable?The amount of yield increase needed to make a fungicide application profitable depends on the cost of the fungicide, the application cost, and the contracted price of the corn. In Illinois, the cost of the fungicide plus the application can range between approximately $22 and $28 per acre. For corn contracted at $3.00, $4.00, or $5.00/bu, a grower would need a return of approximately 8, 6, or 5 bu/A, respectively from a fungicide application to “break even.” For soybean contracted at $8.00, $10.00, or $12.00/bu, a grower would need a return of approximately 3, 2.5, or 2 bu/A, respectively from a fungicide application to “break even.”
From the 2007 multi-university corn fungicide summary, a corn fungicide application would have been profitable 38% (63 out of 168 times) of the time, assuming that a 6 bu/A return is needed. From the 2008 Illinois corn fungicide summary, a corn fungicide application would have been profitable 43% (23 out of 53 times) of the time. From the Illinois soybean fungicide trial summaries, a fungicide application would have been profitable 40% (33 out of 82 times) and 55% (23 out of 42 times) of the time in 2007 and 2008, respectively, assuming that a 2.5 bu/A return is needed.
Decision-making: Knowing when to Pull the Trigger Deciding to make a fungicide application to a corn or soybean field is not always an easy one. Many factors should play a role in this decision. Some of these factors include:
■ Previous crop. If the same crop is planted back-to-back in a field, then the risk of some foliar diseases increases.
■ Planting date. Results of some research on corn foliar diseases have shown that the risk for disease can increase when corn is planted later than normal.
■ variety susceptibility. Check the company ratings for a variety’s susceptibility to diseases such as frogeye leaf spot on soybean and gray leaf spot on corn. Results have shown that varieties with greater susceptibility to foliar diseases tend to have a larger yield response to foliar fungicides.
■ Weather and environment. Foliar diseases tend to thrive under wet and humid conditions.
■ Disease observations. Scouting is always important.
...........................................................................................................
...........................................................................................................
...........................................................................................................
...........................................................................................................
...........................................................................................................
...........................................................................................................
...........................................................................................................
...........................................................................................................
...........................................................................................................
...........................................................................................................
...........................................................................................................
...........................................................................................................
...........................................................................................................
...........................................................................................................
...........................................................................................................
...........................................................................................................
...........................................................................................................
...........................................................................................................
...........................................................................................................
...........................................................................................................
...........................................................................................................
...........................................................................................................
...........................................................................................................
...........................................................................................................
...........................................................................................................
...........................................................................................................
...........................................................................................................
...........................................................................................................
...........................................................................................................
Some of the research described in this paper was supported by funding from the Illinois Soybean Association.
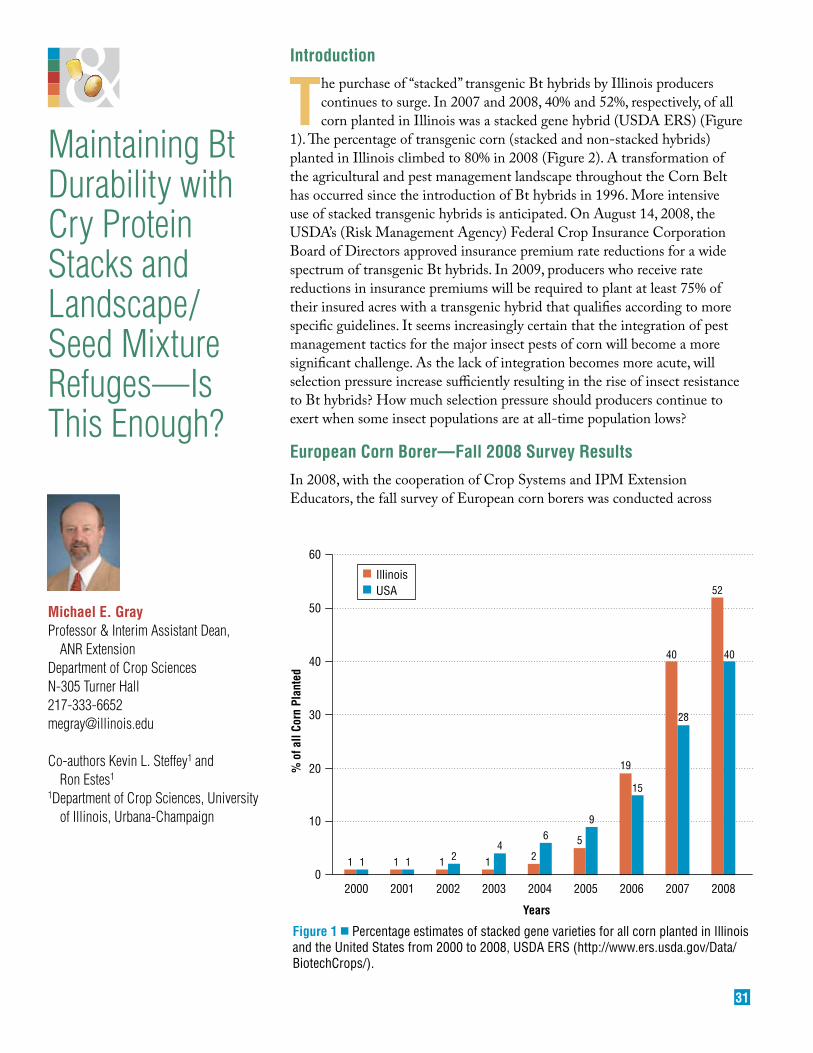
31
7
Maintaining Bt Durability with Cry Protein Stacks and Landscape/Seed Mixture Refuges—Is This Enough?
Michael e. GrayProfessor & Interim Assistant Dean,
ANR ExtensionDepartment of Crop SciencesN-305 Turner [email protected]
Co-authors Kevin L. Steffey1 and Ron Estes1
1Department of Crop Sciences, University of Illinois, Urbana-Champaign
introduction
The purchase of “stacked” transgenic Bt hybrids by Illinois producers continues to surge. In 2007 and 2008, 40% and 52%, respectively, of all corn planted in Illinois was a stacked gene hybrid (USDA ERS) (Figure
1). The percentage of transgenic corn (stacked and non-stacked hybrids) planted in Illinois climbed to 80% in 2008 (Figure 2). A transformation of the agricultural and pest management landscape throughout the Corn Belt has occurred since the introduction of Bt hybrids in 1996. More intensive use of stacked transgenic hybrids is anticipated. On August 14, 2008, the USDA’s (Risk Management Agency) Federal Crop Insurance Corporation Board of Directors approved insurance premium rate reductions for a wide spectrum of transgenic Bt hybrids. In 2009, producers who receive rate reductions in insurance premiums will be required to plant at least 75% of their insured acres with a transgenic hybrid that qualifies according to more specific guidelines. It seems increasingly certain that the integration of pest management tactics for the major insect pests of corn will become a more significant challenge. As the lack of integration becomes more acute, will selection pressure increase sufficiently resulting in the rise of insect resistance to Bt hybrids? How much selection pressure should producers continue to exert when some insect populations are at all-time population lows?
european Corn Borer—fall 2008 survey resultsIn 2008, with the cooperation of Crop Systems and IPM Extension Educators, the fall survey of European corn borers was conducted across
20000
10
20
30
40
50
60
% o
f all
Corn
Pla
nted
Years
IllinoisUSA
2001 2002 2003 2004 2005 2006 2007 2008
1 1 1 1 1 2 14
2
6 5
9
19
15
40
28
52
40
figure 1 ■ Percentage estimates of stacked gene varieties for all corn planted in Illinois and the United States from 2000 to 2008, USDA ERS (http://www.ers.usda.gov/Data/BiotechCrops/).
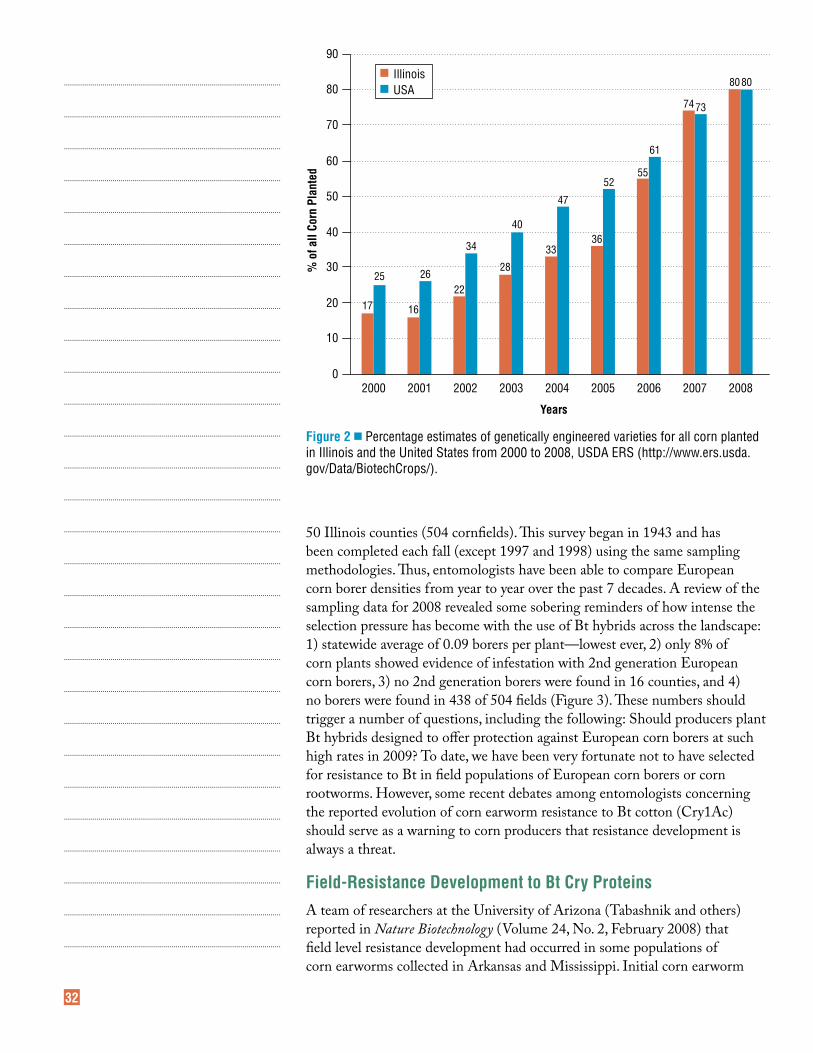
32
...........................................................................................................
...........................................................................................................
...........................................................................................................
...........................................................................................................
...........................................................................................................
...........................................................................................................
...........................................................................................................
...........................................................................................................
...........................................................................................................
...........................................................................................................
...........................................................................................................
...........................................................................................................
...........................................................................................................
...........................................................................................................
...........................................................................................................
...........................................................................................................
...........................................................................................................
...........................................................................................................
...........................................................................................................
...........................................................................................................
...........................................................................................................
...........................................................................................................
...........................................................................................................
...........................................................................................................
...........................................................................................................
...........................................................................................................
...........................................................................................................
...........................................................................................................
50 Illinois counties (504 cornfields). This survey began in 1943 and has been completed each fall (except 1997 and 1998) using the same sampling methodologies. Thus, entomologists have been able to compare European corn borer densities from year to year over the past 7 decades. A review of the sampling data for 2008 revealed some sobering reminders of how intense the selection pressure has become with the use of Bt hybrids across the landscape: 1) statewide average of 0.09 borers per plant—lowest ever, 2) only 8% of corn plants showed evidence of infestation with 2nd generation European corn borers, 3) no 2nd generation borers were found in 16 counties, and 4) no borers were found in 438 of 504 fields (Figure 3). These numbers should trigger a number of questions, including the following: Should producers plant Bt hybrids designed to offer protection against European corn borers at such high rates in 2009? To date, we have been very fortunate not to have selected for resistance to Bt in field populations of European corn borers or corn rootworms. However, some recent debates among entomologists concerning the reported evolution of corn earworm resistance to Bt cotton (Cry1Ac) should serve as a warning to corn producers that resistance development is always a threat.
field-resistance Development to Bt Cry ProteinsA team of researchers at the University of Arizona (Tabashnik and others) reported in Nature Biotechnology (Volume 24, No. 2, February 2008) that field level resistance development had occurred in some populations of corn earworms collected in Arkansas and Mississippi. Initial corn earworm
20000
10
20
30
40
50
90
60
70
80
% o
f all
Corn
Pla
nted
Years
IllinoisUSA
2001 2002 2003 2004 2005 2006 2007 2008
17
25
16
2622
34
28
40
33
47
36
5255
61
7473
8080
figure 2 ■ Percentage estimates of genetically engineered varieties for all corn planted in Illinois and the United States from 2000 to 2008, USDA ERS (http://www.ers.usda.gov/Data/BiotechCrops/).
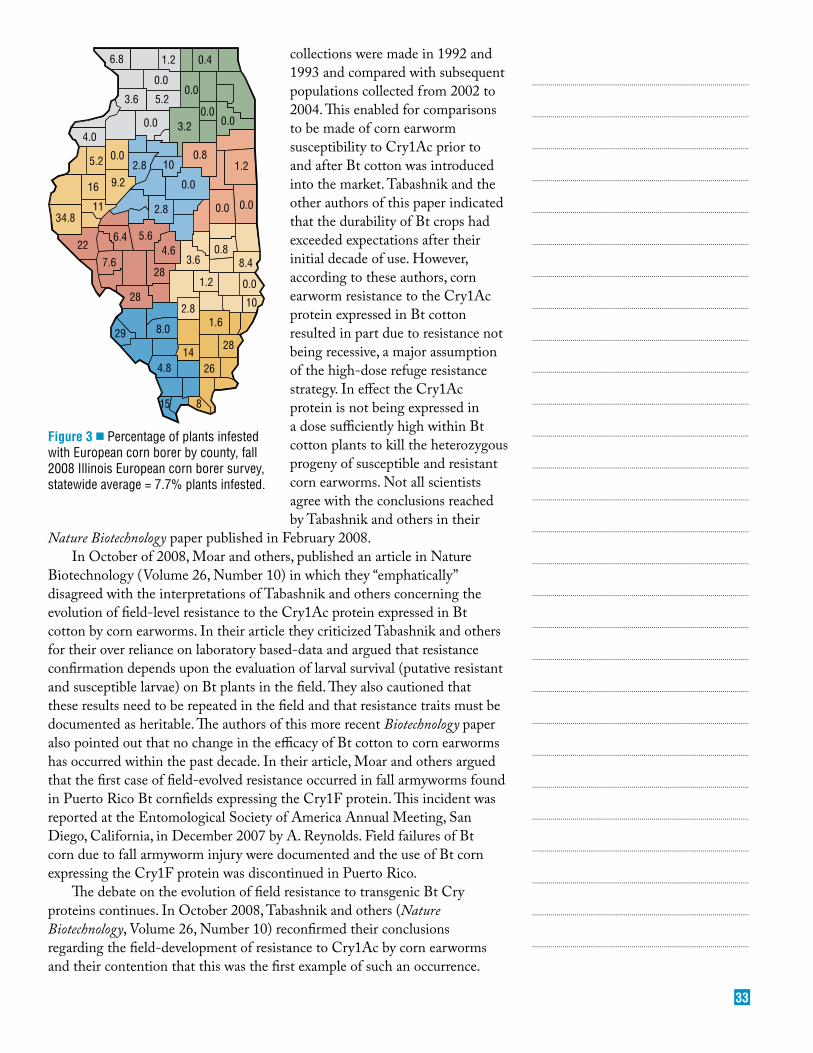
33
Nature Biotechnology paper published in February 2008. In October of 2008, Moar and others, published an article in Nature
Biotechnology (Volume 26, Number 10) in which they “emphatically” disagreed with the interpretations of Tabashnik and others concerning the evolution of field-level resistance to the Cry1Ac protein expressed in Bt cotton by corn earworms. In their article they criticized Tabashnik and others for their over reliance on laboratory based-data and argued that resistance confirmation depends upon the evaluation of larval survival (putative resistant and susceptible larvae) on Bt plants in the field. They also cautioned that these results need to be repeated in the field and that resistance traits must be documented as heritable. The authors of this more recent Biotechnology paper also pointed out that no change in the efficacy of Bt cotton to corn earworms has occurred within the past decade. In their article, Moar and others argued that the first case of field-evolved resistance occurred in fall armyworms found in Puerto Rico Bt cornfields expressing the Cry1F protein. This incident was reported at the Entomological Society of America Annual Meeting, San Diego, California, in December 2007 by A. Reynolds. Field failures of Bt corn due to fall armyworm injury were documented and the use of Bt corn expressing the Cry1F protein was discontinued in Puerto Rico.
The debate on the evolution of field resistance to transgenic Bt Cry proteins continues. In October 2008, Tabashnik and others (Nature Biotechnology, Volume 26, Number 10) reconfirmed their conclusions regarding the field-development of resistance to Cry1Ac by corn earworms and their contention that this was the first example of such an occurrence.
...........................................................................................................
...........................................................................................................
...........................................................................................................
...........................................................................................................
...........................................................................................................
...........................................................................................................
...........................................................................................................
...........................................................................................................
...........................................................................................................
...........................................................................................................
...........................................................................................................
...........................................................................................................
...........................................................................................................
...........................................................................................................
...........................................................................................................
...........................................................................................................
...........................................................................................................
...........................................................................................................
...........................................................................................................
...........................................................................................................
...........................................................................................................
...........................................................................................................
...........................................................................................................
...........................................................................................................
...........................................................................................................
...........................................................................................................
...........................................................................................................
...........................................................................................................
34.8
22
11
6.4
28
2.81.6
9.216
5.2 0.0 0.81.2
0.00.0
0.83.6 8.4
0.0
10
3.2
1.2
28
2614
4.8
15 8
29 8.0
28
4.65.6
7.6
4.0
0.00.0
2.8 10
0.0
2.8
0.0
3.6 5.2
0.00.0
1.2 0.46.8
figure 3 ■ Percentage of plants infested with European corn borer by county, fall 2008 Illinois European corn borer survey, statewide average = 7.7% plants infested.
collections were made in 1992 and 1993 and compared with subsequent populations collected from 2002 to 2004. This enabled for comparisons to be made of corn earworm susceptibility to Cry1Ac prior to and after Bt cotton was introduced into the market. Tabashnik and the other authors of this paper indicated that the durability of Bt crops had exceeded expectations after their initial decade of use. However, according to these authors, corn earworm resistance to the Cry1Ac protein expressed in Bt cotton resulted in part due to resistance not being recessive, a major assumption of the high-dose refuge resistance strategy. In effect the Cry1Ac protein is not being expressed in a dose sufficiently high within Bt cotton plants to kill the heterozygous progeny of susceptible and resistant corn earworms. Not all scientists agree with the conclusions reached by Tabashnik and others in their
34
Gene Pyramiding (stacking): sustaining Bt Durability?As mentioned at the outset of this paper, the conventional integration of pest management tactics has largely been abandoned in the commercial production of corn across much of the U.S. Corn Belt due to the widespread adoption and effectiveness of transgenic Bt hybrids. Have we shifted the basic tenets of integration to now include the use of multiple genes within a single plant? Will the “stacking” or “pyramiding” of these genes, responsible for the expression of Cry proteins, sustain the durability of Bt hybrids well into the future? By increasing the use of Bt hybrids that express multiple Cry proteins within a single plant, can we delay the onset of resistance for corn rootworms and the lepidopteran complex while also reducing the refuge requirement from the current mandate of 20 percent? Producers would welcome a smaller refuge requirement particularly one that is easier to implement and more profitable. However, resistance management considerations have to be thoroughly evaluated as we transition to a new generation of stacked Bt hybrids (Table 1).
Some research to date indicates that pyramiding genes (two or more genes in the same plant) within transgenic plants is much more effective in preventing or delaying resistance to Cry proteins as compared with deployment of transgenic plants (expressing a single transgene) within an agricultural landscape that consists of a mosaic of different Bt hybrids and refuges. Research published in 2003 by Zhao and others in Nature Biotechnology (Volume 21, Number 12) utilized Bt transgenic broccoli plants and the diamondback moth to illustrate some very important resistance management strategies. They conducted a greenhouse experiment with diamondback moths that had resistance genes to Cry1Ac and Cry1C proteins. Following 24 generations of exposure to Bt broccoli, resistance to pyramided plants (two-gene plants) was delayed significantly compared with plants expressing a single Cry protein and arranged in a mosaic pattern. The authors of this paper offered the following remarks regarding resistance management (Biotechnology, 21:12, page 1495): “Our experiments showed that allowing the concurrent release of cultivars with the two Bt genes in separate plants, each with one Bt gene, is not the best way to delay resistance. Even sequential release would result in control failure of at least one cultivar sooner than if pyramided varieties were used.” In 2002, the use of pyramided cotton plants (Bollgard II®) expressing Cry1Ac and Cry2Ab2 was approved in Australia and the United States. These “stacked” cotton plants have proven very effective (due in part to different binding sites of the Cry proteins in the insect midgut) against pink bollworms, including even resistant strains to the Cry1Ac protein. Key to the long term durability of pyramided Bt plants is the absence of cross resistance to Cry proteins that are expressed within transgenic plants.
Cross resistance is a well documented phenomenon for several classes of insecticides enabling resistant insect species to survive when exposed to related compounds. A review of the gene pyramiding and Bt resistance management literature by Manyangarirwa and others (African Journal of Biotechnology, Volume 5, Number 10, pages 781-785, May 2006) indicated that the success of stacked Bt plants in preventing or delaying resistance is based upon three fundamental assumptions:
...........................................................................................................
...........................................................................................................
...........................................................................................................
...........................................................................................................
...........................................................................................................
...........................................................................................................
...........................................................................................................
...........................................................................................................
...........................................................................................................
...........................................................................................................
...........................................................................................................
...........................................................................................................
...........................................................................................................
...........................................................................................................
...........................................................................................................
...........................................................................................................
...........................................................................................................
...........................................................................................................
...........................................................................................................
...........................................................................................................
...........................................................................................................
...........................................................................................................
...........................................................................................................
...........................................................................................................
...........................................................................................................
...........................................................................................................
...........................................................................................................
...........................................................................................................
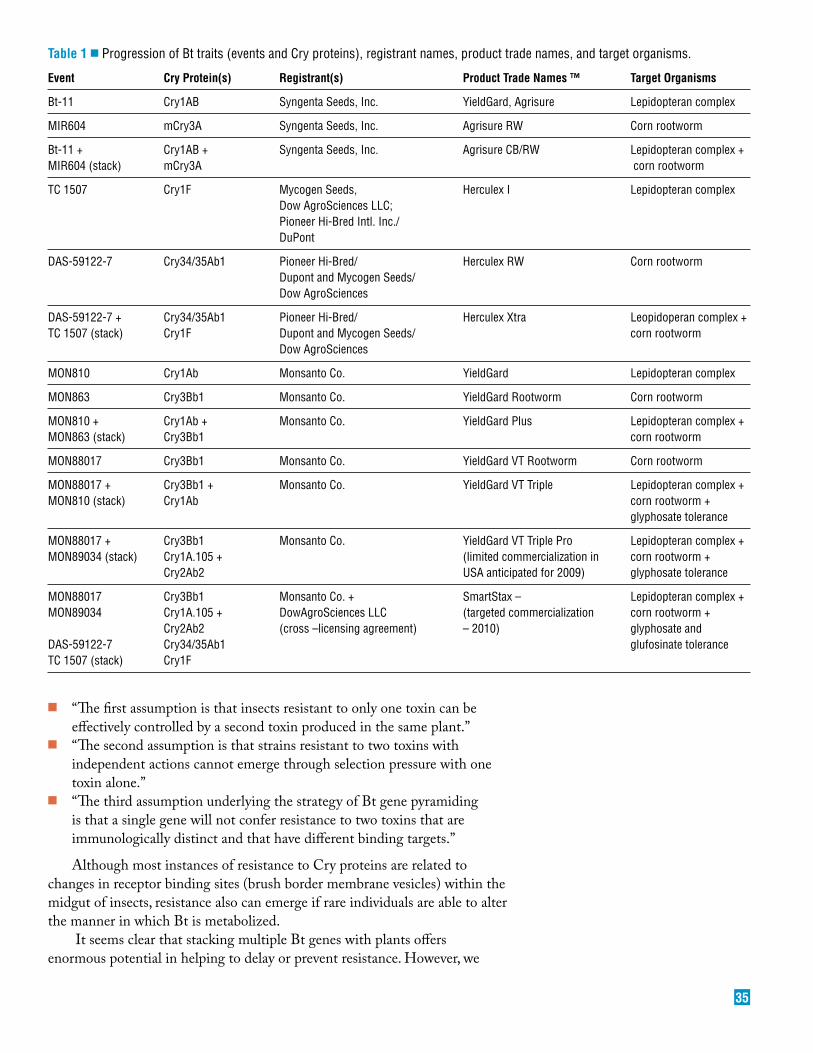
35
Table 1 ■ Progression of Bt traits (events and Cry proteins), registrant names, product trade names, and target organisms.
event Cry Protein(s) registrant(s) Product Trade names ™ Target organisms
Bt-11 Cry1AB Syngenta Seeds, Inc. YieldGard, Agrisure Lepidopteran complex
MIR604 mCry3A Syngenta Seeds, Inc. Agrisure RW Corn rootworm
Bt-11 + Cry1AB + Syngenta Seeds, Inc. Agrisure CB/RW Lepidopteran complex +MIR604 (stack) mCry3A corn rootworm
TC 1507 Cry1F Mycogen Seeds, Herculex I Lepidopteran complex Dow AgroSciences LLC; Pioneer Hi-Bred Intl. Inc./ DuPont
DAS-59122-7 Cry34/35Ab1 Pioneer Hi-Bred/ Herculex RW Corn rootworm Dupont and Mycogen Seeds/ Dow AgroSciences
DAS-59122-7 + Cry34/35Ab1 Pioneer Hi-Bred/ Herculex Xtra Leopidoperan complex +TC 1507 (stack) Cry1F Dupont and Mycogen Seeds/ corn rootworm Dow AgroSciences
MON810 Cry1Ab Monsanto Co. YieldGard Lepidopteran complex
MON863 Cry3Bb1 Monsanto Co. YieldGard Rootworm Corn rootworm
MON810 + Cry1Ab + Monsanto Co. YieldGard Plus Lepidopteran complex + MON863 (stack) Cry3Bb1 corn rootworm
MON88017 Cry3Bb1 Monsanto Co. YieldGard VT Rootworm Corn rootworm
MON88017 + Cry3Bb1 + Monsanto Co. YieldGard VT Triple Lepidopteran complex +MON810 (stack) Cry1Ab corn rootworm + glyphosate tolerance
MON88017 + Cry3Bb1 Monsanto Co. YieldGard VT Triple Pro Lepidopteran complex +MON89034 (stack) Cry1A.105 + (limited commercialization in corn rootworm + Cry2Ab2 USA anticipated for 2009) glyphosate tolerance
MON88017 Cry3Bb1 Monsanto Co. + SmartStax – Lepidopteran complex +MON89034 Cry1A.105 + DowAgroSciences LLC (targeted commercialization corn rootworm + Cry2Ab2 (cross –licensing agreement) – 2010) glyphosate andDAS-59122-7 Cry34/35Ab1 glufosinate toleranceTC 1507 (stack) Cry1F
■ “The first assumption is that insects resistant to only one toxin can be effectively controlled by a second toxin produced in the same plant.”
■ “The second assumption is that strains resistant to two toxins with independent actions cannot emerge through selection pressure with one toxin alone.”
■ “The third assumption underlying the strategy of Bt gene pyramiding is that a single gene will not confer resistance to two toxins that are immunologically distinct and that have different binding targets.”
Although most instances of resistance to Cry proteins are related to changes in receptor binding sites (brush border membrane vesicles) within the midgut of insects, resistance also can emerge if rare individuals are able to alter the manner in which Bt is metabolized.
It seems clear that stacking multiple Bt genes with plants offers enormous potential in helping to delay or prevent resistance. However, we
36
...........................................................................................................
...........................................................................................................
...........................................................................................................
...........................................................................................................
...........................................................................................................
...........................................................................................................
...........................................................................................................
...........................................................................................................
...........................................................................................................
...........................................................................................................
...........................................................................................................
...........................................................................................................
...........................................................................................................
...........................................................................................................
...........................................................................................................
...........................................................................................................
...........................................................................................................
...........................................................................................................
...........................................................................................................
...........................................................................................................
...........................................................................................................
...........................................................................................................
...........................................................................................................
...........................................................................................................
...........................................................................................................
...........................................................................................................
...........................................................................................................
...........................................................................................................
should not assume that we can abandon many other important resistance management tactics such as the use of refuges (albeit reduced in size). Instead, an integration of resistance management tactics (pyramided plants deployed with a mosaic of refuges and plants expressing a diversity of Cry proteins) is warranted along with the implementation of sound IPM strategies (use of scouting and economic thresholds to influence the temporal and spatial use of Bt hybrids).
new industry initiatives In 2010, it is anticipated (pending US EPA approval) that Monsanto Company and Dow AgroSciences LLC via a cross licensing agreement will commercialize SmartStax™ corn hybrids that express simultaneously multiple Cry proteins (Cry3Bb1, Cry1A.105, Cry2Ab2, Cry34/35Ab1, Cry1F) targeted against both the lepidopteran complex and corn rootworms as well as provide herbicide tolerance to two herbicides (glyphosate and glufosinate). This is a significant technological achievement in providing corn growers with an impressive tool for wide-spectrum insect control. In addition, the use of SmartStax hybrids in combination with other resistance management (anticipated 5% refuge requirement) and IPM tactics should significantly delay or prevent the onset of resistance development. On the other hand, the use of these transgenic hybrids in isolation (limited use of refuges due to non-compliance and ignoring IPM) will only increase the selection pressure and the eventual demise of this exciting technology.
Recently, Pioneer Hi-Bred International, Incorporated, announced its desire to bring to the marketplace a new product referred to as Optimum® AcreMax™ 1. This product is designed to offer the corn grower a convenient approach to deploying a refuge for corn rootworms, the so-called “refuge in a bag.” According to a Pioneer Hi-Bred Technical Bulletin (08-1743, 08-2020, page 2): “Pending Environmental Protection Agency (EPA) approval, Optimum AcreMax 1 products would feature a combination of two versions of a hybrid in a single bag. Each bag would contain not more than 98% of a Pioneer® brand hybrid with Herculex XTRA (CRW/CB/LL) insect protection—a combination of the Herculex RW and Herculex I (CB/LL) traits. Each bag also would contain no less than 2% of a hybrid with the Herculex I trait that will satisfy the corn rootworm refuge requirement for the field.” Scientists within Pioneer Hi-Bred maintain that unique antifeedant properties of Herculex RW hybrids justify this refuge-in-a-bag approach to resistance management: “The antifeedant mechanism prevents corn rootworm larvae from developing to larger, more destructive stages. Larvae languish on Herculex RW roots. Ultimately, most die from the many naturally occurring mortality factors that suppress corn rootworm populations in the field. These natural factors—starvation, predators and disease—work in combination with the Herculex RW trait to provide exceptional crop protection. The few that do survive Herculex RW contribute to susceptible beetles produced in the refuge.” While it seems clear that producers would be very supportive of the convenience and increased profitability of using a reduced refuge (2 to 5%) that could be simply poured out of a bag into a planter and planted—we remain skeptical that a refuge reduction of this proposed magnitude is warranted. It appears that one of the key premises of this request to EPA is
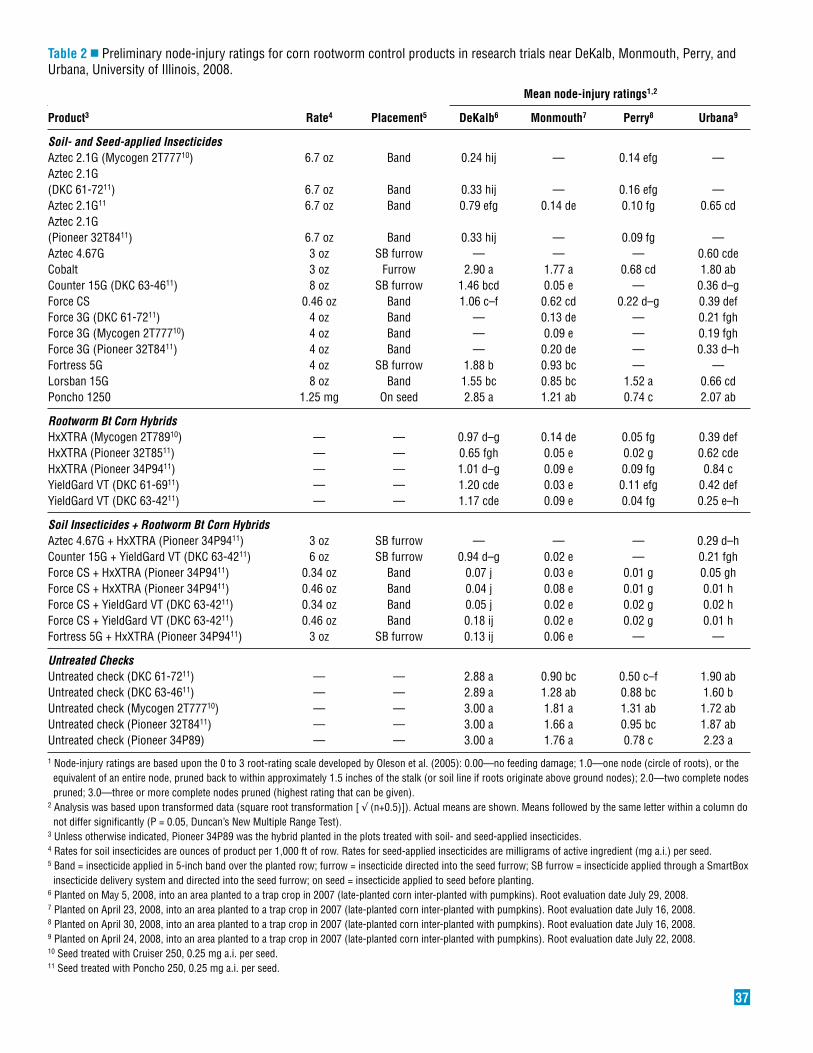
37
Table 2 ■ Preliminary node-injury ratings for corn rootworm control products in research trials near DeKalb, Monmouth, Perry, and Urbana, University of Illinois, 2008.
Mean node-injury ratings1,2
Product3 rate4 Placement5 DeKalb6 Monmouth7 Perry8 Urbana9
Soil- and Seed-applied InsecticidesAztec 2.1G (Mycogen 2T77710) 6.7 oz Band 0.24 hij — 0.14 efg —Aztec 2.1G(DKC 61-7211) 6.7 oz Band 0.33 hij — 0.16 efg —Aztec 2.1G11 6.7 oz Band 0.79 efg 0.14 de 0.10 fg 0.65 cdAztec 2.1G(Pioneer 32T8411) 6.7 oz Band 0.33 hij — 0.09 fg —Aztec 4.67G 3 oz SB furrow — — — 0.60 cdeCobalt 3 oz Furrow 2.90 a 1.77 a 0.68 cd 1.80 abCounter 15G (DKC 63-4611) 8 oz SB furrow 1.46 bcd 0.05 e — 0.36 d–gForce CS 0.46 oz Band 1.06 c–f 0.62 cd 0.22 d–g 0.39 defForce 3G (DKC 61-7211) 4 oz Band — 0.13 de — 0.21 fghForce 3G (Mycogen 2T77710) 4 oz Band — 0.09 e — 0.19 fghForce 3G (Pioneer 32T8411) 4 oz Band — 0.20 de — 0.33 d–hFortress 5G 4 oz SB furrow 1.88 b 0.93 bc — —Lorsban 15G 8 oz Band 1.55 bc 0.85 bc 1.52 a 0.66 cdPoncho 1250 1.25 mg On seed 2.85 a 1.21 ab 0.74 c 2.07 ab
Rootworm Bt Corn HybridsHxXTRA (Mycogen 2T78910) — — 0.97 d–g 0.14 de 0.05 fg 0.39 defHxXTRA (Pioneer 32T8511) — — 0.65 fgh 0.05 e 0.02 g 0.62 cdeHxXTRA (Pioneer 34P9411) — — 1.01 d–g 0.09 e 0.09 fg 0.84 cYieldGard VT (DKC 61-6911) — — 1.20 cde 0.03 e 0.11 efg 0.42 defYieldGard VT (DKC 63-4211) — — 1.17 cde 0.09 e 0.04 fg 0.25 e–h
Soil Insecticides + Rootworm Bt Corn HybridsAztec 4.67G + HxXTRA (Pioneer 34P9411) 3 oz SB furrow — — — 0.29 d–hCounter 15G + YieldGard VT (DKC 63-4211) 6 oz SB furrow 0.94 d–g 0.02 e — 0.21 fghForce CS + HxXTRA (Pioneer 34P9411) 0.34 oz Band 0.07 j 0.03 e 0.01 g 0.05 ghForce CS + HxXTRA (Pioneer 34P9411) 0.46 oz Band 0.04 j 0.08 e 0.01 g 0.01 hForce CS + YieldGard VT (DKC 63-4211) 0.34 oz Band 0.05 j 0.02 e 0.02 g 0.02 hForce CS + YieldGard VT (DKC 63-4211) 0.46 oz Band 0.18 ij 0.02 e 0.02 g 0.01 hFortress 5G + HxXTRA (Pioneer 34P9411) 3 oz SB furrow 0.13 ij 0.06 e — —
Untreated ChecksUntreated check (DKC 61-7211) — — 2.88 a 0.90 bc 0.50 c–f 1.90 abUntreated check (DKC 63-4611) — — 2.89 a 1.28 ab 0.88 bc 1.60 bUntreated check (Mycogen 2T77710) — — 3.00 a 1.81 a 1.31 ab 1.72 abUntreated check (Pioneer 32T8411) — — 3.00 a 1.66 a 0.95 bc 1.87 abUntreated check (Pioneer 34P89) — — 3.00 a 1.76 a 0.78 c 2.23 a
1 Node-injury ratings are based upon the 0 to 3 root-rating scale developed by Oleson et al. (2005): 0.00—no feeding damage; 1.0—one node (circle of roots), or the equivalent of an entire node, pruned back to within approximately 1.5 inches of the stalk (or soil line if roots originate above ground nodes); 2.0—two complete nodes pruned; 3.0—three or more complete nodes pruned (highest rating that can be given).
2 Analysis was based upon transformed data (square root transformation [ √ (n+0.5)]). Actual means are shown. Means followed by the same letter within a column do not differ significantly (P = 0.05, Duncan’s New Multiple Range Test).
3 Unless otherwise indicated, Pioneer 34P89 was the hybrid planted in the plots treated with soil- and seed-applied insecticides.4 Rates for soil insecticides are ounces of product per 1,000 ft of row. Rates for seed-applied insecticides are milligrams of active ingredient (mg a.i.) per seed.5 Band = insecticide applied in 5-inch band over the planted row; furrow = insecticide directed into the seed furrow; SB furrow = insecticide applied through a SmartBox insecticide delivery system and directed into the seed furrow; on seed = insecticide applied to seed before planting.
6 Planted on May 5, 2008, into an area planted to a trap crop in 2007 (late-planted corn inter-planted with pumpkins). Root evaluation date July 29, 2008.7 Planted on April 23, 2008, into an area planted to a trap crop in 2007 (late-planted corn inter-planted with pumpkins). Root evaluation date July 16, 2008.8 Planted on April 30, 2008, into an area planted to a trap crop in 2007 (late-planted corn inter-planted with pumpkins). Root evaluation date July 16, 2008.9 Planted on April 24, 2008, into an area planted to a trap crop in 2007 (late-planted corn inter-planted with pumpkins). Root evaluation date July 22, 2008.10 Seed treated with Cruiser 250, 0.25 mg a.i. per seed.11 Seed treated with Poncho 250, 0.25 mg a.i. per seed.
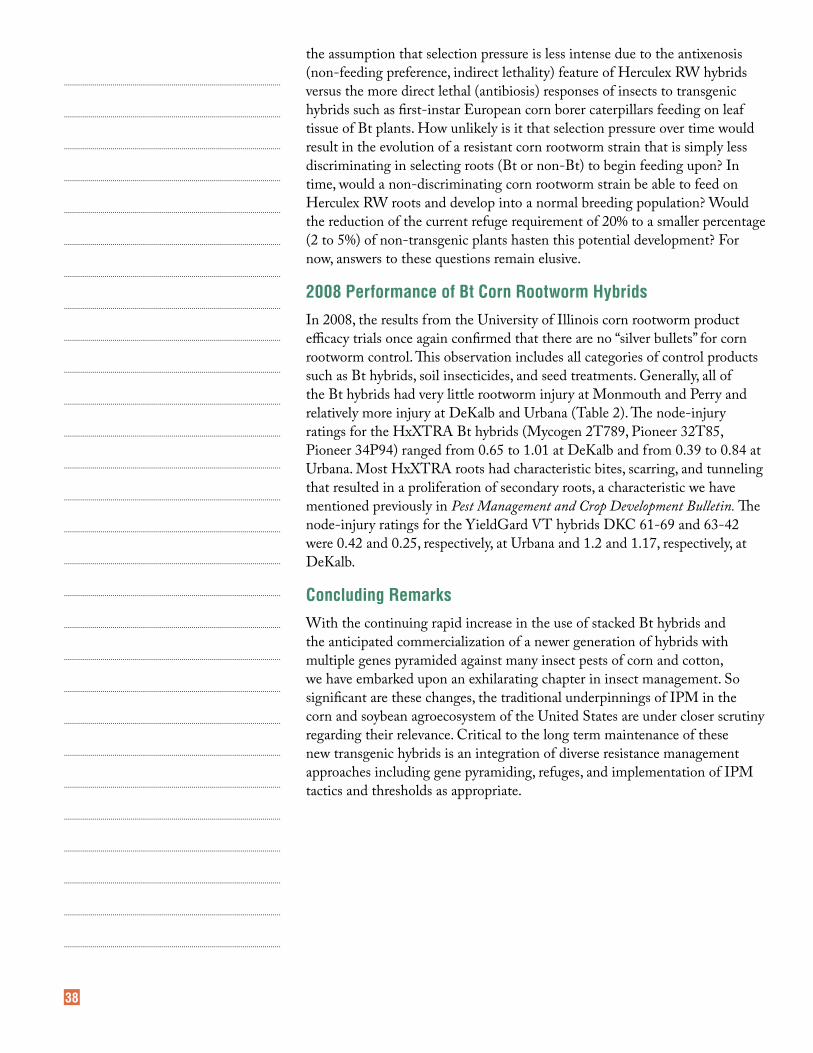
38
the assumption that selection pressure is less intense due to the antixenosis (non-feeding preference, indirect lethality) feature of Herculex RW hybrids versus the more direct lethal (antibiosis) responses of insects to transgenic hybrids such as first-instar European corn borer caterpillars feeding on leaf tissue of Bt plants. How unlikely is it that selection pressure over time would result in the evolution of a resistant corn rootworm strain that is simply less discriminating in selecting roots (Bt or non-Bt) to begin feeding upon? In time, would a non-discriminating corn rootworm strain be able to feed on Herculex RW roots and develop into a normal breeding population? Would the reduction of the current refuge requirement of 20% to a smaller percentage (2 to 5%) of non-transgenic plants hasten this potential development? For now, answers to these questions remain elusive.
2008 Performance of Bt Corn rootworm hybridsIn 2008, the results from the University of Illinois corn rootworm product efficacy trials once again confirmed that there are no “silver bullets” for corn rootworm control. This observation includes all categories of control products such as Bt hybrids, soil insecticides, and seed treatments. Generally, all of the Bt hybrids had very little rootworm injury at Monmouth and Perry and relatively more injury at DeKalb and Urbana (Table 2). The node-injury ratings for the HxXTRA Bt hybrids (Mycogen 2T789, Pioneer 32T85, Pioneer 34P94) ranged from 0.65 to 1.01 at DeKalb and from 0.39 to 0.84 at Urbana. Most HxXTRA roots had characteristic bites, scarring, and tunneling that resulted in a proliferation of secondary roots, a characteristic we have mentioned previously in Pest Management and Crop Development Bulletin. The node-injury ratings for the YieldGard VT hybrids DKC 61-69 and 63-42 were 0.42 and 0.25, respectively, at Urbana and 1.2 and 1.17, respectively, at DeKalb.
Concluding remarksWith the continuing rapid increase in the use of stacked Bt hybrids and the anticipated commercialization of a newer generation of hybrids with multiple genes pyramided against many insect pests of corn and cotton, we have embarked upon an exhilarating chapter in insect management. So significant are these changes, the traditional underpinnings of IPM in the corn and soybean agroecosystem of the United States are under closer scrutiny regarding their relevance. Critical to the long term maintenance of these new transgenic hybrids is an integration of diverse resistance management approaches including gene pyramiding, refuges, and implementation of IPM tactics and thresholds as appropriate.
...........................................................................................................
...........................................................................................................
...........................................................................................................
...........................................................................................................
...........................................................................................................
...........................................................................................................
...........................................................................................................
...........................................................................................................
...........................................................................................................
...........................................................................................................
...........................................................................................................
...........................................................................................................
...........................................................................................................
...........................................................................................................
...........................................................................................................
...........................................................................................................
...........................................................................................................
...........................................................................................................
...........................................................................................................
...........................................................................................................
...........................................................................................................
...........................................................................................................
...........................................................................................................
...........................................................................................................
...........................................................................................................
...........................................................................................................
...........................................................................................................
...........................................................................................................
39
Aaron G. hagerAssistant Professor and Extension
Specialist in Weed ScienceDepartment of Crop SciencesN-321 Turner [email protected]
8
Turn Out the Lights—The Party’s Over
The utility of glyphosate for postemergence weed control in glyphosate-resistant crops has contributed to an unparalleled level of technology adoption. This technology has, in many respects, “simplified” weed
control for soybean farmers. A single active ingredient (glyphosate), with application rate flexibility easily adjusted according to weed spectrum and size, controls most broadleaf and grass weed species without the need for tank-mix partners or changes in spray additive selection. This broad-spectrum weed control has resulted in glyphosate’s use as a “stand-alone” postemergence soybean herbicide to be much more common than its application in tank-mix combinations with other postemergence herbicides. While still relatively “early in the game” with respect to adoption of glyphosate-resistant corn hybrids in Illinois, observations to date suggest a similar use pattern in corn (i.e., glyphosate utilized as the sole postemergence herbicide) is developing.
Several motifs are common in weed science. Some motifs are intuitive and easily observed each season, such as the annual presence of weeds in the vast majority of Illinois crop acres. Other motifs, however, recur over much longer periods of time, such as the ability of weed species to adapt to widespread production practices. The time it takes for weed adaptations to occur depends on myriad factors. For example, many years elapsed following the introduction of atrazine before fall panicum become a significant, problematic grass weed species in corn, but only three to five years elapsed following the introduction of ALS-inhibiting herbicides before the first ALS-resistant weed biotype was reported. Prior experience also has demonstrated that weed adaptations occur faster in management systems that rely on a single or limited number of practices.
As biological systems (i.e., weeds) change in response to the widespread use of glyphosate, weed control practices utilizing glyphosate will undergo a concomitant change. The rapid adoption of glyphosate-resistant corn hybrids and weed spectrum changes in response to the near-ubiquitous use of glyphosate in soybean suggests the following thesis: the ability of glyphosate to be a stand-alone herbicide for weed management in soybean will (continue to) decline. In other words, the “simplicity” of glyphosate as a stand-alone weed management tool soon will be relegated to the annals of history. Soil-residual herbicides and glyphosate tank-mix partners increasingly will be needed to manage both current challenges and those lurking beyond the horizon.
Extension weed scientists often have discussed the merits of including soil-residual herbicides in glyphosate-resistant cropping systems, but less frequently have discussed the advantages and disadvantages of including tank-mix partners with glyphosate. Are there instances when glyphosate tank-mixes might improve overall weed control? Are there instances when tank-mixes may not be advisable? The answer to both questions is “yes.”
Advantageous Tank-Mixes Glyphosate-resistant volunteer corn. Volunteer corn is easily controlled with glyphosate—unless it carries the glyphosate-resistance trait. The number of acres planted with glyphosate-resistant corn hybrids in Illinois has been steadily increasing and will likely continue to increase into the foreseeable future. Thus, soybean farmers will need to rely on an alternative herbicide to control volunteer glyphosate-resistant corn. This can be accomplished through
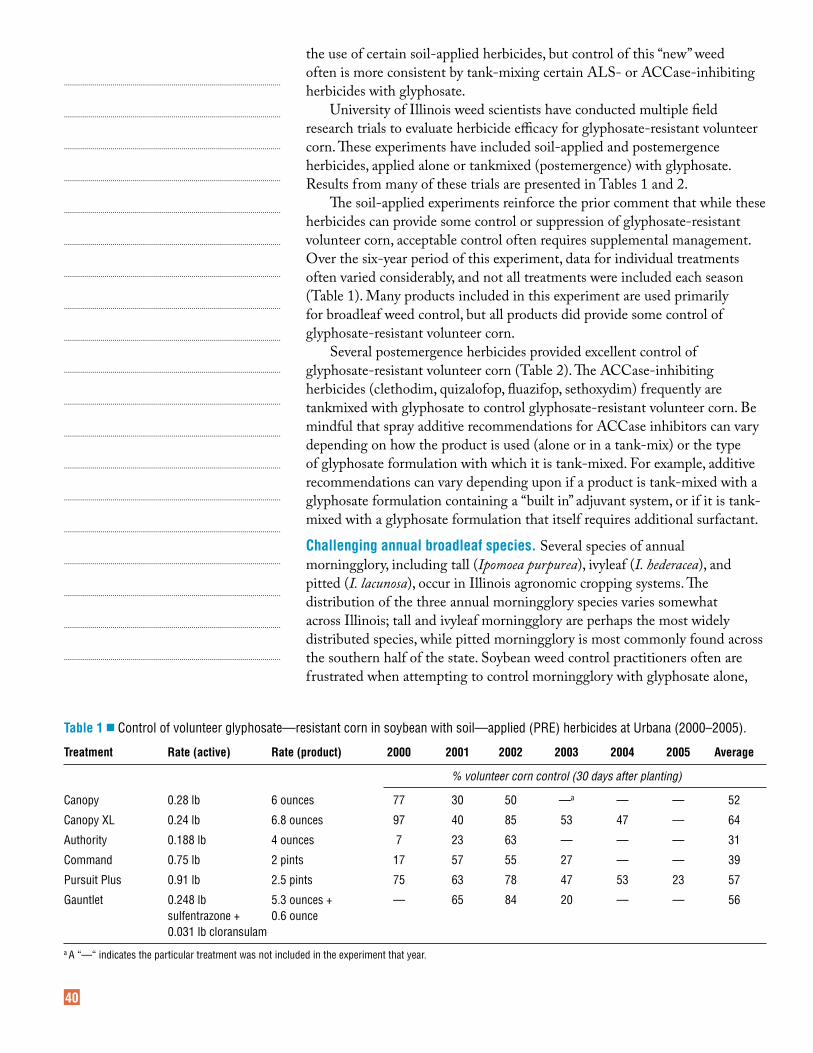
40
the use of certain soil-applied herbicides, but control of this “new” weed often is more consistent by tank-mixing certain ALS- or ACCase-inhibiting herbicides with glyphosate.
University of Illinois weed scientists have conducted multiple field research trials to evaluate herbicide efficacy for glyphosate-resistant volunteer corn. These experiments have included soil-applied and postemergence herbicides, applied alone or tankmixed (postemergence) with glyphosate. Results from many of these trials are presented in Tables 1 and 2.
The soil-applied experiments reinforce the prior comment that while these herbicides can provide some control or suppression of glyphosate-resistant volunteer corn, acceptable control often requires supplemental management. Over the six-year period of this experiment, data for individual treatments often varied considerably, and not all treatments were included each season (Table 1). Many products included in this experiment are used primarily for broadleaf weed control, but all products did provide some control of glyphosate-resistant volunteer corn.
Several postemergence herbicides provided excellent control of glyphosate-resistant volunteer corn (Table 2). The ACCase-inhibiting herbicides (clethodim, quizalofop, fluazifop, sethoxydim) frequently are tankmixed with glyphosate to control glyphosate-resistant volunteer corn. Be mindful that spray additive recommendations for ACCase inhibitors can vary depending on how the product is used (alone or in a tank-mix) or the type of glyphosate formulation with which it is tank-mixed. For example, additive recommendations can vary depending upon if a product is tank-mixed with a glyphosate formulation containing a “built in” adjuvant system, or if it is tank-mixed with a glyphosate formulation that itself requires additional surfactant.
Challenging annual broadleaf species. Several species of annual morningglory, including tall (Ipomoea purpurea), ivyleaf (I. hederacea), and pitted (I. lacunosa), occur in Illinois agronomic cropping systems. The distribution of the three annual morningglory species varies somewhat across Illinois; tall and ivyleaf morningglory are perhaps the most widely distributed species, while pitted morningglory is most commonly found across the southern half of the state. Soybean weed control practitioners often are frustrated when attempting to control morningglory with glyphosate alone,
...........................................................................................................
...........................................................................................................
...........................................................................................................
...........................................................................................................
...........................................................................................................
...........................................................................................................
...........................................................................................................
...........................................................................................................
...........................................................................................................
...........................................................................................................
...........................................................................................................
...........................................................................................................
...........................................................................................................
...........................................................................................................
...........................................................................................................
...........................................................................................................
...........................................................................................................
...........................................................................................................
...........................................................................................................
Table 1 ■ Control of volunteer glyphosate—resistant corn in soybean with soil—applied (PRE) herbicides at Urbana (2000–2005).
Treatment rate (active) rate (product) 2000 2001 2002 2003 2004 2005 Average
% volunteer corn control (30 days after planting)
Canopy 0.28 lb 6 ounces 77 30 50 —a — — 52
Canopy XL 0.24 lb 6.8 ounces 97 40 85 53 47 — 64
Authority 0.188 lb 4 ounces 7 23 63 — — — 31
Command 0.75 lb 2 pints 17 57 55 27 — — 39
Pursuit Plus 0.91 lb 2.5 pints 75 63 78 47 53 23 57
Gauntlet 0.248 lb 5.3 ounces + — 65 84 20 — — 56 sulfentrazone + 0.6 ounce 0.031 lb cloransulam
a A “—“ indicates the particular treatment was not included in the experiment that year.
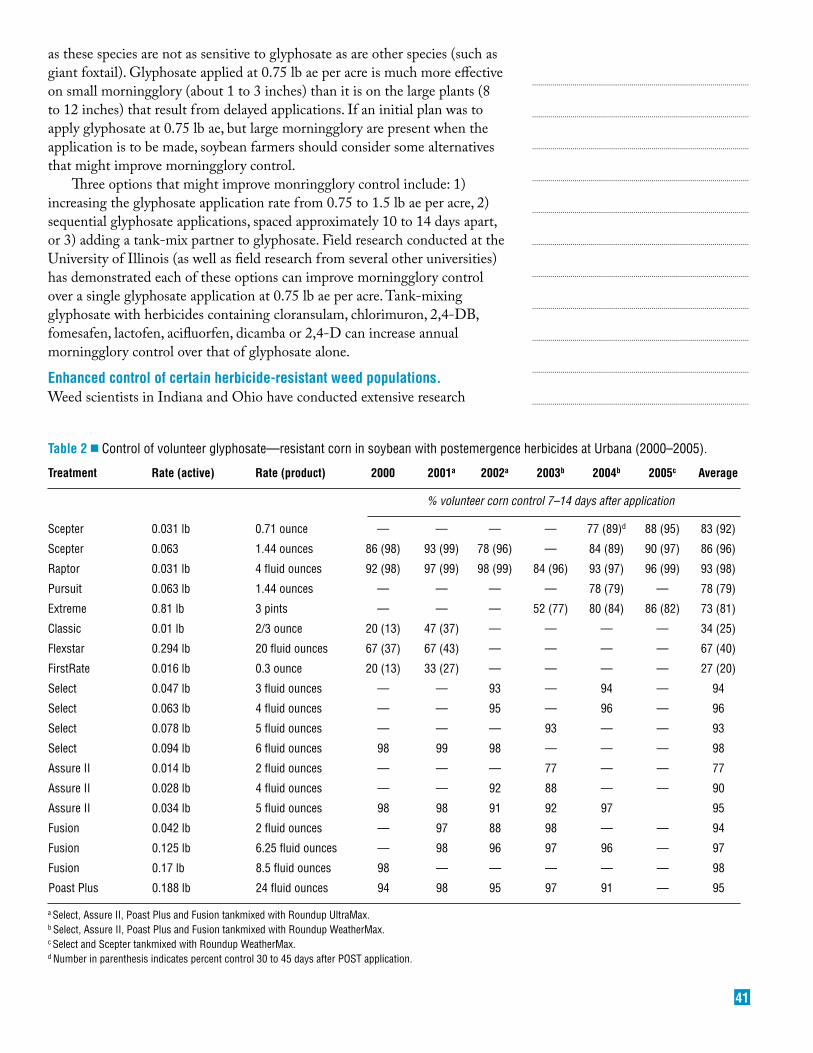
41
as these species are not as sensitive to glyphosate as are other species (such as giant foxtail). Glyphosate applied at 0.75 lb ae per acre is much more effective on small morningglory (about 1 to 3 inches) than it is on the large plants (8 to 12 inches) that result from delayed applications. If an initial plan was to apply glyphosate at 0.75 lb ae, but large morningglory are present when the application is to be made, soybean farmers should consider some alternatives that might improve morningglory control.
Three options that might improve monringglory control include: 1) increasing the glyphosate application rate from 0.75 to 1.5 lb ae per acre, 2) sequential glyphosate applications, spaced approximately 10 to 14 days apart, or 3) adding a tank-mix partner to glyphosate. Field research conducted at the University of Illinois (as well as field research from several other universities) has demonstrated each of these options can improve morningglory control over a single glyphosate application at 0.75 lb ae per acre. Tank-mixing glyphosate with herbicides containing cloransulam, chlorimuron, 2,4-DB, fomesafen, lactofen, acifluorfen, dicamba or 2,4-D can increase annual morningglory control over that of glyphosate alone.
enhanced control of certain herbicide-resistant weed populations. Weed scientists in Indiana and Ohio have conducted extensive research
...........................................................................................................
...........................................................................................................
...........................................................................................................
...........................................................................................................
...........................................................................................................
...........................................................................................................
...........................................................................................................
...........................................................................................................
...........................................................................................................
...........................................................................................................
...........................................................................................................
Table 2 ■ Control of volunteer glyphosate—resistant corn in soybean with postemergence herbicides at Urbana (2000–2005).
Treatment rate (active) rate (product) 2000 2001a 2002a 2003b 2004b 2005c Average
% volunteer corn control 7–14 days after application
Scepter 0.031 lb 0.71 ounce — — — — 77 (89)d 88 (95) 83 (92)
Scepter 0.063 1.44 ounces 86 (98) 93 (99) 78 (96) — 84 (89) 90 (97) 86 (96)
Raptor 0.031 lb 4 fluid ounces 92 (98) 97 (99) 98 (99) 84 (96) 93 (97) 96 (99) 93 (98)
Pursuit 0.063 lb 1.44 ounces — — — — 78 (79) — 78 (79)
Extreme 0.81 lb 3 pints — — — 52 (77) 80 (84) 86 (82) 73 (81)
Classic 0.01 lb 2/3 ounce 20 (13) 47 (37) — — — — 34 (25)
Flexstar 0.294 lb 20 fluid ounces 67 (37) 67 (43) — — — — 67 (40)
FirstRate 0.016 lb 0.3 ounce 20 (13) 33 (27) — — — — 27 (20)
Select 0.047 lb 3 fluid ounces — — 93 — 94 — 94
Select 0.063 lb 4 fluid ounces — — 95 — 96 — 96
Select 0.078 lb 5 fluid ounces — — — 93 — — 93
Select 0.094 lb 6 fluid ounces 98 99 98 — — — 98
Assure II 0.014 lb 2 fluid ounces — — — 77 — — 77
Assure II 0.028 lb 4 fluid ounces — — 92 88 — — 90
Assure II 0.034 lb 5 fluid ounces 98 98 91 92 97 95
Fusion 0.042 lb 2 fluid ounces — 97 88 98 — — 94
Fusion 0.125 lb 6.25 fluid ounces — 98 96 97 96 — 97
Fusion 0.17 lb 8.5 fluid ounces 98 — — — — — 98
Poast Plus 0.188 lb 24 fluid ounces 94 98 95 97 91 — 95
a Select, Assure II, Poast Plus and Fusion tankmixed with Roundup UltraMax.b Select, Assure II, Poast Plus and Fusion tankmixed with Roundup WeatherMax.c Select and Scepter tankmixed with Roundup WeatherMax.d Number in parenthesis indicates percent control 30 to 45 days after POST application.
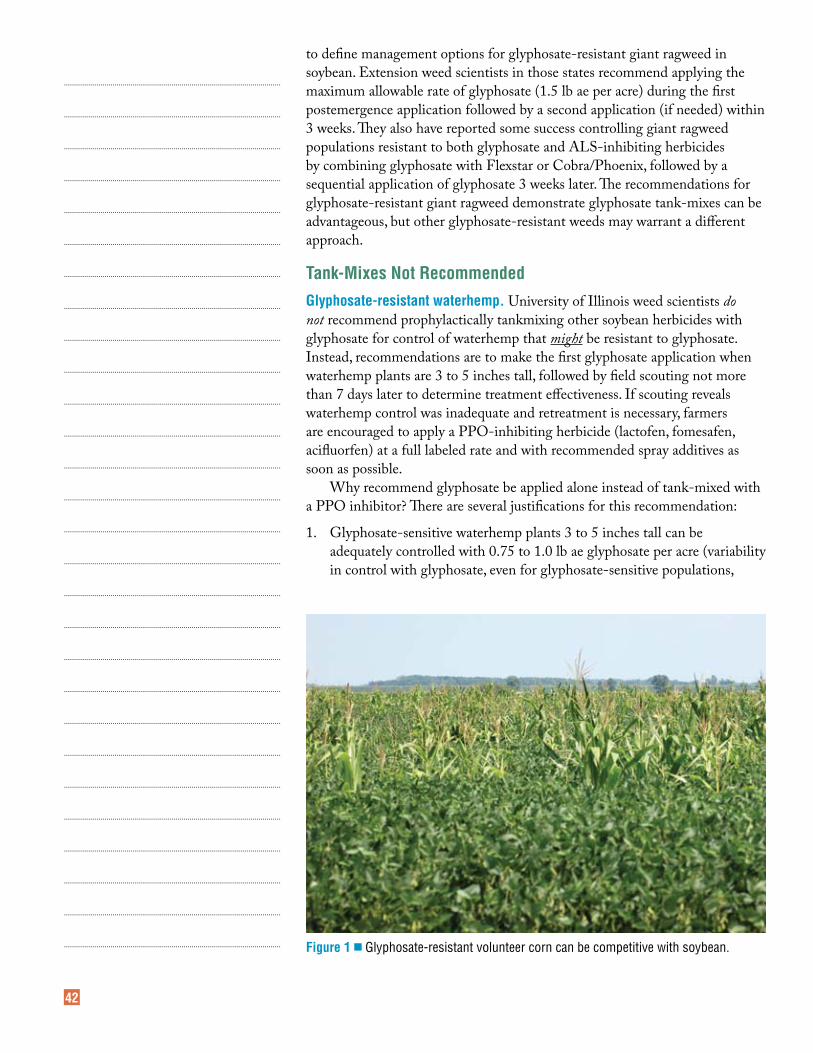
42
to define management options for glyphosate-resistant giant ragweed in soybean. Extension weed scientists in those states recommend applying the maximum allowable rate of glyphosate (1.5 lb ae per acre) during the first postemergence application followed by a second application (if needed) within 3 weeks. They also have reported some success controlling giant ragweed populations resistant to both glyphosate and ALS-inhibiting herbicides by combining glyphosate with Flexstar or Cobra/Phoenix, followed by a sequential application of glyphosate 3 weeks later. The recommendations for glyphosate-resistant giant ragweed demonstrate glyphosate tank-mixes can be advantageous, but other glyphosate-resistant weeds may warrant a different approach.
Tank-Mixes not recommended Glyphosate-resistant waterhemp. University of Illinois weed scientists do not recommend prophylactically tankmixing other soybean herbicides with glyphosate for control of waterhemp that might be resistant to glyphosate. Instead, recommendations are to make the first glyphosate application when waterhemp plants are 3 to 5 inches tall, followed by field scouting not more than 7 days later to determine treatment effectiveness. If scouting reveals waterhemp control was inadequate and retreatment is necessary, farmers are encouraged to apply a PPO-inhibiting herbicide (lactofen, fomesafen, acifluorfen) at a full labeled rate and with recommended spray additives as soon as possible.
Why recommend glyphosate be applied alone instead of tank-mixed with a PPO inhibitor? There are several justifications for this recommendation:
1. Glyphosate-sensitive waterhemp plants 3 to 5 inches tall can be adequately controlled with 0.75 to 1.0 lb ae glyphosate per acre (variability in control with glyphosate, even for glyphosate-sensitive populations,
figure 1 ■ Glyphosate-resistant volunteer corn can be competitive with soybean.
...........................................................................................................
...........................................................................................................
...........................................................................................................
...........................................................................................................
...........................................................................................................
...........................................................................................................
...........................................................................................................
...........................................................................................................
...........................................................................................................
...........................................................................................................
...........................................................................................................
...........................................................................................................
...........................................................................................................
...........................................................................................................
...........................................................................................................
...........................................................................................................
...........................................................................................................
...........................................................................................................
...........................................................................................................
...........................................................................................................
...........................................................................................................
...........................................................................................................
...........................................................................................................
...........................................................................................................
...........................................................................................................
...........................................................................................................
...........................................................................................................
...........................................................................................................
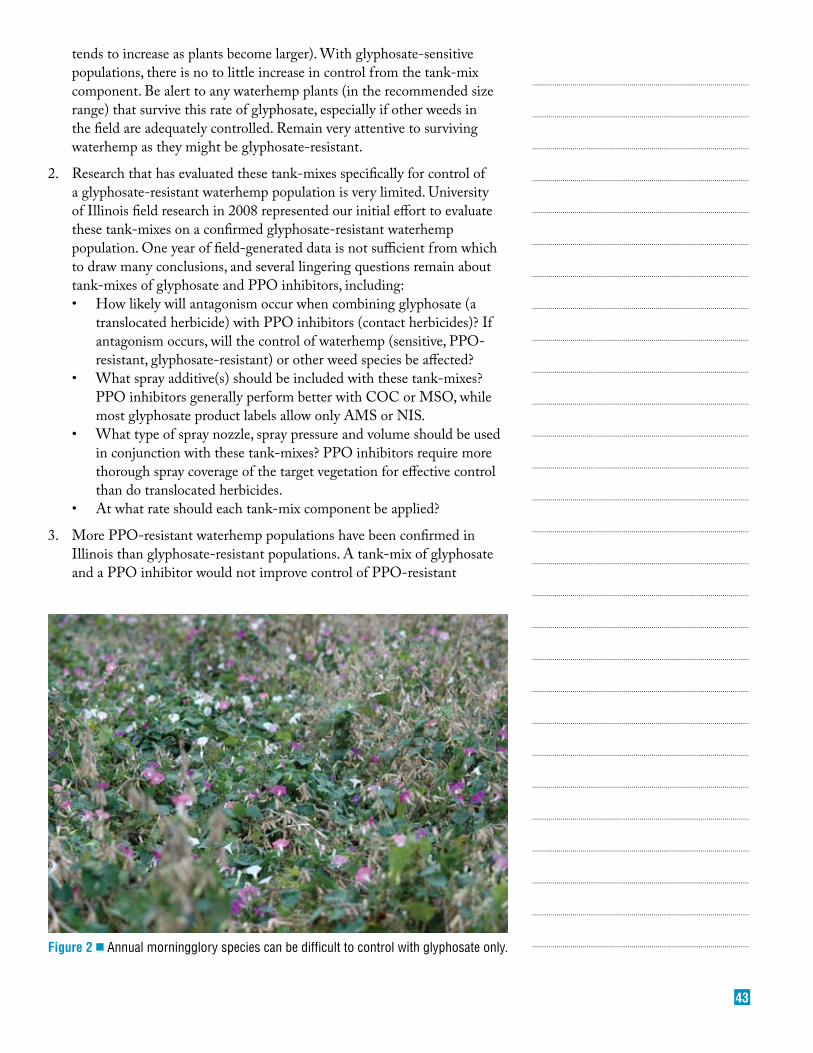
43
figure 2 ■ Annual morningglory species can be difficult to control with glyphosate only.
...........................................................................................................
...........................................................................................................
...........................................................................................................
...........................................................................................................
...........................................................................................................
...........................................................................................................
...........................................................................................................
...........................................................................................................
...........................................................................................................
...........................................................................................................
...........................................................................................................
...........................................................................................................
...........................................................................................................
...........................................................................................................
...........................................................................................................
...........................................................................................................
...........................................................................................................
...........................................................................................................
...........................................................................................................
...........................................................................................................
...........................................................................................................
...........................................................................................................
...........................................................................................................
...........................................................................................................
...........................................................................................................
...........................................................................................................
...........................................................................................................
...........................................................................................................
tends to increase as plants become larger). With glyphosate-sensitive populations, there is no to little increase in control from the tank-mix component. Be alert to any waterhemp plants (in the recommended size range) that survive this rate of glyphosate, especially if other weeds in the field are adequately controlled. Remain very attentive to surviving waterhemp as they might be glyphosate-resistant.
2. Research that has evaluated these tank-mixes specifically for control of a glyphosate-resistant waterhemp population is very limited. University of Illinois field research in 2008 represented our initial effort to evaluate these tank-mixes on a confirmed glyphosate-resistant waterhemp population. One year of field-generated data is not sufficient from which to draw many conclusions, and several lingering questions remain about tank-mixes of glyphosate and PPO inhibitors, including: • Howlikelywillantagonismoccurwhencombiningglyphosate(a
translocated herbicide) with PPO inhibitors (contact herbicides)? If antagonism occurs, will the control of waterhemp (sensitive, PPO-resistant, glyphosate-resistant) or other weed species be affected?
• Whatsprayadditive(s)shouldbeincludedwiththesetank-mixes?PPO inhibitors generally perform better with COC or MSO, while most glyphosate product labels allow only AMS or NIS.
• Whattypeofspraynozzle,spraypressureandvolumeshouldbeusedin conjunction with these tank-mixes? PPO inhibitors require more thorough spray coverage of the target vegetation for effective control than do translocated herbicides.
• Atwhatrateshouldeachtank-mixcomponentbeapplied?
3. More PPO-resistant waterhemp populations have been confirmed in Illinois than glyphosate-resistant populations. A tank-mix of glyphosate and a PPO inhibitor would not improve control of PPO-resistant
44
...........................................................................................................
...........................................................................................................
...........................................................................................................
...........................................................................................................
...........................................................................................................
...........................................................................................................
...........................................................................................................
...........................................................................................................
...........................................................................................................
...........................................................................................................
...........................................................................................................
...........................................................................................................
...........................................................................................................
...........................................................................................................
...........................................................................................................
...........................................................................................................
...........................................................................................................
...........................................................................................................
...........................................................................................................
...........................................................................................................
...........................................................................................................
...........................................................................................................
...........................................................................................................
...........................................................................................................
...........................................................................................................
...........................................................................................................
...........................................................................................................
...........................................................................................................
waterhemp over that of glyphosate alone. Additionally, if a PPO-resistant waterhemp population is treated with a glyphosate and PPO inhibitor tank-mix, will the population be adequately controlled by the glyphosate component, given the concerns outlined previously?
In summary, glyphosate tank-mix partners can improve control of certain problem weed species over that obtained by glyphosate alone. However, in other instances tank-mixes may not be an advisable recommendation. As more data are generated from experiments designed to answer these lingering questions, extension weed scientists will be able to further refine these types of recommendations.
45
“New Age” Soybean Insect Management
Kevin l. steffeyProfessor and Extension Specialist in
EntomologyDepartment of Crop SciencesN-307 Turner [email protected]
Co-authors Ron Estes1, Nicholas Tinsley1, Joshua Heeren1, and Doug Jones2
1Department of Crop Sciences, University of Illinois, Urbana-Champaign, 2University of Illinois Extension, Mt. Vernon
9
The term “new age” was popularized in the 1980s to describe a set of beliefs and practices that were an outgrowth of the counterculture of the 1960s and 1970s. The term encompasses a wide range of ideas,
including, but not limited to societal transformation, spiritualism, holistic approaches to ecology, meditation, and so on. Well . . . that’s not exactly what the first author (KS) meant when he submitted the title, but we stuck with it. Rather, we wanted to convey the idea that soybean insect management in this millennium has entered a new age during which all previous assumptions and practices related to insect management must be reconsidered in light of the major changes that have occurred in soybean production. Soybean producers expect higher yields per acre to meet demand, counting on improved soybean genetics, different production practices, and new pest management technologies and practices to help them meet their expectations.
So, where does insect management fit into the expectations for higher yields of soybeans? Do expectations for higher yields include regular, possibly annual expenditures for insect control? What will befall the ecology of soybean fields if use of insecticides becomes routine? These questions cannot be addressed adequately with simple responses, and many related questions remain to be asked and answered. Nonetheless, we hope to shed some light on some of the insect management tactics and strategies that soybean producers are putting into practice, hoping that results from our efforts will help growers make informed decisions.
insect Management Tools and TechniquesAlthough significant transformations in insect management have occurred with crops such as transgenic Bt corn and Bt cotton, soybean insect management in the Midwest still mainly involves regular field scouting to determine whether a chemical insecticide is warranted to prevent yield loss—a curative approach. An exception to this curative approach is the attempt to prevent yield losses by planting seed treated with a chloronicotinyl insecticide (e.g., Cruiser), usually in combination with a fungicide, a relatively new but increasingly more common practice. Seed treatments such as Cruiser are touted to provide early season protection against insects such as bean leaf beetle, seedcorn maggot, and soybean aphid. However, the biggest changes in soybean insect management in Illinois over the past decade have occurred in response to two invasive species, one relative newcomer (soybean aphid) and one old timer ( Japanese beetles, Figure 1) whose densities have increased markedly in recent years. The focus has been primarily on decision making—when is infestation by either insect sufficient to respond with an insecticide application? The economic threshold for soybean aphids (250 aphids per plant before stage R5.5) has been painstakingly worked out through collaborative, multi-state research conducted over the past few years. Almost all entomologists involved with soybean insect management research have reached consensus about the threshold for soybean aphids. The economic threshold for Japanese beetles, on the other hand, has carried forward from the 1970s and 1980s when research on the effects of insect defoliation on soybean yield was at its zenith. Most entomologists involved with soybean insect management research believe that an overhaul of economic thresholds based upon percentage defoliation is long overdue.
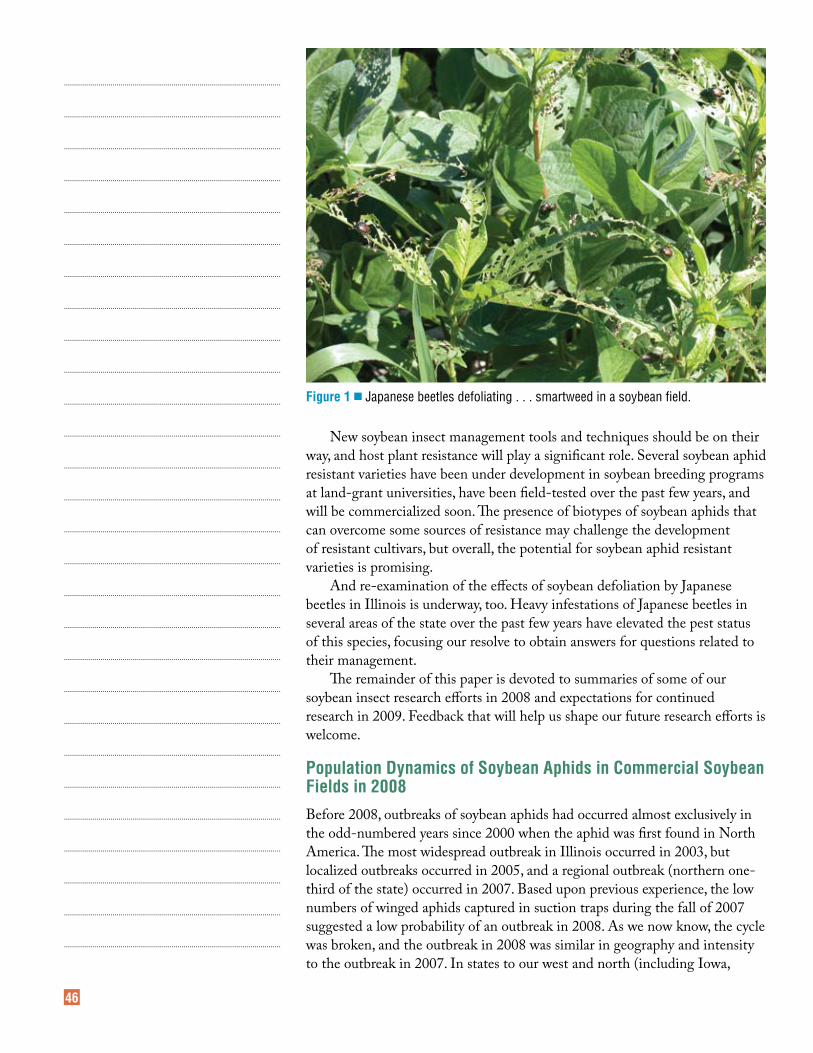
46
New soybean insect management tools and techniques should be on their way, and host plant resistance will play a significant role. Several soybean aphid resistant varieties have been under development in soybean breeding programs at land-grant universities, have been field-tested over the past few years, and will be commercialized soon. The presence of biotypes of soybean aphids that can overcome some sources of resistance may challenge the development of resistant cultivars, but overall, the potential for soybean aphid resistant varieties is promising.
And re-examination of the effects of soybean defoliation by Japanese beetles in Illinois is underway, too. Heavy infestations of Japanese beetles in several areas of the state over the past few years have elevated the pest status of this species, focusing our resolve to obtain answers for questions related to their management.
The remainder of this paper is devoted to summaries of some of our soybean insect research efforts in 2008 and expectations for continued research in 2009. Feedback that will help us shape our future research efforts is welcome.
Population Dynamics of soybean Aphids in Commercial soybean fields in 2008Before 2008, outbreaks of soybean aphids had occurred almost exclusively in the odd-numbered years since 2000 when the aphid was first found in North America. The most widespread outbreak in Illinois occurred in 2003, but localized outbreaks occurred in 2005, and a regional outbreak (northern one-third of the state) occurred in 2007. Based upon previous experience, the low numbers of winged aphids captured in suction traps during the fall of 2007 suggested a low probability of an outbreak in 2008. As we now know, the cycle was broken, and the outbreak in 2008 was similar in geography and intensity to the outbreak in 2007. In states to our west and north (including Iowa,
...........................................................................................................
...........................................................................................................
...........................................................................................................
...........................................................................................................
...........................................................................................................
...........................................................................................................
...........................................................................................................
...........................................................................................................
...........................................................................................................
...........................................................................................................
...........................................................................................................
...........................................................................................................
...........................................................................................................
...........................................................................................................
...........................................................................................................
...........................................................................................................
...........................................................................................................
...........................................................................................................
...........................................................................................................
...........................................................................................................
...........................................................................................................
...........................................................................................................
...........................................................................................................
...........................................................................................................
...........................................................................................................
...........................................................................................................
...........................................................................................................
...........................................................................................................
figure 1 ■ Japanese beetles defoliating . . . smartweed in a soybean field.
47
Nebraska, Minnesota, the Dakotas, and Wisconsin), the outbreak was severe; many fields were treated with insecticides two or three times.
Why did this happen? Many speculations abound, but some evidence from other studies in 2008 suggest that very low levels of predators were present in soybean fields throughout the summer, enabling soybean aphids to colonize and increase population size rapidly under virtually ideal conditions. The rainfall and stormy weather off and on throughout the summer hampered aphid population growth in some areas, but many fields harbored economic levels of soybean aphids, occasionally for weeks, if left untreated.
For the third consecutive year, we conducted weekly surveys of soybean aphids in 26 commercial soybean fields—10 fields in Woodford County, 10 fields in Stephenson County, and one field in each of the so-called transect counties (Bureau, Lee, Marshall, Putnam, Ogle, and Whiteside). We initiated sampling a little later in 2008 (third week of June) than in 2007 because wet weather had delayed planting of soybeans.
All of the data from all fields sampled in 2008 can be viewed on the Internet at http://www.ipm.uiuc.edu/bulletin/soyaphid. A review of the data reveals that densities of soybean aphids exceeded 250 aphids per plant in 7 of 10 fields in Stephenson County, 2 of 10 fields in Woodford County, and 3 of 6 transect fields. However, we were unable to determine whether densities would have increased to economic levels in some fields because the fields were sprayed with insecticides, after which sampling was discontinued. Some of the cooperators who had fields sprayed with insecticides left reasonably-sized untreated check areas, which allowed us to continue sampling. However, in most of the fields, densities of soybean aphids declined significantly shortly after the rest of the field was treated. We cannot attribute these declines to the effects of insecticide drift, so we can only speculate about the cause.
Population graphs generated from data from selected fields we surveyed in 2008 are presented in Figure 2. The graphs reveal a range of infestation levels, from a low peak of 95 aphids per plant in Woodford2 to a high peak of 1,037 aphids per plant in Stephenson6. Unlike the relatively abrupt decline of densities of soybean aphids in 2007 (combination of heavy rainfall, lots of predators), densities of soybean aphids in several of the fields we surveyed remained at or above 250 aphids per plant for as many as 3–4 weeks. As we learned from one of our other studies, the duration of economic infestation in 2008 had a significant impact on soybean yield.
Another marked difference between the outbreaks in 2007 and 2008 was the relatively late buildup of soybean aphid populations. In most fields, densities did not reach or exceed 250 aphids per plant until the third or fourth week of August, and densities remained high in some fields through the first and second week of September. Much of this occurred when soybeans were in the late R5 and R6 stages. Data from the North Central Regional Soybean Aphid Suction Trap Network (http://www.ncipmc.org/traps) reveal that relatively large numbers of winged aphids (those flying from soybean field to soybean field) were captured in states west and north of Illinois in early to mid-August. It is highly likely that the soybean aphids in many fields in Illinois could trace their origins to soybean fields in other states.
This has been a cooperative project, primarily with entomologists at Purdue University, to determine what relationships exist between densities of soybean aphids in soybean fields and numbers of winged adults captured
...........................................................................................................
...........................................................................................................
...........................................................................................................
...........................................................................................................
...........................................................................................................
...........................................................................................................
...........................................................................................................
...........................................................................................................
...........................................................................................................
...........................................................................................................
...........................................................................................................
...........................................................................................................
...........................................................................................................
...........................................................................................................
...........................................................................................................
...........................................................................................................
...........................................................................................................
...........................................................................................................
...........................................................................................................
...........................................................................................................
...........................................................................................................
...........................................................................................................
...........................................................................................................
...........................................................................................................
...........................................................................................................
...........................................................................................................
...........................................................................................................
...........................................................................................................
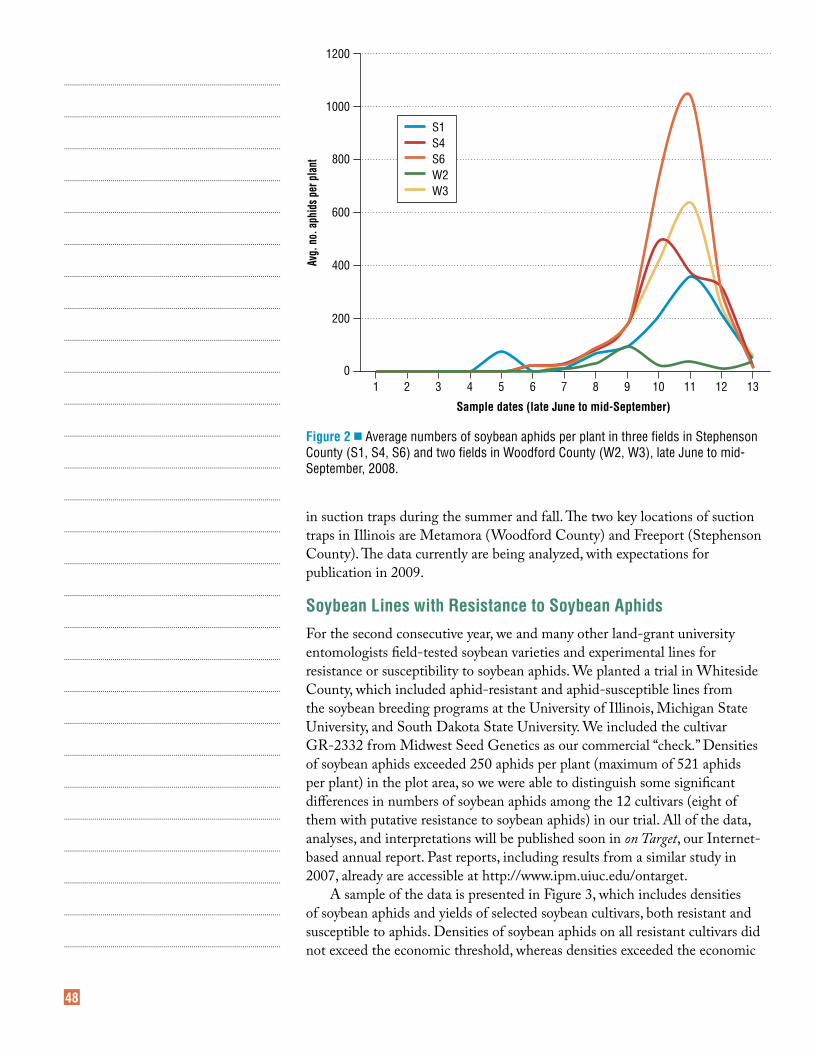
48
in suction traps during the summer and fall. The two key locations of suction traps in Illinois are Metamora (Woodford County) and Freeport (Stephenson County). The data currently are being analyzed, with expectations for publication in 2009.
soybean lines with resistance to soybean AphidsFor the second consecutive year, we and many other land-grant university entomologists field-tested soybean varieties and experimental lines for resistance or susceptibility to soybean aphids. We planted a trial in Whiteside County, which included aphid-resistant and aphid-susceptible lines from the soybean breeding programs at the University of Illinois, Michigan State University, and South Dakota State University. We included the cultivar GR-2332 from Midwest Seed Genetics as our commercial “check.” Densities of soybean aphids exceeded 250 aphids per plant (maximum of 521 aphids per plant) in the plot area, so we were able to distinguish some significant differences in numbers of soybean aphids among the 12 cultivars (eight of them with putative resistance to soybean aphids) in our trial. All of the data, analyses, and interpretations will be published soon in on Target, our Internet-based annual report. Past reports, including results from a similar study in 2007, already are accessible at http://www.ipm.uiuc.edu/ontarget.
A sample of the data is presented in Figure 3, which includes densities of soybean aphids and yields of selected soybean cultivars, both resistant and susceptible to aphids. Densities of soybean aphids on all resistant cultivars did not exceed the economic threshold, whereas densities exceeded the economic
...........................................................................................................
...........................................................................................................
...........................................................................................................
...........................................................................................................
...........................................................................................................
...........................................................................................................
...........................................................................................................
...........................................................................................................
...........................................................................................................
...........................................................................................................
...........................................................................................................
...........................................................................................................
...........................................................................................................
...........................................................................................................
...........................................................................................................
...........................................................................................................
...........................................................................................................
...........................................................................................................
...........................................................................................................
...........................................................................................................
...........................................................................................................
...........................................................................................................
...........................................................................................................
...........................................................................................................
...........................................................................................................
...........................................................................................................
...........................................................................................................
...........................................................................................................
Avg.
no.
aph
ids p
er p
lant
01 2 3 4 5 6 7 8 9 10 11 12 13
200
400
600
800
1000
1200
Sample dates (late June to mid-September)
S1S4S6W2W3
figure 2 ■ Average numbers of soybean aphids per plant in three fields in Stephenson County (S1, S4, S6) and two fields in Woodford County (W2, W3), late June to mid-September, 2008.
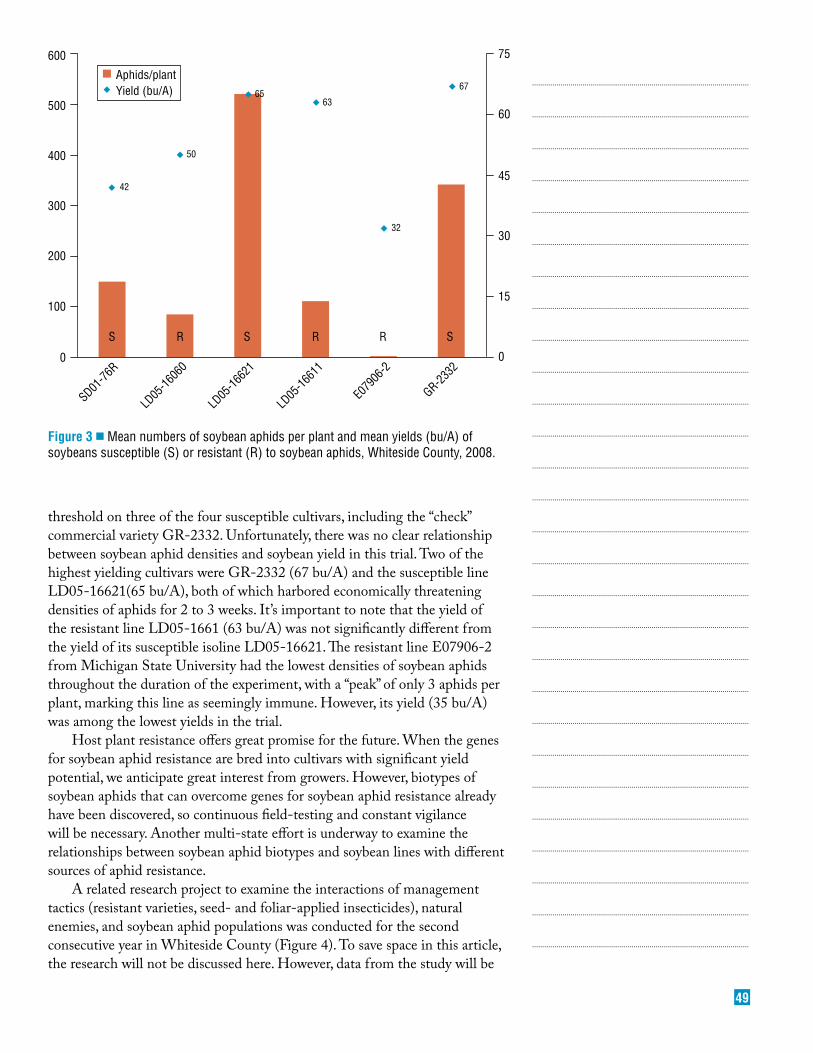
49
threshold on three of the four susceptible cultivars, including the “check” commercial variety GR-2332. Unfortunately, there was no clear relationship between soybean aphid densities and soybean yield in this trial. Two of the highest yielding cultivars were GR-2332 (67 bu/A) and the susceptible line LD05-16621(65 bu/A), both of which harbored economically threatening densities of aphids for 2 to 3 weeks. It’s important to note that the yield of the resistant line LD05-1661 (63 bu/A) was not significantly different from the yield of its susceptible isoline LD05-16621. The resistant line E07906-2 from Michigan State University had the lowest densities of soybean aphids throughout the duration of the experiment, with a “peak” of only 3 aphids per plant, marking this line as seemingly immune. However, its yield (35 bu/A) was among the lowest yields in the trial.
Host plant resistance offers great promise for the future. When the genes for soybean aphid resistance are bred into cultivars with significant yield potential, we anticipate great interest from growers. However, biotypes of soybean aphids that can overcome genes for soybean aphid resistance already have been discovered, so continuous field-testing and constant vigilance will be necessary. Another multi-state effort is underway to examine the relationships between soybean aphid biotypes and soybean lines with different sources of aphid resistance.
A related research project to examine the interactions of management tactics (resistant varieties, seed- and foliar-applied insecticides), natural enemies, and soybean aphid populations was conducted for the second consecutive year in Whiteside County (Figure 4). To save space in this article, the research will not be discussed here. However, data from the study will be
...........................................................................................................
...........................................................................................................
...........................................................................................................
...........................................................................................................
...........................................................................................................
...........................................................................................................
...........................................................................................................
...........................................................................................................
...........................................................................................................
...........................................................................................................
...........................................................................................................
...........................................................................................................
...........................................................................................................
...........................................................................................................
...........................................................................................................
...........................................................................................................
...........................................................................................................
...........................................................................................................
...........................................................................................................
...........................................................................................................
...........................................................................................................
...........................................................................................................
...........................................................................................................
...........................................................................................................
...........................................................................................................
...........................................................................................................
...........................................................................................................
...........................................................................................................
0
SD01-76
R
LD05
-1606
0
LD05
-1662
1
LD05
-1661
1
E079
06-2
GR-2332
0
42
S R S R R S
50
6563
32
67
15
30
45
60
75
100
200
300
400
500
600
Aphids/plantYield (bu/A)
figure 3 ■ Mean numbers of soybean aphids per plant and mean yields (bu/A) of soybeans susceptible (S) or resistant (R) to soybean aphids, Whiteside County, 2008.
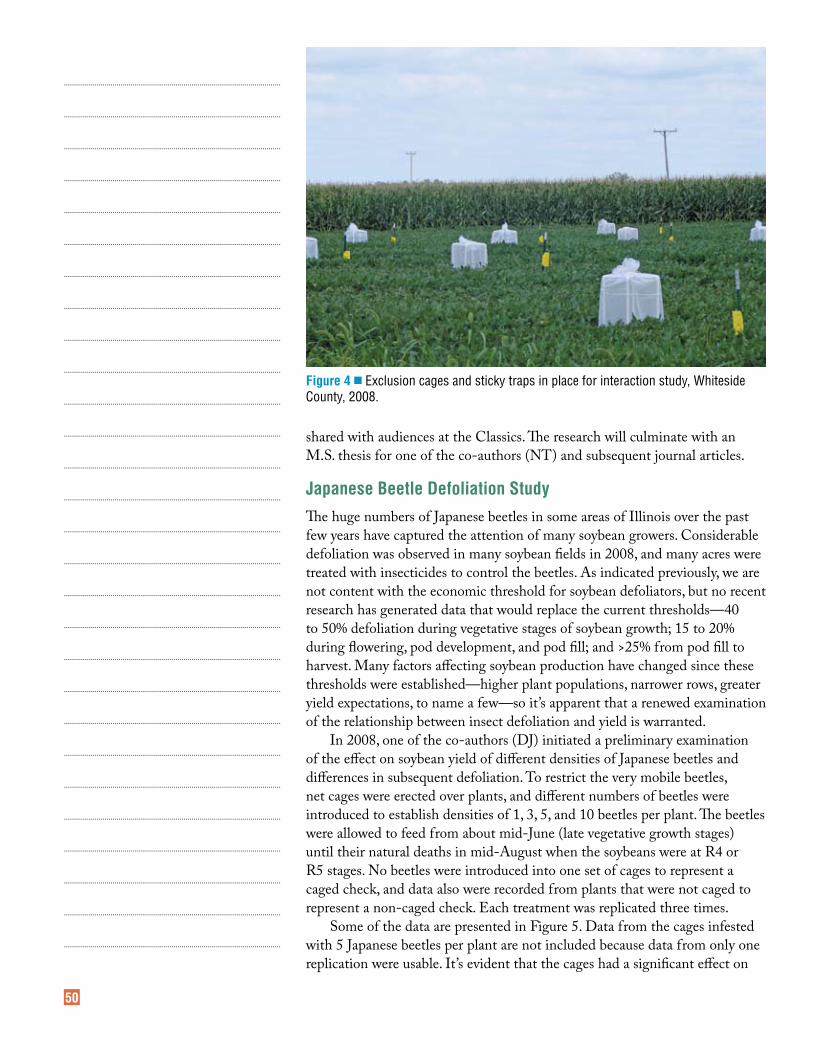
50
shared with audiences at the Classics. The research will culminate with an M.S. thesis for one of the co-authors (NT) and subsequent journal articles.
Japanese Beetle Defoliation studyThe huge numbers of Japanese beetles in some areas of Illinois over the past few years have captured the attention of many soybean growers. Considerable defoliation was observed in many soybean fields in 2008, and many acres were treated with insecticides to control the beetles. As indicated previously, we are not content with the economic threshold for soybean defoliators, but no recent research has generated data that would replace the current thresholds—40 to 50% defoliation during vegetative stages of soybean growth; 15 to 20% during flowering, pod development, and pod fill; and >25% from pod fill to harvest. Many factors affecting soybean production have changed since these thresholds were established—higher plant populations, narrower rows, greater yield expectations, to name a few—so it’s apparent that a renewed examination of the relationship between insect defoliation and yield is warranted.
In 2008, one of the co-authors (DJ) initiated a preliminary examination of the effect on soybean yield of different densities of Japanese beetles and differences in subsequent defoliation. To restrict the very mobile beetles, net cages were erected over plants, and different numbers of beetles were introduced to establish densities of 1, 3, 5, and 10 beetles per plant. The beetles were allowed to feed from about mid-June (late vegetative growth stages) until their natural deaths in mid-August when the soybeans were at R4 or R5 stages. No beetles were introduced into one set of cages to represent a caged check, and data also were recorded from plants that were not caged to represent a non-caged check. Each treatment was replicated three times.
Some of the data are presented in Figure 5. Data from the cages infested with 5 Japanese beetles per plant are not included because data from only one replication were usable. It’s evident that the cages had a significant effect on
...........................................................................................................
...........................................................................................................
...........................................................................................................
...........................................................................................................
...........................................................................................................
...........................................................................................................
...........................................................................................................
...........................................................................................................
...........................................................................................................
...........................................................................................................
...........................................................................................................
...........................................................................................................
...........................................................................................................
...........................................................................................................
...........................................................................................................
...........................................................................................................
...........................................................................................................
...........................................................................................................
...........................................................................................................
...........................................................................................................
...........................................................................................................
...........................................................................................................
...........................................................................................................
...........................................................................................................
...........................................................................................................
...........................................................................................................
...........................................................................................................
...........................................................................................................
figure 4 ■ Exclusion cages and sticky traps in place for interaction study, Whiteside County, 2008.
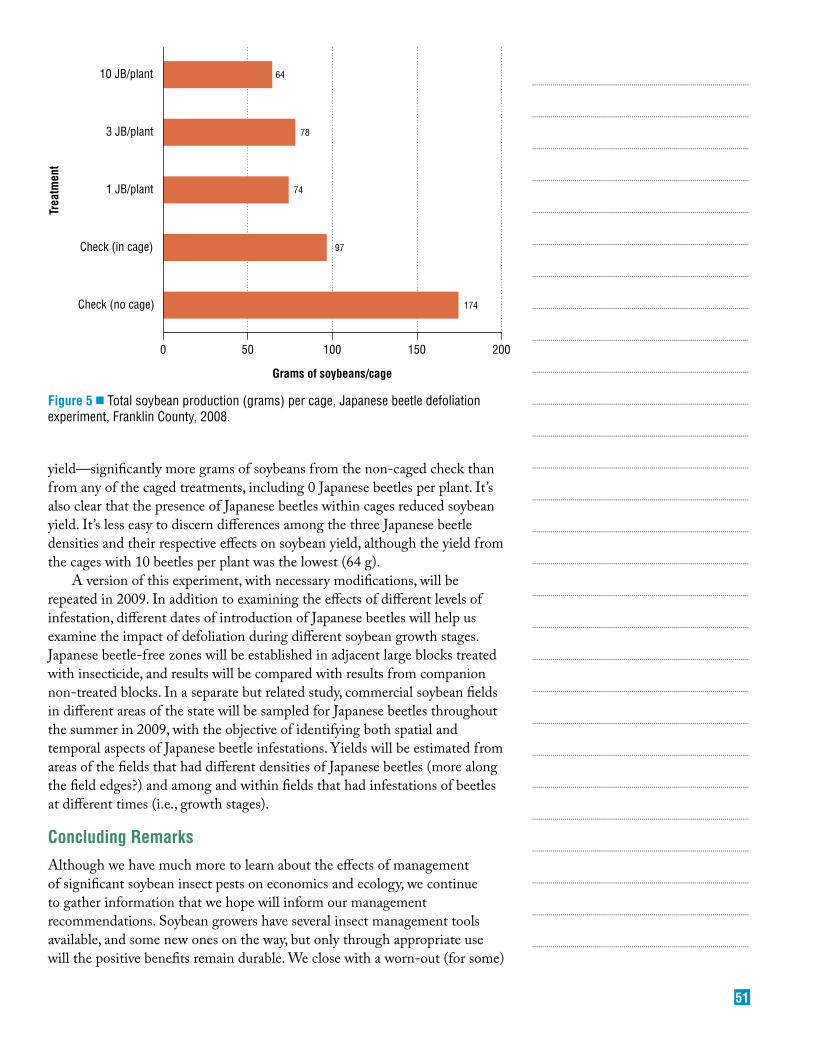
51
yield—significantly more grams of soybeans from the non-caged check than from any of the caged treatments, including 0 Japanese beetles per plant. It’s also clear that the presence of Japanese beetles within cages reduced soybean yield. It’s less easy to discern differences among the three Japanese beetle densities and their respective effects on soybean yield, although the yield from the cages with 10 beetles per plant was the lowest (64 g).
A version of this experiment, with necessary modifications, will be repeated in 2009. In addition to examining the effects of different levels of infestation, different dates of introduction of Japanese beetles will help us examine the impact of defoliation during different soybean growth stages. Japanese beetle-free zones will be established in adjacent large blocks treated with insecticide, and results will be compared with results from companion non-treated blocks. In a separate but related study, commercial soybean fields in different areas of the state will be sampled for Japanese beetles throughout the summer in 2009, with the objective of identifying both spatial and temporal aspects of Japanese beetle infestations. Yields will be estimated from areas of the fields that had different densities of Japanese beetles (more along the field edges?) and among and within fields that had infestations of beetles at different times (i.e., growth stages).
Concluding remarksAlthough we have much more to learn about the effects of management of significant soybean insect pests on economics and ecology, we continue to gather information that we hope will inform our management recommendations. Soybean growers have several insect management tools available, and some new ones on the way, but only through appropriate use will the positive benefits remain durable. We close with a worn-out (for some)
...........................................................................................................
...........................................................................................................
...........................................................................................................
...........................................................................................................
...........................................................................................................
...........................................................................................................
...........................................................................................................
...........................................................................................................
...........................................................................................................
...........................................................................................................
...........................................................................................................
...........................................................................................................
...........................................................................................................
...........................................................................................................
...........................................................................................................
...........................................................................................................
...........................................................................................................
...........................................................................................................
...........................................................................................................
...........................................................................................................
...........................................................................................................
...........................................................................................................
...........................................................................................................
...........................................................................................................
...........................................................................................................
...........................................................................................................
...........................................................................................................
...........................................................................................................
figure 5 ■ Total soybean production (grams) per cage, Japanese beetle defoliation experiment, Franklin County, 2008.
0 50 100
Grams of soybeans/cage
Trea
tmen
t
150 200
174
97
74
78
64
Check (no cage)
Check (in cage)
1 JB/plant
3 JB/plant
10 JB/plant

52
truism . . . scout soybean fields for insects regularly. We realize that scouting in narrow-row soybeans is difficult (an understatement) and that there are questions about the utility of some of the information gathered from scouting trips. Nonetheless, replacing scouting with unnecessary use of insecticides may create future challenge that will offset or supplant the benefits of high yields.
AcknowledgmentsWe wish to thank the Illinois Soybean Association for providing most of the funding necessary to support the research and survey efforts described in this paper. They have provided funding for our program annually for several years, allowing us to conduct relatively small-scale, controlled experiments and to participate in large-scale, multi-state efforts, which have received additional support from the North Central Soybean Research Program. Our goal has been to address the most relevant and practical aspects of soybean insect management based upon the input and feedback we obtain from soybean producers who strive to manage insects in economically and ecologically positive ways. We also thank the many companies who have provided support for insecticide efficacy experiments, enabling us to answer near-term questions about insect control in soybeans.
...........................................................................................................
...........................................................................................................
...........................................................................................................
...........................................................................................................
...........................................................................................................
...........................................................................................................
...........................................................................................................
...........................................................................................................
...........................................................................................................
...........................................................................................................
...........................................................................................................
...........................................................................................................
...........................................................................................................
...........................................................................................................
...........................................................................................................
...........................................................................................................
...........................................................................................................
...........................................................................................................
...........................................................................................................
...........................................................................................................
...........................................................................................................
...........................................................................................................
...........................................................................................................
...........................................................................................................
...........................................................................................................
...........................................................................................................
...........................................................................................................
...........................................................................................................

53
notes
..........................................................................................................................................................................................................................................................................................................................................................
..........................................................................................................................................................................................................................................................................................................................................................
..........................................................................................................................................................................................................................................................................................................................................................
..........................................................................................................................................................................................................................................................................................................................................................
..........................................................................................................................................................................................................................................................................................................................................................
..........................................................................................................................................................................................................................................................................................................................................................
..........................................................................................................................................................................................................................................................................................................................................................
..........................................................................................................................................................................................................................................................................................................................................................
..........................................................................................................................................................................................................................................................................................................................................................
..........................................................................................................................................................................................................................................................................................................................................................
..........................................................................................................................................................................................................................................................................................................................................................
..........................................................................................................................................................................................................................................................................................................................................................
..........................................................................................................................................................................................................................................................................................................................................................
..........................................................................................................................................................................................................................................................................................................................................................
..........................................................................................................................................................................................................................................................................................................................................................
..........................................................................................................................................................................................................................................................................................................................................................
..........................................................................................................................................................................................................................................................................................................................................................
..........................................................................................................................................................................................................................................................................................................................................................
..........................................................................................................................................................................................................................................................................................................................................................
..........................................................................................................................................................................................................................................................................................................................................................
..........................................................................................................................................................................................................................................................................................................................................................
..........................................................................................................................................................................................................................................................................................................................................................
..........................................................................................................................................................................................................................................................................................................................................................
..........................................................................................................................................................................................................................................................................................................................................................
..........................................................................................................................................................................................................................................................................................................................................................
.........................................................................................................................................................................................................................................................................................................................................................
..........................................................................................................................................................................................................................................................................................................................................................
..........................................................................................................................................................................................................................................................................................................................................................

54
notes
..........................................................................................................................................................................................................................................................................................................................................................
..........................................................................................................................................................................................................................................................................................................................................................
..........................................................................................................................................................................................................................................................................................................................................................
..........................................................................................................................................................................................................................................................................................................................................................
..........................................................................................................................................................................................................................................................................................................................................................
..........................................................................................................................................................................................................................................................................................................................................................
..........................................................................................................................................................................................................................................................................................................................................................
..........................................................................................................................................................................................................................................................................................................................................................
..........................................................................................................................................................................................................................................................................................................................................................
..........................................................................................................................................................................................................................................................................................................................................................
..........................................................................................................................................................................................................................................................................................................................................................
..........................................................................................................................................................................................................................................................................................................................................................
..........................................................................................................................................................................................................................................................................................................................................................
..........................................................................................................................................................................................................................................................................................................................................................
..........................................................................................................................................................................................................................................................................................................................................................
..........................................................................................................................................................................................................................................................................................................................................................
..........................................................................................................................................................................................................................................................................................................................................................
..........................................................................................................................................................................................................................................................................................................................................................
..........................................................................................................................................................................................................................................................................................................................................................
..........................................................................................................................................................................................................................................................................................................................................................
..........................................................................................................................................................................................................................................................................................................................................................
..........................................................................................................................................................................................................................................................................................................................................................
..........................................................................................................................................................................................................................................................................................................................................................
..........................................................................................................................................................................................................................................................................................................................................................
..........................................................................................................................................................................................................................................................................................................................................................
.........................................................................................................................................................................................................................................................................................................................................................
..........................................................................................................................................................................................................................................................................................................................................................
..........................................................................................................................................................................................................................................................................................................................................................

55
notes
..........................................................................................................................................................................................................................................................................................................................................................
..........................................................................................................................................................................................................................................................................................................................................................
..........................................................................................................................................................................................................................................................................................................................................................
..........................................................................................................................................................................................................................................................................................................................................................
..........................................................................................................................................................................................................................................................................................................................................................
..........................................................................................................................................................................................................................................................................................................................................................
..........................................................................................................................................................................................................................................................................................................................................................
..........................................................................................................................................................................................................................................................................................................................................................
..........................................................................................................................................................................................................................................................................................................................................................
..........................................................................................................................................................................................................................................................................................................................................................
..........................................................................................................................................................................................................................................................................................................................................................
..........................................................................................................................................................................................................................................................................................................................................................
..........................................................................................................................................................................................................................................................................................................................................................
..........................................................................................................................................................................................................................................................................................................................................................
..........................................................................................................................................................................................................................................................................................................................................................
..........................................................................................................................................................................................................................................................................................................................................................
..........................................................................................................................................................................................................................................................................................................................................................
..........................................................................................................................................................................................................................................................................................................................................................
..........................................................................................................................................................................................................................................................................................................................................................
..........................................................................................................................................................................................................................................................................................................................................................
..........................................................................................................................................................................................................................................................................................................................................................
..........................................................................................................................................................................................................................................................................................................................................................
..........................................................................................................................................................................................................................................................................................................................................................
..........................................................................................................................................................................................................................................................................................................................................................
..........................................................................................................................................................................................................................................................................................................................................................
.........................................................................................................................................................................................................................................................................................................................................................
..........................................................................................................................................................................................................................................................................................................................................................
..........................................................................................................................................................................................................................................................................................................................................................

56
notes
..........................................................................................................................................................................................................................................................................................................................................................
..........................................................................................................................................................................................................................................................................................................................................................
..........................................................................................................................................................................................................................................................................................................................................................
..........................................................................................................................................................................................................................................................................................................................................................
..........................................................................................................................................................................................................................................................................................................................................................
..........................................................................................................................................................................................................................................................................................................................................................
..........................................................................................................................................................................................................................................................................................................................................................
..........................................................................................................................................................................................................................................................................................................................................................
..........................................................................................................................................................................................................................................................................................................................................................
..........................................................................................................................................................................................................................................................................................................................................................
..........................................................................................................................................................................................................................................................................................................................................................
..........................................................................................................................................................................................................................................................................................................................................................
..........................................................................................................................................................................................................................................................................................................................................................
..........................................................................................................................................................................................................................................................................................................................................................
..........................................................................................................................................................................................................................................................................................................................................................
..........................................................................................................................................................................................................................................................................................................................................................
..........................................................................................................................................................................................................................................................................................................................................................
..........................................................................................................................................................................................................................................................................................................................................................
..........................................................................................................................................................................................................................................................................................................................................................
..........................................................................................................................................................................................................................................................................................................................................................
..........................................................................................................................................................................................................................................................................................................................................................
..........................................................................................................................................................................................................................................................................................................................................................
..........................................................................................................................................................................................................................................................................................................................................................
..........................................................................................................................................................................................................................................................................................................................................................
..........................................................................................................................................................................................................................................................................................................................................................
..........................................................................................................................................................................................................................................................................................................................................................
..........................................................................................................................................................................................................................................................................................................................................................
..........................................................................................................................................................................................................................................................................................................................................................

3

4