Embed Size (px)
Citation preview
Market Monitor
Contents
World Supply-Demand Outlook .......................... 1
Crop Monitor NEW ............................................. 2
International Prices .............................................. 4
Futures Markets ................................................... 6
Policy Developments ........................................... 7
Market Indicators ................................................ 8
Explanatory Notes ............................................. 10
The Market Monitor is a product of the Agricultural Market Information System (AMIS), a G20 initiative to provide information, analysis and short-term supply and demand forecasts. It covers the international markets for wheat, maize, rice and soybeans, giving a synopsis of major market developments and the policy and other market drivers behind them. The analysis is a collective assessment of the market situation and outlook by the ten international organizations that form the AMIS Secretariat. Ultimately, the report aims at improving market transparency and detecting emerging problems that might warrant the attention of policy makers.
www.amis-outlook.org
No.11 – September 2013
AMIS No. 11 –September 2013 1
World Supply-Demand Outlook
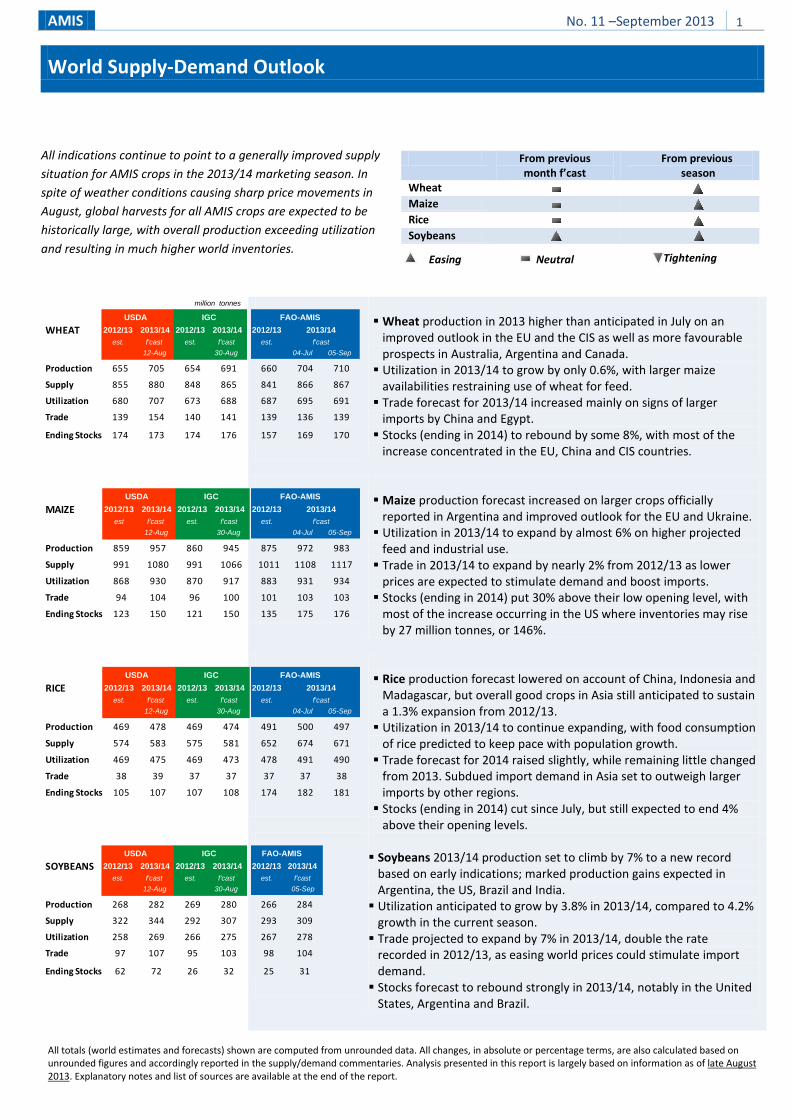
From previous
month f’cast From previous
season Wheat
Maize
Rice
Soybeans
Easing Neutral Tightening
Wheat production in 2013 higher than anticipated in July on an
improved outlook in the EU and the CIS as well as more favourable prospects in Australia, Argentina and Canada. Utilization in 2013/14 to grow by only 0.6%, with larger maize
availabilities restraining use of wheat for feed. Trade forecast for 2013/14 increased mainly on signs of larger
imports by China and Egypt. Stocks (ending in 2014) to rebound by some 8%, with most of the
increase concentrated in the EU, China and CIS countries.
Maize production forecast increased on larger crops officially
reported in Argentina and improved outlook for the EU and Ukraine. Utilization in 2013/14 to expand by almost 6% on higher projected
feed and industrial use. Trade in 2013/14 to expand by nearly 2% from 2012/13 as lower
prices are expected to stimulate demand and boost imports. Stocks (ending in 2014) put 30% above their low opening level, with
most of the increase occurring in the US where inventories may rise by 27 million tonnes, or 146%.
Rice production forecast lowered on account of China, Indonesia and
Madagascar, but overall good crops in Asia still anticipated to sustain a 1.3% expansion from 2012/13. Utilization in 2013/14 to continue expanding, with food consumption
of rice predicted to keep pace with population growth. Trade forecast for 2014 raised slightly, while remaining little changed
from 2013. Subdued import demand in Asia set to outweigh larger imports by other regions. Stocks (ending in 2014) cut since July, but still expected to end 4%
above their opening levels.
Soybeans 2013/14 production set to climb by 7% to a new record
based on early indications; marked production gains expected in Argentina, the US, Brazil and India. Utilization anticipated to grow by 3.8% in 2013/14, compared to 4.2%
growth in the current season. Trade projected to expand by 7% in 2013/14, double the rate
recorded in 2012/13, as easing world prices could stimulate import demand. Stocks forecast to rebound strongly in 2013/14, notably in the United
States, Argentina and Brazil.
All totals (world estimates and forecasts) shown are computed from unrounded data. All changes, in absolute or percentage terms, are also calculated based on unrounded figures and accordingly reported in the supply/demand commentaries. Analysis presented in this report is largely based on information as of late August 2013. Explanatory notes and list of sources are available at the end of the report.
WHEAT 2012/13 2013/14 2012/13 2013/14est. f'cast est. f'cast
12-Aug 30-Aug
Production 655 705 654 691
Supply 855 880 848 865
Utilization 680 707 673 688
Trade 139 154 140 141
Ending Stocks 174 173 174 176
million tonnes
USDA IGC2012/13
est.04-Jul 05-Sep
660 704 710
841 866 867
687 695 691
139 136 139
157 169 170
FAO-AMIS2013/14
f'cast
MAIZE 2012/13 2013/14 2012/13 2013/14est f'cast est. f'cast
12-Aug 30-Aug
Production 859 957 860 945
Supply 991 1080 991 1066
Utilization 868 930 870 917
Trade 94 104 96 100
Ending Stocks 123 150 121 150
USDA IGC2012/13
est.04-Jul 05-Sep
875 972 983
1011 1108 1117
883 931 934
101 103 103
135 175 176
2013/14f'cast
FAO-AMIS
RICE 2012/13 2013/14 2012/13 2013/14est. f'cast est. f'cast
12-Aug 30-Aug
Production 469 478 469 474
Supply 574 583 575 581
Utilization 469 475 469 473
Trade 38 39 37 37
Ending Stocks 105 107 107 108
USDA IGC2012/13
est.04-Jul 05-Sep
491 500 497
652 674 671
478 491 490
37 37 38
174 182 181
2013/14f'cast
FAO-AMIS
SOYBEANS 2012/13 2013/14 2012/13 2013/14est. f'cast est. f'cast
12-Aug 30-Aug
Production 268 282 269 280
Supply 322 344 292 307
Utilization 258 269 266 275
Trade 97 107 95 103
Ending Stocks 62 72 26 32
USDA IGC2012/13 2013/14
est. f'cast05-Sep
266 284
293 309
267 278
98 104
25 31
FAO-AMIS
All indications continue to point to a generally improved supply situation for AMIS crops in the 2013/14 marketing season. In spite of weather conditions causing sharp price movements in August, global harvests for all AMIS crops are expected to be historically large, with overall production exceeding utilization and resulting in much higher world inventories.
AMIS No. 11 –September 2013 2
Crop Monitor (As of 28 August)
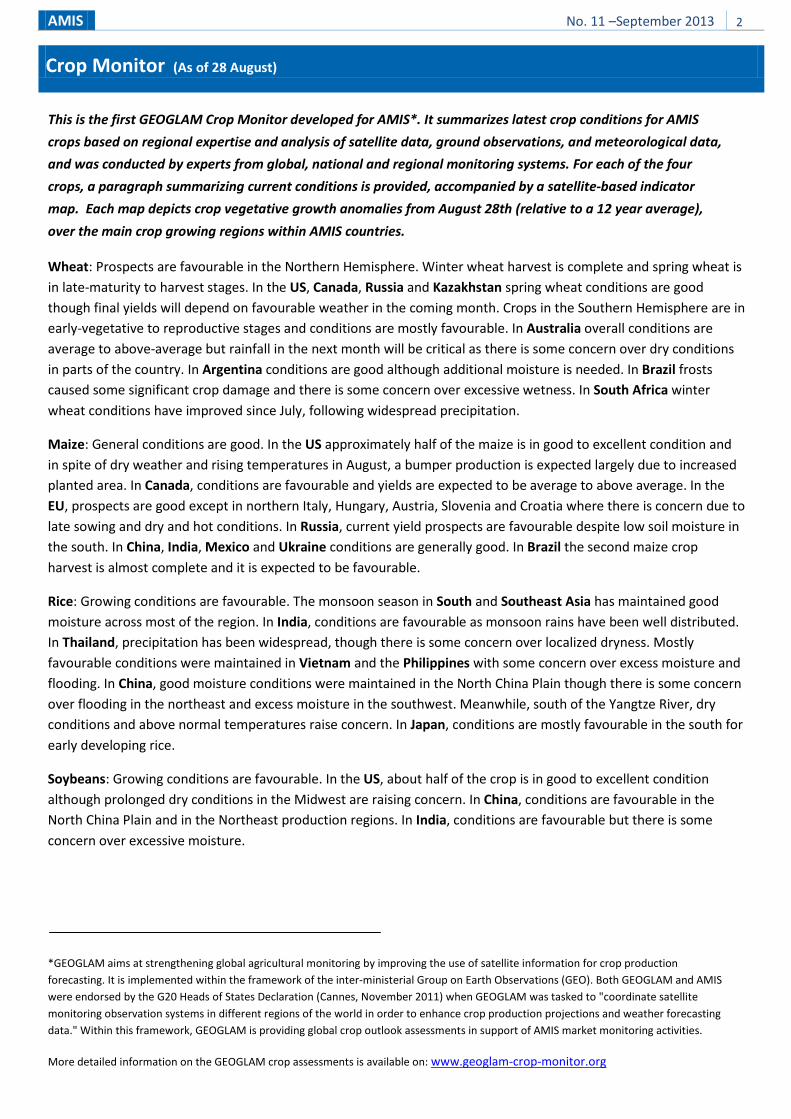
This is the first GEOGLAM Crop Monitor developed for AMIS*. It summarizes latest crop conditions for AMIS
crops based on regional expertise and analysis of satellite data, ground observations, and meteorological data,
and was conducted by experts from global, national and regional monitoring systems. For each of the four
crops, a paragraph summarizing current conditions is provided, accompanied by a satellite-based indicator
map. Each map depicts crop vegetative growth anomalies from August 28th (relative to a 12 year average),
over the main crop growing regions within AMIS countries.
Wheat: Prospects are favourable in the Northern Hemisphere. Winter wheat harvest is complete and spring wheat is in late-maturity to harvest stages. In the US, Canada, Russia and Kazakhstan spring wheat conditions are good though final yields will depend on favourable weather in the coming month. Crops in the Southern Hemisphere are in early-vegetative to reproductive stages and conditions are mostly favourable. In Australia overall conditions are average to above-average but rainfall in the next month will be critical as there is some concern over dry conditions in parts of the country. In Argentina conditions are good although additional moisture is needed. In Brazil frosts caused some significant crop damage and there is some concern over excessive wetness. In South Africa winter wheat conditions have improved since July, following widespread precipitation.
Maize: General conditions are good. In the US approximately half of the maize is in good to excellent condition and in spite of dry weather and rising temperatures in August, a bumper production is expected largely due to increased planted area. In Canada, conditions are favourable and yields are expected to be average to above average. In the EU, prospects are good except in northern Italy, Hungary, Austria, Slovenia and Croatia where there is concern due to late sowing and dry and hot conditions. In Russia, current yield prospects are favourable despite low soil moisture in the south. In China, India, Mexico and Ukraine conditions are generally good. In Brazil the second maize crop harvest is almost complete and it is expected to be favourable.
Rice: Growing conditions are favourable. The monsoon season in South and Southeast Asia has maintained good moisture across most of the region. In India, conditions are favourable as monsoon rains have been well distributed. In Thailand, precipitation has been widespread, though there is some concern over localized dryness. Mostly favourable conditions were maintained in Vietnam and the Philippines with some concern over excess moisture and flooding. In China, good moisture conditions were maintained in the North China Plain though there is some concern over flooding in the northeast and excess moisture in the southwest. Meanwhile, south of the Yangtze River, dry conditions and above normal temperatures raise concern. In Japan, conditions are mostly favourable in the south for early developing rice.
Soybeans: Growing conditions are favourable. In the US, about half of the crop is in good to excellent condition although prolonged dry conditions in the Midwest are raising concern. In China, conditions are favourable in the North China Plain and in the Northeast production regions. In India, conditions are favourable but there is some concern over excessive moisture.
*GEOGLAM aims at strengthening global agricultural monitoring by improving the use of satellite information for crop production forecasting. It is implemented within the framework of the inter-ministerial Group on Earth Observations (GEO). Both GEOGLAM and AMIS were endorsed by the G20 Heads of States Declaration (Cannes, November 2011) when GEOGLAM was tasked to "coordinate satellite monitoring observation systems in different regions of the world in order to enhance crop production projections and weather forecasting data." Within this framework, GEOGLAM is providing global crop outlook assessments in support of AMIS market monitoring activities.
More detailed information on the GEOGLAM crop assessments is available on: www.geoglam-crop-monitor.org
AMIS No. 11 –September 2013 3
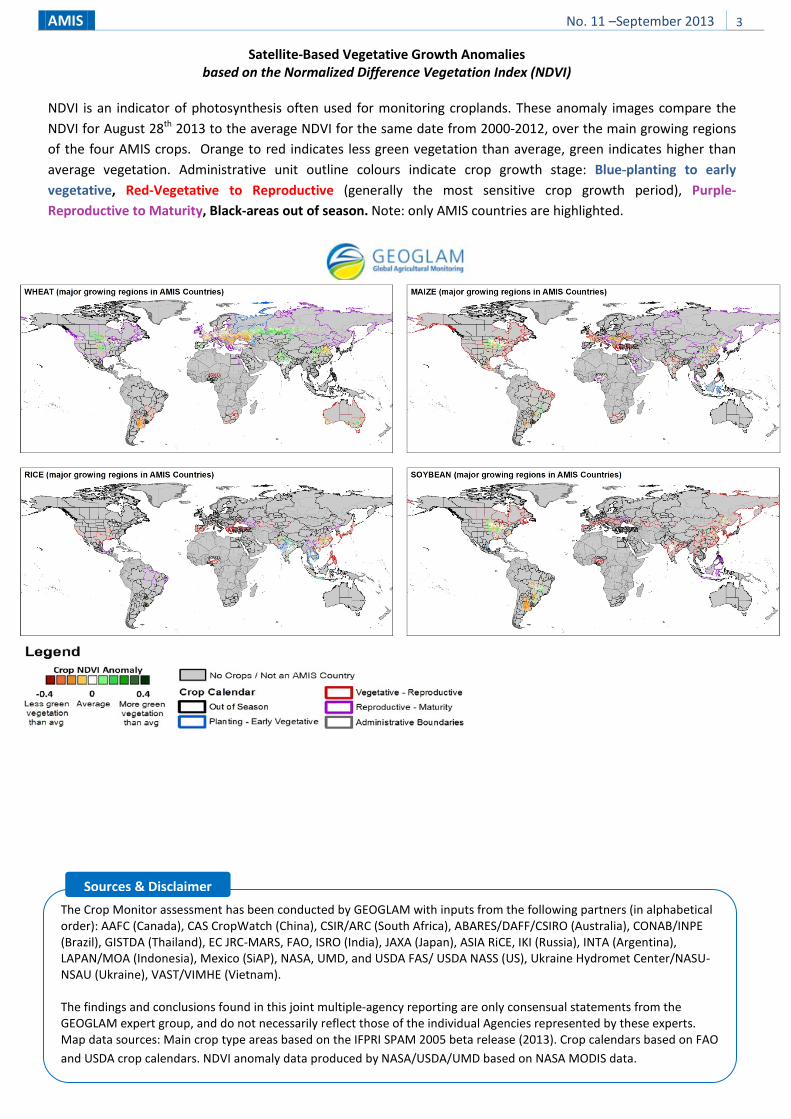
Satellite-Based Vegetative Growth Anomalies based on the Normalized Difference Vegetation Index (NDVI)
NDVI is an indicator of photosynthesis often used for monitoring croplands. These anomaly images compare the NDVI for August 28th 2013 to the average NDVI for the same date from 2000-2012, over the main growing regions of the four AMIS crops. Orange to red indicates less green vegetation than average, green indicates higher than average vegetation. Administrative unit outline colours indicate crop growth stage: Blue-planting to early vegetative, Red-Vegetative to Reproductive (generally the most sensitive crop growth period), Purple-Reproductive to Maturity, Black-areas out of season. Note: only AMIS countries are highlighted.
The Crop Monitor assessment has been conducted by GEOGLAM with inputs from the following partners (in alphabetical order): AAFC (Canada), CAS CropWatch (China), CSIR/ARC (South Africa), ABARES/DAFF/CSIRO (Australia), CONAB/INPE (Brazil), GISTDA (Thailand), EC JRC-MARS, FAO, ISRO (India), JAXA (Japan), ASIA RiCE, IKI (Russia), INTA (Argentina), LAPAN/MOA (Indonesia), Mexico (SiAP), NASA, UMD, and USDA FAS/ USDA NASS (US), Ukraine Hydromet Center/NASU-NSAU (Ukraine), VAST/VIMHE (Vietnam). The findings and conclusions found in this joint multiple-agency reporting are only consensual statements from the GEOGLAM expert group, and do not necessarily reflect those of the individual Agencies represented by these experts. Map data sources: Main crop type areas based on the IFPRI SPAM 2005 beta release (2013). Crop calendars based on FAO and USDA crop calendars. NDVI anomaly data produced by NASA/USDA/UMD based on NASA MODIS data.
Sources & Disclaimer
AMIS No. 11 –September 2013 4
International Prices
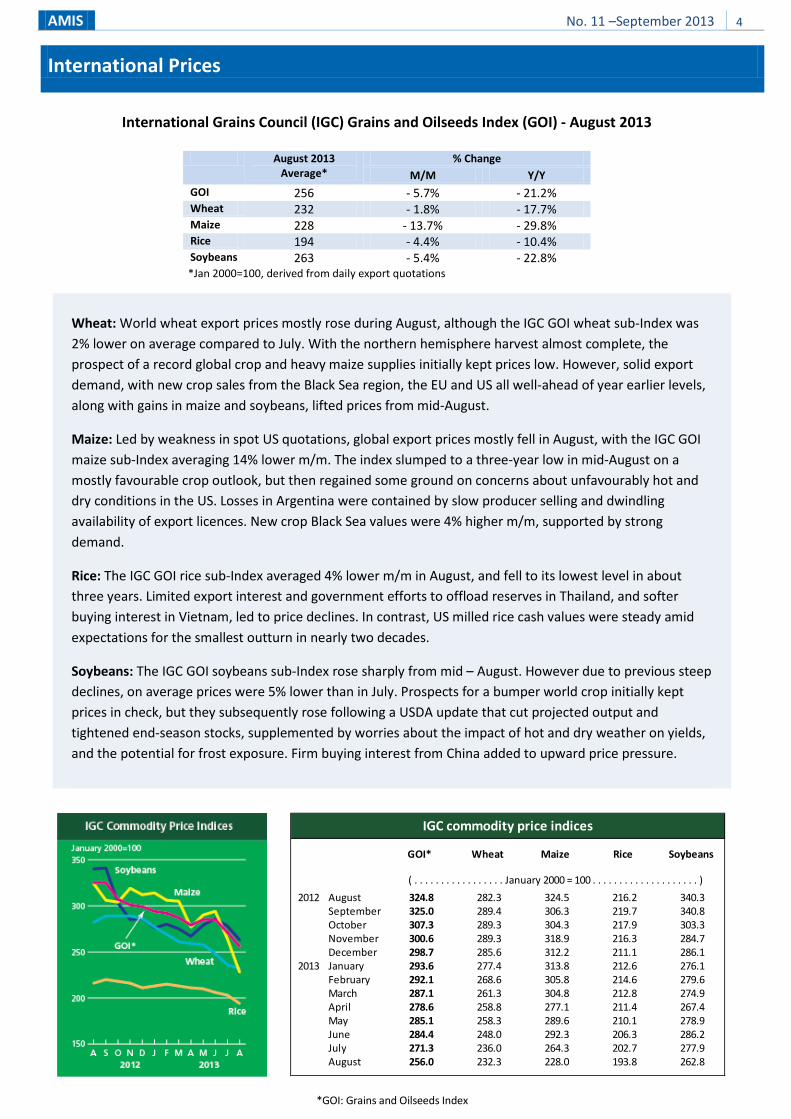
International Grains Council (IGC) Grains and Oilseeds Index (GOI) - August 2013
August 2013
Average* % Change
M/M Y/Y GOI 256 - 5.7% - 21.2% Wheat 232 - 1.8% - 17.7% Maize 228 - 13.7% - 29.8% Rice 194 - 4.4% - 10.4% Soybeans 263 - 5.4% - 22.8% *Jan 2000=100, derived from daily export quotations
*GOI: Grains and Oilseeds Index
GOI* Wheat Maize Rice Soybeans
2012 August 324.8 282.3 324.5 216.2 340.3September 325.0 289.4 306.3 219.7 340.8October 307.3 289.3 304.3 217.9 303.3November 300.6 289.3 318.9 216.3 284.7December 298.7 285.6 312.2 211.1 286.1
2013 January 293.6 277.4 313.8 212.6 276.1February 292.1 268.6 305.8 214.6 279.6March 287.1 261.3 304.8 212.8 274.9April 278.6 258.8 277.1 211.4 267.4May 285.1 258.3 289.6 210.1 278.9June 284.4 248.0 292.3 206.3 286.2July 271.3 236.0 264.3 202.7 277.9August 256.0 232.3 228.0 193.8 262.8
IGC commodity price indices
( . . . . . . . . . . . . . . . . . January 2000 = 100 . . . . . . . . . . . . . . . . . . . . )
Wheat: World wheat export prices mostly rose during August, although the IGC GOI wheat sub-Index was 2% lower on average compared to July. With the northern hemisphere harvest almost complete, the prospect of a record global crop and heavy maize supplies initially kept prices low. However, solid export demand, with new crop sales from the Black Sea region, the EU and US all well-ahead of year earlier levels, along with gains in maize and soybeans, lifted prices from mid-August.
Maize: Led by weakness in spot US quotations, global export prices mostly fell in August, with the IGC GOI maize sub-Index averaging 14% lower m/m. The index slumped to a three-year low in mid-August on a mostly favourable crop outlook, but then regained some ground on concerns about unfavourably hot and dry conditions in the US. Losses in Argentina were contained by slow producer selling and dwindling availability of export licences. New crop Black Sea values were 4% higher m/m, supported by strong demand.
Rice: The IGC GOI rice sub-Index averaged 4% lower m/m in August, and fell to its lowest level in about three years. Limited export interest and government efforts to offload reserves in Thailand, and softer buying interest in Vietnam, led to price declines. In contrast, US milled rice cash values were steady amid expectations for the smallest outturn in nearly two decades.
Soybeans: The IGC GOI soybeans sub-Index rose sharply from mid – August. However due to previous steep declines, on average prices were 5% lower than in July. Prospects for a bumper world crop initially kept prices in check, but they subsequently rose following a USDA update that cut projected output and tightened end-season stocks, supplemented by worries about the impact of hot and dry weather on yields, and the potential for frost exposure. Firm buying interest from China added to upward price pressure.
AMIS No. 11 –September 2013 5
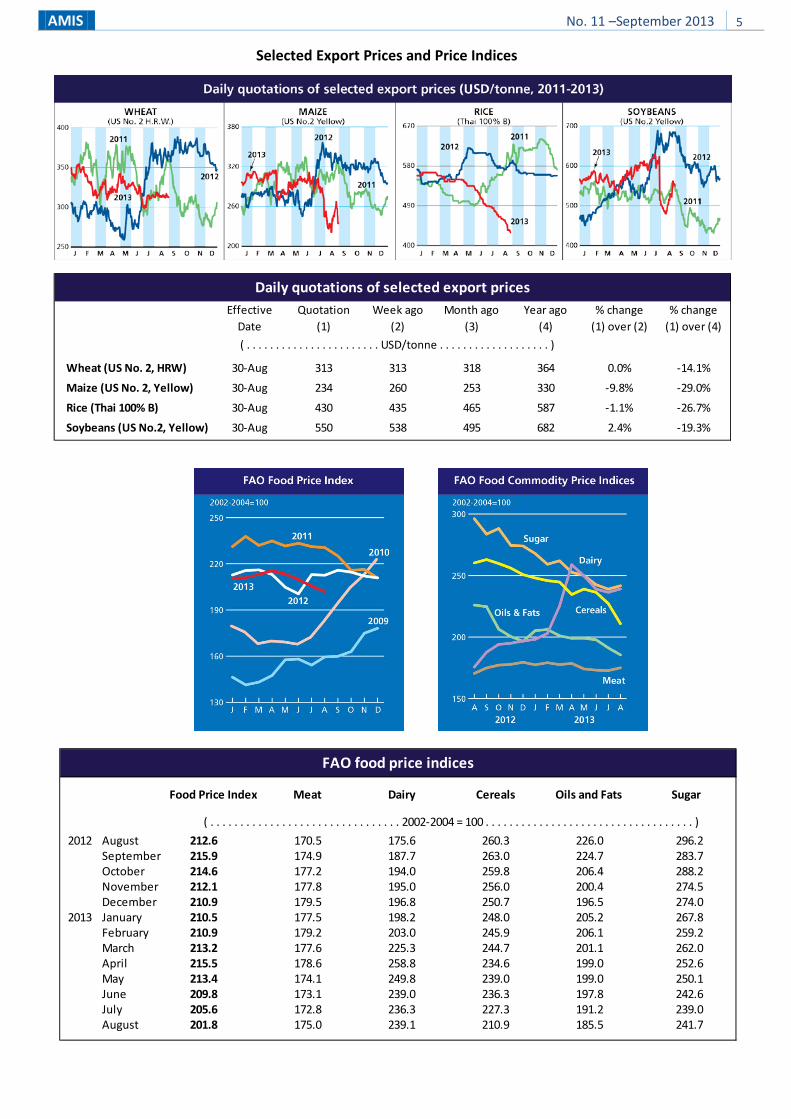
Selected Export Prices and Price Indices
Effective Quotation Week ago Month ago Year ago % change % changeDate (1) (2) (3) (4) (1) over (2) (1) over (4)
Wheat (US No. 2, HRW) 30-Aug 313 313 318 364 0.0% -14.1%
Maize (US No. 2, Yellow) 30-Aug 234 260 253 330 -9.8% -29.0%
Rice (Thai 100% B) 30-Aug 430 435 465 587 -1.1% -26.7%
Soybeans (US No.2, Yellow) 30-Aug 550 538 495 682 2.4% -19.3%
( . . . . . . . . . . . . . . . . . . . . . . . USD/tonne . . . . . . . . . . . . . . . . . . . )
Daily quotations of selected export prices
Food Price Index Meat Dairy Cereals Oils and Fats Sugar
2012 August 212.6 170.5 175.6 260.3 226.0 296.2September 215.9 174.9 187.7 263.0 224.7 283.7October 214.6 177.2 194.0 259.8 206.4 288.2November 212.1 177.8 195.0 256.0 200.4 274.5December 210.9 179.5 196.8 250.7 196.5 274.0
2013 January 210.5 177.5 198.2 248.0 205.2 267.8February 210.9 179.2 203.0 245.9 206.1 259.2March 213.2 177.6 225.3 244.7 201.1 262.0April 215.5 178.6 258.8 234.6 199.0 252.6May 213.4 174.1 249.8 239.0 199.0 250.1June 209.8 173.1 239.0 236.3 197.8 242.6July 205.6 172.8 236.3 227.3 191.2 239.0August 201.8 175.0 239.1 210.9 185.5 241.7
FAO food price indices
( . . . . . . . . . . . . . . . . . . . . . . . . . . . . . . . . 2002-2004 = 100 . . . . . . . . . . . . . . . . . . . . . . . . . . . . . . . . . . . )
AMIS No. 11 –September 2013 6
Futures Markets
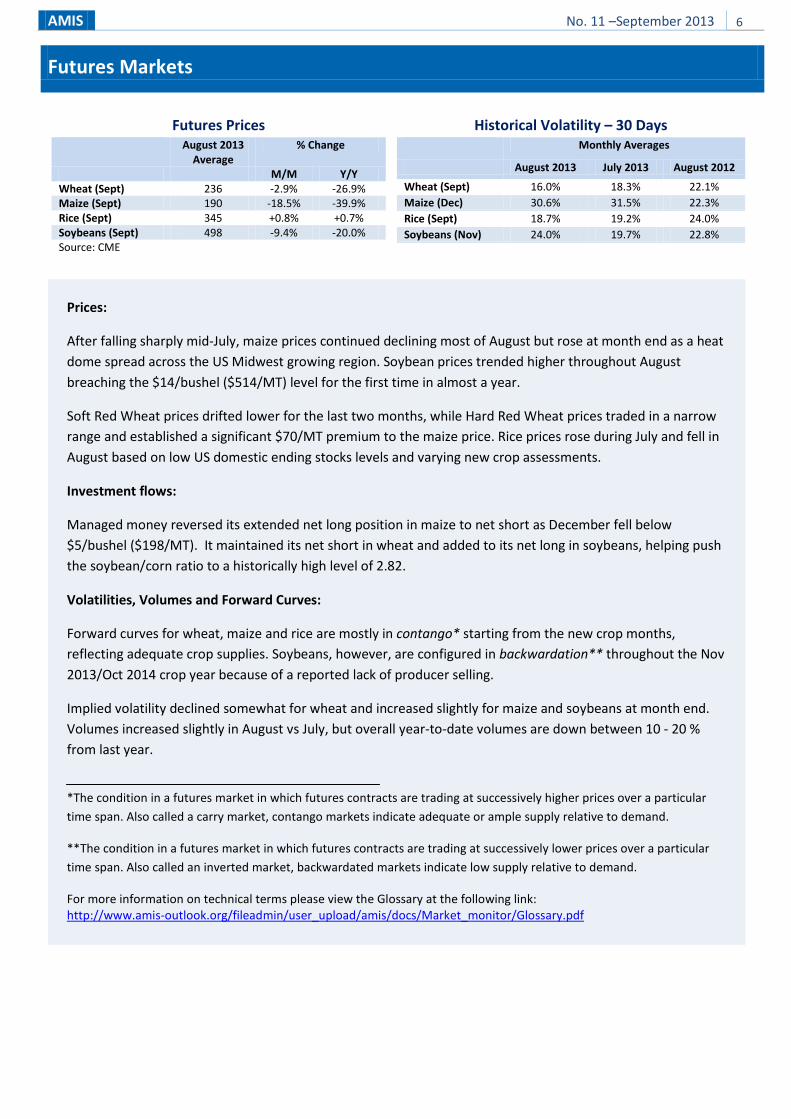
Futures Prices August 2013
Average % Change
M/M Y/Y Wheat (Sept) 236 -2.9% -26.9% Maize (Sept) 190 -18.5% -39.9% Rice (Sept) 345 +0.8% +0.7% Soybeans (Sept) 498 -9.4% -20.0% Source: CME
Historical Volatility – 30 Days
Monthly Averages
August 2013 July 2013 August 2012
Wheat (Sept) 16.0% 18.3% 22.1% Maize (Dec) 30.6% 31.5% 22.3% Rice (Sept) 18.7% 19.2% 24.0% Soybeans (Nov) 24.0% 19.7% 22.8%
Prices:
After falling sharply mid-July, maize prices continued declining most of August but rose at month end as a heat dome spread across the US Midwest growing region. Soybean prices trended higher throughout August breaching the $14/bushel ($514/MT) level for the first time in almost a year.
Soft Red Wheat prices drifted lower for the last two months, while Hard Red Wheat prices traded in a narrow range and established a significant $70/MT premium to the maize price. Rice prices rose during July and fell in August based on low US domestic ending stocks levels and varying new crop assessments.
Investment flows:
Managed money reversed its extended net long position in maize to net short as December fell below $5/bushel ($198/MT). It maintained its net short in wheat and added to its net long in soybeans, helping push the soybean/corn ratio to a historically high level of 2.82.
Volatilities, Volumes and Forward Curves:
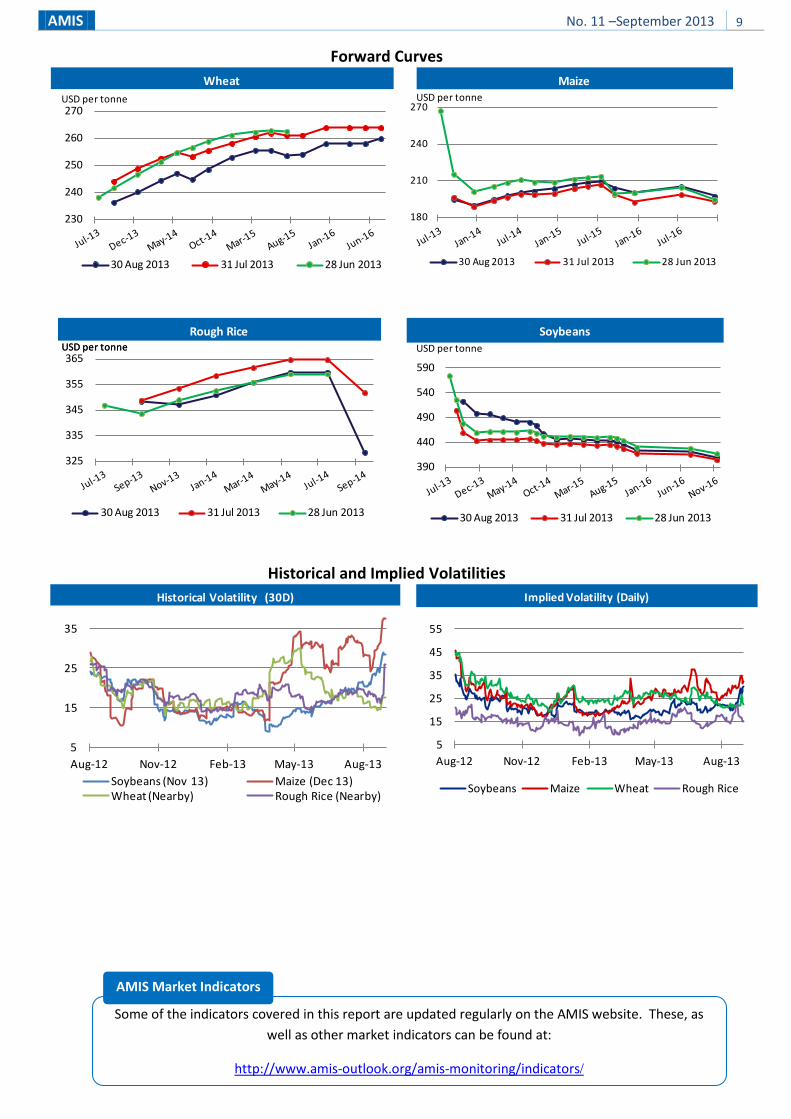
Forward curves for wheat, maize and rice are mostly in contango* starting from the new crop months, reflecting adequate crop supplies. Soybeans, however, are configured in backwardation** throughout the Nov 2013/Oct 2014 crop year because of a reported lack of producer selling.
Implied volatility declined somewhat for wheat and increased slightly for maize and soybeans at month end. Volumes increased slightly in August vs July, but overall year-to-date volumes are down between 10 - 20 % from last year.
*The condition in a futures market in which futures contracts are trading at successively higher prices over a particular time span. Also called a carry market, contango markets indicate adequate or ample supply relative to demand.
**The condition in a futures market in which futures contracts are trading at successively lower prices over a particular time span. Also called an inverted market, backwardated markets indicate low supply relative to demand.
For more information on technical terms please view the Glossary at the following link: http://www.amis-outlook.org/fileadmin/user_upload/amis/docs/Market_monitor/Glossary.pdf
AMIS No. 11 –September 2013 7
Policy Developments
• Adjustments to domestic measures addressing AMIS commodities were made in several countries.
Attempts to sell government rice stocks in Thailand have been met with limited success. These included selling through tenders, releasing on the domestic market at below cost prices and selling via domestic futures exchange. In India, wheat exports from government stocks were approved and Russia continued the release of grains from government stocks. The government of Bangladesh purchased wheat to replenish state reserves. In Vietnam, the government intervention purchase of rice for temporary state reserves was extended by two weeks.
• Conflicting announcements were made as to the level of support price for rice and individual pledging limits for the next season’s crop in Thailand. In Argentina, based on a 1974 law, a measure was taken that allows a domestic price freeze on wheat and flour while it also obliges businesses to maintain supplies of these commodities. In Brazil, minimum support prices for rice grown outside the main producing area were increased.
• In Indonesia, the Protection and Empowerment of Farmers Bill was passed. The Bill grants farmers subsidies, sets up a harvest-failure insurance system, offers easier access to loans, and regulates imports of agricultural products. Specific details of the Bill relevant to AMIS commodities will be reported in future editions of the Monthly Monitor.
• The final annual Renewable Fuels Standards that apply to all gasoline and diesel produced in, or imported
to, the US were announced for year 2013. Compared with the proposed rule released in January 2013, the mandated volume of cellulosic biofuels was more than halved and set at 0.6% of the initial volume foreseen in the Energy Independence and Security Act of 2007. The total mandate and the share of advanced biofuels were maintained at the statutory level, thus shifting the cellulosic shortfall into additional requirements for other advanced biofuels. The compliance date for 2013 standards was extended to 30 June 2014.
• In India, the National Food Security Bill was introduced by executive order. When finally approved, it will offer priority households, estimated to cover about 60% of the population, a monthly entitlement of wheat, rice and coarse grains at subsidized prices.
• A government-to-government trade deal was signed for the purchase by Iran of a total 250 000 tonnes of rice from Thailand and a memorandum of understanding was signed between Vietnam and Comoros for the export 60 000 tonnes of rice annually until 2015.
• With regards to import measures, the import duty on common wheat was raised from 17% to 45% in Morocco. Korea has resumed wheat imports from the US, which had been temporarily suspended following USDA's discovery of unapproved genetically modified wheat in Oregon (US).
AMIS No. 11 –September 2013 8
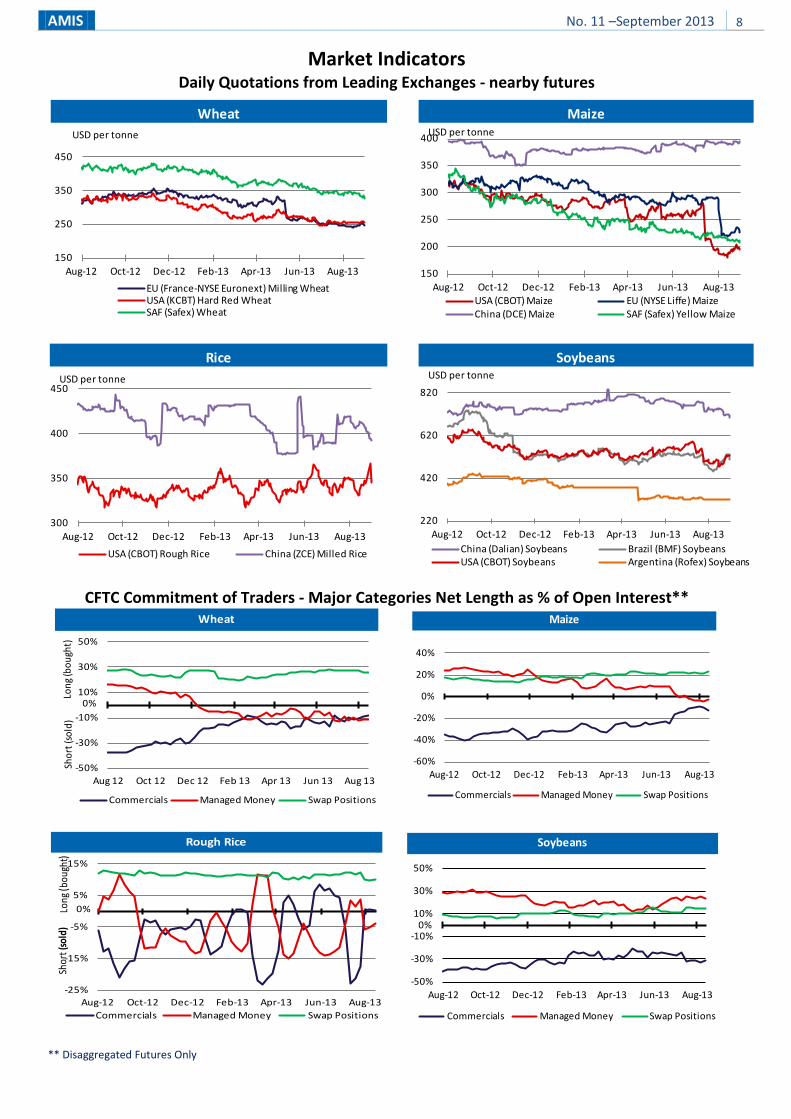
Market Indicators Daily Quotations from Leading Exchanges - nearby futures
CFTC Commitment of Traders - Major Categories Net Length as % of Open Interest**
** Disaggregated Futures Only
150
250
350
450
Aug-12 Oct-12 Dec-12 Feb-13 Apr-13 Jun-13 Aug-13
EU (France-NYSE Euronext) Milling WheatUSA (KCBT) Hard Red WheatSAF (Safex) Wheat
WheatUSD per tonne
150
200
250
300
350
400
Aug-12 Oct-12 Dec-12 Feb-13 Apr-13 Jun-13 Aug-13USA (CBOT) Maize EU (NYSE Liffe) MaizeChina (DCE) Maize SAF (Safex) Yellow Maize
MaizeUSD per tonne
300
350
400
450
Aug-12 Oct-12 Dec-12 Feb-13 Apr-13 Jun-13 Aug-13
USA (CBOT) Rough Rice China (ZCE) Milled Rice
RiceUSD per tonne
220
420
620
820
Aug-12 Oct-12 Dec-12 Feb-13 Apr-13 Jun-13 Aug-13China (Dalian) Soybeans Brazil (BMF) SoybeansUSA (CBOT) Soybeans Argentina (Rofex) Soybeans
SoybeansUSD per tonne
-50%
-30%
-10%
10%
30%
50%
Aug 12 Oct 12 Dec 12 Feb 13 Apr 13 Jun 13 Aug 13
Commercials Managed Money Swap Positions
Shor
t (so
ld)
Long
(bou
ght)
Wheat
0%
-60%
-40%
-20%
0%
20%
40%
Aug-12 Oct-12 Dec-12 Feb-13 Apr-13 Jun-13 Aug-13
Commercials Managed Money Swap Positions
Maize
-25%
-15%
-5%
5%
15%
Aug-12 Oct-12 Dec-12 Feb-13 Apr-13 Jun-13 Aug-13Commercials Managed Money Swap Positions
Rough Rice
0%Long
(bou
ght)
Shor
t(so
ld)
-50%
-30%
-10%
10%
30%
50%
Aug-12 Oct-12 Dec-12 Feb-13 Apr-13 Jun-13 Aug-13
Commercials Managed Money Swap Positions
Soybeans
0%
AMIS No. 11 –September 2013 9
Forward Curves
Historical and Implied Volatilities
230
240
250
260
270
30 Aug 2013 31 Jul 2013 28 Jun 2013
WheatUSD per tonne
180
210
240
270
30 Aug 2013 31 Jul 2013 28 Jun 2013
MaizeUSD per tonne
325
335
345
355
365
30 Aug 2013 31 Jul 2013 28 Jun 2013
USD per tonneRough Rice
USD per tonne
390
440
490
540
590
30 Aug 2013 31 Jul 2013 28 Jun 2013
SoybeansUSD per tonne
5
15
25
35
Aug-12 Nov-12 Feb-13 May-13 Aug-13Soybeans (Nov 13) Maize (Dec 13)Wheat (Nearby) Rough Rice (Nearby)
Historical Volatility (30D)
5
15
25
35
45
55
Aug-12 Nov-12 Feb-13 May-13 Aug-13
Soybeans Maize Wheat Rough Rice
Implied Volatility (Daily)
Some of the indicators covered in this report are updated regularly on the AMIS website. These, as well as other market indicators can be found at:
http://www.amis-outlook.org/amis-monitoring/indicators/
AMIS Market Indicators
AMIS No. 11 –September 2013 10
Explanatory Notes
Main sources Bloomberg, CFTC, CME Group, FAO, GEOGLAM, Inter-Continental Exchange, IGC, USDA, US Federal Reserve, World Bank
2013 Release Dates
07 February, 07 March, 11 April, 09 May, 06 June, 04 July, 05 September, 03 October, 07 November, 05 December
The notions of tightening and easing used in the summary table of “World Supply and Demand” reflect judgmental views which take into account market fundamentals, inter-alia price developments and short-term trends in demand and supply, especially changes in stocks.
All totals (aggregates) are computed from unrounded data. World supply and demand estimates/forecasts published in this report are based on the latest data published by USDA, IGC and FAO. They may vary for many reasons, but mainly because of different methodologies and release dates.
FAO-AMIS: World estimates and forecasts are based on information received from AMIS countries as well as FAO data.
Dates: Refer to the release date of the data from the selected sources: FAO, IGC, and USDA.
Production: Cereal production data refer to the calendar year of the first year shown. Rice production is expressed in milled terms. Soybeans production data refer to the split (i.e. 2013/14) season.
Supply: Defined as production plus opening stocks.
Utilization: For wheat, maize and rice utilization includes food, feed and other uses (“other uses” comprise seeds, industrial utilization and post-harvest losses). For soybeans, it comprises crush, food and other uses.
Trade: Data refer to exports. For wheat and maize, trade is reported on a July/June marketing year basis, except for the USDA maize trade estimates, which are reported on an October/September basis. For rice, trade covers flows from January to December of the second year shown and for soybeans from October to September. Trade between European Union member states is excluded.
Ending Stocks: Data is calculated as the aggregate of carry-overs at the close of national crop seasons ending in the year shown.
AMIS Secretariat Email: [email protected] Download the AMIS Market Monitor or get a free e-mail subscription at : http://www.amis-outlook.org/amis-monitoring
Contacts and Subscriptions