Embed Size (px)
Citation preview
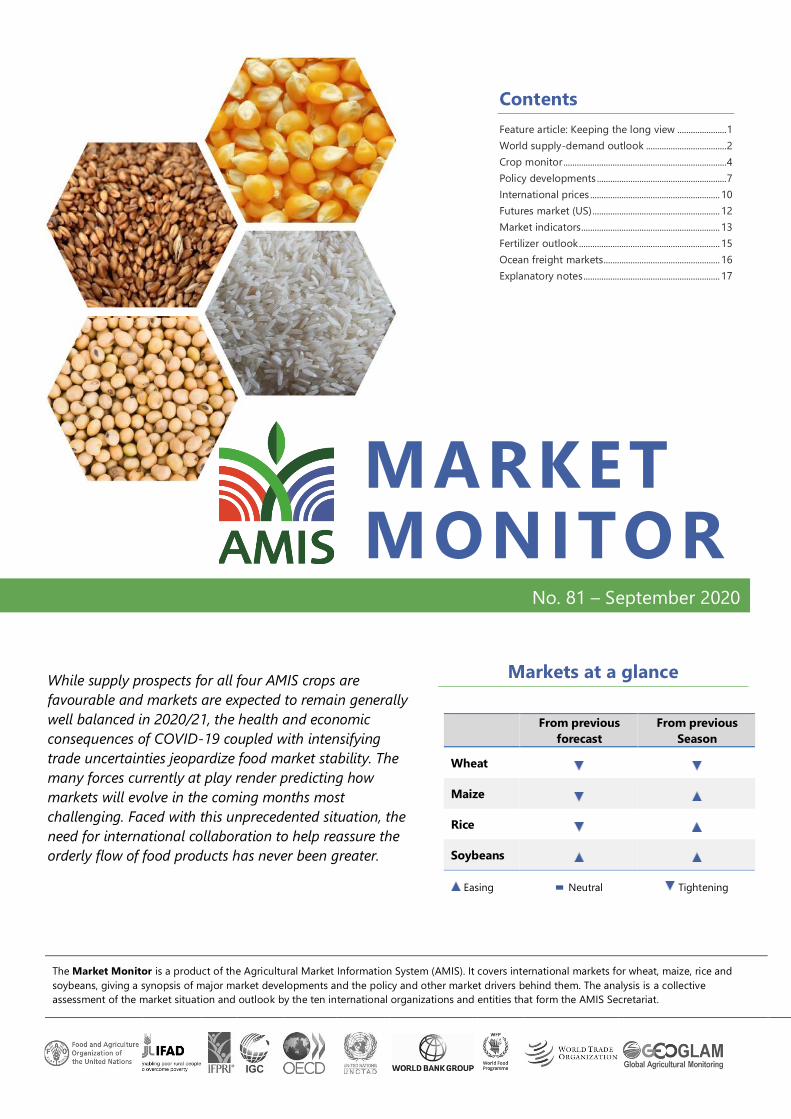
The Market Monitor is a product of the Agricultural Market Information System (AMIS). It covers international markets for wheat, maize, rice and
soybeans, giving a synopsis of major market developments and the policy and other market drivers behind them. The analysis is a collective
assessment of the market situation and outlook by the ten international organizations and entities that form the AMIS Secretariat.
MARKET MONITOR
No. 81 – September 2020
While supply prospects for all four AMIS crops are
favourable and markets are expected to remain generally
well balanced in 2020/21, the health and economic
consequences of COVID-19 coupled with intensifying
trade uncertainties jeopardize food market stability. The
many forces currently at play render predicting how
markets will evolve in the coming months most
challenging. Faced with this unprecedented situation, the
need for international collaboration to help reassure the
orderly flow of food products has never been greater.
From previous
forecast
From previous
Season
Wheat
Maize
Rice
Soybeans
Easing Neutral Tightening
Markets at a glance
Contents
Feature article: Keeping the long view ...................... 1
World supply-demand outlook .................................... 2
Crop monitor ......................................................................... 4
Policy developments .......................................................... 7
International prices .......................................................... 10
Futures market (US) ......................................................... 12
Market indicators.............................................................. 13
Fertilizer outlook ............................................................... 15
Ocean freight markets.................................................... 16
Explanatory notes ............................................................. 17
AMIS Market Monitor No. 81 – September 2020 1
F eat ur e a r t i c l e
Keeping the long view while addressing the short term
The launch of this year’s OECD-FAO Agricultural
Outlook took place amidst the global COVID-19
pandemic. The Outlook’s favourable medium-term
diagnosis of global agricultural markets stood sharply
juxtaposed against the unprecedented disruption of
global economic activity caused by the coronavirus
pandemic and the shutdown measures to contain it. In
recognition of the severity of the shock, this year’s
Outlook report sought to supplement the medium-
term projections with a short-term analysis of the
impact on global agriculture and food systems.
The report finds that over the next ten years supply
growth is going to outpace demand growth, causing
real prices of most commodities to remain at or below
their current levels. Moreover, productivity growth is
going to drive the projected increase in output, easing
pressure on land and resource use. An expanding
global population remains the main driver of demand
growth, although the consumption patterns and
projected trends vary across countries in line with
their level of income and development.
In addition, the report includes a stylized COVID-19
scenario that assumes a significant macro-economic
contraction in 2020 and a mild recovery in 2021.
Global food demand weakens due to the widespread
loss of disposable income, which far outweighs the
disruptions to food supply and thus depresses
agricultural commodity prices. These price declines
compensate the loss in purchasing power for most
consumers, keeping global food consumption almost
unchanged; however, food security for vulnerable
populations, in particular in least developed countries
(LDCs), is going to be at risk. The scenario also
points to the uncertainties surrounding the impact of
the pandemic on agriculture in the medium term. In
particular, medium term impacts on prices will
depend on the timing and scale of supply disruptions
and the path of economic recovery.
If bottlenecks in processing activity or the availability
of intermediate products severely disrupt agricultural
supply and it lags behind the overall economic
recovery, prices will rise. Alternatively, if agricultural
production capacity bounces back from disruptions
and the economic slowdown continues, prices will
decline.
The events in 2020 present a stark example of the
need to balance short-term and long-term policy
objectives. But this tension is not new for policy
makers, particularly since agricultural markets are
inherently volatile. The risk is that – faced with
immediate needs – policy makers respond by
choosing policies that exacerbate market disruptions,
undermining the ability to meet longer term
objectives.
This year, AMIS contributed to ensuring that this
global health crisis did not become a food crisis
through its established mechanisms for enhancing
predictability and policy coordination in international
food markets. In the future, disruptions to food
markets are expected to become more common, for
example as a result of climate change, pests and
diseases, highlighting the need to invest now in
building productive, resilient and sustainable food
systems in the face of uncertainties.
OECD-FAO Agricultural Outlook 2020-2029,
OECD Publishing, Paris/FAO, Rome,
https://doi.org/10.1787/1112c23b-en
2 No. 81 – September 2020 AMIS Market Monitor
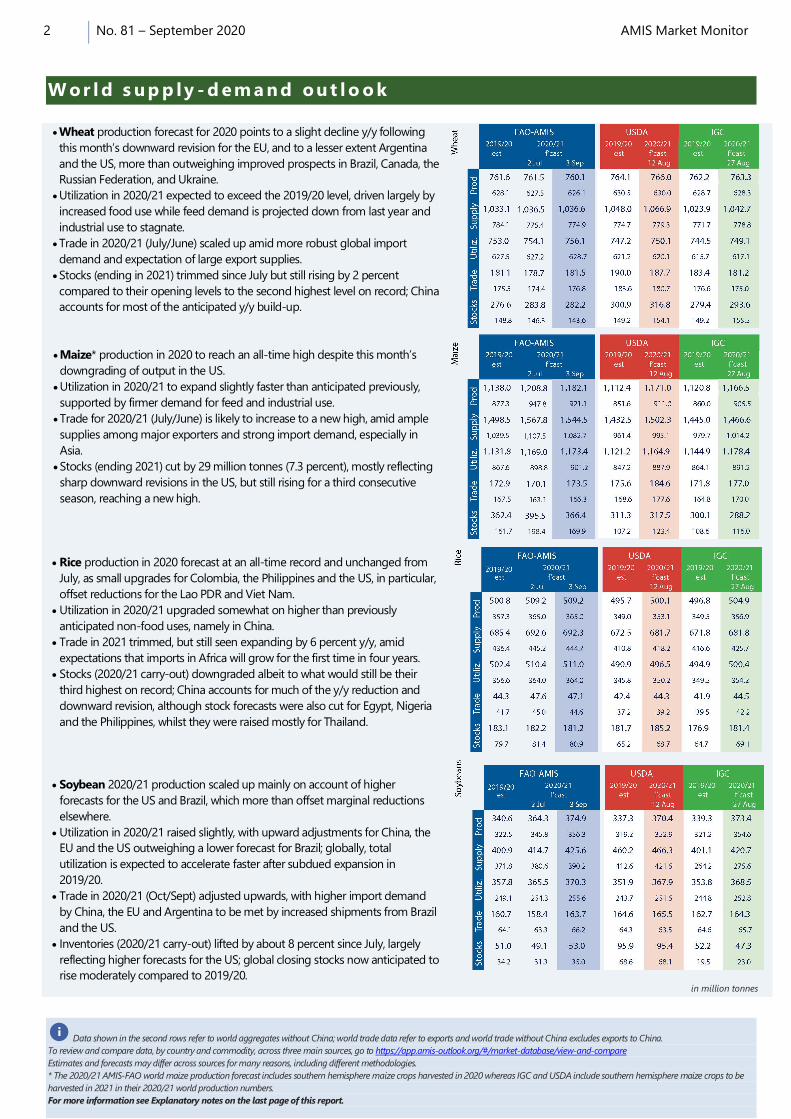
Data shown in the second rows refer to world aggregates without China; world trade data refer to exports and world trade without China excludes exports to China.
To review and compare data, by country and commodity, across three main sources, go to https://app.amis-outlook.org/#/market-database/view-and-compare
Estimates and forecasts may differ across sources for many reasons, including different methodologies.
* The 2020/21 AMIS-FAO world maize production forecast includes southern hemisphere maize crops harvested in 2020 whereas IGC and USDA include southern hemisphere maize crops to be
harvested in 2021 in their 2020/21 world production numbers.
For more information see Explanatory notes on the last page of this report.
i
W or l d s up p ly - d em a nd out l o o k
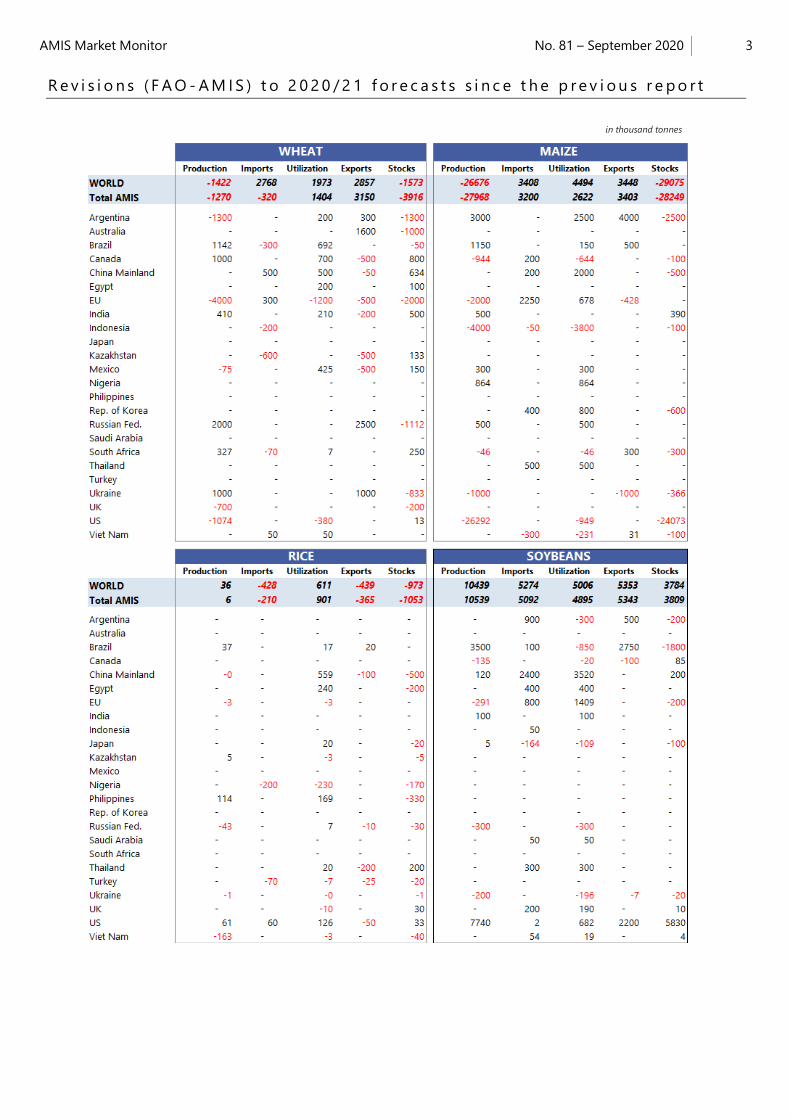
Wheat production forecast for 2020 points to a slight decline y/y following
this month’s downward revision for the EU, and to a lesser extent Argentina
and the US, more than outweighing improved prospects in Brazil, Canada, the
Russian Federation, and Ukraine.
Utilization in 2020/21 expected to exceed the 2019/20 level, driven largely by
increased food use while feed demand is projected down from last year and
industrial use to stagnate.
Trade in 2020/21 (July/June) scaled up amid more robust global import
demand and expectation of large export supplies.
Stocks (ending in 2021) trimmed since July but still rising by 2 percent
compared to their opening levels to the second highest level on record; China
accounts for most of the anticipated y/y build-up.
Maize* production in 2020 to reach an all-time high despite this month’s
downgrading of output in the US.
Utilization in 2020/21 to expand slightly faster than anticipated previously,
supported by firmer demand for feed and industrial use.
Trade for 2020/21 (July/June) is likely to increase to a new high, amid ample
supplies among major exporters and strong import demand, especially in
Asia.
Stocks (ending 2021) cut by 29 million tonnes (7.3 percent), mostly reflecting
sharp downward revisions in the US, but still rising for a third consecutive
season, reaching a new high.
Rice production in 2020 forecast at an all-time record and unchanged from
July, as small upgrades for Colombia, the Philippines and the US, in particular,
offset reductions for the Lao PDR and Viet Nam.
Utilization in 2020/21 upgraded somewhat on higher than previously
anticipated non-food uses, namely in China.
Trade in 2021 trimmed, but still seen expanding by 6 percent y/y, amid
expectations that imports in Africa will grow for the first time in four years.
Stocks (2020/21 carry-out) downgraded albeit to what would still be their
third highest on record; China accounts for much of the y/y reduction and
downward revision, although stock forecasts were also cut for Egypt, Nigeria
and the Philippines, whilst they were raised mostly for Thailand.
Soybean 2020/21 production scaled up mainly on account of higher
forecasts for the US and Brazil, which more than offset marginal reductions
elsewhere.
Utilization in 2020/21 raised slightly, with upward adjustments for China, the
EU and the US outweighing a lower forecast for Brazil; globally, total
utilization is expected to accelerate faster after subdued expansion in
2019/20.
Trade in 2020/21 (Oct/Sept) adjusted upwards, with higher import demand
by China, the EU and Argentina to be met by increased shipments from Brazil
and the US.
Inventories (2020/21 carry-out) lifted by about 8 percent since July, largely
reflecting higher forecasts for the US; global closing stocks now anticipated to
rise moderately compared to 2019/20. in million tonnes
AMIS Market Monitor No. 81 – September 2020 3
R e v i s i o n s ( F A O - A M I S ) t o 2 0 2 0 / 2 1 f o r e c a s t s s i n c e t h e p r e v i o u s r e p o r t
in thousand tonnes
4 No. 81 – September 2020 AMIS Market Monitor
Cr o p m o ni t o r
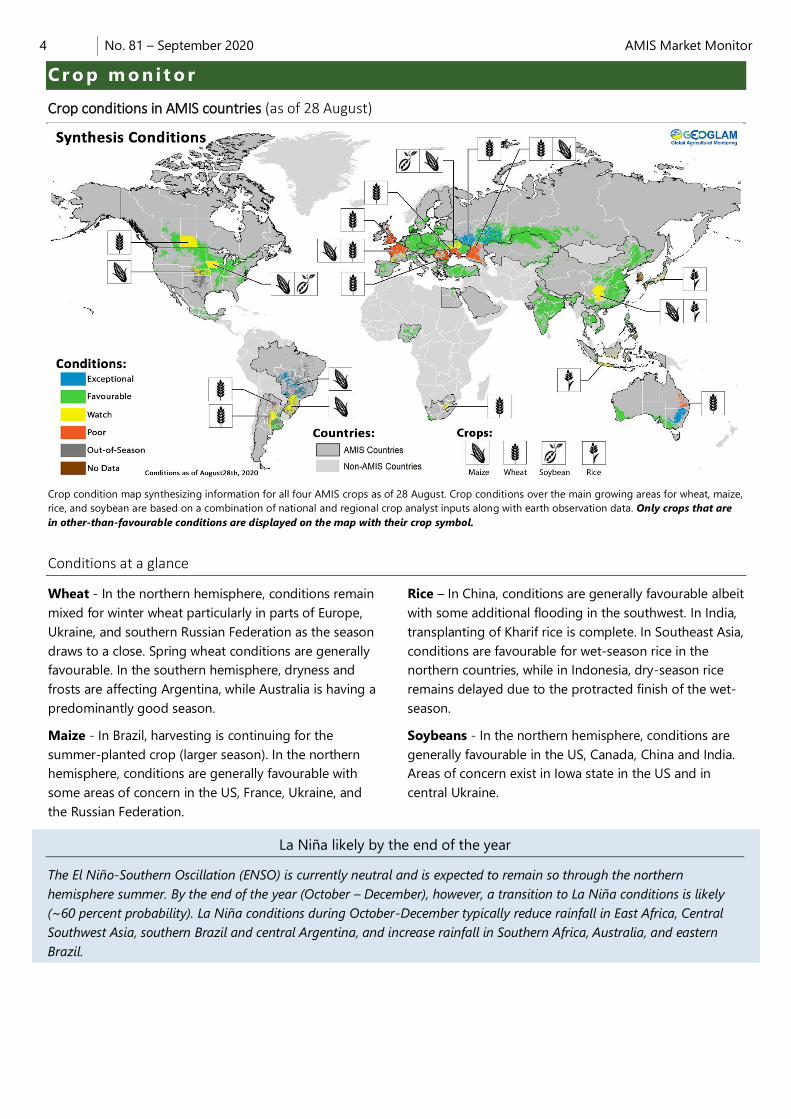
Crop conditions in AMIS countries (as of 28 August)
Crop condition map synthesizing information for all four AMIS crops as of 28 August. Crop conditions over the main growing areas for wheat, maize,
rice, and soybean are based on a combination of national and regional crop analyst inputs along with earth observation data. Only crops that are
in other-than-favourable conditions are displayed on the map with their crop symbol.
Conditions at a glance
Wheat - In the northern hemisphere, conditions remain
mixed for winter wheat particularly in parts of Europe,
Ukraine, and southern Russian Federation as the season
draws to a close. Spring wheat conditions are generally
favourable. In the southern hemisphere, dryness and
frosts are affecting Argentina, while Australia is having a
predominantly good season.
Maize - In Brazil, harvesting is continuing for the
summer-planted crop (larger season). In the northern
hemisphere, conditions are generally favourable with
some areas of concern in the US, France, Ukraine, and
the Russian Federation.
Rice – In China, conditions are generally favourable albeit
with some additional flooding in the southwest. In India,
transplanting of Kharif rice is complete. In Southeast Asia,
conditions are favourable for wet-season rice in the
northern countries, while in Indonesia, dry-season rice
remains delayed due to the protracted finish of the wet-
season.
Soybeans - In the northern hemisphere, conditions are
generally favourable in the US, Canada, China and India.
Areas of concern exist in Iowa state in the US and in
central Ukraine.
La Niña likely by the end of the year
The El Niño-Southern Oscillation (ENSO) is currently neutral and is expected to remain so through the northern
hemisphere summer. By the end of the year (October – December), however, a transition to La Niña conditions is likely
(~60 percent probability). La Niña conditions during October-December typically reduce rainfall in East Africa, Central
Southwest Asia, southern Brazil and central Argentina, and increase rainfall in Southern Africa, Australia, and eastern
Brazil.
AMIS Market Monitor No. 81 – September 2020 5
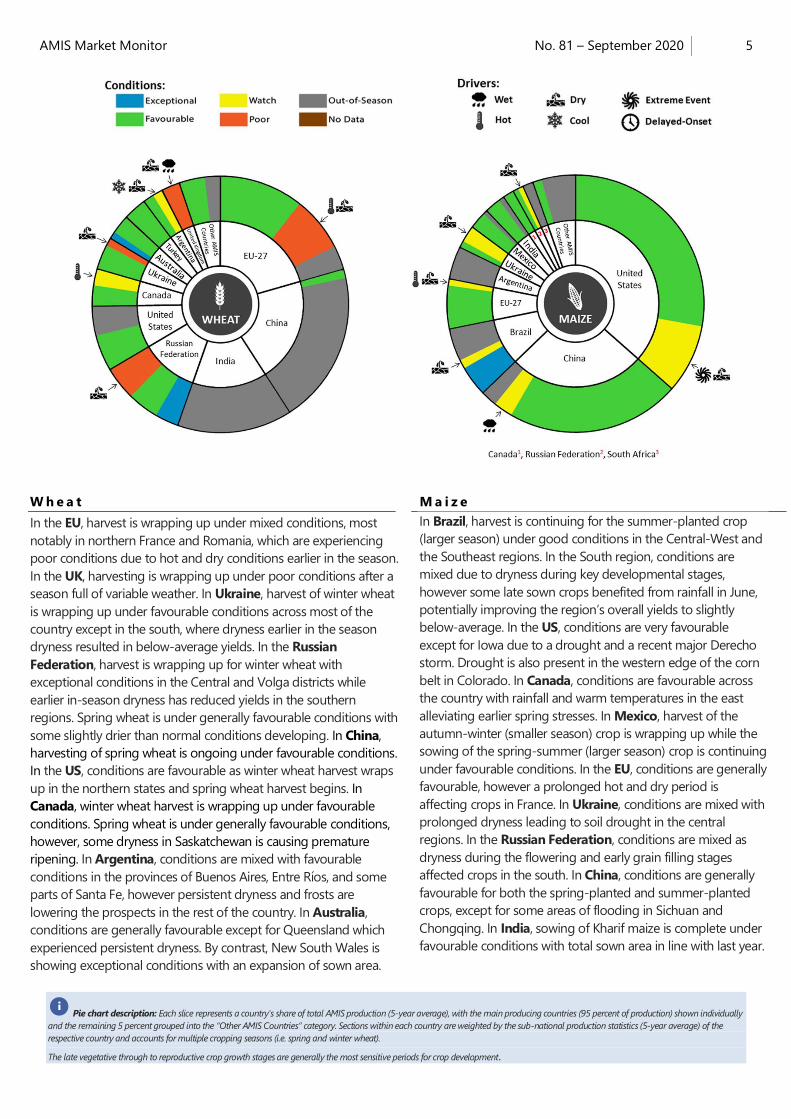
Pie chart description: Each slice represents a country's share of total AMIS production (5-year average), with the main producing countries (95 percent of production) shown individually
and the remaining 5 percent grouped into the “Other AMIS Countries” category. Sections within each country are weighted by the sub-national production statistics (5-year average) of the
respective country and accounts for multiple cropping seasons (i.e. spring and winter wheat).
The late vegetative through to reproductive crop growth stages are generally the most sensitive periods for crop development.
i
W h e a t
In the EU, harvest is wrapping up under mixed conditions, most
notably in northern France and Romania, which are experiencing
poor conditions due to hot and dry conditions earlier in the season.
In the UK, harvesting is wrapping up under poor conditions after a
season full of variable weather. In Ukraine, harvest of winter wheat
is wrapping up under favourable conditions across most of the
country except in the south, where dryness earlier in the season
dryness resulted in below-average yields. In the Russian
Federation, harvest is wrapping up for winter wheat with
exceptional conditions in the Central and Volga districts while
earlier in-season dryness has reduced yields in the southern
regions. Spring wheat is under generally favourable conditions with
some slightly drier than normal conditions developing. In China,
harvesting of spring wheat is ongoing under favourable conditions.
In the US, conditions are favourable as winter wheat harvest wraps
up in the northern states and spring wheat harvest begins. In
Canada, winter wheat harvest is wrapping up under favourable
conditions. Spring wheat is under generally favourable conditions,
however, some dryness in Saskatchewan is causing premature
ripening. In Argentina, conditions are mixed with favourable
conditions in the provinces of Buenos Aires, Entre Ríos, and some
parts of Santa Fe, however persistent dryness and frosts are
lowering the prospects in the rest of the country. In Australia,
conditions are generally favourable except for Queensland which
experienced persistent dryness. By contrast, New South Wales is
showing exceptional conditions with an expansion of sown area.
M a i z e
In Brazil, harvest is continuing for the summer-planted crop
(larger season) under good conditions in the Central-West and
the Southeast regions. In the South region, conditions are
mixed due to dryness during key developmental stages,
however some late sown crops benefited from rainfall in June,
potentially improving the region’s overall yields to slightly
below-average. In the US, conditions are very favourable
except for Iowa due to a drought and a recent major Derecho
storm. Drought is also present in the western edge of the corn
belt in Colorado. In Canada, conditions are favourable across
the country with rainfall and warm temperatures in the east
alleviating earlier spring stresses. In Mexico, harvest of the
autumn-winter (smaller season) crop is wrapping up while the
sowing of the spring-summer (larger season) crop is continuing
under favourable conditions. In the EU, conditions are generally
favourable, however a prolonged hot and dry period is
affecting crops in France. In Ukraine, conditions are mixed with
prolonged dryness leading to soil drought in the central
regions. In the Russian Federation, conditions are mixed as
dryness during the flowering and early grain filling stages
affected crops in the south. In China, conditions are generally
favourable for both the spring-planted and summer-planted
crops, except for some areas of flooding in Sichuan and
Chongqing. In India, sowing of Kharif maize is complete under
favourable conditions with total sown area in line with last year.
6 No. 81 – September 2020 AMIS Market Monitor
Sources and Disclaimers: The Crop Monitor assessment is conducted by GEOGLAM with inputs from the following partners (in alphabetical order): Argentina (Buenos Aires Grains
Exchange, INTA), Asia Rice Countries (AFSIS, ASEAN+3 & Asia RiCE), Australia (ABARES & CSIRO), Brazil (CONAB & INPE), Canada (AAFC), China (CAS), EU (EC JRC MARS), Indonesia
(LAPAN & MOA), International (CIMMYT, FAO, IFPRI & IRRI), Japan (JAXA), Mexico (SIAP), Russian Federation (IKI), South Africa (ARC & GeoTerraImage & SANSA), Thailand (GISTDA &
OAE), Ukraine (NASU-NSAU & UHMC), USA (NASA, UMD, USGS – FEWS NET, USDA (FAS, NASS)), Viet Nam (VAST & VIMHE-MARD). The findings and conclusions in this joint multiagency
report are consensual statements from the GEOGLAM experts, and do not necessarily reflect those of the individual agencies represented by these experts.
More detailed information on the GEOGLAM crop assessments is available at www.geoglam-crop-monitor.org
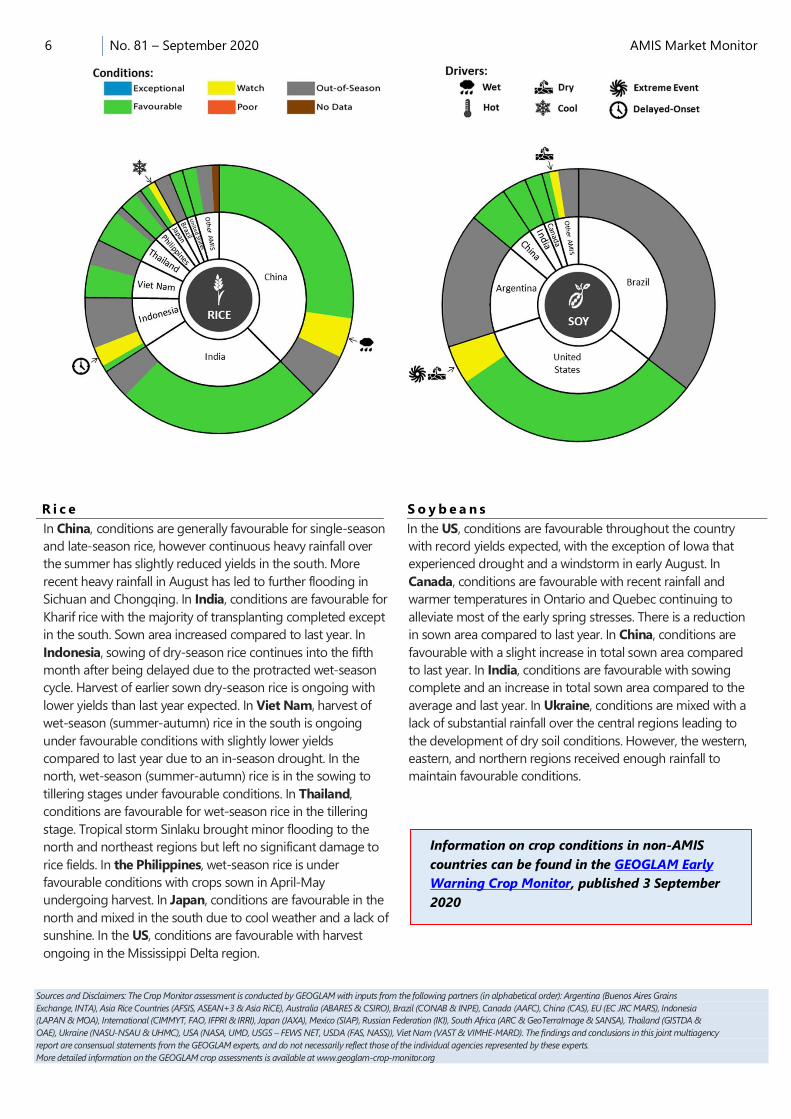
R i c e
In China, conditions are generally favourable for single-season
and late-season rice, however continuous heavy rainfall over
the summer has slightly reduced yields in the south. More
recent heavy rainfall in August has led to further flooding in
Sichuan and Chongqing. In India, conditions are favourable for
Kharif rice with the majority of transplanting completed except
in the south. Sown area increased compared to last year. In
Indonesia, sowing of dry-season rice continues into the fifth
month after being delayed due to the protracted wet-season
cycle. Harvest of earlier sown dry-season rice is ongoing with
lower yields than last year expected. In Viet Nam, harvest of
wet-season (summer-autumn) rice in the south is ongoing
under favourable conditions with slightly lower yields
compared to last year due to an in-season drought. In the
north, wet-season (summer-autumn) rice is in the sowing to
tillering stages under favourable conditions. In Thailand,
conditions are favourable for wet-season rice in the tillering
stage. Tropical storm Sinlaku brought minor flooding to the
north and northeast regions but left no significant damage to
rice fields. In the Philippines, wet-season rice is under
favourable conditions with crops sown in April-May
undergoing harvest. In Japan, conditions are favourable in the
north and mixed in the south due to cool weather and a lack of
sunshine. In the US, conditions are favourable with harvest
ongoing in the Mississippi Delta region.
S o y b e a n s
In the US, conditions are favourable throughout the country
with record yields expected, with the exception of Iowa that
experienced drought and a windstorm in early August. In
Canada, conditions are favourable with recent rainfall and
warmer temperatures in Ontario and Quebec continuing to
alleviate most of the early spring stresses. There is a reduction
in sown area compared to last year. In China, conditions are
favourable with a slight increase in total sown area compared
to last year. In India, conditions are favourable with sowing
complete and an increase in total sown area compared to the
average and last year. In Ukraine, conditions are mixed with a
lack of substantial rainfall over the central regions leading to
the development of dry soil conditions. However, the western,
eastern, and northern regions received enough rainfall to
maintain favourable conditions.
Information on crop conditions in non-AMIS
countries can be found in the GEOGLAM Early
Warning Crop Monitor, published 3 September
2020
AMIS Market Monitor No. 81 – September 2020 7
AMIS Policy database
Visit the AMIS Policy database at: http://statistics.amis-outlook.org/policy/
The AMIS Policy database gathers information on trade measures and domestic measures related to the four AMIS crops (wheat, maize, rice, and soybeans) as well as biofuels. The design of
this database allows comparisons across countries, across commodities and across policies for selected periods of time.
Only AMIS participants are marked in bold.
i
P o l i c y d e v e l o p m ent s
W h e a t
Upon recommendation by the Wheat Industry
Association in Brazil, on 8 July the Foreign Chamber of
Commerce increased the volume of the duty-free wheat
import quota for non-MERCOSUR countries from
750 thousand tonnes to 1.2 million tonnes. The import
quota will be valid until November 2020.
On 17 July, Brazil notified the WTO of the adoption of
maximum residue levels (MRLs) for a range of plant
protection chemicals used in wheat
(G/SPS/N/BRA/1603/Add.1 and 1604/Add.1).
On 9 July, Saudi Arabia announced the completion of
the first phase of privatisation of the state-owned wheat
milling sector, opening the way for wheat to be directly
purchased from the global market. The final stage of the
privatisation of the milling sector was launched 14 July.
On 18 August, the Ministry of Economy in Ukraine set
the wheat export cap at 17.5 million tonnes during the
2020/21 (July/June) marketing year. An estimated
20.5 million tonnes of wheat were exported in the
2019/2020 marketing season.
The US–Mexico–Canada Agreement (USMCA) entered
into force on 1 July. Giving effect to the USMCA, the
Canada Grain Act and Canada Grain Regulations were
amended on 24 June to exempt US wheat from country of
origin statements on inspection certificates.
M a i z e
On 16 July, Brazil notified the WTO of the adoption of
MRLs for dicamba in maize (G/SPS/N/BRA/1629/Add.1).
On 17 August, proposed MRLs were also notified for
glyphosate used on genetically modified maize cultures
(G/SPS/N/BRA/1698).
On 23 July, China notified the WTO of new quality
requirements applicable to maize seeds
(G/TBT/N/CHN/1439).
Owing to EU's automatic tariff adjustment mechanism
(EU regulation 642/2010), import duties on maize,
sorghum and rye in the European Union moved back to
duty-free status on 3 July; to EUR 5.48 (USD 6.42) per
tonne on 12 August; to EUR 0.26 (USD 0.31) per tonne on
25 August, and back to duty- free as of 26 August. To
track fluctuations prior to 3 July, see May-July editions of
the Market Monitor.
On 13 July, as part of efforts to incentivise local
production, the Central Bank of Nigeria instructed the
relevant operating agencies to suspend the issuance of
import licenses for maize.
R i c e
On 16 July, Brazil notified the WTO of the adoption of MRLs
for abamectin (G/SPS/N/BRA/1615/Add.1). New MRLs were
also proposed for cyantraniliprole and beta-cyfluthrin in rice
(BRA/1728 and 1734; deadline for comments: 12 September).
On 4 August, Canada notified the WTO of proposed new
MRLs for the pesticide triflumezopyrim used on rice
(G/SPS/N/CAN/1323, comment period up to 12 October).
On 1 July, Japan proposed new pesticide MRLs for
heptachlor applicable to rice straw, rice whole crop silage and
unprocessed rice (G/SPS/N/JPN/763, comment period up to
30 August).
On 27 July, the MERCOSUR proposed modifying to GMC
Resolution No. 12/11 "Mercosur Technical Regulation on
Maximum Limits of Inorganic Contaminants in Foods" that
seeks to align MRLs for arsenic in rice with existing Codex
standards (G/TBT/N/URY/37; comment period up to 25
September). Argentina followed suit on 6 August by notifying
the adoption of new MRLs for arsenic (G/SPS/N/ARG/240;
deadline for comments: 12 October).
On 6 August, the Philippines notified proposed new MRLs
for arsenic on a range of rice varieties, including husked and
brown rice G/SPS/N/PHL/464; comment deadline 5 October).
On 17 July, Thailand's Rice Policy Committee announced
that guaranteed prices would remain unchanged for the
2020/21 crop season.
On 29 July, the US notified amendment to MRLs for the
herbicide quinclorac used in rice cultivation
(G/SPS/N/USA/3190).
S o y b e a n s
On 4 August, Brazil notified proposed MRLs for
flupyradifurnone in soy cultures (G/SPS/N/BRA/1741), with
a comments period running until 26 September.
On 30 July, Japan notified proposed new MRLs for
pyrimidifen in soybeans (G/SPS/N/JPN/771). The final date
for comments is 28 September.
B i o f u e l s
On 13 August, amid expectations of short supplies and
recovering diesel consumption, the National Petroleum
Agency in Brazil reduced the volume of biodiesel blended
with diesel sold at the pump to 10 percent from
12 percent, for September and October 2020.
On 4 August, the European Commission launched a
public consultation on revision of the 2018 Renewable
Energy Directive (REDII). An impact assessment will also be
conducted to evaluate the extent to which REDII needs to
8 No. 81 – September 2020 AMIS Market Monitor
be aligned with the EU’s new Green Deal and its 2050
climate neutral objective. Stakeholders have until 21
September to comment.
On 29 July, at the request of Indonesia, the WTO
established a panel to review certain measures taken by
the EU on palm oil and oil palm crop-based biofuels
(DS593), including alleged possible inconsistencies with
provisions under the GATT 1994, the Agreement on
Subsidies and Countervailing Measures, and the
Agreement on Technical Barriers to Trade.
A c r o s s t h e b o a r d
On 17 July Brazil adopted new MRLs
(G/SPS/N/BRA/1618/Add.1 and 1622/Add.1) used on
several crops (e.g., maize, wheat, soy cultures). On 27 July,
the proposed adoption of MRLs for several plant
protection substances applicable to agricultural products
such as wheat and sorghum, was also notified (BRA/1688,
1710, 1723, 1735 and 1740), with a 29 August deadline for
comments.
On 21 July 2020, China announced plans to sell rice and
wheat from public reserves to feed producers via state
firms rather than through auctions. In a first step, around
10 million tonnes of rice would be sold at CNY 1000 (USD
143) per tonne.
On 22 July, the Ministry of Agriculture and Rural
Development and the Ministry of Finance in China jointly
allocated CNY 330 million (USD 47 million) to a disaster
relief fund to assist impacted agricultural sectors in
southern provinces. As of 31 July, both ministries have also
jointly allocated CNY 11.48 billion (1.7 billion) to farm
machinery subsidies to help 1.21 million rural households,
prioritizing key staple crops such as rice and wheat as well
as the pig sector.
On 9 July, China and the EU agreed to the protection of
geographical indications for a range of agricultural
products, including rice from Zhaoyuan, Wuchang, Ningxia,
Panjin, Kiamusze and Helong; rice wine from Shaoxing and
Huishui; as well as soybean from Muling.
In July, owing to the COVID-19 pandemic, the Ministry of
Finance in Egypt announced the provision of EGP 4 billion
(USD 252 million) to the General Authority for Supply
Commodities (GASC), the state grains authority, as part of
funding to cover (i) the costs for the food subsidy card
system, breadmaking and distribution expenses, as well as
(ii) the purchase of locally grown wheat.
In July and August, the EU notified the WTO of proposed
lowering of MRLs for a range of substances that are
applied to several food products, including wheat, rye,
barley, oats, sorghum cultures, maize and rice
(G/SPS/N/EU/394, 395, 396, 398). New MRLs were also
adopted for phytosanitary products applied on wheat, rye,
barley, oats, maize and rice (Commission Regulation (EU)
2020/770 and 2020/1085; G/SPS/N/EU/347/Add.1 and
360/Add.1). Regulation (EU) 2020/1191 was issued on 19
August to prevent the introduction and spread of Tomato
Brown Rugose Fruit Virus within the EU in wheat, sorghum,
oats, maize and rice (G/SPS/N/EU/407).
In July, the EU and the US updated the WTO on the
COVID-19 recovery packages respectively implemented to
assist the agriculture and agri-food sectors as well as
vulnerable consumer groups (G/AG/GEN/159/ADD.1 and
161). On 11 August, USDA further announced the
extension of the Coronavirus Food Assistance Programme
(CFAP) application deadline to 11 September.
On 30 June, India extended the free rations regime
(Pradhan Mantri Garib Kalyan Package) until the end of
November. The programme had been initially launched in
response to COVID-19 on 1 April till 30 June, allowing the
free distribution of 5 kg of wheat or rice and 1 kg of
legumes to 800 million people. On 1 July, the Cabinet
Committee on Economic Affairs increased the minimum
support prices (MSPs) of the mandated kharif (fall
harvested) crops for 2020/21 (July-June) by 2.1 percent to
7.5 percent over last year.
On 23 August, the Food Safety and Standards Authority
in India issued an order requiring traders to declare that
imported food crop products, including maize, wheat, rice,
soybean, are not genetically modified and are of non-GM
origin, beginning on 1 January 2021. While a draft GM
regulation is under consideration, the interim order is
expected to lead to stricter inspection of imported
consignments at Indian ports.
On 5 July, the Indonesia-Australia Comprehensive
Economic Partnership Agreement entered into force. All
tariffs levied on imports from Indonesia were eliminated.
Some 500 000 tonnes of Australian feed grains (wheat,
sorghum, and barley) enjoy duty-free access in Indonesia.
This volume will be progressively increased over an 11-year
implementation period.
In July and August, Japan notified the WTO of proposed
amendments to MRLs for plant protection substances
applied to a variety of agricultural products including
wheat, maize and soybeans (G/SPS/N/JPN/764) as well as
new pesticide MRLS used on several food products
including wheat, rye, barley, oats, maize, soybean and rice
(JPN/767, 770 and 774).
On 12 August, Mexico announced that the use of
glyphosate would be gradually phased out in late 2024.
The Federal Ministries of Environment and Agriculture and
Rural Development are working jointly to establish a phase
out schedule.
On 13 August, the Ministry of Agriculture, Land Reform
and Rural Development in South Africa extended the
validity period of the COVID-19 Disaster Agricultural
Support Fund Voucher up to 30 September 2020, as supply
chain disruptions continued affecting the availability of
agricultural production inputs.
AMIS Market Monitor No. 81 – September 2020 9
On 17 August, the US approved a Federal Disaster
Declaration following the impact of a Derecho storm,
which damaged a large part of Iowa’s maize and soybean
crops as well as infrastructure and storage facilities. USDA
assistance will be made available to impacted farmers
through various farm programmes. On 24 August, updated
Farm Bill 2018 regulations relating to farm subsidy
program applicability, eligibility conditions and tighter
payment limitations were also published in the US Federal
Register.
On 24 August, the US notified the WTO of the adoption
of new MRLs for the pesticide ingredient pethoxamid used
on maize and soybeans (G/SPS/N/USA/3195).
L o g i s t i c s a n d t r a d e J u n c t u r e
On 28 July, grains operator COFCO and Bunge halted
production in Argentina as a result of increased instances
of COVID-19 amongst workers. Soybean deliveries were
redirected to other ports and third-party facilities within
Argentina.
On 27 July, Indian rice exports suffered disruptions at
the port of Kakinada, which handles one fourth of rice
exports, due to the impacts of the COVID-19 pandemic,
including labour shortage and limited container
availability.
On 7 July, the European Bank for Reconstruction and
Development (EBRD) announced a working capital loan
worth EUR 7 million (USD 8.3 million) to be invested in the
farming and grain storage operations of Ukraine’s Grain
Alliance Group, which have been affected by the
COVID-19 pandemic. Grain storage facilities will be
expanded, and energy efficiency measures introduced,
with technical assistance being provided by the
government of Japan.
S t o p - p r e s s
On 25 June, as part of a wider initiative aimed to reduce
reliance on imports of staple foods, Indonesia’s Ministry
of Agriculture announced plans to develop a farm estate
of approximately 164 000 hectares on the Island of
Borneo in Central Kalimantan Province to address food
security concerns. The first phase is projected to take
place between October 2020 and March 2021. The
designated farmland will be used to produce national
stocks of foodstuffs such as rice and maize. In case of
emergency, those stocks will be distributed domestically,
and any excess will be exported.
AMIS Market Monitor No. 81 – September 2020 10
In t e r nat i o na l p r i c es
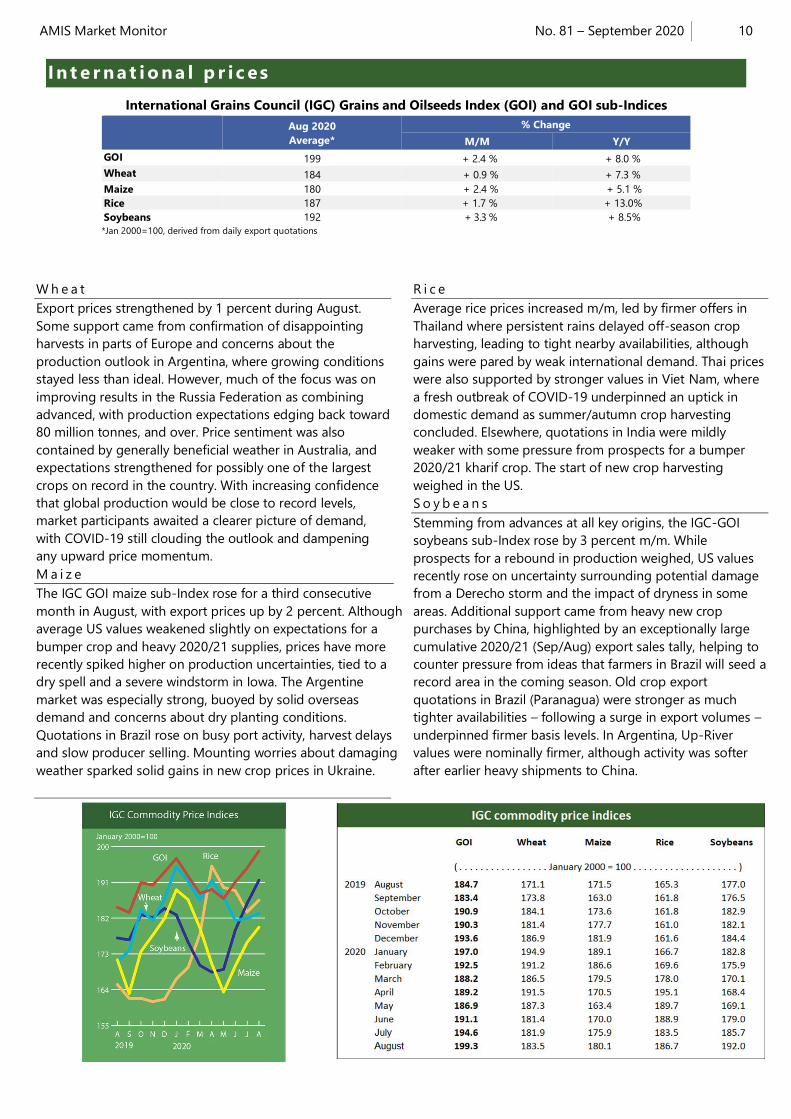
International Grains Council (IGC) Grains and Oilseeds Index (GOI) and GOI sub-Indices
Aug 2020
Average*
% Change
M/M Y/Y
GOI 199 + 2.4 % + 8.0 %
Wheat 184 + 0.9 % + 7.3 %
Maize 180 + 2.4 % + 5.1 %
Rice 187 + 1.7 % + 13.0%
Soybeans 192 + 3.3 % + 8.5%
*Jan 2000=100, derived from daily export quotations
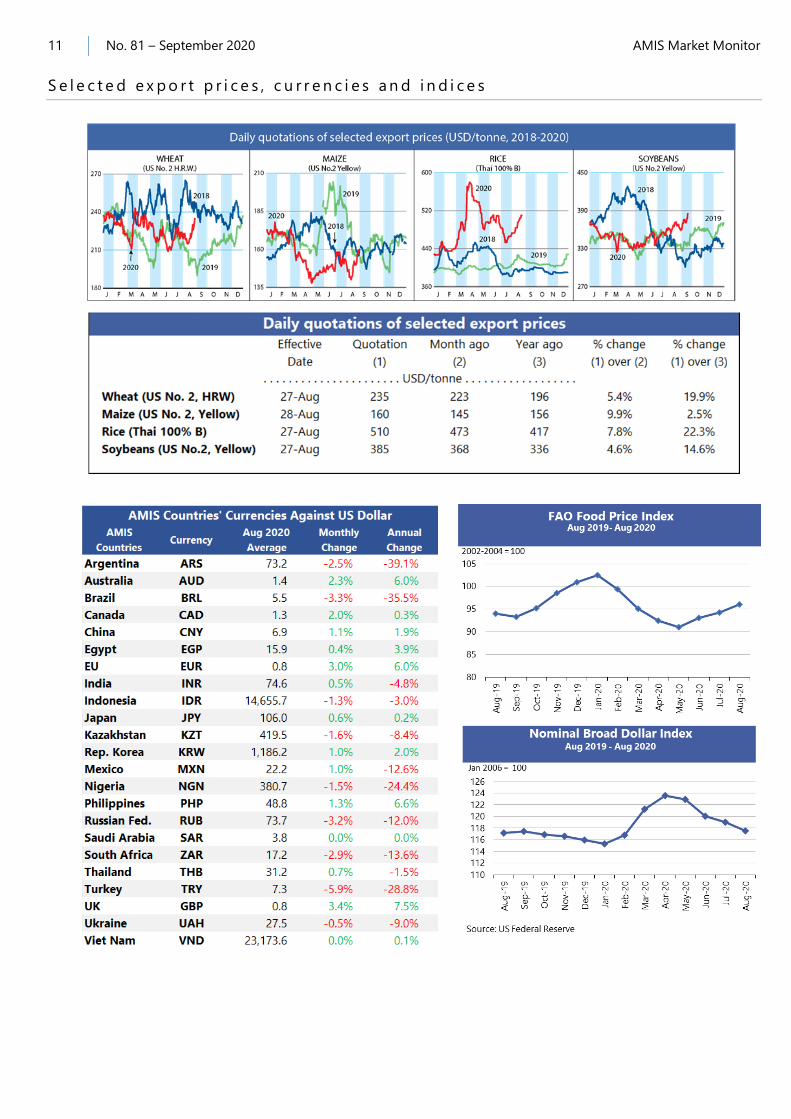
W h e a t
Export prices strengthened by 1 percent during August.
Some support came from confirmation of disappointing
harvests in parts of Europe and concerns about the
production outlook in Argentina, where growing conditions
stayed less than ideal. However, much of the focus was on
improving results in the Russia Federation as combining
advanced, with production expectations edging back toward
80 million tonnes, and over. Price sentiment was also
contained by generally beneficial weather in Australia, and
expectations strengthened for possibly one of the largest
crops on record in the country. With increasing confidence
that global production would be close to record levels,
market participants awaited a clearer picture of demand,
with COVID-19 still clouding the outlook and dampening
any upward price momentum.
M a i z e
The IGC GOI maize sub-Index rose for a third consecutive
month in August, with export prices up by 2 percent. Although
average US values weakened slightly on expectations for a
bumper crop and heavy 2020/21 supplies, prices have more
recently spiked higher on production uncertainties, tied to a
dry spell and a severe windstorm in Iowa. The Argentine
market was especially strong, buoyed by solid overseas
demand and concerns about dry planting conditions.
Quotations in Brazil rose on busy port activity, harvest delays
and slow producer selling. Mounting worries about damaging
weather sparked solid gains in new crop prices in Ukraine.
R i c e
Average rice prices increased m/m, led by firmer offers in
Thailand where persistent rains delayed off-season crop
harvesting, leading to tight nearby availabilities, although
gains were pared by weak international demand. Thai prices
were also supported by stronger values in Viet Nam, where
a fresh outbreak of COVID-19 underpinned an uptick in
domestic demand as summer/autumn crop harvesting
concluded. Elsewhere, quotations in India were mildly
weaker with some pressure from prospects for a bumper
2020/21 kharif crop. The start of new crop harvesting
weighed in the US.
S o y b e a n s
Stemming from advances at all key origins, the IGC-GOI
soybeans sub-Index rose by 3 percent m/m. While
prospects for a rebound in production weighed, US values
recently rose on uncertainty surrounding potential damage
from a Derecho storm and the impact of dryness in some
areas. Additional support came from heavy new crop
purchases by China, highlighted by an exceptionally large
cumulative 2020/21 (Sep/Aug) export sales tally, helping to
counter pressure from ideas that farmers in Brazil will seed a
record area in the coming season. Old crop export
quotations in Brazil (Paranagua) were stronger as much
tighter availabilities – following a surge in export volumes –
underpinned firmer basis levels. In Argentina, Up-River
values were nominally firmer, although activity was softer
after earlier heavy shipments to China.
11 No. 81 – September 2020 AMIS Market Monitor
S e l e c t e d e x p o r t p r i c e s , c u r r e n c i e s a n d i n d i c e s
AMIS Market Monitor No. 81 – September 2020 12
AMIS Market indicators
Some of the indicators covered in this report are updated regularly on the AMIS website. These, as well as other market indicators, can be found at:
http://www.amis-outlook.org/amis-monitoring/indicators/
*For more information about Forward Curves see the feature article in No. 75 February AMIS Market Monitor 2020.
i
Fut ur es ma r k et (US )
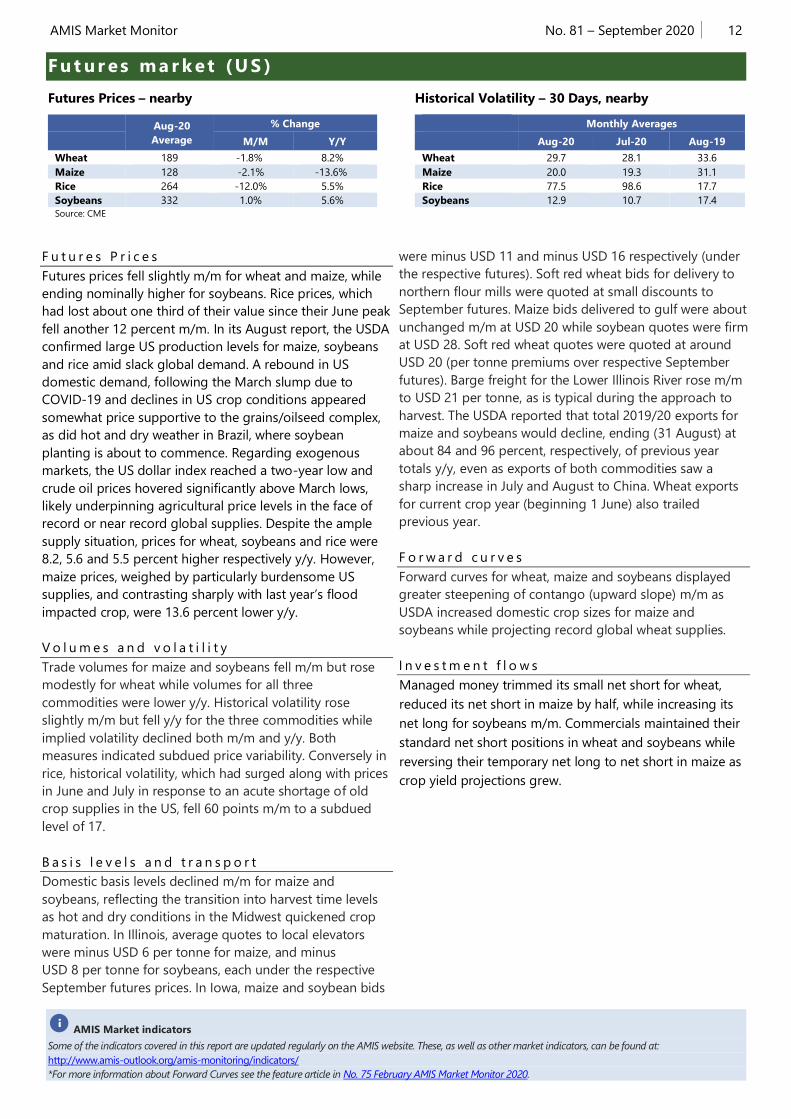
Futures Prices – nearby
Aug-20
Average
% Change
M/M Y/Y
Wheat 189 -1.8% 8.2%
Maize 128 -2.1% -13.6%
Rice 264 -12.0% 5.5%
Soybeans 332 1.0% 5.6%
Source: CME
Historical Volatility – 30 Days, nearby
Monthly Averages
Aug-20 Jul-20 Aug-19
Wheat 29.7 28.1 33.6
Maize 20.0 19.3 31.1
Rice 77.5 98.6 17.7
Soybeans 12.9 10.7 17.4
F u t u r e s P r i c e s
Futures prices fell slightly m/m for wheat and maize, while
ending nominally higher for soybeans. Rice prices, which
had lost about one third of their value since their June peak
fell another 12 percent m/m. In its August report, the USDA
confirmed large US production levels for maize, soybeans
and rice amid slack global demand. A rebound in US
domestic demand, following the March slump due to
COVID-19 and declines in US crop conditions appeared
somewhat price supportive to the grains/oilseed complex,
as did hot and dry weather in Brazil, where soybean
planting is about to commence. Regarding exogenous
markets, the US dollar index reached a two-year low and
crude oil prices hovered significantly above March lows,
likely underpinning agricultural price levels in the face of
record or near record global supplies. Despite the ample
supply situation, prices for wheat, soybeans and rice were
8.2, 5.6 and 5.5 percent higher respectively y/y. However,
maize prices, weighed by particularly burdensome US
supplies, and contrasting sharply with last year’s flood
impacted crop, were 13.6 percent lower y/y.
V o l u m e s a n d v o l a t i l i t y
Trade volumes for maize and soybeans fell m/m but rose
modestly for wheat while volumes for all three
commodities were lower y/y. Historical volatility rose
slightly m/m but fell y/y for the three commodities while
implied volatility declined both m/m and y/y. Both
measures indicated subdued price variability. Conversely in
rice, historical volatility, which had surged along with prices
in June and July in response to an acute shortage of old
crop supplies in the US, fell 60 points m/m to a subdued
level of 17.
B a s i s l e v e l s a n d t r a n s p o r t
Domestic basis levels declined m/m for maize and
soybeans, reflecting the transition into harvest time levels
as hot and dry conditions in the Midwest quickened crop
maturation. In Illinois, average quotes to local elevators
were minus USD 6 per tonne for maize, and minus
USD 8 per tonne for soybeans, each under the respective
September futures prices. In Iowa, maize and soybean bids
were minus USD 11 and minus USD 16 respectively (under
the respective futures). Soft red wheat bids for delivery to
northern flour mills were quoted at small discounts to
September futures. Maize bids delivered to gulf were about
unchanged m/m at USD 20 while soybean quotes were firm
at USD 28. Soft red wheat quotes were quoted at around
USD 20 (per tonne premiums over respective September
futures). Barge freight for the Lower Illinois River rose m/m
to USD 21 per tonne, as is typical during the approach to
harvest. The USDA reported that total 2019/20 exports for
maize and soybeans would decline, ending (31 August) at
about 84 and 96 percent, respectively, of previous year
totals y/y, even as exports of both commodities saw a
sharp increase in July and August to China. Wheat exports
for current crop year (beginning 1 June) also trailed
previous year.
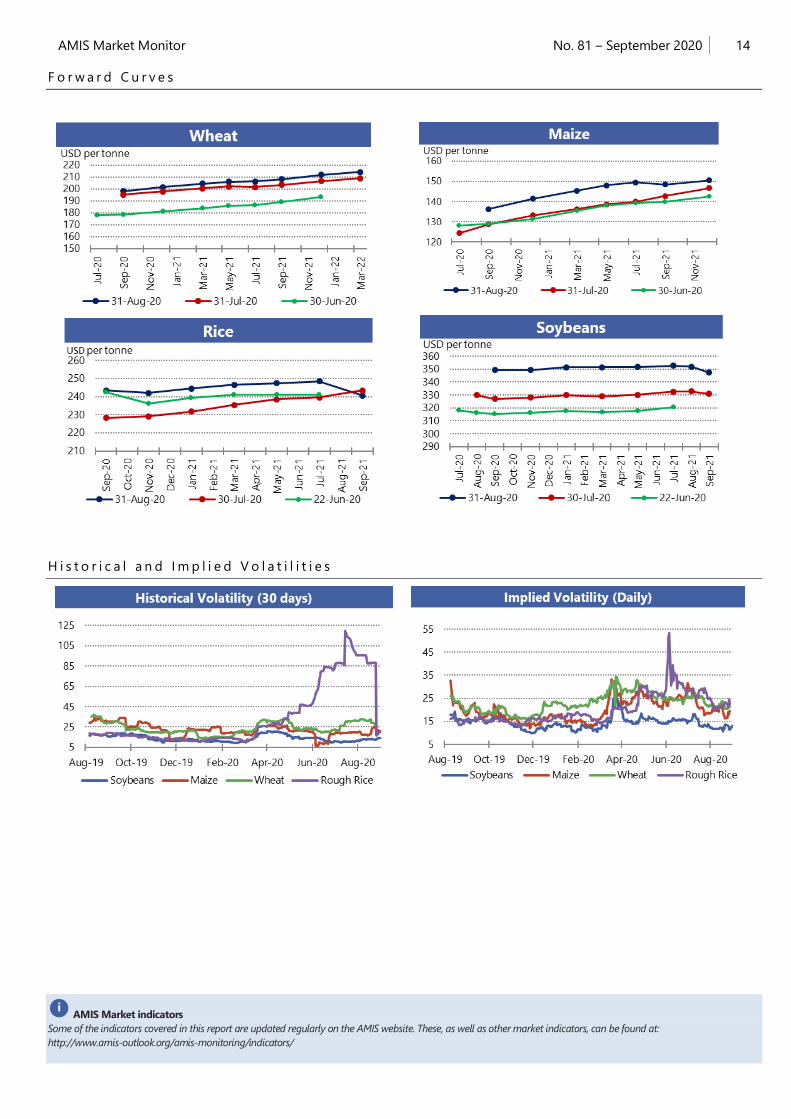
F o r w a r d c u r v e s
Forward curves for wheat, maize and soybeans displayed
greater steepening of contango (upward slope) m/m as
USDA increased domestic crop sizes for maize and
soybeans while projecting record global wheat supplies.
I n v e s t m e n t f l o w s
Managed money trimmed its small net short for wheat,
reduced its net short in maize by half, while increasing its
net long for soybeans m/m. Commercials maintained their
standard net short positions in wheat and soybeans while
reversing their temporary net long to net short in maize as
crop yield projections grew.
13 No. 81 – September 2020 AMIS Market Monitor
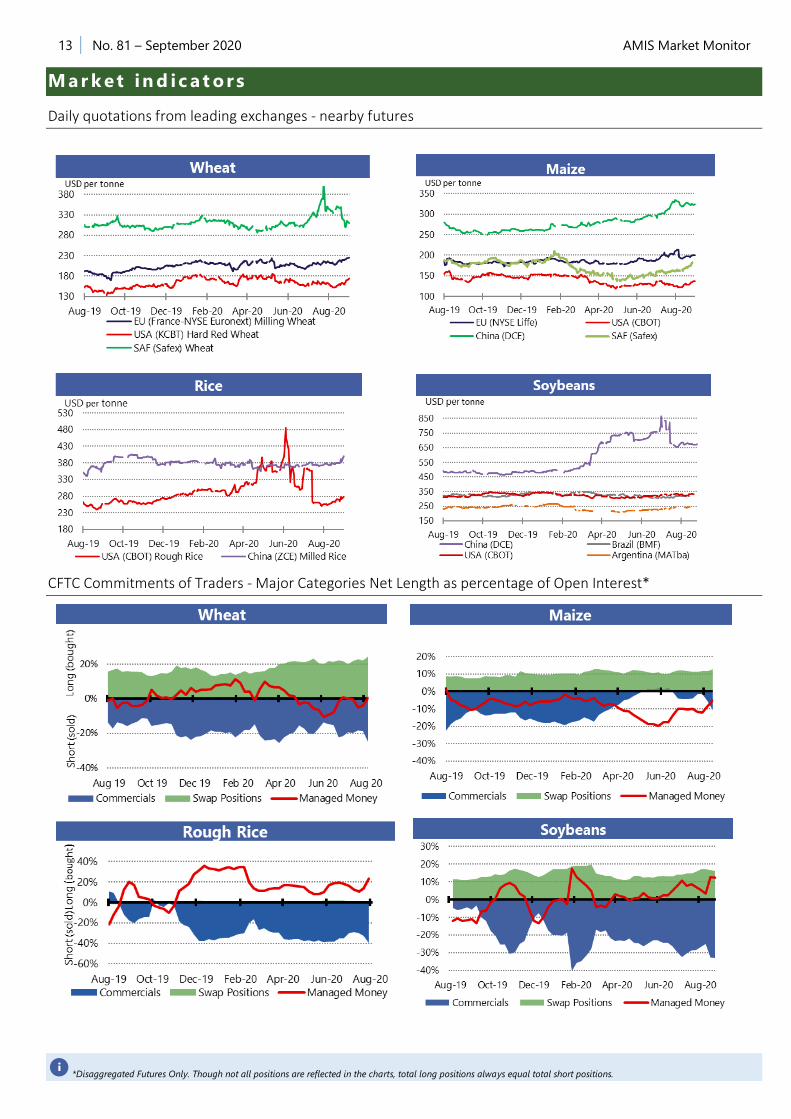
*Disaggregated Futures Only. Though not all positions are reflected in the charts, total long positions always equal total short positions. i
M ar k et in d ic a t ors
Daily quotations from leading exchanges - nearby futures
CFTC Commitments of Traders - Major Categories Net Length as percentage of Open Interest*
AMIS Market Monitor No. 81 – September 2020 14
AMIS Market indicators
Some of the indicators covered in this report are updated regularly on the AMIS website. These, as well as other market indicators, can be found at:
http://www.amis-outlook.org/amis-monitoring/indicators/
i
F o r w a r d C u r v e s
H i s t o r i c a l a n d I m p l i e d V o l a t i l i t i e s
15 No. 81 – September 2020 AMIS Market Monitor
Chart and tables description * Estimated using available weekly data to date.
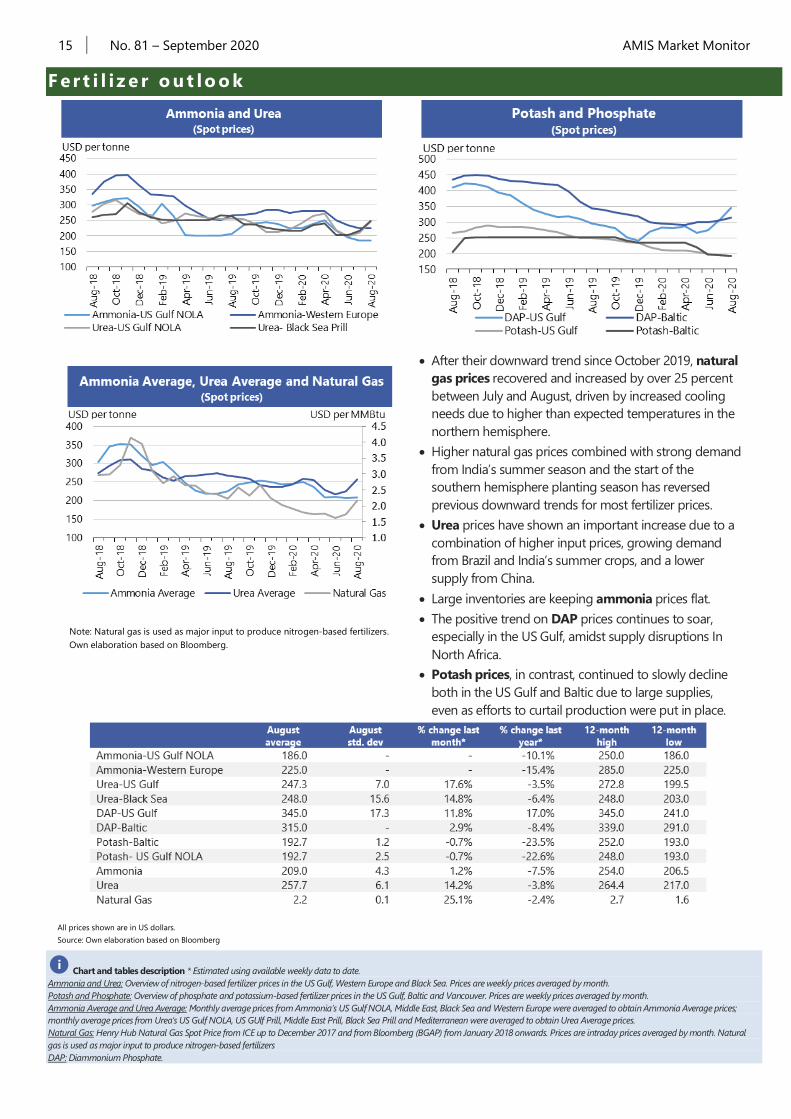
Ammonia and Urea: Overview of nitrogen-based fertilizer prices in the US Gulf, Western Europe and Black Sea. Prices are weekly prices averaged by month.
Potash and Phosphate: Overview of phosphate and potassium-based fertilizer prices in the US Gulf, Baltic and Vancouver. Prices are weekly prices averaged by month.
Ammonia Average and Urea Average: Monthly average prices from Ammonia’s US Gulf NOLA, Middle East, Black Sea and Western Europe were averaged to obtain Ammonia Average prices;
monthly average prices from Urea’s US Gulf NOLA, US GUlf Prill, Middle East Prill, Black Sea Prill and Mediterranean were averaged to obtain Urea Average prices.
Natural Gas: Henry Hub Natural Gas Spot Price from ICE up to December 2017 and from Bloomberg (BGAP) from January 2018 onwards. Prices are intraday prices averaged by month. Natural
gas is used as major input to produce nitrogen-based fertilizers
DAP: Diammonium Phosphate.
i
F er t i l i z e r o ut lo o k
After their downward trend since October 2019, natural
gas prices recovered and increased by over 25 percent
between July and August, driven by increased cooling
needs due to higher than expected temperatures in the
northern hemisphere.
Higher natural gas prices combined with strong demand
from India’s summer season and the start of the
southern hemisphere planting season has reversed
previous downward trends for most fertilizer prices.
Urea prices have shown an important increase due to a
combination of higher input prices, growing demand
from Brazil and India’s summer crops, and a lower
supply from China.
Large inventories are keeping ammonia prices flat.
The positive trend on DAP prices continues to soar,
especially in the US Gulf, amidst supply disruptions In
North Africa.
Potash prices, in contrast, continued to slowly decline
both in the US Gulf and Baltic due to large supplies,
even as efforts to curtail production were put in place.
All prices shown are in US dollars.
Source: Own elaboration based on Bloomberg
Note: Natural gas is used as major input to produce nitrogen-based fertilizers.
Own elaboration based on Bloomberg.
16 No. 81 – September 2020 AMIS Market Monitor
Source: International Grains Council
Baltic Dry Index (BDI): A benchmark indicator issued daily by the Baltic Exchange, providing assessed costs of moving raw materials on ocean going vessels. Comprises sub-Indices for three
segments: Capesize, Panamax and Supramax. The Baltic Handysize Index excluded from the BDI from 1 March 2018.
IGC Grains and Oilseeds Freight Index (GOFI): A trade-weighted composite measure of ocean freight costs for grains and oilseeds, issued daily by the International Grains Council. Includes
sub-Indices for seven main origins (Argentina, Australia, Brazil, Black Sea, Canada, the EU and the USA). Constructed based on nominal HSS (heavy grains, soybeans, sorghum) voyage rates
on selected major routes.
Capesize: Vessels with deadweight tonnage (DWT) above 80,000 DWT, primarily transporting coal, iron ore and other heavy raw materials on long-haul routes.
Panamax: Carriers with capacity of 60,000-80,000 DWT, mostly geared to transporting coal, grains, oilseeds and other bulks, including sugar and cement.
Supramax/Handysize: Ships with capacity below 60,000 DWT, accounting for the majority of the world’s ocean-going vessels and able to transport a wide variety of cargos, including grains
and oilseeds.
i
O c ea n f r e ig ht ma r k et s
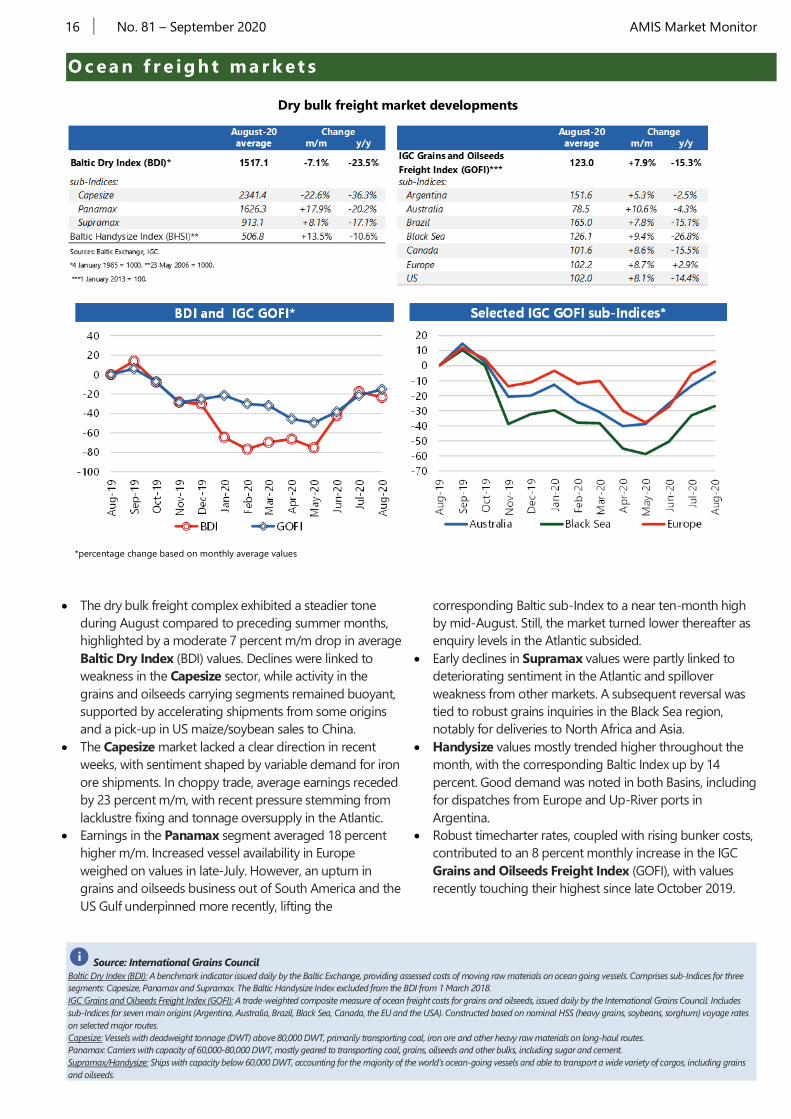
*percentage change based on monthly average values
The dry bulk freight complex exhibited a steadier tone
during August compared to preceding summer months,
highlighted by a moderate 7 percent m/m drop in average
Baltic Dry Index (BDI) values. Declines were linked to
weakness in the Capesize sector, while activity in the
grains and oilseeds carrying segments remained buoyant,
supported by accelerating shipments from some origins
and a pick-up in US maize/soybean sales to China.
The Capesize market lacked a clear direction in recent
weeks, with sentiment shaped by variable demand for iron
ore shipments. In choppy trade, average earnings receded
by 23 percent m/m, with recent pressure stemming from
lacklustre fixing and tonnage oversupply in the Atlantic.
Earnings in the Panamax segment averaged 18 percent
higher m/m. Increased vessel availability in Europe
weighed on values in late-July. However, an upturn in
grains and oilseeds business out of South America and the
US Gulf underpinned more recently, lifting the
corresponding Baltic sub-Index to a near ten-month high
by mid-August. Still, the market turned lower thereafter as
enquiry levels in the Atlantic subsided.
Early declines in Supramax values were partly linked to
deteriorating sentiment in the Atlantic and spillover
weakness from other markets. A subsequent reversal was
tied to robust grains inquiries in the Black Sea region,
notably for deliveries to North Africa and Asia.
Handysize values mostly trended higher throughout the
month, with the corresponding Baltic Index up by 14
percent. Good demand was noted in both Basins, including
for dispatches from Europe and Up-River ports in
Argentina.
Robust timecharter rates, coupled with rising bunker costs,
contributed to an 8 percent monthly increase in the IGC
Grains and Oilseeds Freight Index (GOFI), with values
recently touching their highest since late October 2019.
Dry bulk freight market developments
17 No. 81 – September 2020 AMIS Market Monitor
Contacts and Subscriptions AMIS Secretariat Email:
Download the AMIS Market Monitor or sign up for a free
e-mail subscription at:
www.amis-outlook.org/amis-monitoring
The notions of tightening and easing used in the summary table of
“Markets at a glance” reflect judgmental views that take into account
market fundamentals, inter-alia price developments and short-term trends
in demand and supply, especially changes in stocks.
All totals (aggregates) are computed from unrounded data. World supply
and demand estimates/forecasts are based on the latest data published
by FAO, IGC and USDA. For the former, they also take into account
information provided by AMIS focal points (hence the notion “FAO-
AMIS”). World estimates and forecasts produced by the three sources
may vary due to several reasons, such as varying release dates and
different methodologies used in constructing commodity balances.
Specifically:
Production: Wheat production data from all three sources refer to
production occurring in the first year of the marketing season shown (e.g.
crops harvested in 2016 are allocated to the 2016/17 marketing season).
Maize and rice production data for FAO-AMIS refer to crops harvested
during the first year of the marketing season (e.g. 2016 for the 2016/17
marketing season) in both the northern and southern hemisphere. Rice
production data for FAO-AMIS also include northern hemisphere
production from secondary crops harvested in the second year of the
marketing season (e.g. 2017 for the 2016/17 marketing season). By
contrast, rice and maize data for USDA and IGC encompass production in
the northern hemisphere occurring during the first year of the season (e.g.
2016 for the 2016/17 marketing season), as well as crops harvested in the
southern hemisphere during the second year of the season (e.g. 2017 for
the 2016/17 marketing season) . For soybeans, the latter approach is used
by all three sources.
Supply: Defined as production plus opening stocks by all three sources.
Utilization: For all three sources, wheat, maize and rice utilization includes
food, feed and other uses (namely, seeds, industrial uses and post-harvest
losses). For soybeans, it comprises crush, food and other uses. However,
for all AMIS commodities, the use categories may be grouped differently
across sources and may also include residual values.
Trade: Data refer to exports. For wheat and maize, trade is reported on a
July/June basis, except for USDA maize trade estimates, which are
reported on an October/September basis. Wheat trade data from all
three sources includes wheat flour in wheat grain equivalent, while the
USDA also considers wheat products. For rice, trade covers shipments
from January to December of the second year of the respective
marketing season. For soybeans, trade is reported on an
October/September basis by FAO-AMIS and the IGC, while USDA data
are based on local marketing years except for Argentina and Brazil which
are reported on an October/September basis. Trade between European
Union member states is excluded.
Stocks: In general, world stocks of AMIS crops refer to the sum of carry-
overs at the close of each country’s national marketing year. For soybeans,
stock levels reported by the USDA are based on local marketing years,
except for Argentina and Brazil, which are adjusted to October/September.
For maize and rice, global estimates may vary across sources because of
differences in the allocation of production in southern hemisphere
countries.
For more information on AMIS Supply and Demand, please view
AMIS Supply and Demand Balances Manual.
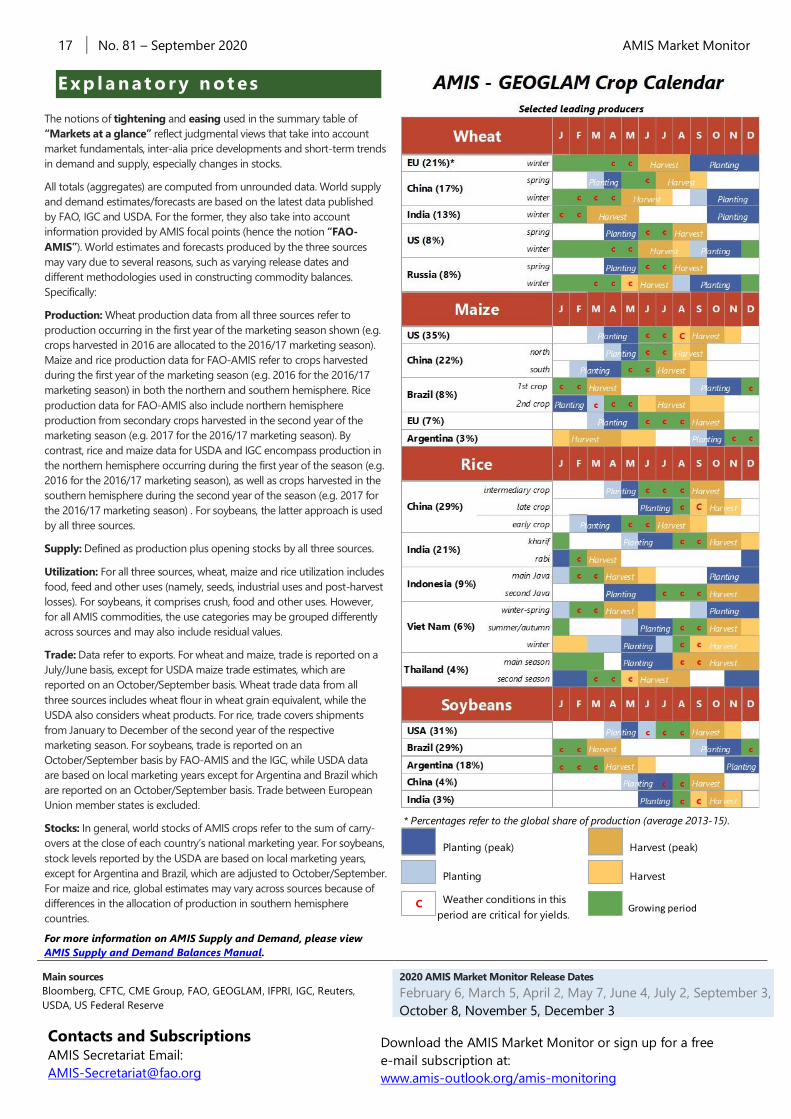
* Percentages refer to the global share of production (average 2013-15).
Planting (peak) Harvest (peak)
Planting Harvest
C Growing period Weather conditions in this
period are critical for yields.
Main sources
Bloomberg, CFTC, CME Group, FAO, GEOGLAM, IFPRI, IGC, Reuters,
USDA, US Federal Reserve
2020 AMIS Market Monitor Release Dates
February 6, March 5, April 2, May 7, June 4, July 2, September 3,
October 8, November 5, December 3
E xp l a nat o r y n ot es