Embed Size (px)
Citation preview

Robert Almgren
Market Microstructureand
Algorithmic Trading
PIMS Summer School 2016University of Alberta, Edmonton
Lecture 2: July 4, 2016
Edmonton mini-course, July 2016
Exchanges
Decide trading rules:Trading hoursMatch algorithmImplied quotingTrading halts / circuit breakers
Tick sizeexchange decisioneffect on trading: reversionvolatility measurement
2
Edmonton mini-course, July 2016
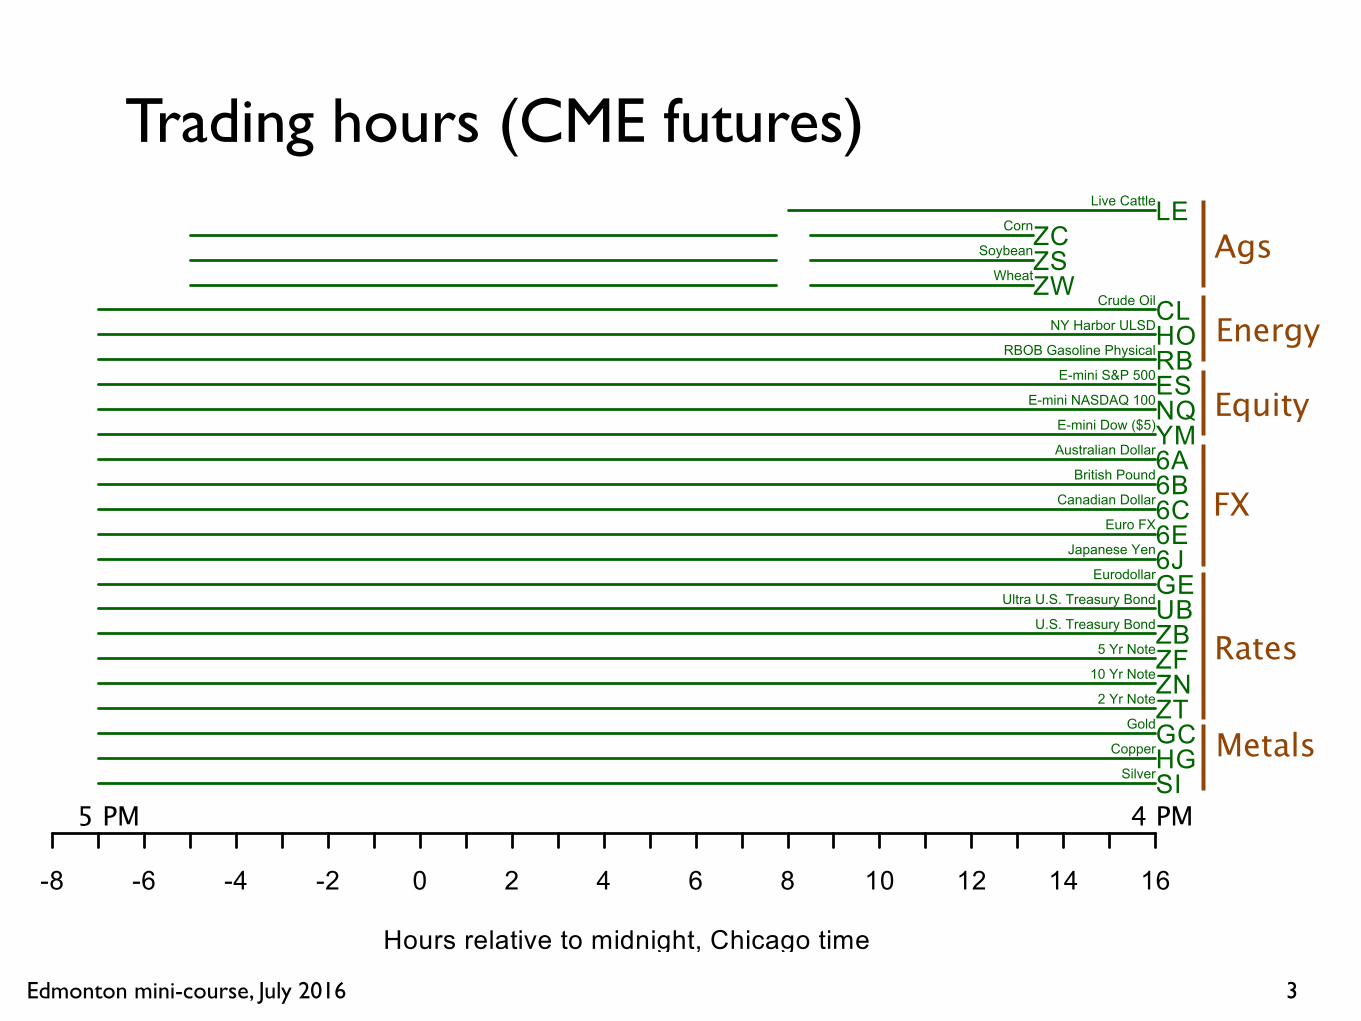
-8 -6 -4 -2 0 2 4 6 8 10 12 14 16
Hours relative to midnight, Chicago time
LELive Cattle
ZCCorn
ZSSoybean
ZWWheat
CLCrude Oil
HONY Harbor ULSD
RBRBOB Gasoline Physical
ESE-mini S&P 500
NQE-mini NASDAQ 100
YME-mini Dow ($5)
6AAustralian Dollar
6BBritish Pound
6CCanadian Dollar
6EEuro FX
6JJapanese Yen
GEEurodollar
UBUltra U.S. Treasury Bond
ZBU.S. Treasury Bond
ZF5 Yr Note
ZN10 Yr Note
ZT2 Yr Note
GCGold
HGCopper
SISilver
Trading hours (CME futures)
3
Ags
Energy
Equity
FX
Rates
Metals
5 PM 4 PM

Edmonton mini-course, July 2016 4
Trading through a crop report
Trading hours

Edmonton mini-course, July 2016
200 lots200 lots
Bank of C
anada Announcem
ent
140.20
140.25
140.30
140.35
140.40
140.45
140.50
140.55
140.60
140.65
140.70
140.75
140.80
09:55 09:56 09:57 09:58 09:59 10:00 10:01 10:02 10:03 10:04 10:05
EDT on Wed 15 Jul 2015
5
CGBU5: 10-year Canadian note futures
234 Laurier Avenue West • Ottawa, Ontario K1A 0G9 • 613 782-8111 • www.bankofcanada.ca 234, rue Laurier Ouest • Ottawa (Ontario) K1A 0G9 • 613 782-8111 • www.banqueducanada.ca
FOR IMMEDIATE RELEASE 15 July 2015
CONTACT: Media Relations 613 782-8782
Bank of Canada lowers overnight rate target to 1/2 per cent
OTTAWA – The Bank of Canada today announced that it is lowering its target for the overnight rate by one-quarter of one percentage point to 1/2 per cent. The Bank Rate is correspondingly 3/4 per cent and the deposit rate is 1/4 per cent.
Total CPI inflation in Canada has been around 1 per cent in recent months, reflecting year-over-year price declines for consumer energy products. Core inflation has been close to 2 per cent, with disinflationary pressures from economic slack being offset by transitory effects of the past depreciation of the Canadian dollar and some sector-specific factors. Setting aside these transitory effects, the Bank judges that the underlying trend in inflation is about 1.5 to 1.7 per cent.
Global growth faltered in early 2015, principally in the United States and China. Recent indicators suggest a rebound in the U.S. economy in the second half of this year, and growth is expected to be solid through the projection. In contrast, China is slowing amid an ongoing process of rebalancing to a more sustainable growth path. This has pulled down prices of certain commodities that are important to Canada’s exports. Financial conditions in major economies remain very accommodative and continue to provide much-needed support to economic activity. Global growth is expected to strengthen over the second half of 2015, averaging about 3 per cent for the year, and accelerate to around 3 1/2 per cent in 2016 and 2017. The Bank’s estimate of growth in Canada in 2015 has been marked down considerably from its April projection. The downward revision reflects further downgrades of business investment plans in the energy sector, as well as weaker-than-expected exports of non-energy commodities and non-commodities. Real GDP is now projected to have contracted modestly in the first half of the year, resulting in higher excess capacity and additional downward pressure on inflation. The Bank expects growth to resume in the third quarter and begin to exceed potential again in the fourth quarter, led by the non-resource sectors of Canada’s economy. Outside the energy-producing regions, consumer confidence remains high and labour markets continue to improve. This will support consumption, which will also receive a fiscal boost. Recent evidence suggests a pickup in activity and rising capacity pressures among manufacturers, particularly those exporters that are most sensitive to movements in the Canadian dollar. Financial conditions for households and businesses remain very stimulative. The Bank now projects Canada’s real GDP will grow by just over 1 per cent in 2015 and about 2 1/2 per cent in 2016 and 2017. With this revised growth profile, the output gap is significantly larger than was expected in April, and closes somewhat later. The Bank anticipates that the economy will return to full capacity and inflation to 2 per cent on a sustained basis in the first half of 2017. The lower outlook for Canadian growth has increased the downside risks to inflation. While vulnerabilities associated with household imbalances remain elevated and could edge higher, Canada’s economy is undergoing a significant and complex adjustment. Additional monetary stimulus is required at this time to help return the economy to full capacity and inflation sustainably to target.

Edmonton mini-course, July 2016
Matching algorithms
How market orders are matched to limitAlgorithm fixed by exchange
to attract more volumeto attract correct mix of participantsetc
6
Edmonton mini-course, July 2016
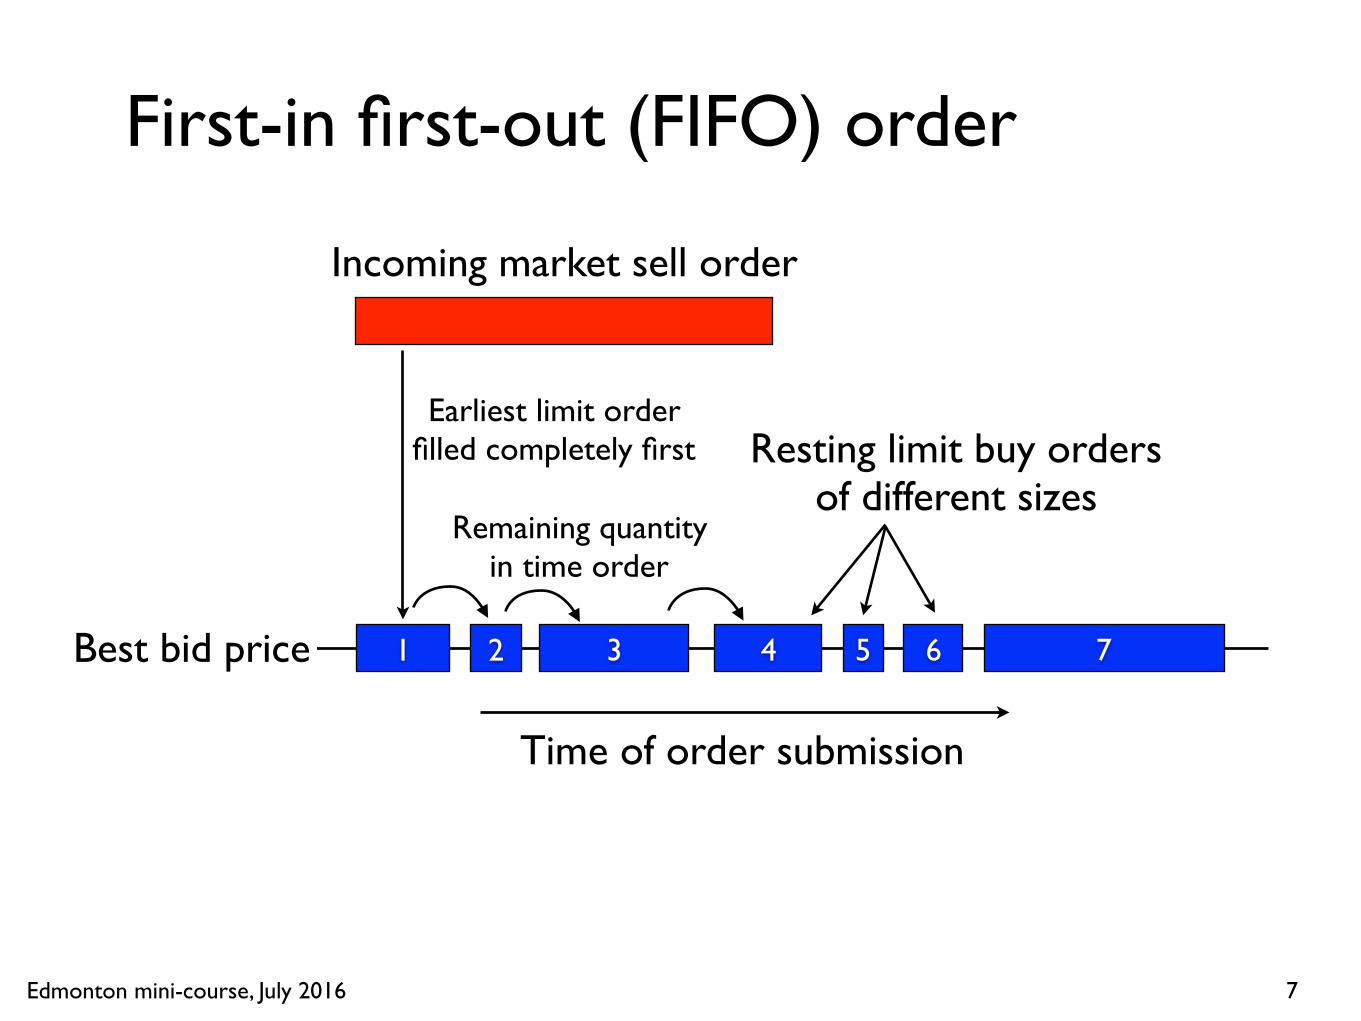
First-in first-out (FIFO) order
7
1 2 3 4 5 6 7Best bid price
Resting limit buy ordersof different sizes
Time of order submission
Incoming market sell order
Earliest limit order filled completely first
Remaining quantityin time order

Edmonton mini-course, July 2016
Pro rata order matching
8
1 2 3 4 5 6 7Best bid price
Incoming volume dividedamong all resting orders
at best price
Incoming market sell order

Edmonton mini-course, July 2016
Match algorithm
9
9 different ways to match market and limit orders,
on CME alone"The FIFO algorithm uses price and time as the only criteria for filling an order. In this algorithm, all orders at the same price level are filled according to time priority; the first order at a price level is the first order matched."
http://www.cmegroup.com/confluence/display/EPICSANDBOX/Matching+Algorithms
Edmonton mini-course, July 2016 10
7
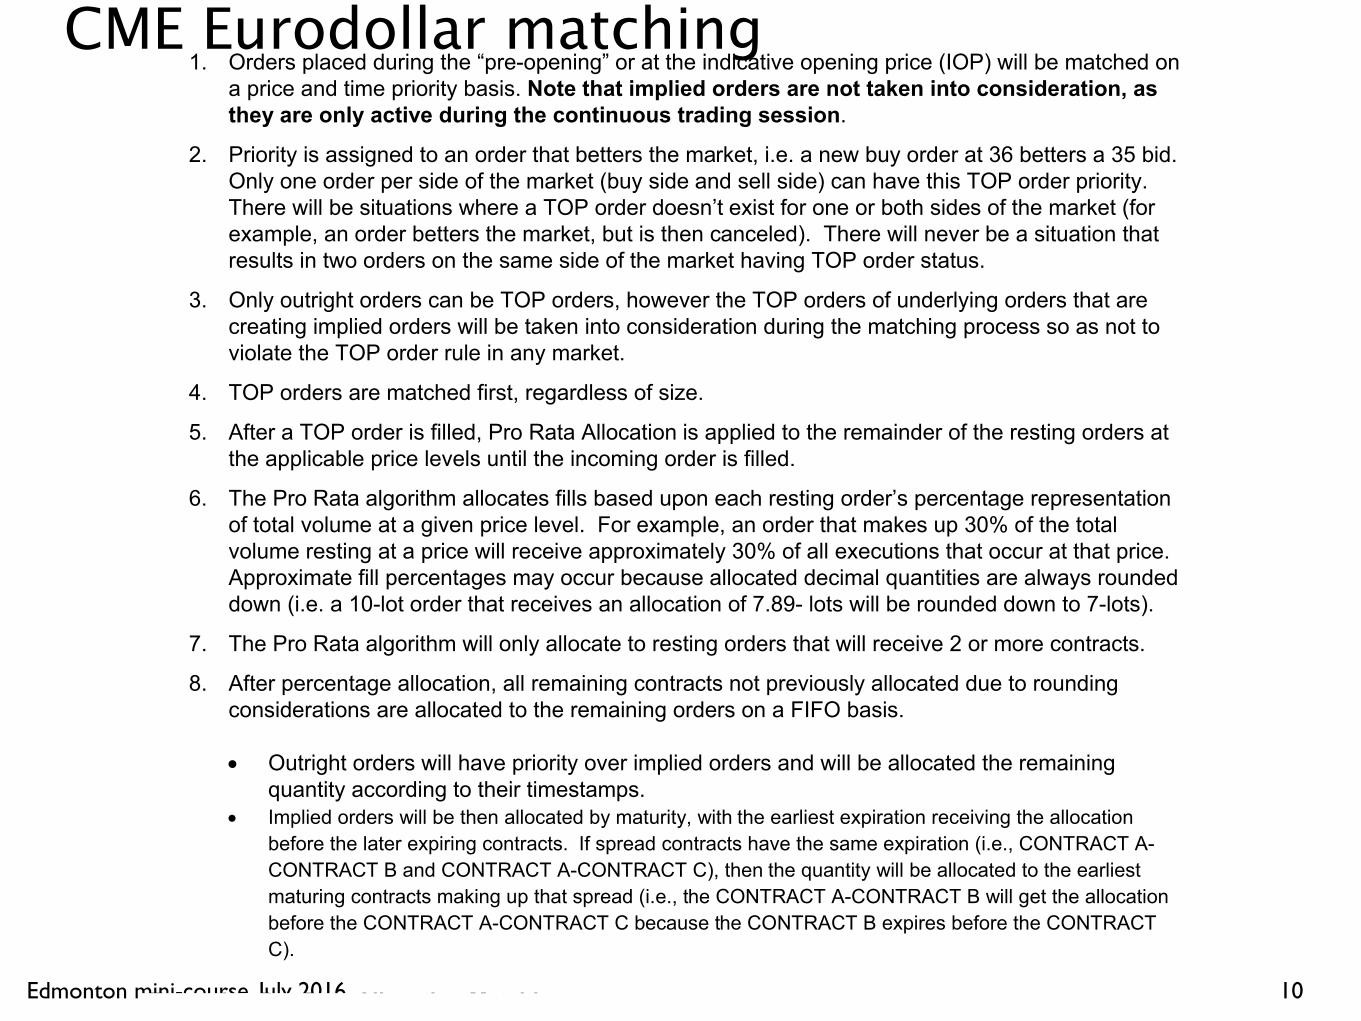
1. Orders placed during the “pre-opening” or at the indicative opening price (IOP) will be matched on
a price and time priority basis. Note that implied orders are not taken into consideration, as
they are only active during the continuous trading session.
2. Priority is assigned to an order that betters the market, i.e. a new buy order at 36 betters a 35 bid.
Only one order per side of the market (buy side and sell side) can have this TOP order priority.
There will be situations where a TOP order doesn’t exist for one or both sides of the market (for
example, an order betters the market, but is then canceled). There will never be a situation that
results in two orders on the same side of the market having TOP order status.
3. Only outright orders can be TOP orders, however the TOP orders of underlying orders that are
creating implied orders will be taken into consideration during the matching process so as not to
violate the TOP order rule in any market.
4. TOP orders are matched first, regardless of size.
5. After a TOP order is filled, Pro Rata Allocation is applied to the remainder of the resting orders at
the applicable price levels until the incoming order is filled.
6. The Pro Rata algorithm allocates fills based upon each resting order’s percentage representation
of total volume at a given price level. For example, an order that makes up 30% of the total
volume resting at a price will receive approximately 30% of all executions that occur at that price.
Approximate fill percentages may occur because allocated decimal quantities are always rounded
down (i.e. a 10-lot order that receives an allocation of 7.89- lots will be rounded down to 7-lots).
7. The Pro Rata algorithm will only allocate to resting orders that will receive 2 or more contracts.
8. After percentage allocation, all remaining contracts not previously allocated due to rounding
considerations are allocated to the remaining orders on a FIFO basis.
! Outright orders will have priority over implied orders and will be allocated the remaining
quantity according to their timestamps.
! Implied orders will be then allocated by maturity, with the earliest expiration receiving the allocation
before the later expiring contracts. If spread contracts have the same expiration (i.e., CONTRACT A-
CONTRACT B and CONTRACT A-CONTRACT C), then the quantity will be allocated to the earliest
maturing contracts making up that spread (i.e., the CONTRACT A-CONTRACT B will get the allocation
before the CONTRACT A-CONTRACT C because the CONTRACT B expires before the CONTRACT
C).
Example: Pro Rata Allocation Matching
Note: For this example, any of the orders involved could be either outright or implied. As timestamp is
not taken into account, the outcome is the same.
Orders in the market:
Order No. Bid Qty Bid Price Offer Price Offer Qty Order No.
INCOMING 250 9711 9711 200 1 (Top Order)
9711 25 2
9711 50 3
9711 10 4
CME Eurodollar matching

Edmonton mini-course, July 2016
Reasons for pro rata matching
Reasons for pro rata matching:Historical tradition from pit tradingEncourage submission of large limit ordersAllow late entrants to participate
Characteristic of interest rate futures markets
Eurodollar, Euribor, Treasury calendar spreadsShort sterling
“Arms race” to oversize limit orderslimited only by risk of overfilling(Jonathan Field & Jeremy Large 2008)
11

Edmonton mini-course, July 2016 12
http://www.advantagefutures.com/is-pro-rata-an-accident-waiting-to-happen/
Advantage FuturesChicago
Edmonton mini-course, July 2016
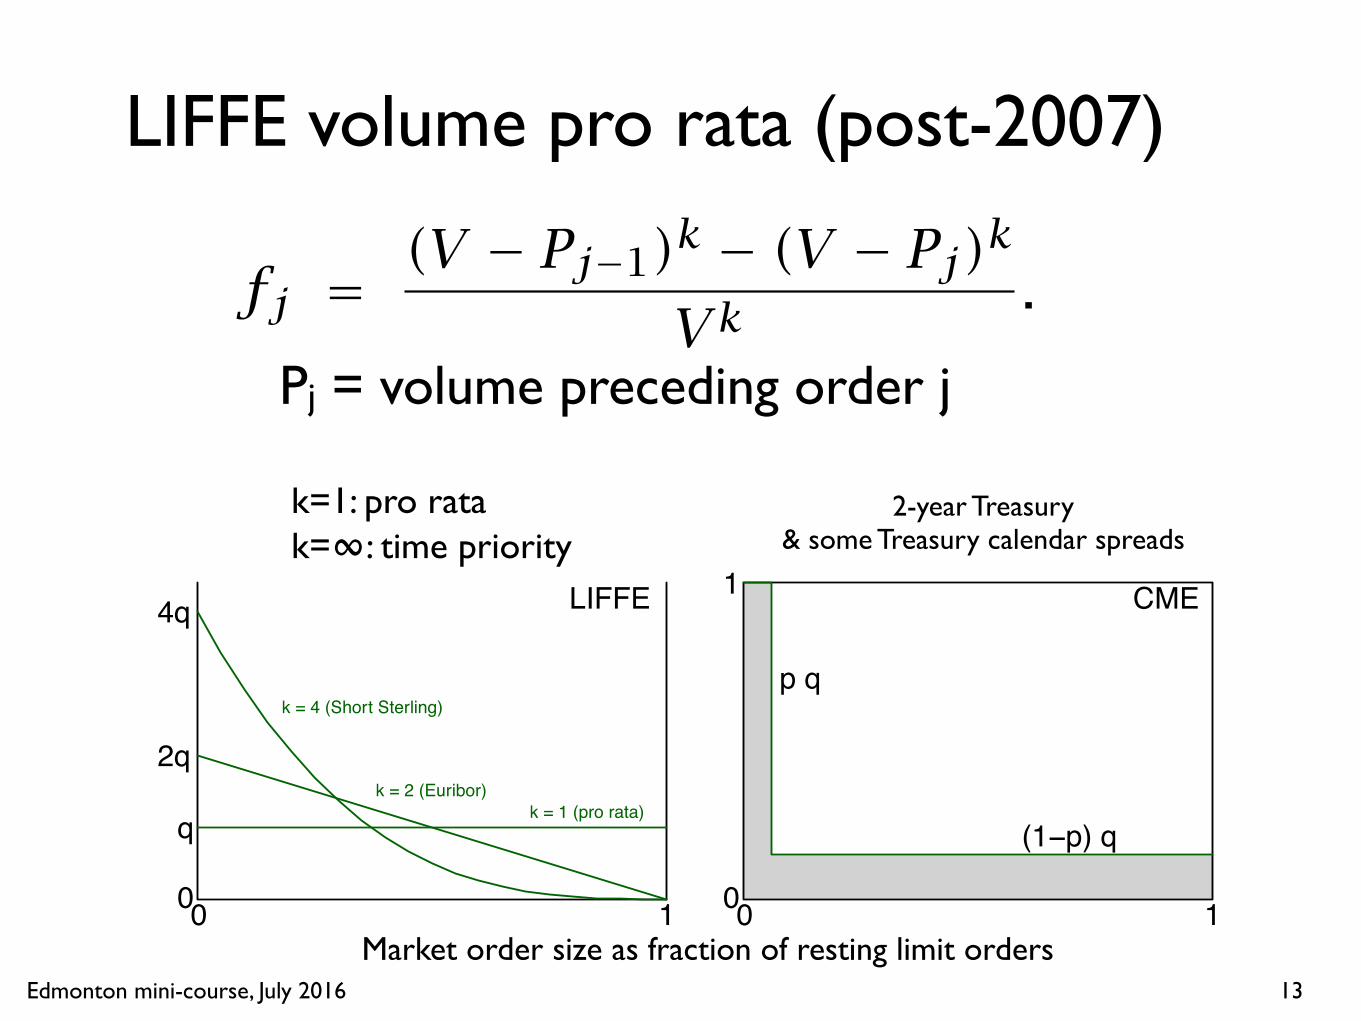
LIFFE volume pro rata (post-2007)
13
Robert Almgren and Eugene Krel May 31, 2013 2
0 10
LIFFE
q k = 1 (pro rata)
2qk = 2 (Euribor)
4q
k = 4 (Short Sterling)
0 10
1 CME
p q
(1−p) q
Figure 1: Mixed allocation algorithms, for small market order sizes; q denotes thesize of the incoming market order as a fraction of total resting size. Horizontal axisis the position of a limit order in the queue as a fraction of total resting volume: 0denotes the earliest order, 1 the last order entered. Vertical axis is the fraction ofeach order that is filled, neglecting rounding and assuming that q is small.
and FIFO algorithms, giving priority to early orders while still allowing late entrantsto trade; McPartland [2013] and others suggest that this should be universal.
LIFFE matching algorithm
For its STIR products, LIFFE takes
f
j
= (V � Pj�1)
k � (V � Pj
)
k
V
k
.
Pro rata matching is obtained for k = 1, and FIFO in the limit k ! 1. Intermediatevalues of k interpolate between the two. LIFFE sets k = 2 for Euribor, and k = 4 forShort Sterling and Euroswiss (effective May 29, 2013, [LIFFE, 2013]).
To understand this algorithm, note that by the Mean Value Theorem of calculus,
f
j
= V
j
V
g(x
j
)
where
g(x) = d
dx
(1� x)k = k(1� x)k�1 andP
j�1
V
< x
j
<
P
j
V
.
If all limit orders are small fractions of the total, then xj
⇡ Pj�1/V ⇡ Pj/V and the
fraction of each limit order that is filled depends only on its position in the queue.The fraction of order j that is filled is
Q
j
V
j
= min�
1, q g(xj
)
.
Pj = volume preceding order j
k=1: pro ratak=∞: time priority
Robert Almgren and Eugene Krel May 31, 2013 2
0 10
LIFFE
q k = 1 (pro rata)
2qk = 2 (Euribor)
4q
k = 4 (Short Sterling)
0 10
1 CME
p q
(1−p) q
Figure 1: Mixed allocation algorithms, for small market order sizes; q denotes thesize of the incoming market order as a fraction of total resting size. Horizontal axisis the position of a limit order in the queue as a fraction of total resting volume: 0denotes the earliest order, 1 the last order entered. Vertical axis is the fraction ofeach order that is filled, neglecting rounding and assuming that q is small.
and FIFO algorithms, giving priority to early orders while still allowing late entrantsto trade; McPartland [2013] and others suggest that this should be universal.
LIFFE matching algorithm
For its STIR products, LIFFE takes
f
j
= (V � Pj�1)
k � (V � Pj
)
k
V
k
.
Pro rata matching is obtained for k = 1, and FIFO in the limit k ! 1. Intermediatevalues of k interpolate between the two. LIFFE sets k = 2 for Euribor, and k = 4 forShort Sterling and Euroswiss (effective May 29, 2013, [LIFFE, 2013]).
To understand this algorithm, note that by the Mean Value Theorem of calculus,
f
j
= V
j
V
g(x
j
)
where
g(x) = d
dx
(1� x)k = k(1� x)k�1 andP
j�1
V
< x
j
<
P
j
V
.
If all limit orders are small fractions of the total, then xj
⇡ Pj�1/V ⇡ Pj/V and the
fraction of each limit order that is filled depends only on its position in the queue.The fraction of order j that is filled is
Q
j
V
j
= min�
1, q g(xj
)
.
2-year Treasury& some Treasury calendar spreads
Market order size as fraction of resting limit orders

Edmonton mini-course, July 2016
Tick size
14
http://investor.cmegroup.com/investor-relations/releasedetail.cfm?ReleaseID=393362
Edmonton mini-course, July 2016 15
MODIFICATIONS TO THE CONTRACT SPECIFICATIONS FOR THE THREE‐MONTH CANADIAN BANKERS’ ACCEPTANCE FUTURES CONTRACT
MINIMUM PRICE FLUCTUATION
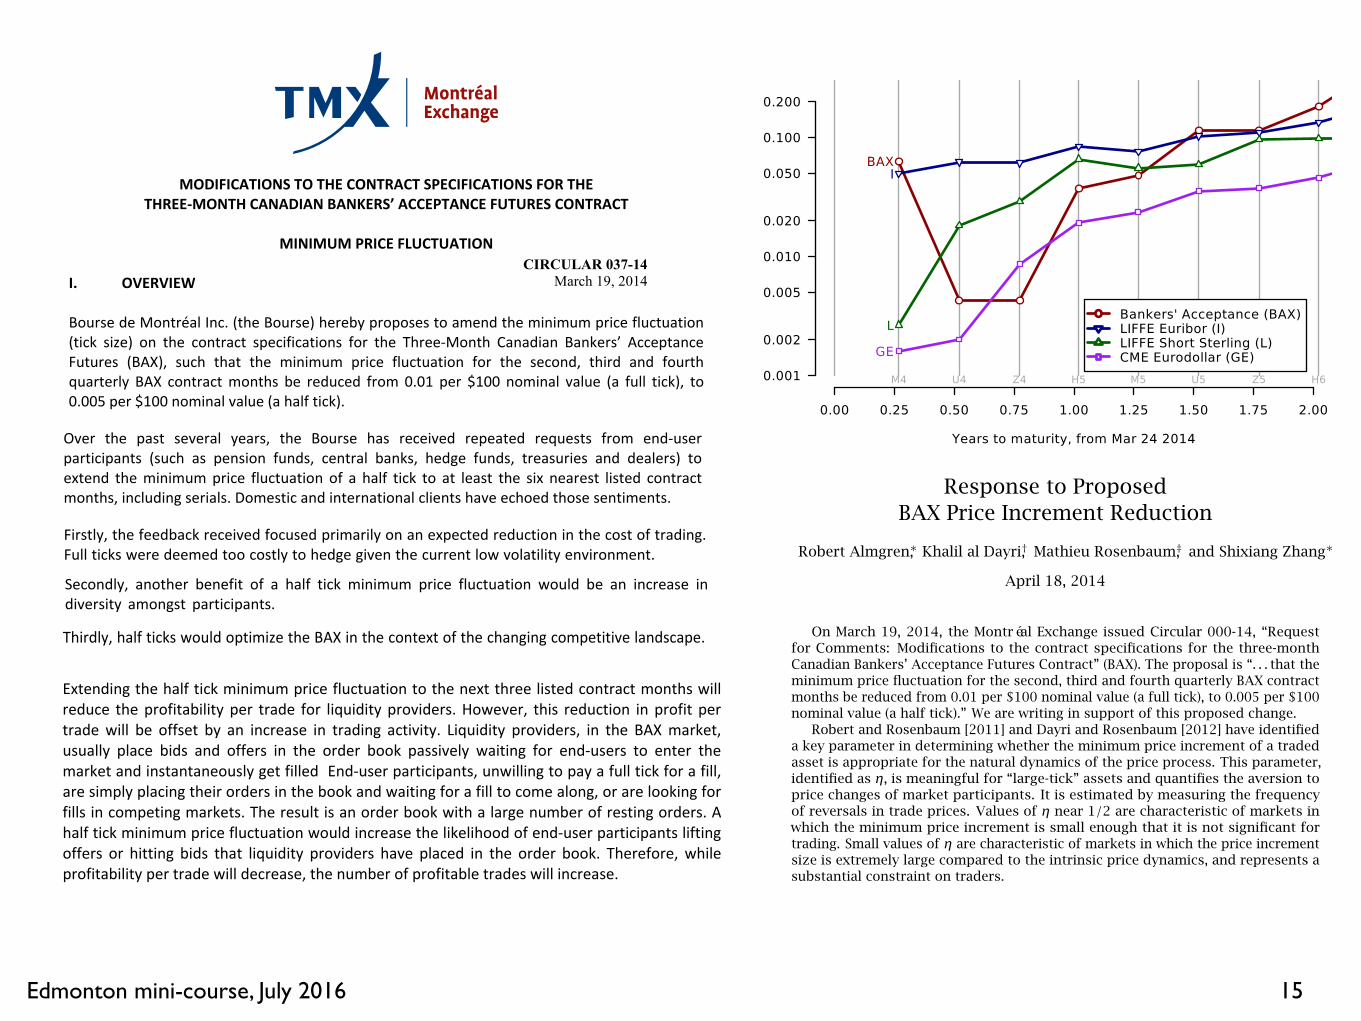
I. OVERVIEW Bourse de Montréal Inc. (the Bourse) hereby proposes to amend the minimum price fluctuation (tick size) on the contract specifications for the Three‐Month Canadian Bankers’ Acceptance Futures (BAX), such that the minimum price fluctuation for the second, third and fourth quarterly BAX contract months be reduced from 0.01 per $100 nominal value (a full tick), to 0.005 per $100 nominal value (a half tick). II. ANALYSIS
Description and Analysis of Impacts When the BAX contract was introduced in April of 1988, the minimum price fluctuation (tick size) for all contract months was established at 0.01 per $100 nominal value (a full tick). In February of 2002, the Bourse reduced the minimum price fluctuation to 0.005 per $100 nominal value (a half tick) for the three nearest listed contract months (the first quarterly BAX contract month and the two serial BAX contract months) as a greater level of granularity was in the best interest of the market. In 2002, the reasons behind the reduction of the minimum price fluctuation included the following:
� The need to conform to the practice of the cash and over‐the‐counter market and other international short‐term interest rate futures contracts; and the need to provide market users with the ability to price the BAX contracts with greater precision.
� The tick size of a futures contract is a key determinant to its success. Our
objective was to ensure that the tick size of the BAX contract not be so large that the contract would become less useful for institutional investors who prefer the flexibility to price these contracts with greater accuracy. Nor that the tick size be so large that traders would find tick size movements and price risk too high.
The Bourse contends that the reasons cited for the change in 2002 still apply today.
1.
Over the past several years, the Bourse has received repeated requests from end‐user participants (such as pension funds, central banks, hedge funds, treasuries and dealers) to extend the minimum price fluctuation of a half tick to at least the six nearest listed contract months, including serials. Domestic and international clients have echoed those sentiments. The Bourse has conducted extensive consultations with market participants to gauge their interest in a half tick minimum price fluctuation. The participants’ feedback centered around three principal benefits to the market that are summarized as follows. Firstly, the feedback received focused primarily on an expected reduction in the cost of trading. Full ticks were deemed too costly to hedge given the current low volatility environment. Tighter spreads cannot hurt business given that competing products have much tighter bid‐ask spreads than the BAX. Furthermore, it is possible to get markets tighter than a basis point in all products up to ten years. The BAX, which should be the most liquid market, offers a spread two to three times wider than the offer in the dealer community. Participants also noted that the Ten‐Year Government of Canada Bond Futures (CGB) contract has much lower friction costs associated with trading than the BAX, thereby reducing the incentive to participate in the BAX market. The bid‐ask spread was also deemed out of pace with that available elsewhere. Participants always use the cheapest hedge which, at the moment, is not the BAX. Finally, it was stated that the cheapest hedging vehicle should not be an over the counter (OTC) product, and if that is so, the wrong cost model is being used. Secondly, another benefit of a half tick minimum price fluctuation would be an increase in diversity amongst participants. It is expected that half ticks would bring in new participants, deflecting them from OTC markets. Multi‐product and multi‐currency strategy asset managers, who are active elsewhere, typically avoid the BAX due to the perceived high cost. Many of these asset managers trade Australian STIR futures rather than Canadian STIR futures, for cost reasons. Furthermore, participants stated that liquidity can be found elsewhere at a much lower cost and that the frequency of trading would increase with the introduction of half ticks. Thirdly, half ticks would optimize the BAX in the context of the changing competitive landscape. Participants reported that the current model is inefficient for too many participants who turn to other alternatives, and that half ticks are necessary because the dynamics of the market have changed. They also stated that, given the volatility in the front end, the bid‐ask spread, the execution fees and the execution protocols, there is little incentive to use the BAX, while there is no significant downside to using a Swap Exchange Facility (SEF). When trading in the short end, only once a participant has tried to execute through a SEF and has been unable to get a fill do they turn to the BAX. Finally, they claim that having participants view the BAX as a pricing source or a trading venue of last resort does not bode well for the future of the market. The Bourse believes that the proposed reduction in minimum price fluctuation will yield immediate dividends to the market. Firstly, a smaller tick size will reduce slippage (the difference between the expected price of a trade and the executed price of the trade) therefore providing greater price precision for all market participants. For example, an end‐user would like to buy 1,000 BAX contracts at 98.775. The market is quoted at 97.770/98.780. In order to get a fill, the end‐user would have to pay 98.780 resulting in a loss of $12,500 ((98.775‐98.780) x 1000 contracts x $2,500). Secondly, the smaller tick size would attract additional domestic and international client flow to the BAX market. Thus hedgers will be encouraged to be more active
2.
Tour de la Bourse P.O. Box 61, 800 Victoria Square, Montréal, Québec H4Z 1A9
Telephone: 514 871-2424 Toll-free within Canada and the U.S.A.: 1 800 361-5353
Website: www.m-x.ca
CIRCULAR 037-14
March 19, 2014
REQUEST FOR COMMENTS
MODIFICATIONS TO THE CONTRACT SPECIFICATIONS FOR THE
THREE-MONTH CANADIAN BANKERS’ ACCEPTANCE FUTURES CONTRACT
MINIMUM PRICE FLUCTUATION
The Rules and Policies Committee of Bourse de Montréal Inc. (the Bourse) has approved amendments to the minimum price fluctuation (tick size) on the contract specifications for the Three-Month Canadian Bankers’ Acceptance Futures (BAX), such that the minimum price fluctuation for the second, third and fourth quarterly BAX contract months be reduced from 0.01 per $100 nominal value (a full tick), to 0.005 per $100 nominal value (a half tick).
Comments on the proposed amendments must be submitted within 30 days following the date of publication of this notice, at the latest on April 21, 2014. Please submit your comments to:
Me Pauline Ascoli Vice-President, Legal Affairs, Derivatives
Bourse de Montréal Inc. Tour de la Bourse
P.O. Box 61, 800 Victoria Square Montréal, Québec H4Z 1A9
E-mail: [email protected] A copy of these comments shall also be forwarded to the Autorité des marchés financiers (the “Autorité”) to:
Me Anne-Marie Beaudoin Corporate Secretary
Autorité des marchés financiers 800 Victoria Square, 22nd Floor
P.O. Box 246, Tour de la Bourse Montréal (Québec) H4Z 1G3
E-mail: [email protected]
Trading – Interest Rate Derivatives Back-office - Options Trading – Equity and Index Derivatives Technology Back-office – Futures Regulation
in the market as the cost of hedging a position will be lower and speculators will have a larger pool of clients to trade against. Both hedgers and speculators are essential to the health of the BAX, and it is crucial to ensure that each group makes up a sustainable proportion of the overall market. A healthy futures market needs a stable mix of client types. Over the past several years, overall growth in BAX trading volumes has been favourable; however a large portion of that growth has come from liquidity providers. Trading volumes attributable to end‐user clients have not grown as they should have. While the market remains healthy, in the long‐term, a market dominated by either liquidity providers or buy‐side clients is problematic. This proposal to reduce the minimum price fluctuation, which has been long been requested by buy‐side participants, is an efficient method of restoring the balance between these groups. Extending the half tick minimum price fluctuation to the next three listed contract months will reduce the profitability per trade for liquidity providers. However, this reduction in profit per trade will be offset by an increase in trading activity. Liquidity providers, in the BAX market, usually place bids and offers in the order book passively waiting for end‐users to enter the market and instantaneously get filled End‐user participants, unwilling to pay a full tick for a fill, are simply placing their orders in the book and waiting for a fill to come along, or are looking for fills in competing markets. The result is an order book with a large number of resting orders. A half tick minimum price fluctuation would increase the likelihood of end‐user participants lifting offers or hitting bids that liquidity providers have placed in the order book. Therefore, while profitability per trade will decrease, the number of profitable trades will increase. Feedback from the Bourse’s market surveys indicates that there is a large pool of potential demand for the BAX from hedge funds who are not currently trading the BAX contract due to the costly full tick minimum price fluctuation. Some hedge funds have suggested that a reduction in tick size would lead them to redirect some of their OTC volume to the BAX, perhaps even increasing their BAX trading volumes by as much as tenfold. This uncaptured buy‐side volume would offer current BAX liquidity providers a plethora of new trading opportunities, and would drive new liquidity providers into the BAX market. From an economic perspective, the Canadian short term interest rate (STIR) market has been enduring historically low interest rates and volatility for some time. The Bank of Canada’s neutral stance on monetary policy raises the possibility that there will be some movement in the bank rate, and thus volatility, at some point in the future. While the Bank of Canada’s stance has shifted from dovish to neutral, the market has been waiting for movement in the bank rate since 2010. Over this time, the Bourse has observed that the minimum price fluctuation is simply too large for the BAX contract and that the timing for a reduction in the minimum price fluctuation is suitable. The Bourse operates in an increasingly competitive environment. Forward rate agreements in the OTC market and on alternative trading platforms offer smaller minimum price fluctuations than the BAX. However those products are not centrally cleared and do not have a transparent mechanism for price discovery.
3.
Years to maturity, from Mar 24 2014
0.00 0.25 0.50 0.75 1.00 1.25 1.50 1.75 2.00
0.001
0.002
0.005
0.010
0.020
0.050
0.100
0.200
M4 U4 Z4 H5 M5 U5 Z5 H6
BAX
GE
I
LBankers' Acceptance (BAX)LIFFE Euribor (I)LIFFE Short Sterling (L)CME Eurodollar (GE)
Response to ProposedBAX Price Increment Reduction
Robert Almgren⇤, Khalil al Dayri†, Mathieu Rosenbaum‡, and Shixiang Zhang⇤
April 18, 2014
On March 19, 2014, the Montréal Exchange issued Circular 000-14, “Requestfor Comments: Modifications to the contract specifications for the three-monthCanadian Bankers’ Acceptance Futures Contract” (BAX). The proposal is “. . . that theminimum price fluctuation for the second, third and fourth quarterly BAX contractmonths be reduced from 0.01 per $100 nominal value (a full tick), to 0.005 per $100nominal value (a half tick).” We are writing in support of this proposed change.
Robert and Rosenbaum [2011] and Dayri and Rosenbaum [2012] have identifieda key parameter in determining whether the minimum price increment of a tradedasset is appropriate for the natural dynamics of the price process. This parameter,identified as ⌘, is meaningful for “large-tick” assets and quantifies the aversion toprice changes of market participants. It is estimated by measuring the frequencyof reversals in trade prices. Values of ⌘ near 1/2 are characteristic of markets inwhich the minimum price increment is small enough that it is not significant fortrading. Small values of ⌘ are characteristic of markets in which the price incrementsize is extremely large compared to the intrinsic price dynamics, and represents asubstantial constraint on traders.
We have estimated this parameter on one week of data, covering the four mostsignificant short-term interest rate (STIR) futures products from March 24 throughMarch 28, 2014. These products are the Montréal BAX, the CME Eurodollar, andLIFFE Euribor and Short Sterling. For the BAX, we have used trade and quote datagenerously shared by the Montréal Exchange for the BAX outright complex. ForCME and LIFFE, we have used QB internal data. We exclude short periods aroundmarket open and close, and around signficant information events (for example, theCanadian Bill auction on March 25). We exclude monthly maturities for which thevolumes are very thin and results are unreliable. Our results are shown in Figure 1.
As expected, the computed values of ⌘ are small for all STIR products, andhence the minimum price increments are large compared with the intrinsic marketdynamics. This fact is well known to all market participants, and is a consequenceof low volatility at the short end of the interest rate curve. But two facts are readilyapparent in Figure 1:
⇤Quantitative Brokers LLC, New York, NY, USA, [email protected]†École Polytechnique, Paris, France, [email protected]‡Université Pierre et Marie Curie (Paris 6), Paris, France, [email protected]
1

Edmonton mini-course, July 2016 16
The trouble with small tick sizesLarger tick sizes will bring back capital formation, jobs and investor confidenceCapital Markets Series
David Weild, Edward Kim and Lisa Newport September 2012
The trouble with small tick sizes 7
by depriving small Wall Street firms of a revenue model that supports capital formation by investing in fundamental research, salesmanship and capital support. Cutting the number of ticks to the dollar (i.e., increasing tick sizes) in sub-$2 billion market value stocks will bring life back to capital formation and with it, innovation, job growth and U.S. competitiveness. Cutting the number of ticks to the dollar in large-cap stocks would limit speculation, high-frequency trading and so-called casino capitalism, by adding economic friction back into the markets. In the case of large-cap, high-priced stocks, most stock exchanges believe that an increase in tick size would increase liquidity, while smaller tick sizes would increase liquidity still further for lower-priced, large-cap stocks. Prior to 1998, our stock market structure provided a successful framework within which many small IPOs (sub-$50 million in proceeds) accessed U.S. capital markets. From 1991 to 1997, there were 2,990 small IPOs, representing nearly 80% of all U.S. IPOs, as shown in Exhibit 1 (see page 8). Although tick sizes during this time frame were largely in 12.5-cent increments, bankable spreads were largely in 25-cent increments. For example, in 1991, NASDAQ stocks priced at $10 or more traded with a tick size, or “floor,” of 12.5 cents, while stocks priced below $10 traded with a tick size floor of 3.125 cents. Their bankable spreads, however, still were frequently 25 cents.
“That silent whir that you hear on the trading floors of Goldman Sachs, Morgan Stanley and Credit Suisse is the post-apocalyptic sound of an oxygen-deprived, computer-dominated trading floor that has been reengineered to respond to an infestation of tiny ticks.” David Weild Grant Thornton LLP and former vice chairman of NASDAQ
1995Large-cap subsidized small-cap
Retail markets stocks
Broad institutional sales coverage
Profitable aftermarket (for Wall Street)
Information additive research
Fundamental investing
Uncorrelated industries
Quoted
Large tick sizes
2012No subsidies, small-cap fends for itself
Retail manages portfolios
Narrow institutional sales coverage
Unprofitable aftermarket (for Wall Street)
Information mining (indexing, derivatives)
Technical and index investing
Increasingly correlated industries
Electronic order driven
Small tick sizes
Market structure characteristics
Sources: Grant Thornton LLP, Capital Markets Advisory Partners LLC.
14 The trouble with small tick sizes
asking the comptroller general to study the impact of state regulation on Regulation A, and instructing the SEC to study the impact of decimalization on the number of IPOs and liquidity for small- and mid-cap company securities.12 The JOBS Act also allows the SEC to set a minimum trading increment (1 cent to 10 cents) if it determines that EGCs should be traded and quoted in trading spreads greater than 1 cent. While this provision of the JOBS Act covers only EGCs, we believe all companies, regardless of their market value, would clearly benefit from the support created by higher tick sizes. At a minimum, Congress should allow increased tick sizes for public companies with under $2 billion in market value. An optimal solution, however, would be for Congress to allow higher tick sizes for companies
of all market value sizes so that even large-cap companies can consider using it as a tool to dampen speculative trading and restore investor confidence. Even a company as large as Apple might want to discourage speculative activity and favor long-term investors by taking their tick size up slightly, or even making them smaller to encourage trading. Higher tick sizes will put markets more clearly back into the hands of investors and restore their confidence. It will also eliminate the risk of a two-tiered market, if the choice of tick size is available across all companies.
Tick proliferation and quote flickering damaged the economyTick proliferation,13 which has led to a loss of economic incentives to make markets, and quote flickering,14 are the flesh-eating bacteria of the infrastructure needed to support the IPO market and aftermarket. Small ticks deprive the “on-ramps” (small investment banks) of the economics needed to sustain infrastructure, and these firms react by eating away at (cutting back on) the distribution needed to reach investors, the capital and capital committers required to support institutional liquidity, and the amount and quality of research coverage committed to small-cap stocks. This erosion of small-cap support creates a domino effect that ripples through the IPO, venture and start-up markets. Quote flickering has increasingly become a thorny issue with the relentless advances in technology utilized by high-frequency and other algorithmic traders, but it is also a concern with markets where high-frequency trading is less evident.15 As far back as 2001, in the immediate aftermath of the implementation of decimalization, the SEC recognized the potential harm that could arise from this phenomenon.
12 JOBS Act, Title I, Section 106(b)(6)(A), “Tick Size, Study and Report.”13 Tick proliferation is the decrease in tick sizes.14 Quote flickering is measured by the rapid and repeated updates to the National Best Bid and Offer (NBBO).15 Based on recent conversations one of the authors had with R. Cromwell Coulson, president, CEO and director of OTC Markets Group.
Sources: Grant Thornton LLP and Capital Markets Advisory Partners LLC.
The degradation of support for small-cap public companies ripples through the private company market and likely depresses job formation in both markets.
Small-cap public (asymmetrical order book)
IPO (”canary in the coal mine”)
Venture B,C, D round, etc.
Angel l Venture A
Large-cap public (symmetrical order book)
Start-up: friends, family, angel
32 The trouble with small tick sizes
Why some large investment banks, large investors and stock exchanges fight for smaller tick sizes, despite their negative impact on the economySome large investment banks: Most large investment banks derive significant revenue from some combination of businesses that benefit from smaller tick sizes. These are likely to include:
sub-penny executions and rebates that further cut effective tick sizes below their regulated minimum quote level of one penny per share),
“electronic wood chipper” that takes block orders of 100,000 shares or more and cuts them into 100-share increments),
trading customers use the investment banks’ pipes to directly access the stock market for faster trade executions), and
funds to short — and sometimes acquire — securities).
Some large investors: One of the authors has been in meetings with the senior management of large investment firms where they have confided that, because they have the scale to employ their own research analyst staffs, lower tick sizes and commissions benefit them competitively by depriving their smaller competitors of shared services from the Wall Street firms. As a result, they will tolerate higher volatility in and erosion of the overall market and economy because they believe that they have a competitive advantage in these increasingly opaque markets. In addition, major index, exchange-traded fund and basket trading shops unquestionably benefit from lower execution costs, especially since they do not require equity research or sales services in the traditional sense.
Some stock exchanges: When many of your customers are high-frequency traders that depend on smaller tick sizes, it is difficult to take a broader market position against penny tick sizes without harming your revenue. For this reason, the listed stock exchanges are in a precarious position. The vast majority of high-frequency trading is confined to large- and mid-capped stocks. It is for this reason that we think it should be easy for Congress, the SEC, stock exchanges, investment banks and perhaps even the high-frequency trading community to reach an accommodation in the small-cap segment. As mentioned in a previous section, while this sub-$2 billion public company sector represents over 80% of public companies, it comprises less than 7% of total market value. This was the rationale behind The Wall Street Journal op-ed published on October 27, 2011, titled “How to Revive Small-Cap IPOs: A new, parallel market can provide the critical support companies under $2 billion in value need to go public.”42 One concern expressed by entrepreneurs about listing their company on a newly formed stock market is the fear of being stigmatized if they choose a new, unbranded market. For this reason, any new market would be better accepted under the umbrella of one of the major listed brands (e.g., NYSE or NASDAQ) than it would if it were to go it alone. Alternatively, if all companies were given a choice over their own tick sizes (or an algorithmic way of determining optimal tick sizes was instituted), there would be no risk of “stigma,” and there could be one market with one regime of mass customization.
42 online.wsj.com/article/SB10001424052970203554104577001522344390902.html.
The trouble with small tick sizes 33
Beware of the hidden agendas of those who champion smaller tick sizes
As a result of our past studies (e.g., Why are IPOs in the ICU?
crisis — and more), we are continually engaged in discussions with current and former regulators, securities attorneys, politicians, economists and industry executives. We have learned much from these discussions, including that there may be hidden agendas for pushing for smaller tick sizes when it seems that the evidence is in: small tick sizes, applied to all stocks, are undermining U.S. markets and with them, capital formation, job growth and the U.S. economy. The following is a list of arguments and hidden agendas that may help to explain why some people will argue that smaller tick sizes enhance liquidity for small-cap stocks (the stock market version of “black is white”):
To eliminate sales: Smaller tick sizes eliminate the incentive for stockbrokers to market stocks to investors. By eliminating sales incentives, some hope to eliminate sales practice abuses.
The hidden agenda: To eliminate sales practice abuses (we believe, however, that vigilant enforcement is the proper way to address these abuses).
To eliminate small public companies: Smaller tick sizes make it difficult for small companies to go public. Because small companies fail at higher rates than large companies, investors are protected from these failures.
The hidden agenda: To keep small companies from going public.
To be right: Some market participants are likely to resist admitting that well-intended market structure changes such as the Order Handling Rules in 1997, Regulation ATS in 1998 and Decimalization in 2001 might have had a catastrophic impact on the U.S. economy.
The hidden agenda: No one likes to admit that he or she was wrong. It takes courage to stand up and correct past mistakes. However, we are hopeful that those who are in a position to advocate for these rule changes will follow the example of some, including former chairman and CEO of Citigroup Sandy Weill (on the repeal of Glass-Steagall) and former SEC Chairman Arthur Levitt (on the unintended consequences of the Order Handling Rules), and begin the process of bringing our IPO market back to its former level — one that made the United States the envy of stock markets throughout the world.
To serve special interests: Many market participants benefit from smaller tick sizes, which proliferate the number of price points in which stocks trade, thereby increasing trading complexity and large-cap volume, and increasing their potential to profit even at the expense of the economy.
The hidden agenda: Special interests lobby to change market structure in ways that will increase their profits.
To “protect” consumers: Some market participants blindly support the merits of low-cost trading, not appreciating the harm that is actually inflicted upon investors. The march toward ever-lower costs has, in fact, deprived the markets of adequate economic incentives to support capital formation and economic growth. This, in turn, undermines consumers by eroding investment returns, job growth and tax revenues required to sustain public services (e.g., education, sanitation, and fire and police protection).
The good news is that more and more people are coming around to the view that small tick sizes are making a wasting asset of the U.S. stock markets. We believe that it is only a matter of time before reason prevails and market structure enhancements are implemented to reverse the more than decade-long decline in primary capital formation.
http://www.grantthornton.com/staticfiles/GTCom/Public%20companies%20and%20capital%20markets/Trouble_Small_Ticks.pdf

Edmonton mini-course, July 2016
Tick size effects
What is "large tick" or "small tick"?Nondimensional parametersReversion in generalReversion models: Robert/Rosenbaum (2011)
17

Edmonton mini-course, July 2016
Nondimensional number
How to compare different products5000 US stocksUS and international stocks100's of different futures on CME and worldwide
Natural Gas is "different" than 2-year Treasury
18

Edmonton mini-course, July 2016 19
10,000 lots10,000 lots
109-01¾
109-02
109-02¼
109-02+
109-02¾
109-03
109-03¼
109-03+
109-03¾
109-04
109-04¼
109-04+
109-04¾
109-05
109-05¼
109-05+
07:00 08:00 09:00 10:00 11:00 12:00 13:00
CST on Tue 17 Nov 2015
100 lots100 lots
2.330
2.331
2.332
2.333
2.334
2.335
2.336
2.337
2.338
2.339
2.340
2.341
2.342
2.343
2.344
2.345
10:00 10:02 10:04 10:06 10:08 10:10
CST on Tue 17 Nov 2015
Futures product A Futures product BCan you tell the difference?
lots ofoscillation
directional moves

Edmonton mini-course, July 2016 20
10,000 lots10,000 lots
109-01¾
109-02
109-02¼
109-02+
109-02¾
109-03
109-03¼
109-03+
109-03¾
109-04
109-04¼
109-04+
109-04¾
109-05
109-05¼
109-05+
07:00 08:00 09:00 10:00 11:00 12:00 13:00
CST on Tue 17 Nov 2015
100 lots100 lots
2.330
2.331
2.332
2.333
2.334
2.335
2.336
2.337
2.338
2.339
2.340
2.341
2.342
2.343
2.344
2.345
10:00 10:02 10:04 10:06 10:08 10:10
CST on Tue 17 Nov 2015
2-year Treasury ZTZ5 Natural Gas NGZ5
6 hours 10 minutes

Edmonton mini-course, July 2016
Dimensional parameters
Have units in themvolatility: price change per √time
daily volume: shares or lots per day
21
$ for stock, maybe nondim for futures
second, hour, or day
dimensional dimensional
Edmonton mini-course, July 2016
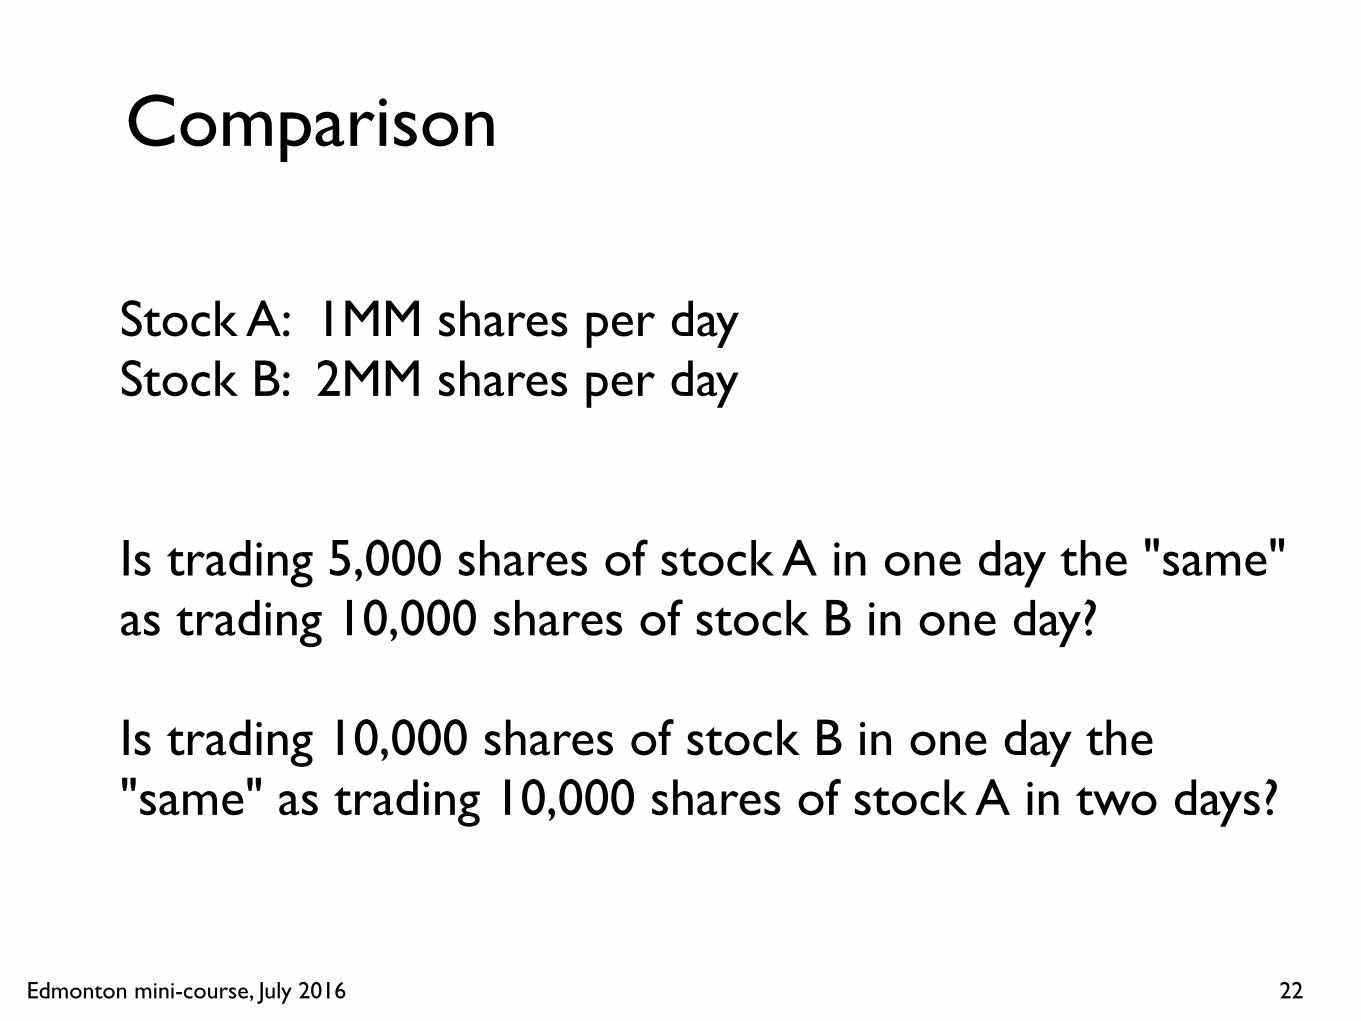
Comparison
Stock A: 1MM shares per dayStock B: 2MM shares per dayIs trading 5,000 shares of stock A in one day the "same" as trading 10,000 shares of stock B in one day?Is trading 10,000 shares of stock B in one day the "same" as trading 10,000 shares of stock A in two days?
22

Edmonton mini-course, July 2016
Nondimensionalization
23
Example: market impactTrade X shares in time TPrice impact I = ?
Impact as fractionof daily volatility Trade size as fraction
of daily volume
Nondimensionalexponent and coefficient
Nondimensionalization brings to same scale Tick size is nondimensional difference
Edmonton mini-course, July 2016
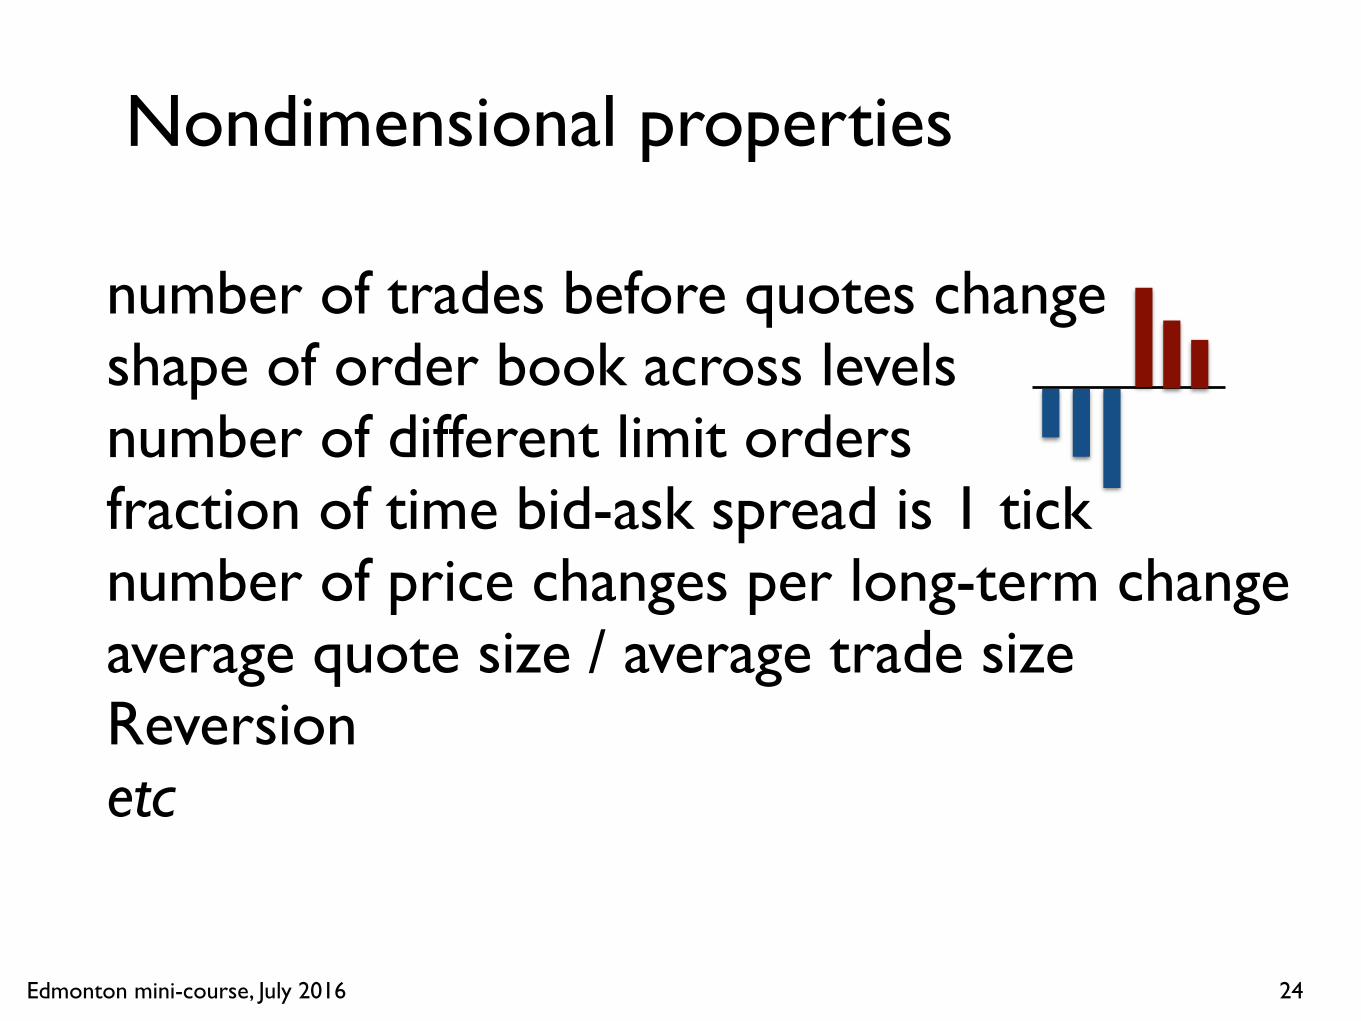
Nondimensional properties
number of trades before quotes changeshape of order book across levelsnumber of different limit ordersfraction of time bid-ask spread is 1 ticknumber of price changes per long-term changeaverage quote size / average trade sizeReversionetc
24
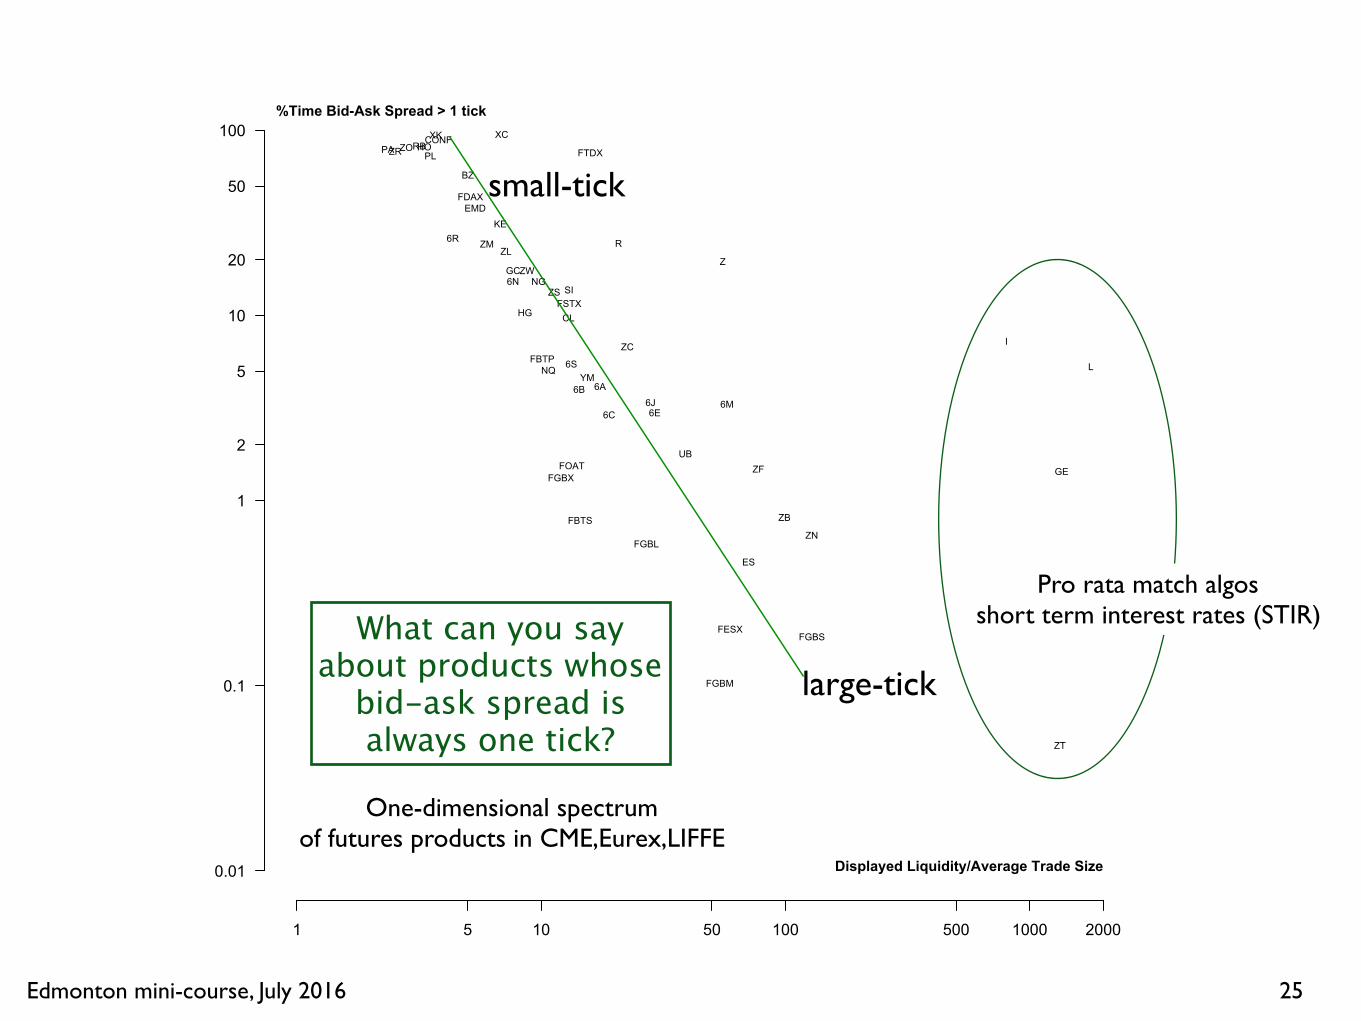
Edmonton mini-course, July 2016 25
1 5 10 50 100 500 1000 2000
0.01
0.1
1
2
5
10
20
50
100
EMD
ES
NQYM
GE
ZT
ZF
ZN
ZB
UB
CL
NG
HORB
BZ
6A6B
6C 6E6J 6M
6N
6R
6S
GC
HG
PAPL
SI
XCXK
ZC
ZLZM
ZOZR
ZS
ZW
KE
FGBS
FGBM
FGBL
FGBX
FBTP
FBTS
FOAT
CONF
FDAX
FESX
FSTX
FTDX
I
L
R
Z
%Time Bid-Ask Spread > 1 tick
Displayed Liquidity/Average Trade Size
Pro rata match algosshort term interest rates (STIR)
One-dimensional spectrum of futures products in CME,Eurex,LIFFE
large-tick
small-tick
What can you say about products whose
bid-ask spread isalways one tick?

Edmonton mini-course, July 2016
Reversion
Rapid back-and-forth price movesReversion of trade prices
bid-ask bouncelarge-tick effects
Reversion of quote midpoint
26
Edmonton mini-course, July 2016
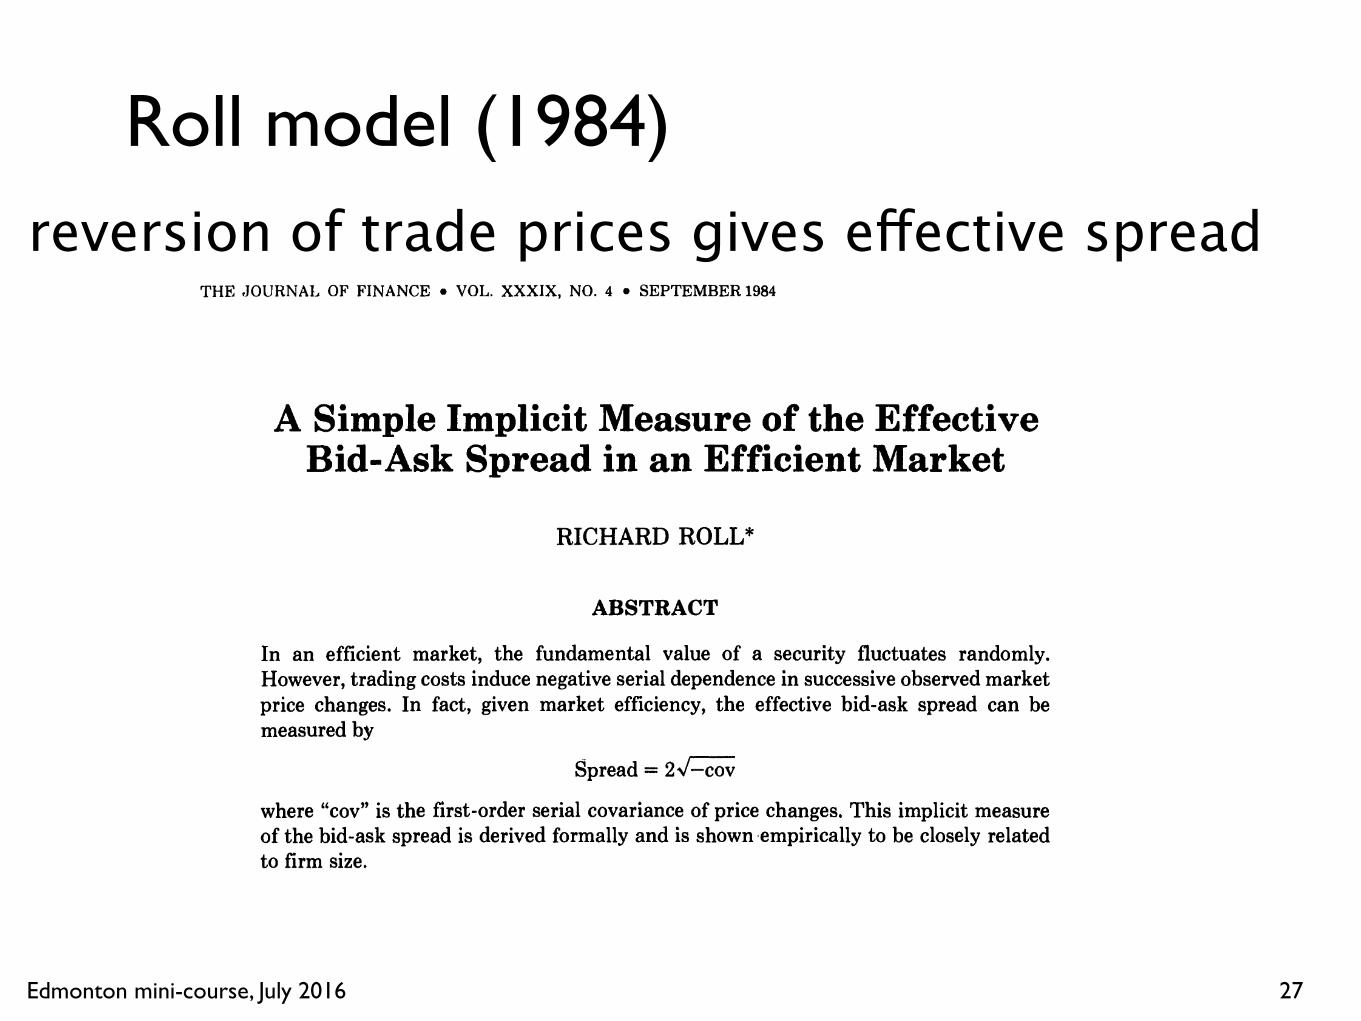
Roll model (1984)
27
THE ,JOUKNAI, OF FINANCE VOL. XXXIX, NO. 4 SEPTEMBER1984
A Simple Implicit Measure of the Effective Bid-Ask Spread in an Efficient Market
RICHARD ROLL*
ABSTRACT
In an efficient market, the fundamental value of a security fluctuates randomly. However, trading costs induce negative serial dependence in successive observed market price changes. In fact, given market efficiency, the effective bid-ask spread can be measured by
Spread = 2 G
where "cov" is the first-order serial covariance of price changes. This implicit measure of the bid-ask spread is derived formally and is shown empirically to be closely related to firm size.
FINANCIALSCHOLARS AND PRACTITIONERS are interested in transaction costs for obvious reasons: the net gains to investments are affected by such costs and market equilibrium returns are likely to be influenced by cross-sectional differ-ences in costs.
For the practical investor, the measurement of trading costs is painful but direct. (They appear on his monthly statement of account.) For the empirical researcher, trading cost measurement can itself be costly and subject to consid-erable error. For example, brokerage commissions are negotiated and thus depend on a number of hard-to-quantify factors such as the size of transaction, the amount of business done by that investor, and the time of day or year. The other blade of trading costs, the bid-ask spread, is perhaps even more fraught with measurement problems. The quoted spread is published for a few markets but the actual trading is done mostly within the quotes.
This paper presents a method for inferring the effective bid-ask spread directly from a time series of market prices. The method requires no data other than the prices themselves; so it is very cheap. It does, however, require two major assumptions:
1) The asset is traded in an informationally efficient market. 2) The probability distribution of observed price changes is stationary (at least
for short intervals of, say, two months). Given these assumptions, an implicit bid-ask spread measure is derived in Section I. It is investigated empirically in Section 11.
* Graduate School of Management, University of California a t Los Angeles. I am grateful for the thoughtful and constructive comments of Gordon Alexander, Eugene Fama, Dan Galai, Jon Ingersoll, Eduardo Lemgruber, Ron Masulis, Mark Rubinstein, and the referee.
1127
reversion of trade prices gives effective spread

Edmonton mini-course, July 2016
Roll model
28
2,000 lots2,000 lots
109-04
109-04¼
109-04+
109-04¾
13:00 13:02 13:04 13:06 13:08 13:10 13:12 13:14 13:16 13:18 13:20
EDT on Thu 17 Sep 2015
Suppose temporarily that bid/ask do not move
2-year Treasury ZTZ5
Edmonton mini-course, July 2016 29
1128 T h e Journal of Finance
I. The Implicit Bid-Ask Spread
If the market is informationally efficient, and trading costs are zero, the observed market price contains all relevant information.' A change in price will occur if and only if unanticipated information is received by market participants. There will be no serial dependence in successive price changes (aside from that generated by serial dependence in expected returns).
When transactions are costly to effectuate, a market maker (or dealer) must be compensated; the usual compensation arrangement includes a bid-ask spread, a small region of price which brackets the underlying value of the asset. The market is still informationally efficient if the underlying value fluctuates ran- domly. We might think of "value" as being the center of the spread. When news arrives, both the bid and the ask prices move to different levels such that their average is the new equilibrium value. Thus, the bid-ask average fluctuates randomly in an efficient market.
Observed market price changes, however, are no longer independent because recorded transactions occur at either the bid or the ask, not at the average. As pointed out by Niederhoffer and Osborne [7], negative serial dependence in observed price changes should be anticipated when a market maker is involved in transactions. To see why, assume for simplicity of illustration that all trans- actions are with the market maker and that his spread is held constant over time a t a dollar amounts. Given no new information about the security, it is reasonable to assume further that successive transactions are equally likely to be a purchase or a sale by the market maker as traders arrive randomly on both sides of the market for exogenous reasons of their own.
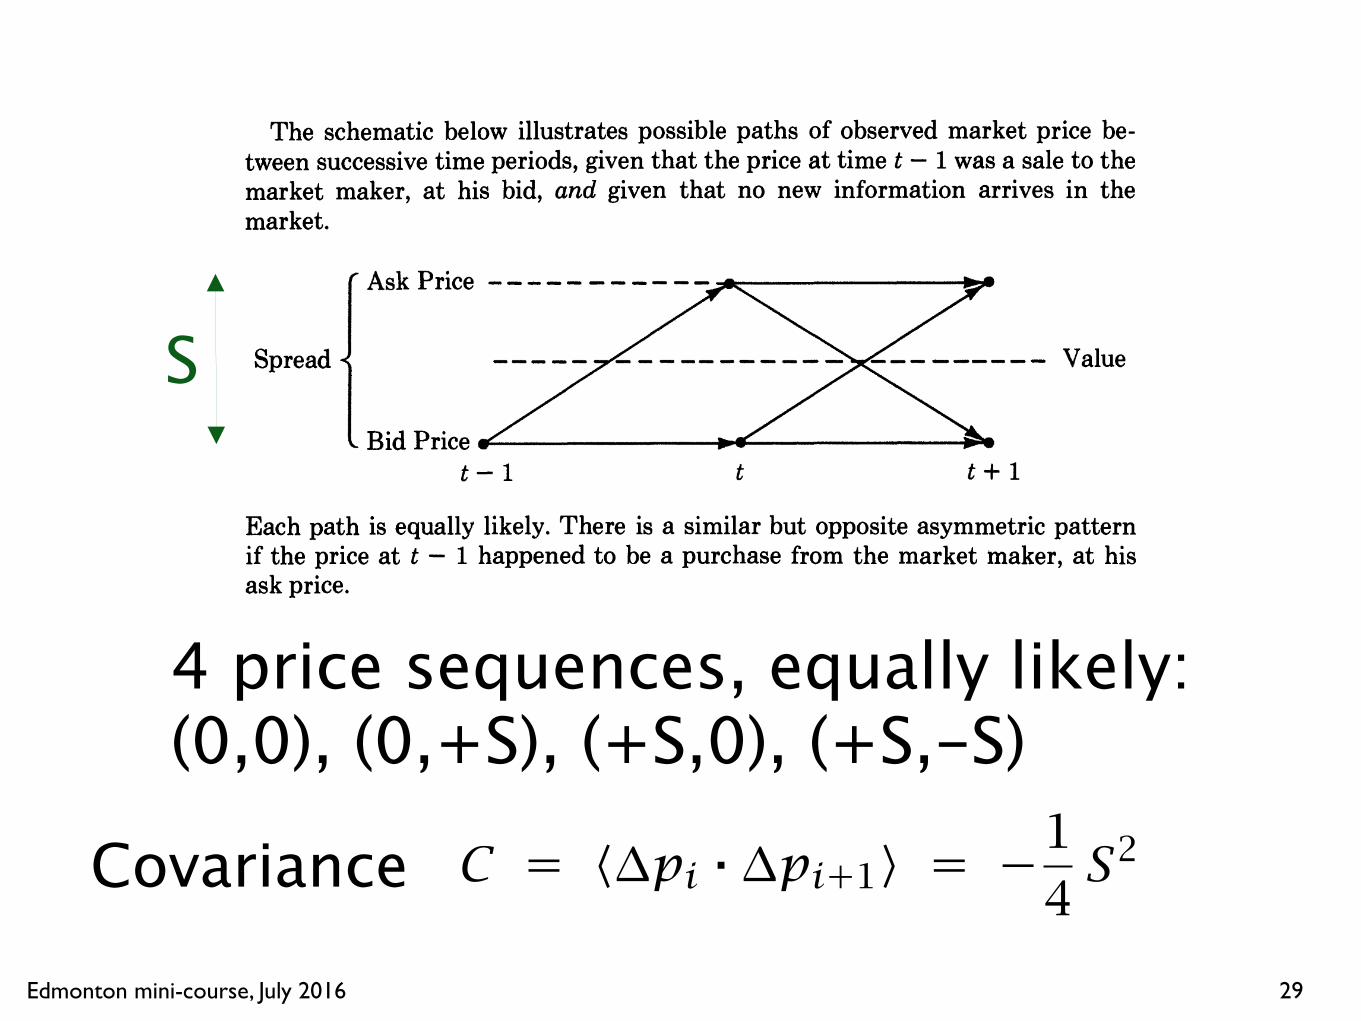
The schematic below illustrates possible paths of observed market price be- tween successive time periods, given that the price at time t - 1was a sale to the market maker, at his bid, and given that no new information arrives in the market.
Ask Price ------- -- --
Spread ----- ----------- --------- Value( 1 Bid Price
Each path is equally likely. There is a similar but opposite asymmetric pattern if the price at t - 1happened to be a purchase from the market maker, at his ask price.
Thus, the joint probability of successive price changes (Apt = pt - pt-,) in trades initiated other than by new information depends upon whether the last transaction was at the bid or a t the ask. This probability distribution (conditional on no new information) consists of two parts.
'Cf., Samuelson [9] and Fama [4]; but see also Grossman and Stiglitz [6] for proof that "strong- form" efficiency will not usually obtain.
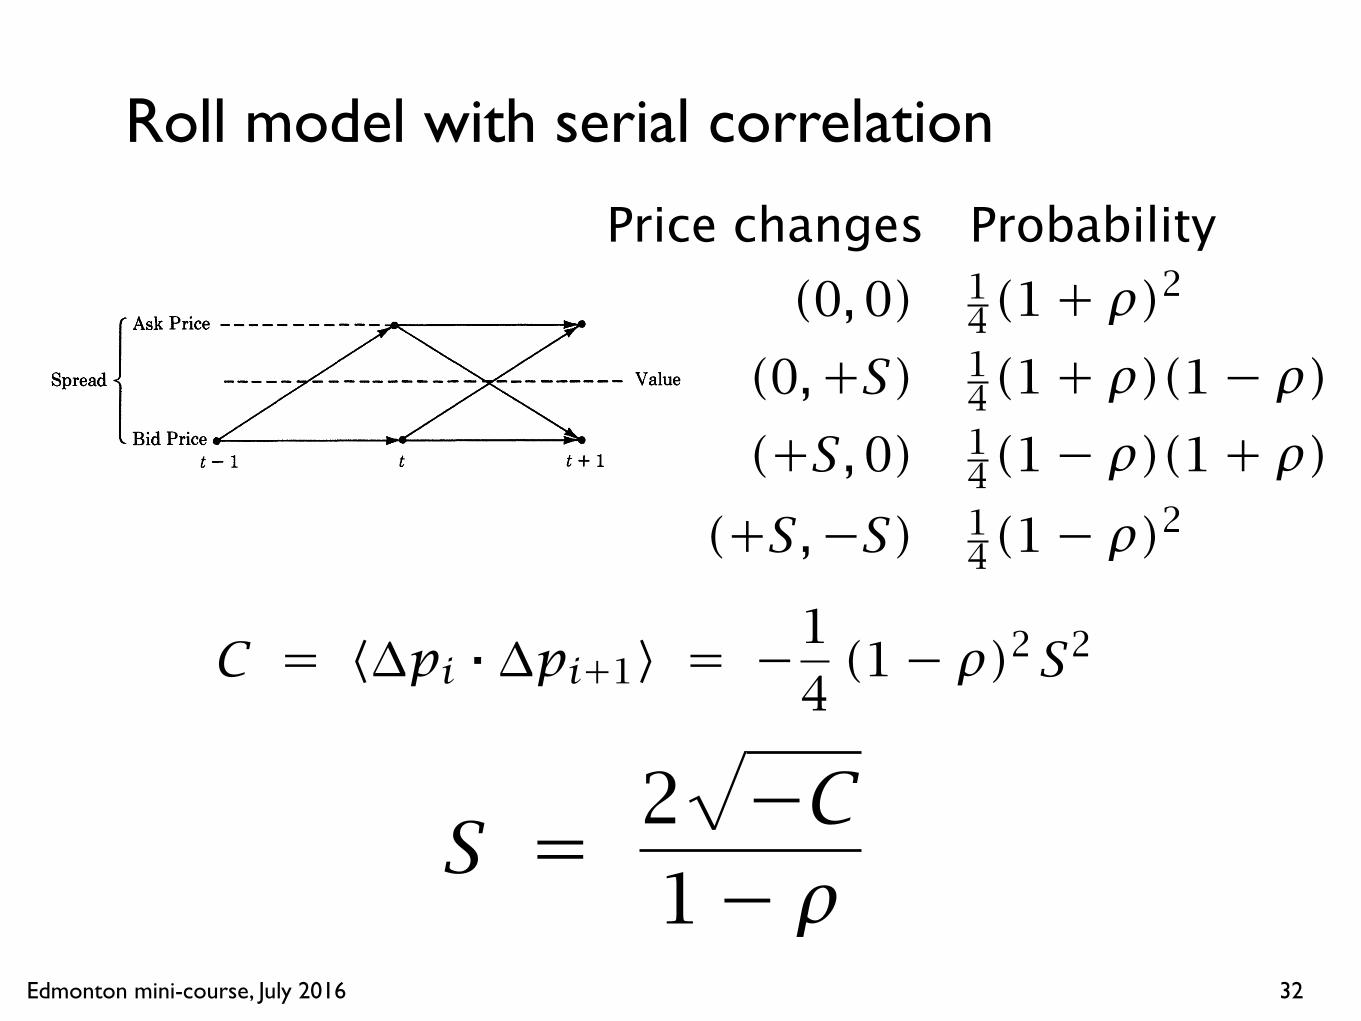
4 price sequences, equally likely: (0,0), (0,+S), (+S,0), (+S,-S)
Covariance
S
Edmonton mini-course, July 2016
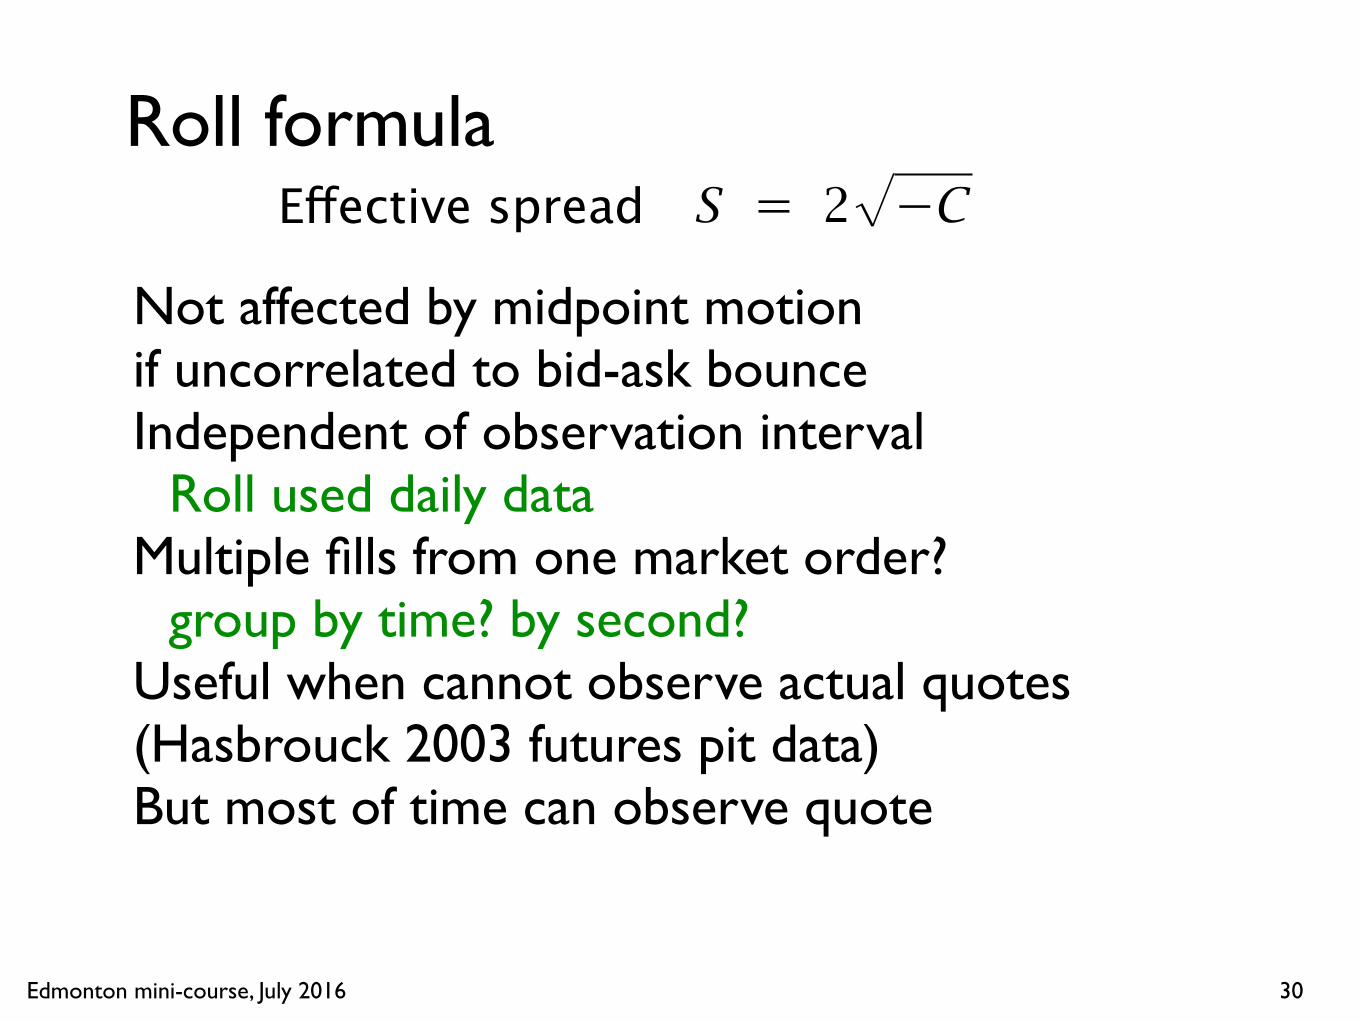
Roll formula
Not affected by midpoint motion if uncorrelated to bid-ask bounceIndependent of observation interval
Roll used daily dataMultiple fills from one market order?
group by time? by second?Useful when cannot observe actual quotes(Hasbrouck 2003 futures pit data)But most of time can observe quote
30
Effective spread

Edmonton mini-course, July 2016
Roll model with serial correlation
31
ρ is serial correlation of pricesnot of price changes
Edmonton mini-course, July 2016
Roll model with serial correlation
32
1128 T h e Journal of Finance
I. The Implicit Bid-Ask Spread
If the market is informationally efficient, and trading costs are zero, the observed market price contains all relevant information.' A change in price will occur if and only if unanticipated information is received by market participants. There will be no serial dependence in successive price changes (aside from that generated by serial dependence in expected returns).
When transactions are costly to effectuate, a market maker (or dealer) must be compensated; the usual compensation arrangement includes a bid-ask spread, a small region of price which brackets the underlying value of the asset. The market is still informationally efficient if the underlying value fluctuates ran- domly. We might think of "value" as being the center of the spread. When news arrives, both the bid and the ask prices move to different levels such that their average is the new equilibrium value. Thus, the bid-ask average fluctuates randomly in an efficient market.
Observed market price changes, however, are no longer independent because recorded transactions occur at either the bid or the ask, not at the average. As pointed out by Niederhoffer and Osborne [7], negative serial dependence in observed price changes should be anticipated when a market maker is involved in transactions. To see why, assume for simplicity of illustration that all trans- actions are with the market maker and that his spread is held constant over time a t a dollar amounts. Given no new information about the security, it is reasonable to assume further that successive transactions are equally likely to be a purchase or a sale by the market maker as traders arrive randomly on both sides of the market for exogenous reasons of their own.
The schematic below illustrates possible paths of observed market price be- tween successive time periods, given that the price at time t - 1was a sale to the market maker, at his bid, and given that no new information arrives in the market.
Ask Price ------- -- --
Spread ----- ----------- --------- Value( 1 Bid Price
Each path is equally likely. There is a similar but opposite asymmetric pattern if the price at t - 1happened to be a purchase from the market maker, at his ask price.
Thus, the joint probability of successive price changes (Apt = pt - pt-,) in trades initiated other than by new information depends upon whether the last transaction was at the bid or a t the ask. This probability distribution (conditional on no new information) consists of two parts.
'Cf., Samuelson [9] and Fama [4]; but see also Grossman and Stiglitz [6] for proof that "strong- form" efficiency will not usually obtain.
Price changes Probability
Edmonton mini-course, July 2016
20 lots20 lots1.37161.37171.37181.37191.37201.37211.37221.37231.37241.37251.37261.37271.37281.37291.37301.37311.37321.37331.37341.37351.37361.37371.37381.37391.3740
10:03:00 10:03:10 10:03:20 10:03:30 10:03:40 10:03:50 10:04:00
EST on Tue 17 Nov 2015
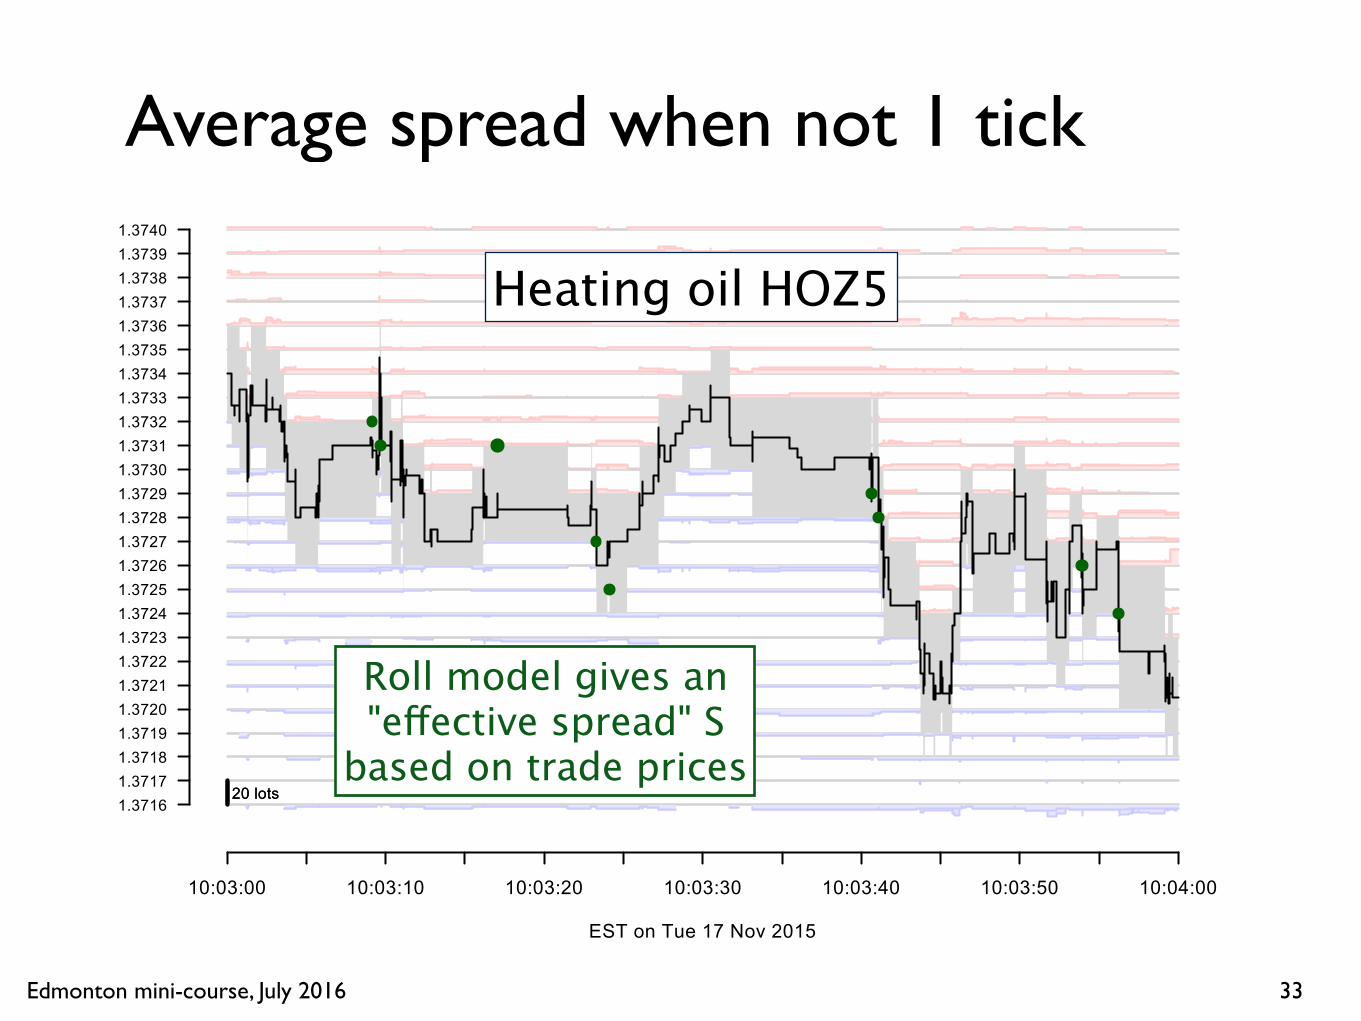
Average spread when not 1 tick
33
Heating oil HOZ5
Roll model gives an"effective spread" S
based on trade prices

Edmonton mini-course, July 2016
Reversion complicates volatility
34
Price (or log-price) X(t)
if increments are uncorrelated
Edmonton mini-course, July 2016
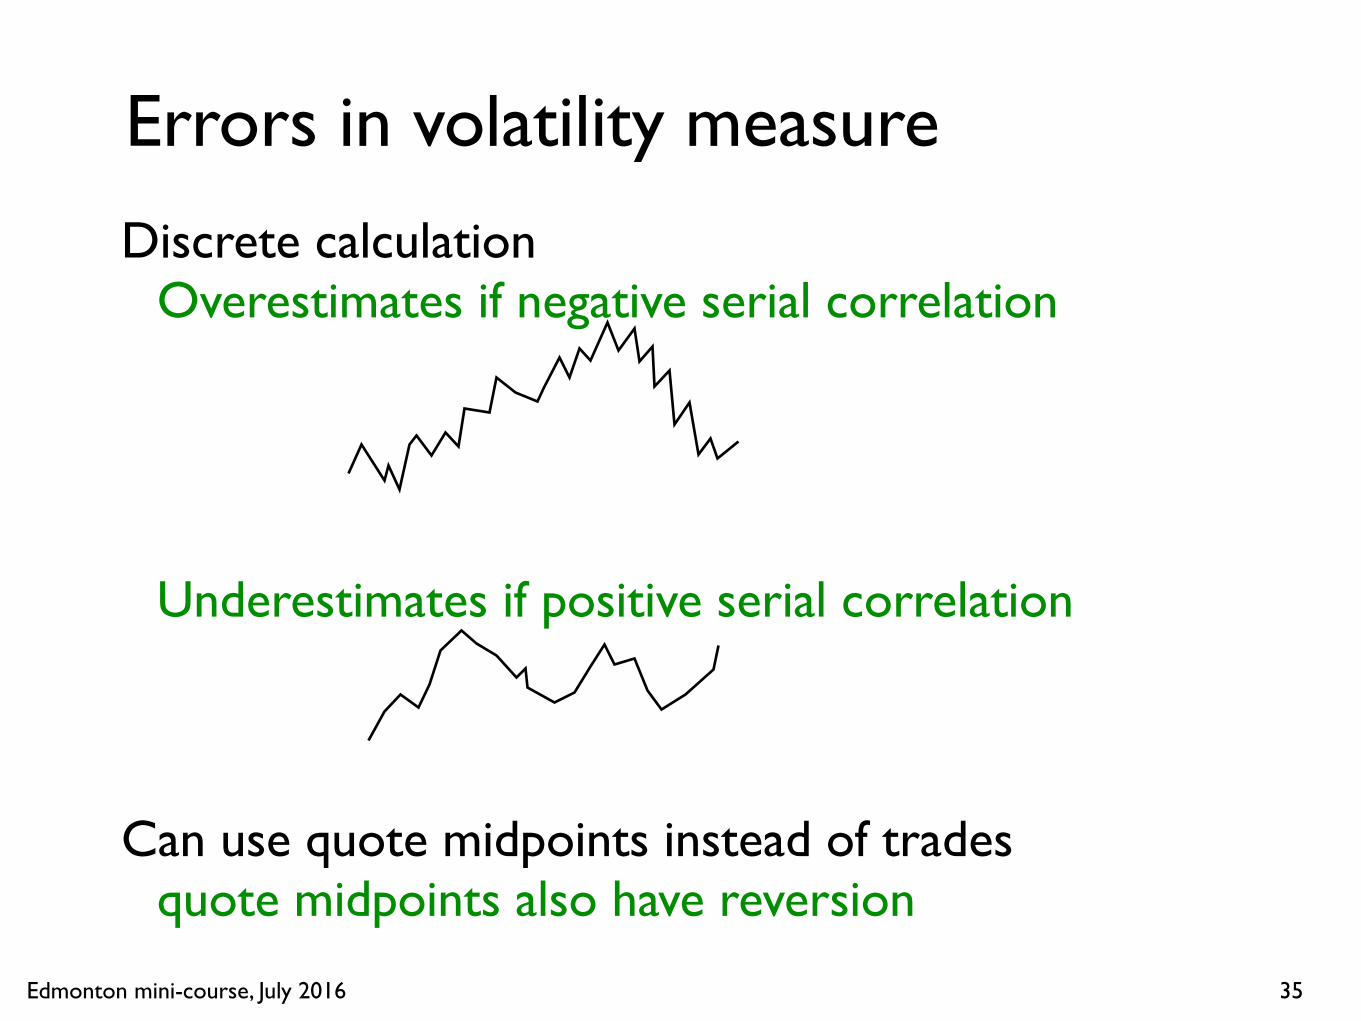
Errors in volatility measure
Discrete calculationOverestimates if negative serial correlation
Underestimates if positive serial correlation
Can use quote midpoints instead of tradesquote midpoints also have reversion
35

Edmonton mini-course, July 2016
Reversion complicates trading
36
100 lots100 lots
1073.8
1073.9
1074.0
1074.1
1074.2
1074.3
1074.4
1074.5
1074.6
03:52:00 03:52:40 03:53:20 03:54:00 03:54:40 03:55:20
CST on Thu 19 Nov 2015
BUY 8 GCZ5 BOLT
03:52:16
Done at 03:55:12
Exec 1074.2VWAP 1074.1
Strike 1074.35
Sweep 1074.41
GC
Z5Passive fillsCumulative execMarket tradesLimit ordersCumulative VWAPMicropriceBid-ask
Exec = 1074.2 Cost to strike = -1.88 tick = -$18.75 per lot
03:52:00 03:52:40 03:53:20 03:54:00 03:54:40 03:55:20
0
2
4
6
8
Exec
uted
and
wor
king
qua
ntity
50
100
150
203
Cum
ulat
ive
mar
ket v
olum
e
03:52:16
Done at 03:55:12
1 @ 1074.3
2 @ 1074.3
1 @ 1074.2
2 @ 1074.1
1 @ 1074.0
1 @ 1074.0
3.9% mkt / Limit = 8%
8 passv 0 aggrPassive fillsWorking quantityCumulative Market VolumeFilled quantityAggressive quantity
Flicker up:should you follow?
Limit buy ordersresting in book
Edmonton mini-course, July 2016
Tick size and reversion
Reversion is easy to measure nondimensionallyHow can we measure discreteness (tick size)When is tick too large or too small?
37
Edmonton mini-course, July 2016
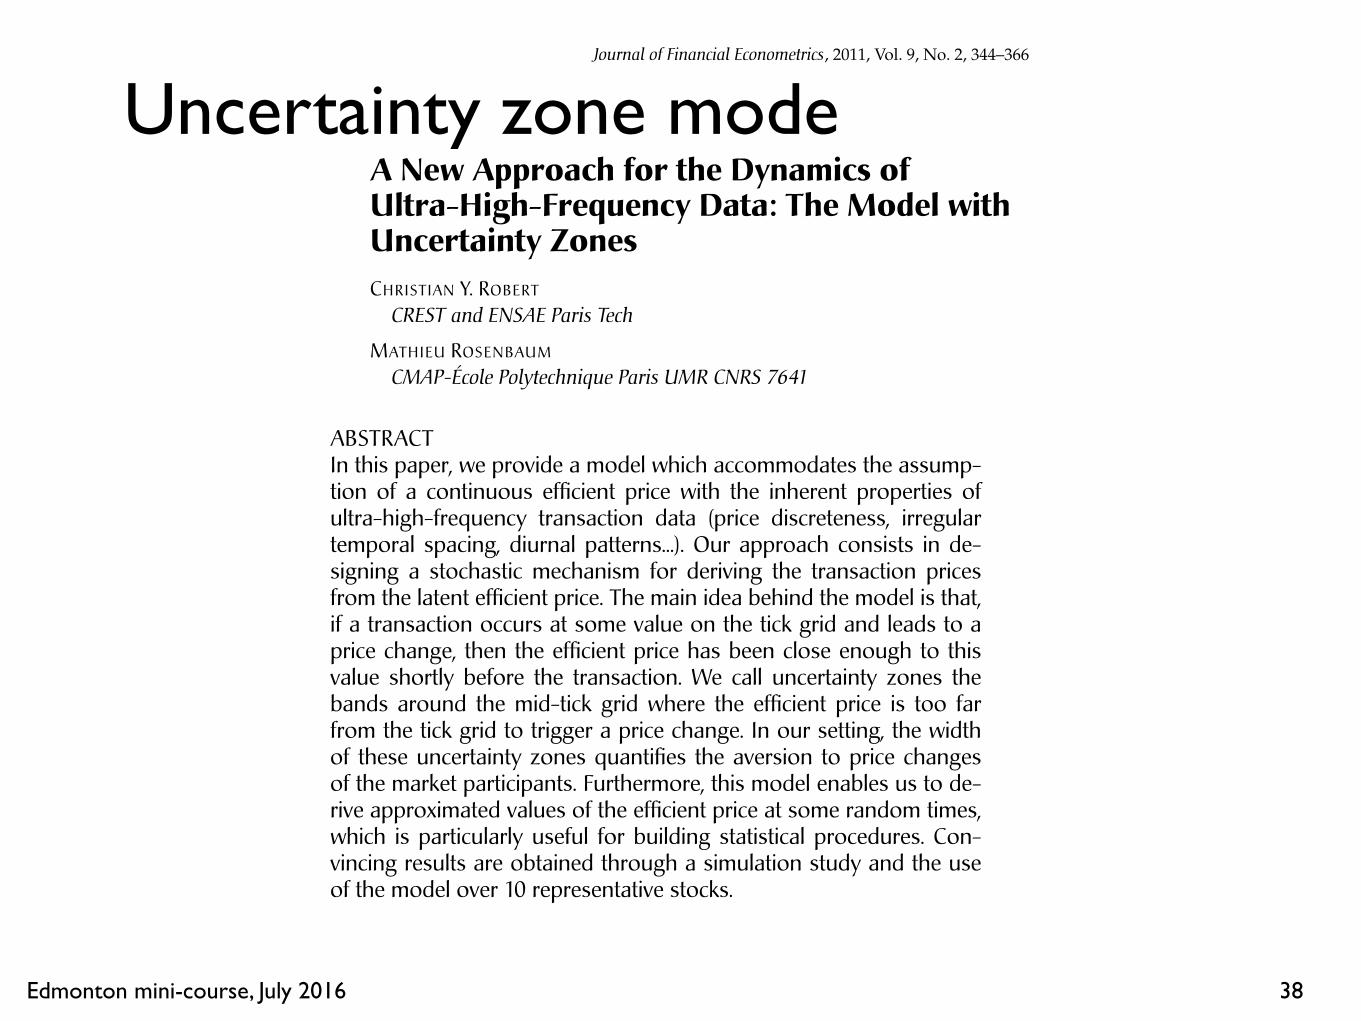
Uncertainty zone mode
38
Journal of Financial Econometrics, 201 , Vol. 9, No. 2, 344–366
A New Approach for the Dynamics ofUltra-High-Frequency Data: The Model withUncertainty Zones
CHRISTIAN Y. ROBERT
CREST and ENSAE Paris Tech
MATHIEU ROSENBAUM
CMAP-École Polytechnique Paris UMR CNRS 7641
ABSTRACTIn this paper, we provide a model which accommodates the assump-tion of a continuous efficient price with the inherent properties ofultra-high-frequency transaction data (price discreteness, irregulartemporal spacing, diurnal patterns...). Our approach consists in de-signing a stochastic mechanism for deriving the transaction pricesfrom the latent efficient price. The main idea behind the model is that,if a transaction occurs at some value on the tick grid and leads to aprice change, then the efficient price has been close enough to thisvalue shortly before the transaction. We call uncertainty zones thebands around the mid-tick grid where the efficient price is too farfrom the tick grid to trigger a price change. In our setting, the widthof these uncertainty zones quantifies the aversion to price changesof the market participants. Furthermore, this model enables us to de-rive approximated values of the efficient price at some random times,which is particularly useful for building statistical procedures. Con-vincing results are obtained through a simulation study and the useof the model over 10 representative stocks.
Nowadays, a large amount of ultra-high-frequency financial data is available.Indeed, practitioners are able to accurately record the most relevant market quan-tities such as transaction prices, bid-ask quotes, bid-ask volumes, and all associ-ated time stamps. It is well known that these data are characterized by irregular
We are grateful to Charles-Albert Lehalle from Crédit Agricole Cheuvreux, Groupe CALYON, for pro-viding the data and for fruitful discussions. We also thank Nour Meddahi for helpful comments.Address correspondence to Christian Y. Robert, CREST and ENSAE Paris Tech Timbre J120, 3 AvenuePierre Larousse, 92245 Malakoff Cedex, France, or e-mail: [email protected] and to Mathieu Rosen-baum, CMAP-École Polytechnique Paris UMR CNRS 7641, 91128 Palaiseau Cedex, France, or e-mail:[email protected].
doi: 10.1093/jjfinec/nbq023
Advance Access publication June 29, 2010
c⃝ The Author 2010. Published by Oxford University Press. All rights reserved.
For permissions, please e-mail: [email protected].
1
at New
York University on July 12, 2011
jfec.oxfordjournals.orgD
ownloaded from

Edmonton mini-course, July 2016 39
"True" underlying price (or log-price) X(t):
How does the continuous process X(t)relate to the discrete grid of spacing α?
Consider trade prices P(t) for now.
k α
(k+1) α
(k-1) α

Edmonton mini-course, July 2016
What does not work
40
k α
(k+1) α
(k-1) α
Price
Arbitrary horizontal spacing for clarity
Ck
Ck+1
Ck+1

Edmonton mini-course, July 2016
Does not work becauseinfinite fluctuations across boundaries
41
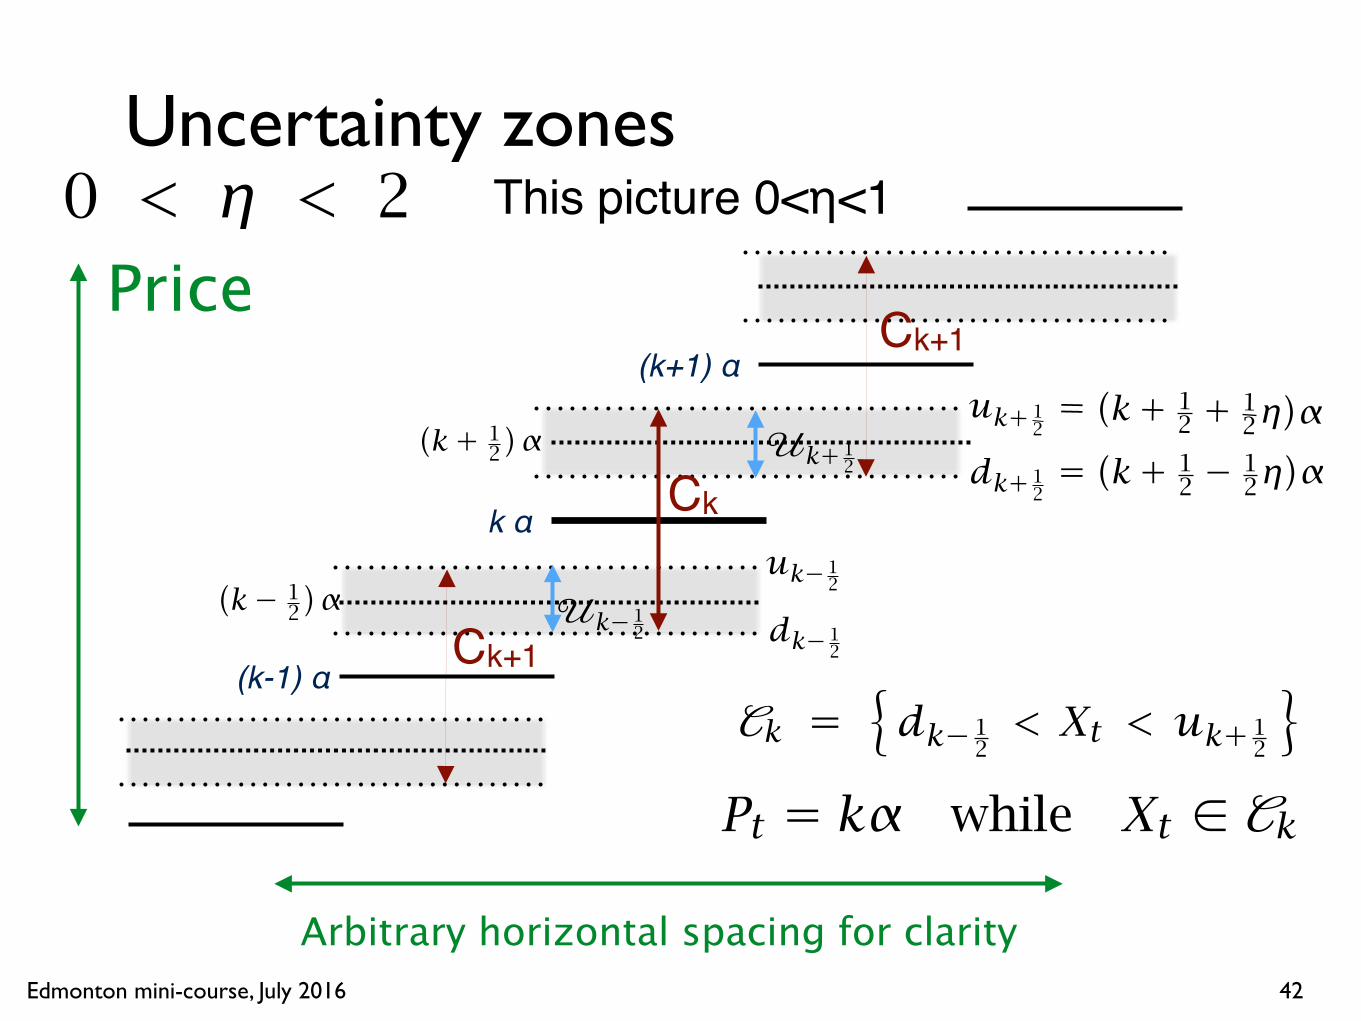
Edmonton mini-course, July 2016
Uncertainty zones
42
k α
(k+1) α
(k-1) α
Price
Arbitrary horizontal spacing for clarity
Ck+1
Ck
Ck+1
This picture 0<η<1
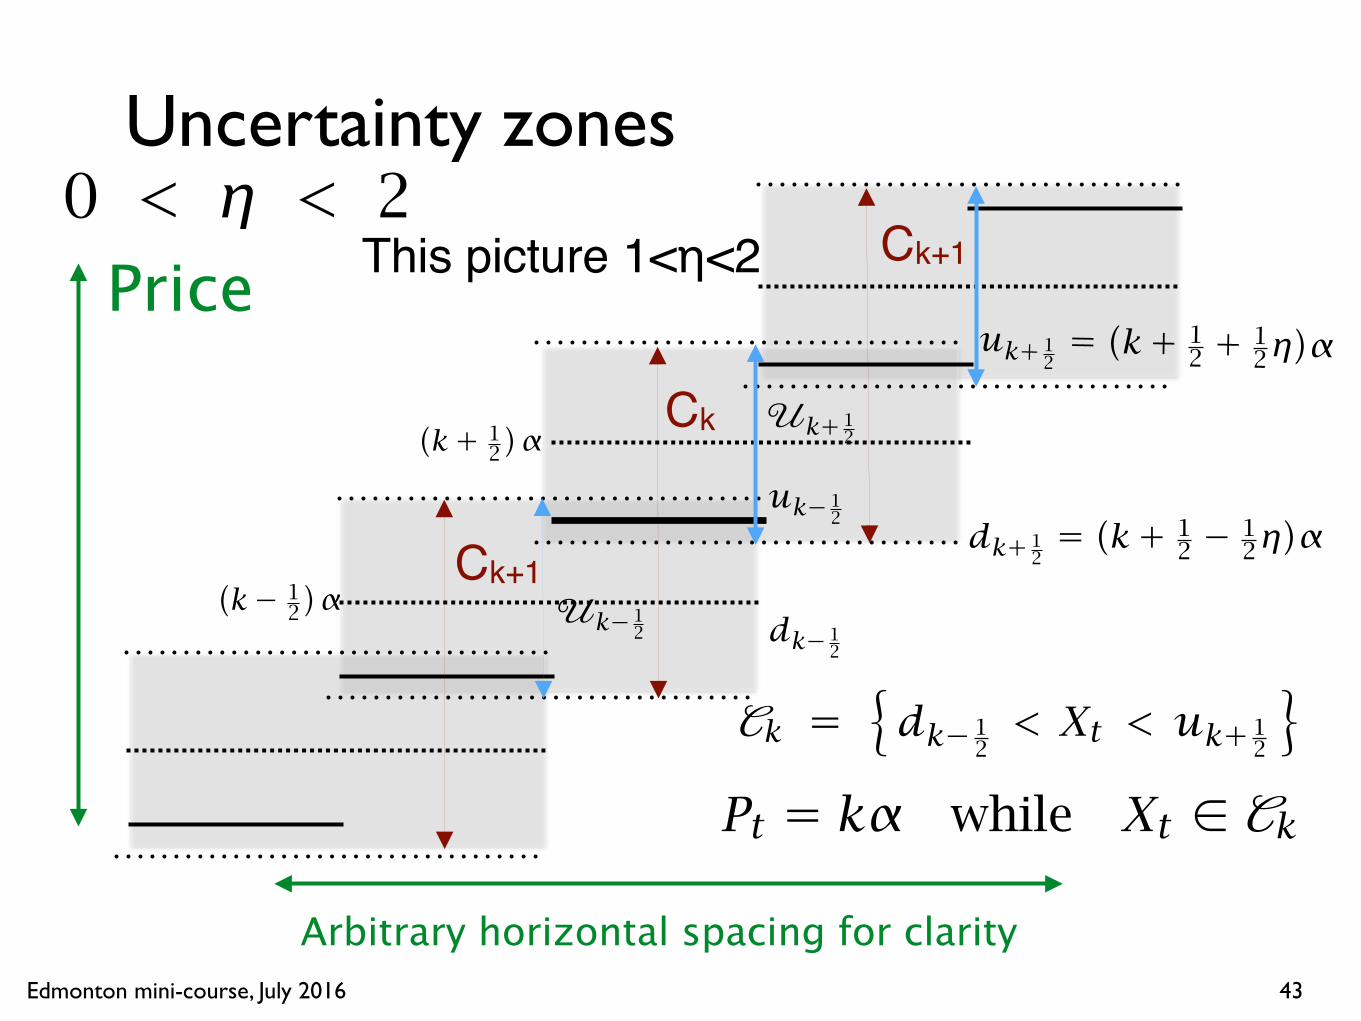
Edmonton mini-course, July 2016
Uncertainty zones
43
Price
Arbitrary horizontal spacing for clarity
Ck+1
Ck
Ck+1
This picture 1<η<2

Edmonton mini-course, July 2016
Trades Pt occur at price k α while Xt ∈ Ck
At least one trade occurs during each intervalTrade price changes happen when Pt exits CkParameter η measures "stickiness" of price how far "real" price has to move beyond midbefore trade prices adjustη<1: trade at new price before Xt gets there
tick size is "too large"η>1: trade at new price after Xt gets there
tick size is "too small""Ideal" market would have η = 1
44
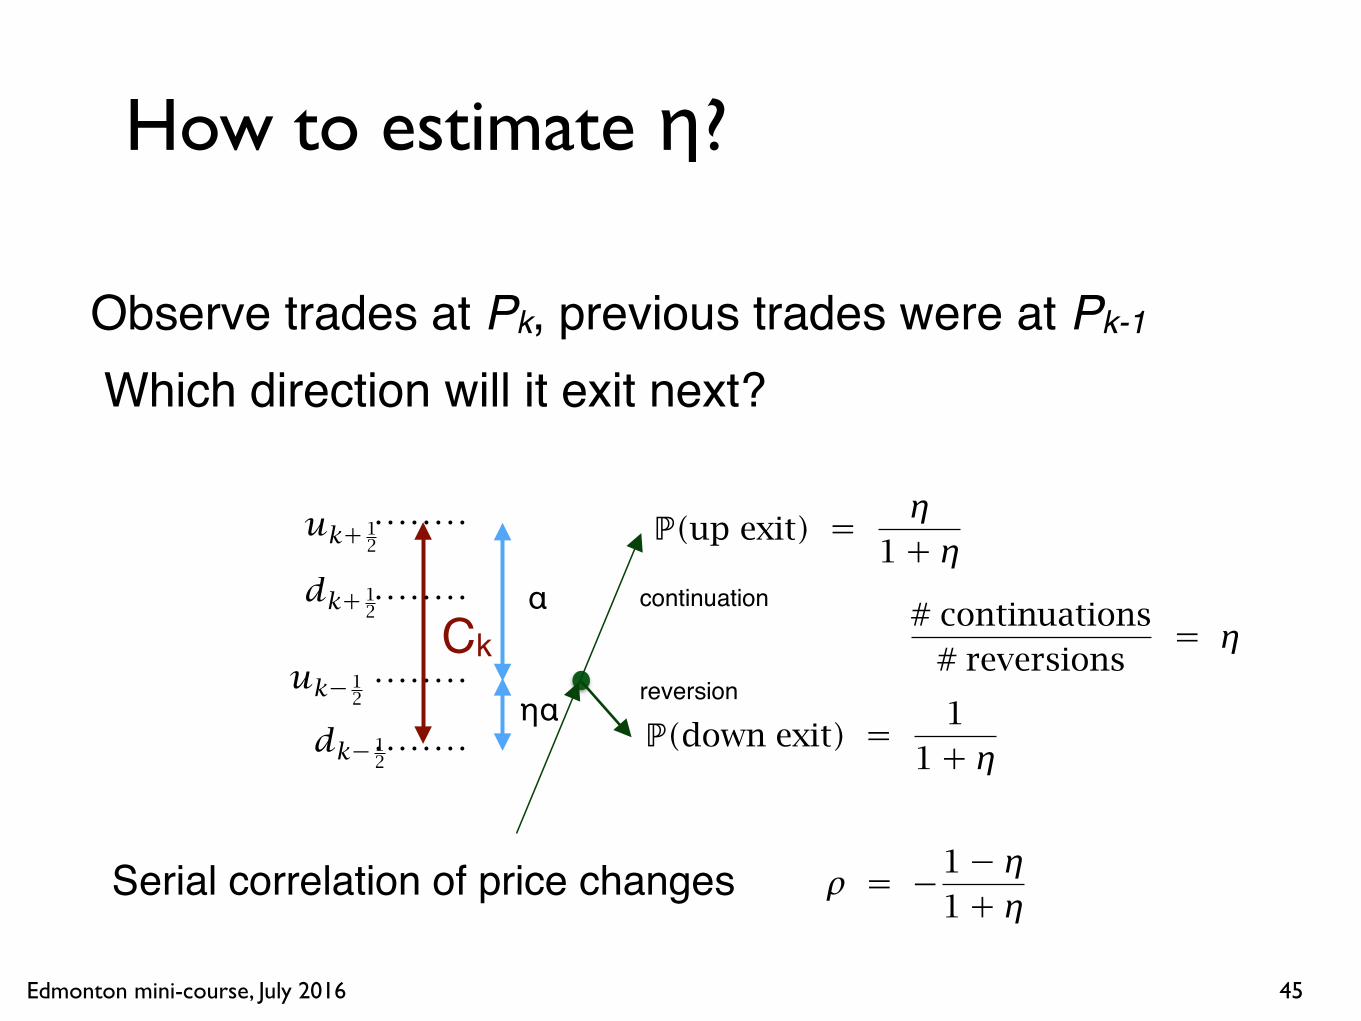
Edmonton mini-course, July 2016
How to estimate η?
45
Observe trades at Pk, previous trades were at Pk-1
Which direction will it exit next?
Ck
ηα
α continuation
reversion
Serial correlation of price changes

Edmonton mini-course, July 2016
Estimating volatility
Observe prices P0, P1, P2, P3, ..., PNat times t0, t1, t2, t3, ..., tN
46
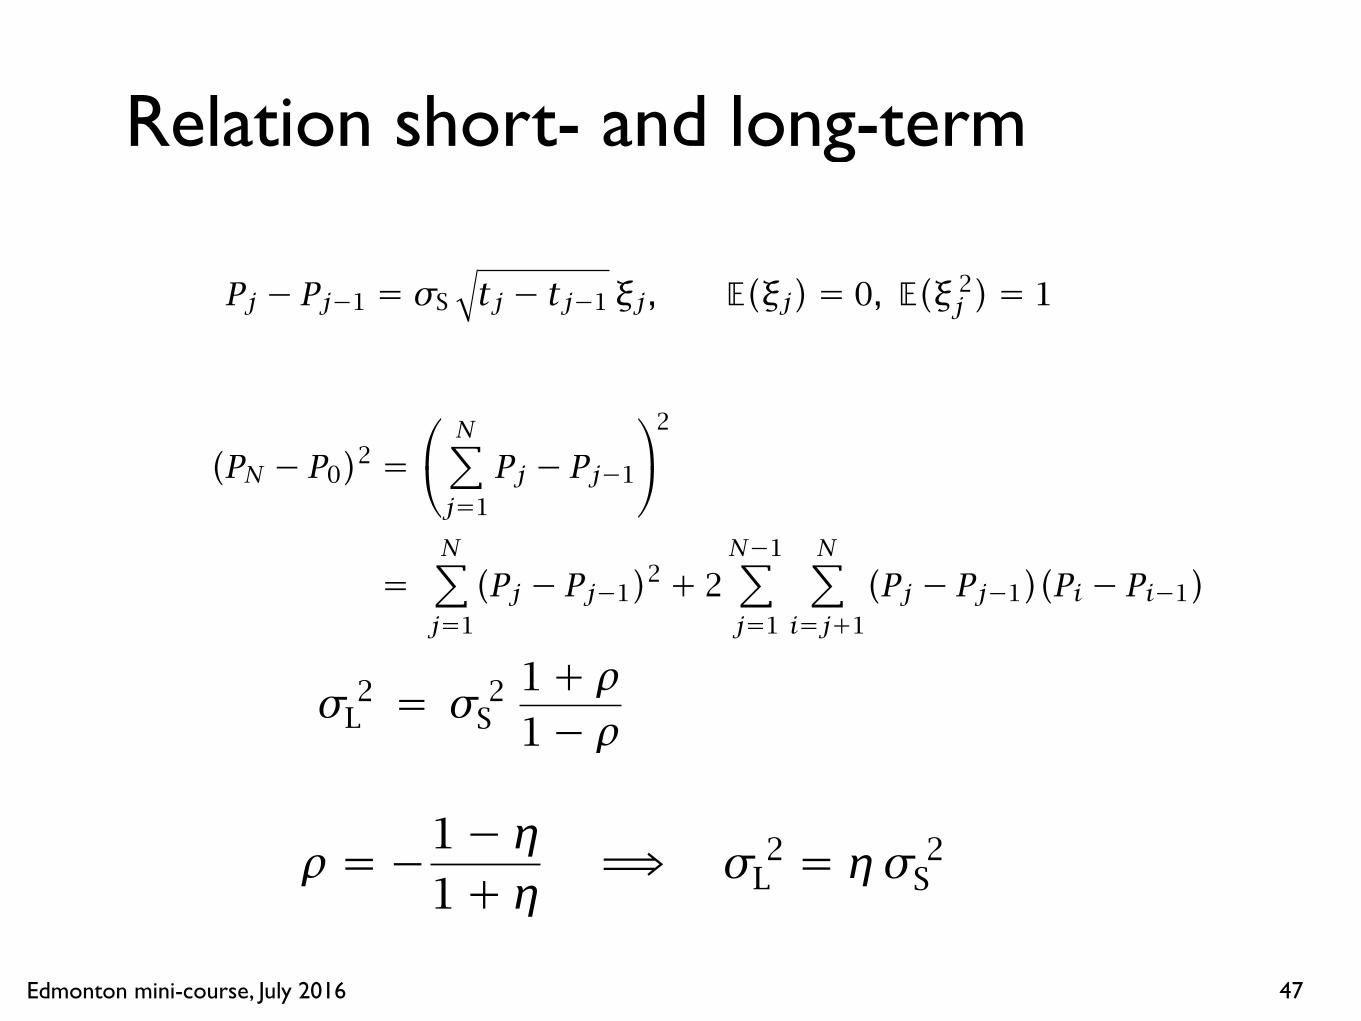
Edmonton mini-course, July 2016
Relation short- and long-term
47

Edmonton mini-course, July 2016
"Signature plot"
48
Δt
Volatility on time scale Δt σL
σS
ρ<0 (typical)
ρ>0

Edmonton mini-course, July 2016
Effective spread = η α
49
k α
(k+1) α
X(t) here:trades only at kα
X(t) here:trades at kα or (k+1)α
width = ηα
X(t) here:trades only at (k+1)α
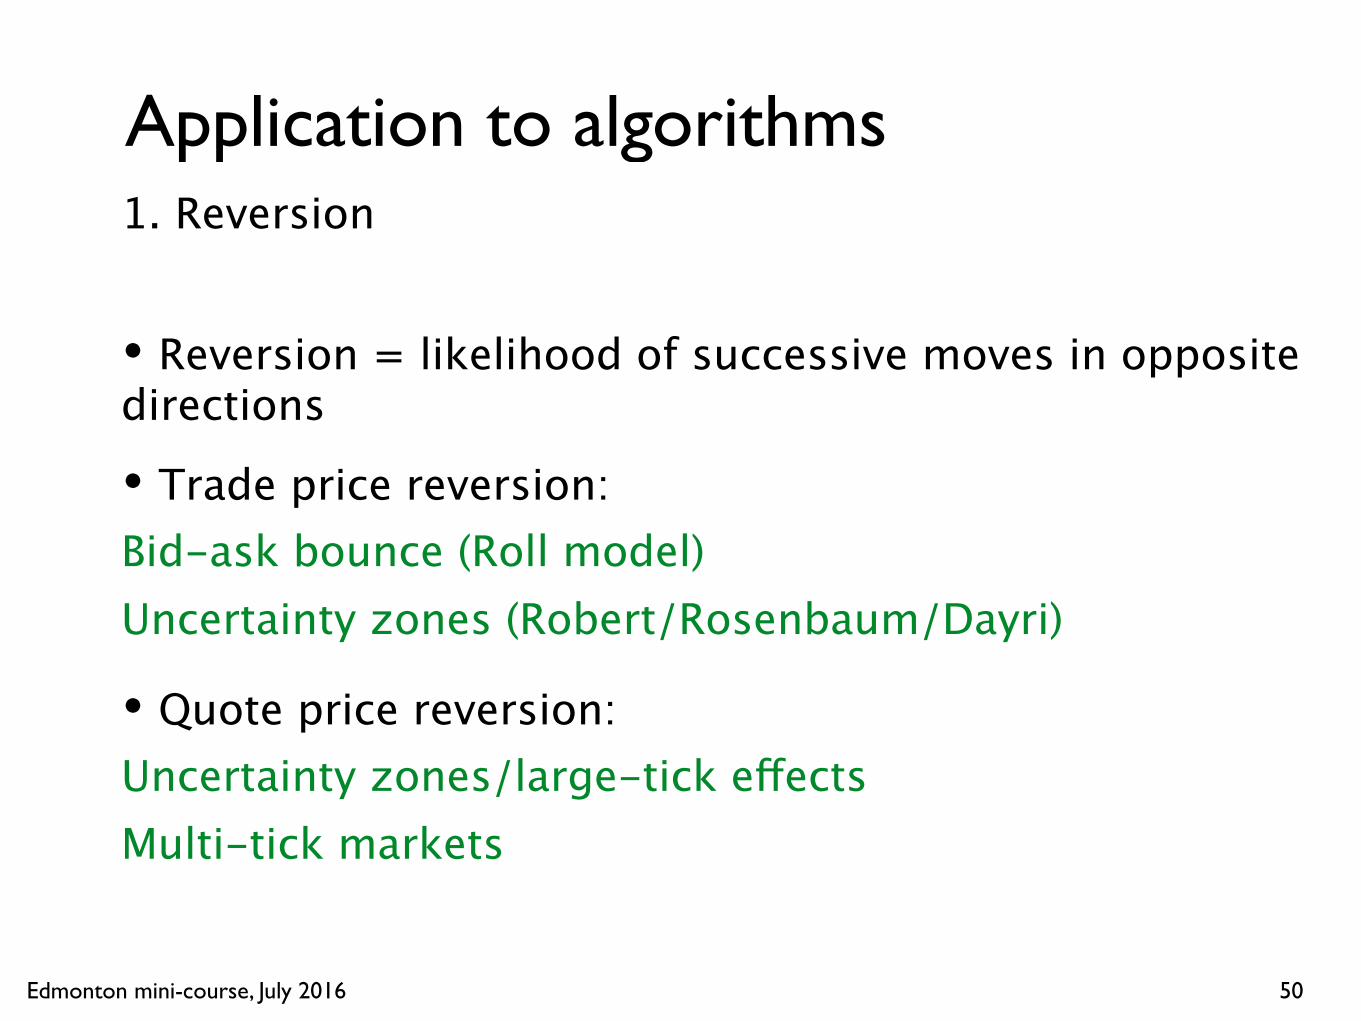
Edmonton mini-course, July 2016
Application to algorithms1. Reversion
• Reversion = likelihood of successive moves in opposite directions • Trade price reversion: Bid-ask bounce (Roll model) Uncertainty zones (Robert/Rosenbaum/Dayri)
• Quote price reversion: Uncertainty zones/large-tick effectsMulti-tick markets
50
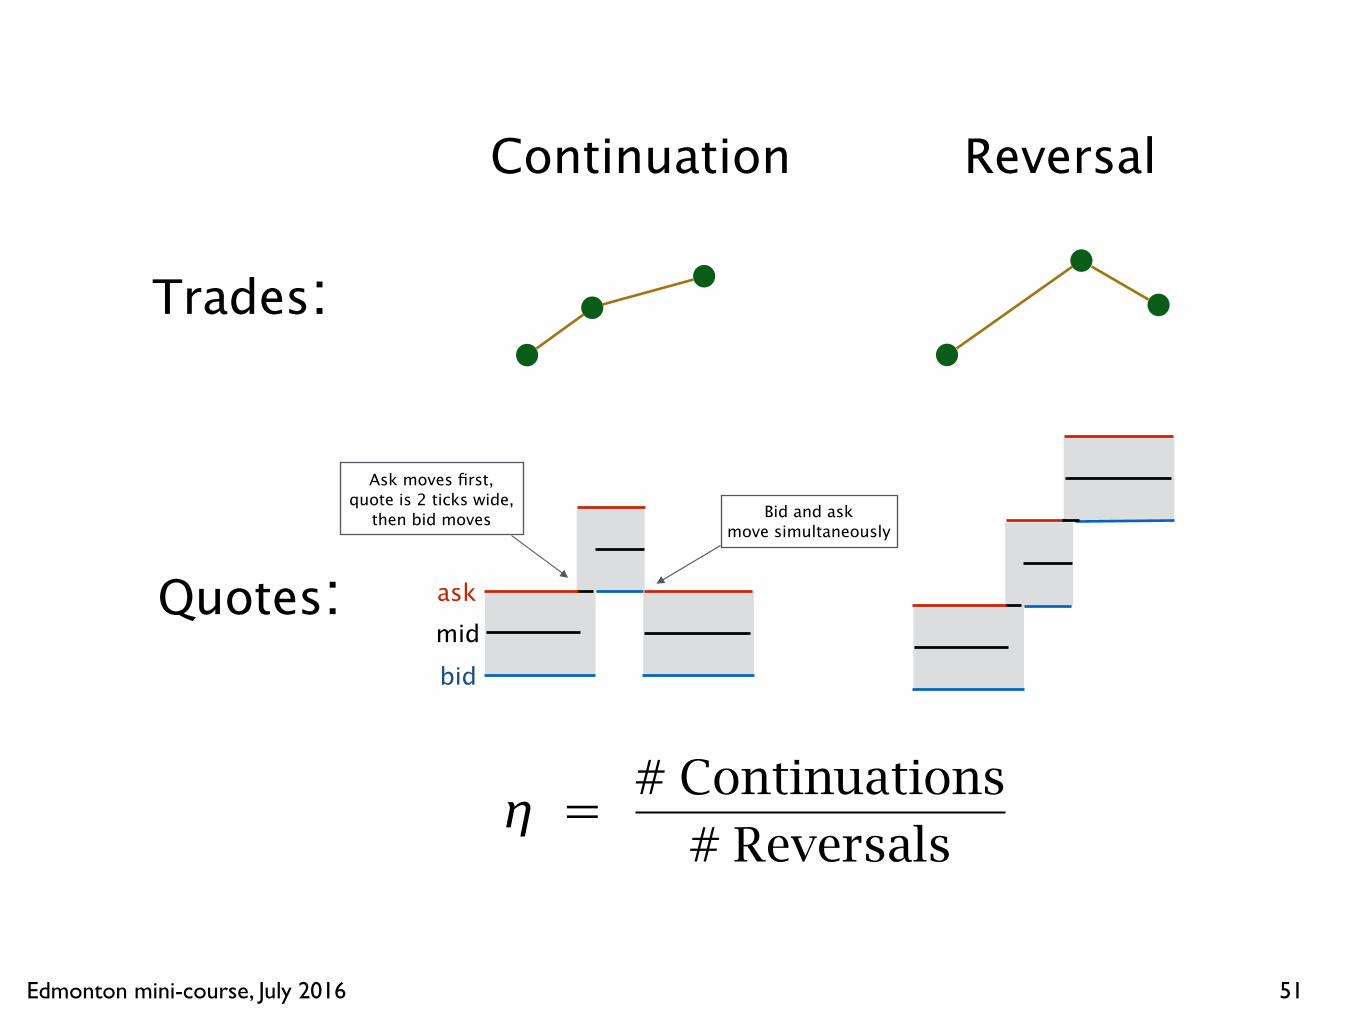
Edmonton mini-course, July 2016 51Market Microstructure and Algorithmic Trading, Fall 2015 Robert Almgren and Duane Seppi4
Trades:
Continuation Reversal
Quotes:bid
ask
mid
Ask moves first,quote is 2 ticks wide,
then bid moves Bid and ask move simultaneously

Edmonton mini-course, July 2016 52
Market Microstructure and Algorithmic Trading, Fall 2015 Robert Almgren and Duane Seppi
Significance of η: large tick
5
For a particular product:
Is bid-ask spread almost always equal to
one minimum price increment?
Product is "small-tick" Product is "large-tick"
No Yes
η based on trades cantell you "effective spread"
η based on quotes cantell you how large
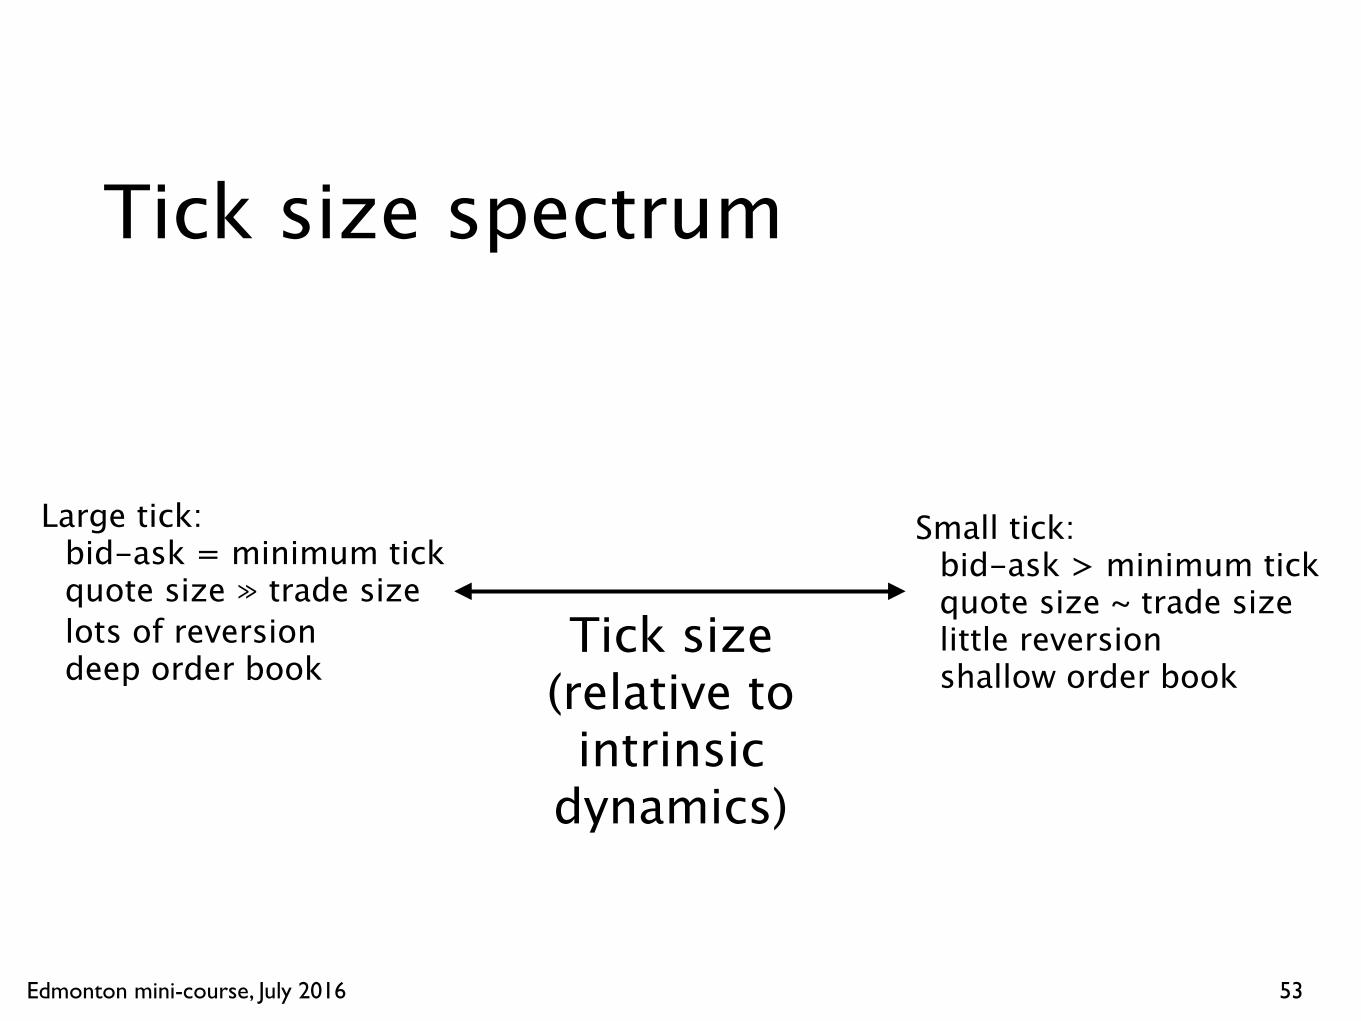
Edmonton mini-course, July 2016 53
Market Microstructure and Algorithmic Trading, Fall 2015 Robert Almgren and Duane Seppi
Tick size spectrum
6
Tick size (relative to
intrinsic dynamics)
Large tick:bid-ask = minimum tickquote size ≫ trade sizelots of reversiondeep order book
Small tick:bid-ask > minimum tickquote size ~ trade sizelittle reversionshallow order book
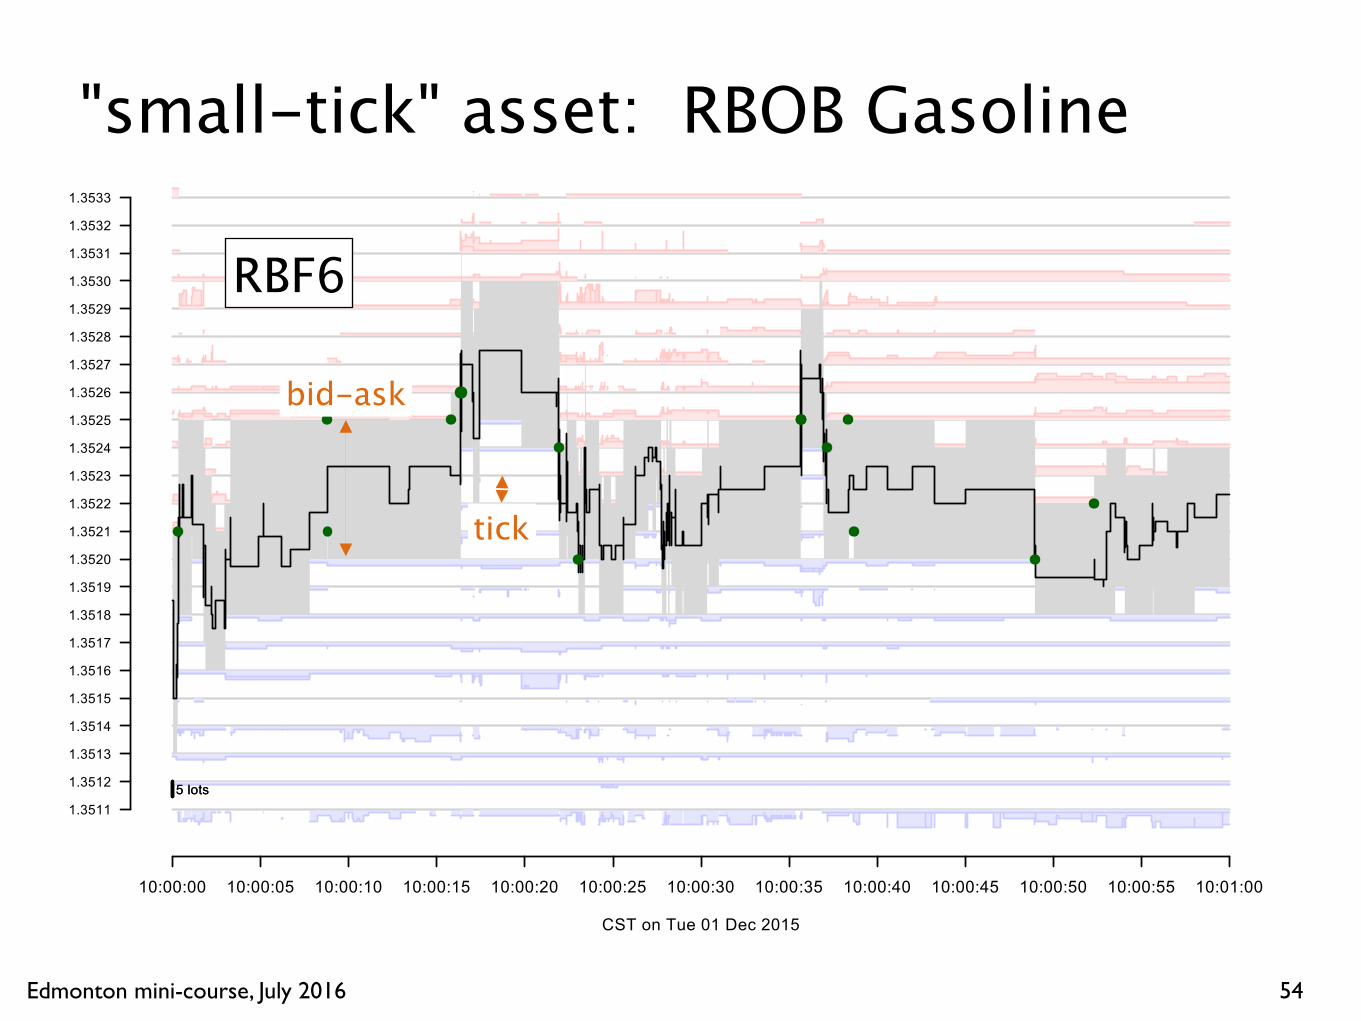
Edmonton mini-course, July 2016 54Market Microstructure and Algorithmic Trading, Fall 2015 Robert Almgren and Duane Seppi7
5 lots5 lots1.3511
1.3512
1.3513
1.3514
1.3515
1.3516
1.3517
1.3518
1.3519
1.3520
1.3521
1.3522
1.3523
1.3524
1.3525
1.3526
1.3527
1.3528
1.3529
1.3530
1.3531
1.3532
1.3533
10:00:00 10:00:05 10:00:10 10:00:15 10:00:20 10:00:25 10:00:30 10:00:35 10:00:40 10:00:45 10:00:50 10:00:55 10:01:00
CST on Tue 01 Dec 2015
"small-tick" asset: RBOB Gasoline
RBF6
bid-ask
tick
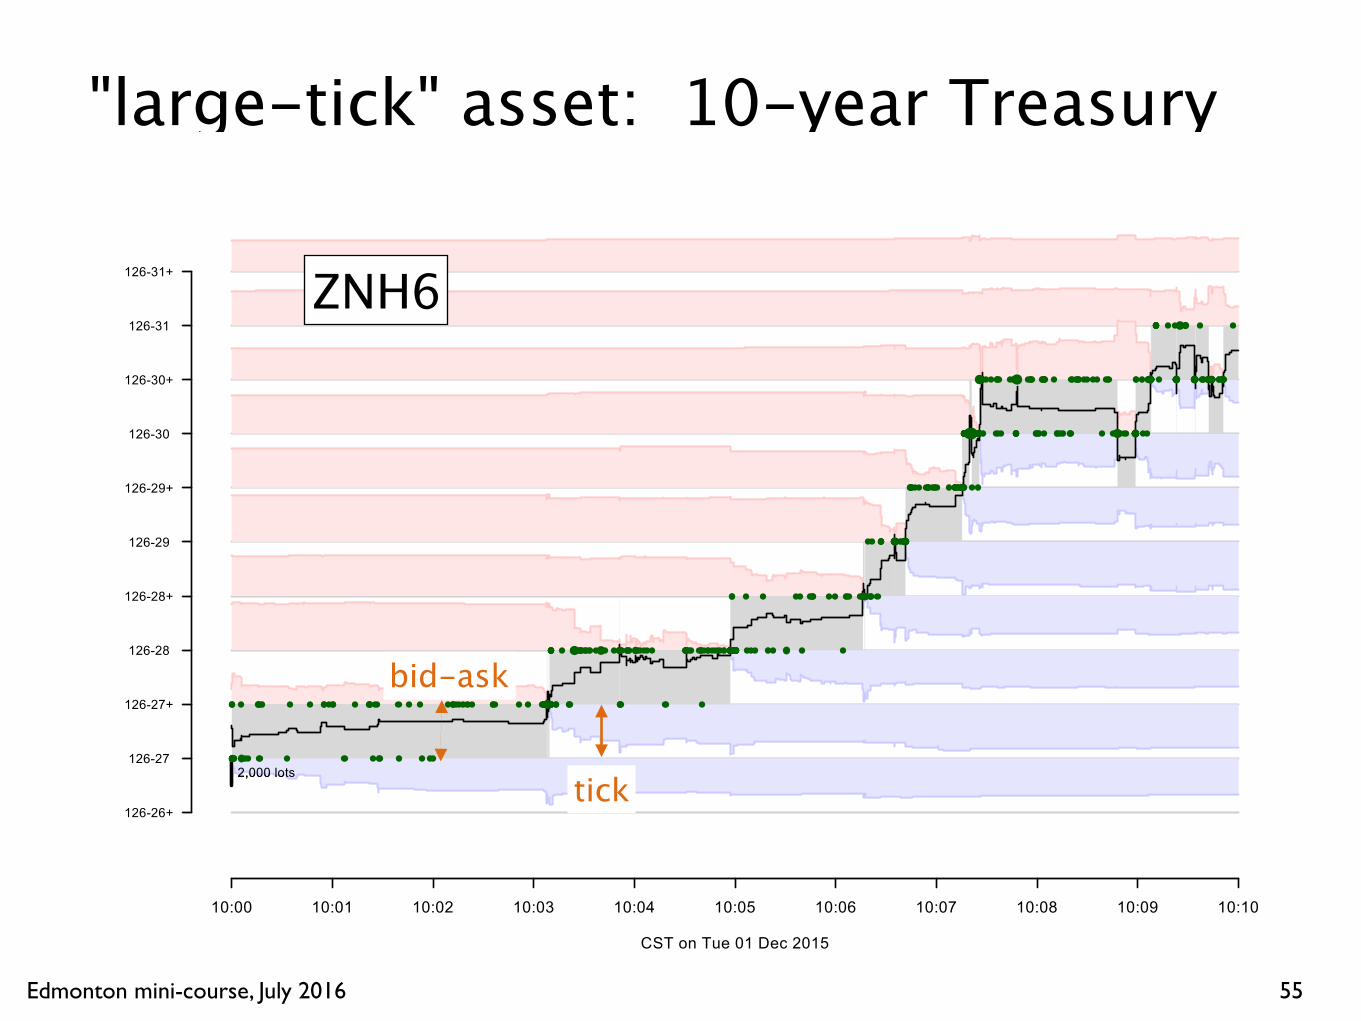
Edmonton mini-course, July 2016 55Market Microstructure and Algorithmic Trading, Fall 2015 Robert Almgren and Duane Seppi8
"large-tick" asset: 10-year Treasury
2,000 lots2,000 lots
126-26+
126-27
126-27+
126-28
126-28+
126-29
126-29+
126-30
126-30+
126-31
126-31+
10:00 10:01 10:02 10:03 10:04 10:05 10:06 10:07 10:08 10:09 10:10
CST on Tue 01 Dec 2015
ZNH6
bid-ask
tick

Edmonton mini-course, July 2016 56
Market Microstructure and Algorithmic Trading, Fall 2015 Robert Almgren and Duane Seppi
How to characterize?
1.Average quote size / average trade size
2.Fraction of time spread is larger than 1 tick
3.Reversion parameter η based on quote midpoint
9

Edmonton mini-course, July 2016 57Market Microstructure and Algorithmic Trading, Fall 2015 Robert Almgren and Duane Seppi16
Average quote size / average trade size
Time that spread > one tickMon 03 Aug
5 10 20 50 100 200 500 1000 2000
0.01
0.02
0.05
0.10
0.20
0.50
1.00
ADBP
C
CD
CL
EC
ED
ES
FV
GCHG
HO
JY
LC
NGNQ
RB
S
SI
TU
TYF
UL
US
W
YM
ZN/TYF: (329,0.008)
HO: (4.6,0.9)
Tick size spectrum
?
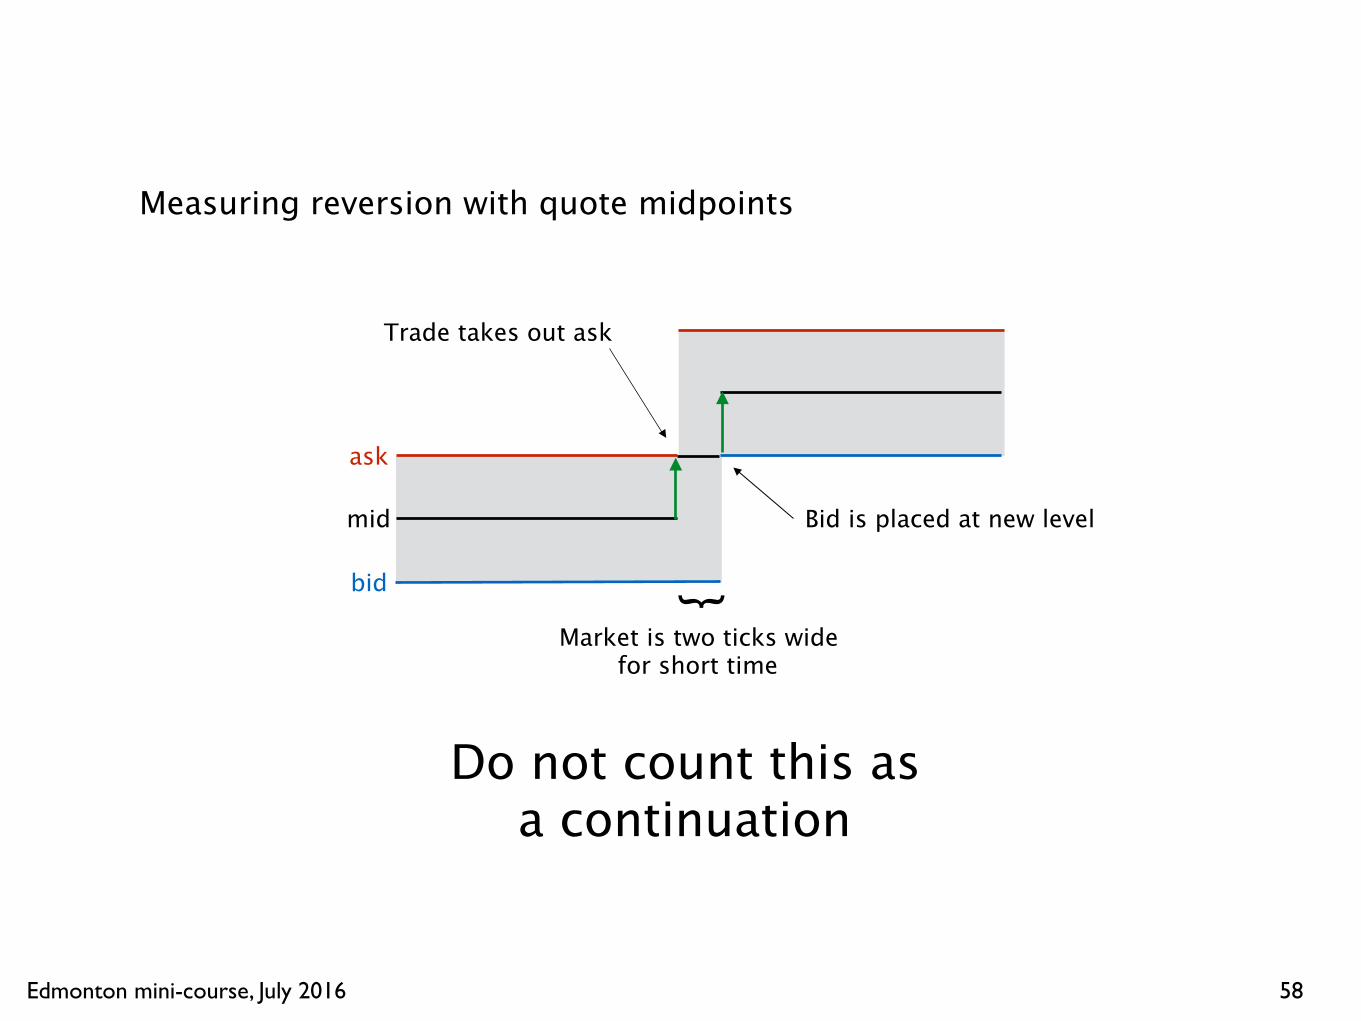
Edmonton mini-course, July 2016 58Market Microstructure and Algorithmic Trading, Fall 2015 Robert Almgren and Duane Seppi17
Measuring reversion with quote midpoints
bid
ask
mid
Trade takes out ask
Bid is placed at new level
{Market is two ticks wide
for short time
Do not count this asa continuation
... where ask=bid+...

Edmonton mini-course, July 2016 59Market Microstructure and Algorithmic Trading, Fall 2015 Robert Almgren and Duane Seppi18
Average quote size / average trade size
Reversion parameter etaMon 03 Aug
5 10 20 50 100 200 500 1000 2000
0.005
0.010
0.020
0.050
0.100
0.200
0.500
1.000
AD
BP
C
CD
CL
EC
ED
ES
FV
GCHG
HO
JY
LC
NG
NQ
RB
SSI
TUTYF
UL
US
W
YM
Spectrum based on reversion parameter (using filtered quote midpoint changes)
Algos down hereare primarily
"microstructure-driven"(passive fills, etc)
Algos up hereare primarily
"signal-driven"