Embed Size (px)
Citation preview
Q42017 HOUSTON
INDUSTRIAL MARKET
REPORT
Q4 2017 Industrial Market Statistics
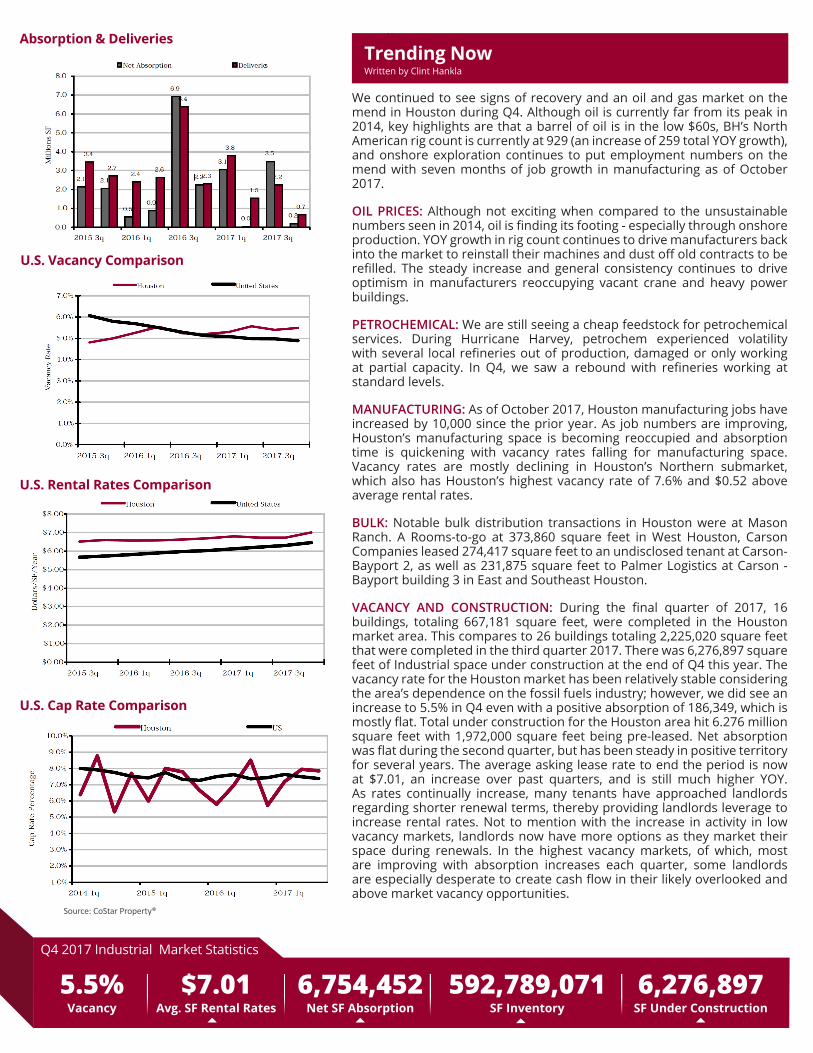
We continued to see signs of recovery and an oil and gas market on the mend in Houston during Q4. Although oil is currently far from its peak in 2014, key highlights are that a barrel of oil is in the low $60s, BH’s North American rig count is currently at 929 (an increase of 259 total YOY growth), and onshore exploration continues to put employment numbers on the mend with seven months of job growth in manufacturing as of October 2017.
OIL PRICES: Although not exciting when compared to the unsustainable numbers seen in 2014, oil is finding its footing - especially through onshore production. YOY growth in rig count continues to drive manufacturers back into the market to reinstall their machines and dust off old contracts to be refilled. The steady increase and general consistency continues to drive optimism in manufacturers reoccupying vacant crane and heavy power buildings.
PETROCHEMICAL: We are still seeing a cheap feedstock for petrochemical services. During Hurricane Harvey, petrochem experienced volatility with several local refineries out of production, damaged or only working at partial capacity. In Q4, we saw a rebound with refineries working at standard levels.
MANUFACTURING: As of October 2017, Houston manufacturing jobs have increased by 10,000 since the prior year. As job numbers are improving, Houston’s manufacturing space is becoming reoccupied and absorption time is quickening with vacancy rates falling for manufacturing space. Vacancy rates are mostly declining in Houston’s Northern submarket, which also has Houston’s highest vacancy rate of 7.6% and $0.52 above average rental rates.
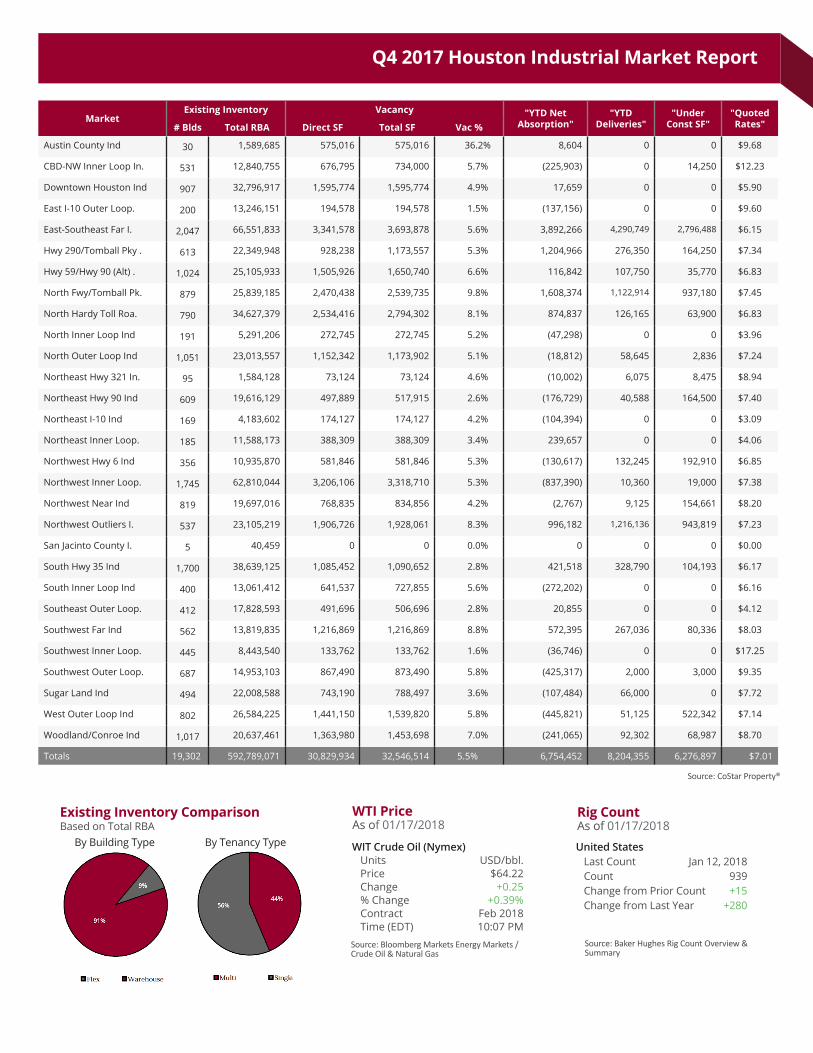
BULK: Notable bulk distribution transactions in Houston were at Mason Ranch. A Rooms-to-go at 373,860 square feet in West Houston, Carson Companies leased 274,417 square feet to an undisclosed tenant at Carson-Bayport 2, as well as 231,875 square feet to Palmer Logistics at Carson - Bayport building 3 in East and Southeast Houston.
VACANCY AND CONSTRUCTION: During the final quarter of 2017, 16 buildings, totaling 667,181 square feet, were completed in the Houston market area. This compares to 26 buildings totaling 2,225,020 square feet that were completed in the third quarter 2017. There was 6,276,897 square feet of Industrial space under construction at the end of Q4 this year. The vacancy rate for the Houston market has been relatively stable considering the area’s dependence on the fossil fuels industry; however, we did see an increase to 5.5% in Q4 even with a positive absorption of 186,349, which is mostly flat. Total under construction for the Houston area hit 6.276 million square feet with 1,972,000 square feet being pre-leased. Net absorption was flat during the second quarter, but has been steady in positive territory for several years. The average asking lease rate to end the period is now at $7.01, an increase over past quarters, and is still much higher YOY. As rates continually increase, many tenants have approached landlords regarding shorter renewal terms, thereby providing landlords leverage to increase rental rates. Not to mention with the increase in activity in low vacancy markets, landlords now have more options as they market their space during renewals. In the highest vacancy markets, of which, most are improving with absorption increases each quarter, some landlords are especially desperate to create cash flow in their likely overlooked and above market vacancy opportunities.
Absorption & Deliveries
U.S. Rental Rates Comparison
U.S. Cap Rate Comparison
Trending NowTrending Now
5.5% Vacancy
$7.01 Avg. SF Rental Rates
6,754,452 Net SF Absorption
592,789,071 SF Inventory
6,276,897 SF Under Construction
Written by Clint Hankla
Source: CoStar Property®
U.S. Vacancy Comparison
Q4 2017 Houston Industrial Market Report
Source: CoStar Property®
MarketExisting Inventory Vacancy "YTD Net
Absorption""YTD
Deliveries""Under
Const SF""Quoted Rates"# Blds Total RBA Direct SF Total SF Vac %
Austin County Ind 30 1,589,685 575,016 575,016 36.2% 8,604 0 0 $9.68
CBD-NW Inner Loop In. 531 12,840,755 676,795 734,000 5.7% (225,903) 0 14,250 $12.23
Downtown Houston Ind 907 32,796,917 1,595,774 1,595,774 4.9% 17,659 0 0 $5.90
East I-10 Outer Loop. 200 13,246,151 194,578 194,578 1.5% (137,156) 0 0 $9.60
East-Southeast Far I. 2,047 66,551,833 3,341,578 3,693,878 5.6% 3,892,266 4,290,749 2,796,488 $6.15
Hwy 290/Tomball Pky . 613 22,349,948 928,238 1,173,557 5.3% 1,204,966 276,350 164,250 $7.34
Hwy 59/Hwy 90 (Alt) . 1,024 25,105,933 1,505,926 1,650,740 6.6% 116,842 107,750 35,770 $6.83
North Fwy/Tomball Pk. 879 25,839,185 2,470,438 2,539,735 9.8% 1,608,374 1,122,914 937,180 $7.45
North Hardy Toll Roa. 790 34,627,379 2,534,416 2,794,302 8.1% 874,837 126,165 63,900 $6.83
North Inner Loop Ind 191 5,291,206 272,745 272,745 5.2% (47,298) 0 0 $3.96
North Outer Loop Ind 1,051 23,013,557 1,152,342 1,173,902 5.1% (18,812) 58,645 2,836 $7.24
Northeast Hwy 321 In. 95 1,584,128 73,124 73,124 4.6% (10,002) 6,075 8,475 $8.94
Northeast Hwy 90 Ind 609 19,616,129 497,889 517,915 2.6% (176,729) 40,588 164,500 $7.40
Northeast I-10 Ind 169 4,183,602 174,127 174,127 4.2% (104,394) 0 0 $3.09
Northeast Inner Loop. 185 11,588,173 388,309 388,309 3.4% 239,657 0 0 $4.06
Northwest Hwy 6 Ind 356 10,935,870 581,846 581,846 5.3% (130,617) 132,245 192,910 $6.85
Northwest Inner Loop. 1,745 62,810,044 3,206,106 3,318,710 5.3% (837,390) 10,360 19,000 $7.38
Northwest Near Ind 819 19,697,016 768,835 834,856 4.2% (2,767) 9,125 154,661 $8.20
Northwest Outliers I. 537 23,105,219 1,906,726 1,928,061 8.3% 996,182 1,216,136 943,819 $7.23
San Jacinto County I. 5 40,459 0 0 0.0% 0 0 0 $0.00
South Hwy 35 Ind 1,700 38,639,125 1,085,452 1,090,652 2.8% 421,518 328,790 104,193 $6.17
South Inner Loop Ind 400 13,061,412 641,537 727,855 5.6% (272,202) 0 0 $6.16
Southeast Outer Loop. 412 17,828,593 491,696 506,696 2.8% 20,855 0 0 $4.12
Southwest Far Ind 562 13,819,835 1,216,869 1,216,869 8.8% 572,395 267,036 80,336 $8.03
Southwest Inner Loop. 445 8,443,540 133,762 133,762 1.6% (36,746) 0 0 $17.25
Southwest Outer Loop. 687 14,953,103 867,490 873,490 5.8% (425,317) 2,000 3,000 $9.35
Sugar Land Ind 494 22,008,588 743,190 788,497 3.6% (107,484) 66,000 0 $7.72
West Outer Loop Ind 802 26,584,225 1,441,150 1,539,820 5.8% (445,821) 51,125 522,342 $7.14
Woodland/Conroe Ind 1,017 20,637,461 1,363,980 1,453,698 7.0% (241,065) 92,302 68,987 $8.70
Totals 19,302 592,789,071 30,829,934 32,546,514 5.5% 6,754,452 8,204,355 6,276,897 $7.01
WTI PriceAs of 01/17/2018
Rig CountAs of 01/17/2018
Source: Baker Hughes Rig Count Overview & Summary
United States Last Count Jan 12, 2018 Count 939 Change from Prior Count +15 Change from Last Year +280
WIT Crude Oil (Nymex) Units USD/bbl. Price $64.22 Change +0.25 % Change +0.39% Contract Feb 2018 Time (EDT) 10:07 PMSource: Bloomberg Markets Energy Markets / Crude Oil & Natural Gas
Existing Inventory ComparisonBased on Total RBA By Building Type By Tenancy Type
Follow us on:
Q42017
9805 Katy Freeway, Suite 800Houston, Texas 77024 | 713.744.7400www.Lee-Associates.com/Houston
The information and details contained herein have been obtained from third-party sources believed to be reliable; however, DFW Lee & Associates, LLC - Houston Office has not independently verified its accuracy. DFW Lee & Associates, LLC - Houston Office makes no representations, guarantees, or express or implied warranties of any kind regarding the accuracy or completeness of the information and details provided herein, including but not limited to the implied warranty of suitability and fitness for a particular purpose.
Interested parties should perform their own due diligence regarding the accuracy of the information. The information provided herein, including any sale or lease terms, is being provided subject to errors, omissions, changes of price or conditions, prior sale or lease, and withdrawal without notice, by third-party data source providers.
The Houston Office Market Report compiles relevant market data by using a third-party database for the proprietary analysis of specific office properties in the Houston Area.
© Copyright 2018 DFW Lee & Associates, LLC - Houston Office. All rights reserved.
About This Report
About Lee & AssociatesLee & Associates-Houston is a fully-integrated commercial real estate firm that creatively responds to a client’s search for new, more functional space. Newly established in Houston, Lee & Associates is part of a national team of brokers with more than 60 office locations in cities across the U.S. and Canada. Our Houston team, comprised of 31 brokers, associates and partners, operates within every facet of the local commercial real estate market and offers exceptional representation to real estate investors, builders, buyers and tenants searching for quality results and the perfect space. With an unsurpassed network of experienced brokers across the nation, Lee & Associates-Houston is uniquely qualified to support its clients’ commercial real estate needs in the local, national and international markets.