Embed Size (px)
Citation preview

1
MARKET COMPETITION, STATION OWNERSHIP AND PROGRAMMING ON LOCAL BROADCAST TELEVISION: AN EMPIRICAL ANALYSIS
By
CANDACE A. HOLLAND
A THESIS PRESENTED TO THE GRADUATE SCHOOL OF THE UNIVERSITY OF FLORIDA IN PARTIAL FULFILLMENT
OF THE REQUIREMENTS FOR THE DEGREE OF MASTER OF ARTS IN MASS COMMUNICATION
UNIVERSITY OF FLORIDA
2012

2
© 2012 Candace A. Holland

3
To my Parents

4
ACKNOWLEDGMENTS
I wish to thank Amy Coffey, who served as head of my thesis committee and
provided invaluable advice, guidance and assistance in bringing this project to fruition.
Additionally, I wish to thank the other members of my committee Sylvia Chan-Olmsted
and Johanna Cleary for their time, input and support throughout the conceptualization,
analytical and summation process. Finally, I wish to thank my parents for their continual
support and encouragement.
5
TABLE OF CONTENTS page
ACKNOWLEDGMENTS .................................................................................................. 4
LIST OF TABLES ............................................................................................................ 7
LIST OF ABBREVIATIONS ............................................................................................. 9
ABSTRACT ................................................................................................................... 10
CHAPTER
1 INTRODUCTION .................................................................................................... 11
2 LITERATURE REVIEW .......................................................................................... 15
Why Does Diversity Matter? Diversity, Media Policy and the Marketplace of Ideas .................................................................................................................... 15
Regulating Diversity ................................................................................................ 17 Defining Diversity .................................................................................................... 19
Criticisms of Program Type Diversity ............................................................... 23 Categories of Program Type Diversity .............................................................. 24
Concentration and Diversity — What’s at Stake? ................................................... 25 Global and National Ownership Trends ............................................................ 25
The Local Television (TV) Landscape .............................................................. 26 Drivers of acquisition .................................................................................. 26 Ownership trends ....................................................................................... 27
Reasons for Concern ....................................................................................... 29 Market Structure and Program Type Diversity ........................................................ 31
Theoretical Perspectives .................................................................................. 31
Empirical Research .......................................................................................... 34
Ownership and Program Type Diversity ................................................................. 37 Informational Programming ..................................................................................... 38
Market Factors: Level of Competition ............................................................... 38 Market Factors: Market Size ............................................................................. 40 Station Factors: Local Ownership ..................................................................... 41
Station Factors: Revenue ................................................................................. 43 Measuring Diversity ................................................................................................ 44 Research Questions ............................................................................................... 48
3 METHODOLOGY ................................................................................................... 65
Independent Variables ............................................................................................ 66
Operational Definitions............................................................................................ 67 Sampling of Stations for Ownership Analysis ......................................................... 68
Selection Criteria .............................................................................................. 68
6
Station Selection .............................................................................................. 69 Sampling of Markets for Market Analysis ................................................................ 71 Program Sampling .................................................................................................. 72
Program-Type Categories ................................................................................ 73 Assessing Vertical Diversity .................................................................................... 76 Assessing Horizontal Diversity ................................................................................ 77 Assessing Public Service ........................................................................................ 78 Assessing Localism (Program Origination) ............................................................. 79
4 RESULTS ............................................................................................................... 91
Regression Results — Station Characteristics ....................................................... 91
Vertical Program Type Diversity ....................................................................... 91 Diversity of Programming Sources ................................................................... 92 Total Informational Programming Provided ...................................................... 93 Local Informational Programming Provided...................................................... 93
Descriptive Statistics: Station Variables .................................................................. 94 Total Informational Programming ..................................................................... 94
Local Informational Programming ..................................................................... 96 Regression Results: Market Characteristics ........................................................... 97
Program Type Diversity (HHI) .......................................................................... 98
Horizontal Program Type Diversity (COI) ......................................................... 98 Diversity of programming sources .............................................................. 99
Total informational programming provided ................................................. 99 Local Informational Programming Provided.................................................... 100
5 DISCUSSION AND CONCLUSION ...................................................................... 114
REFERENCES ............................................................................................................ 125
BIOGRAPHICAL SKETCH .......................................................................................... 137
7
LIST OF TABLES
Table page 2-1 Theoretical perspectives on market structure and diversity ................................... 50
2-2 Summary of previous research on market structure and diversity ......................... 51
2-3 Summary of previous research on market structure and informational content (broadcast and print.) ......................................................................................... 57
2-4 Summary of previous research on ownership characteristics and informational content (broadcast and print.) ............................................................................. 61
3-1 Station/ownership variables. .................................................................................. 81
3-2 Station/ownership variables with definition and values. ......................................... 82
3-3 Market variables. .................................................................................................... 84
3-4 Market variables with definitions and values. ......................................................... 85
3-5 Collapsed program categories and distribution of all programming by type ........... 87
4-1 Model summary: Station characteristics and vertical diversity (HHI) .................... 101
4-2 Coefficients for final model: Station characteristics and vertical diversity (HHI) ... 101
4-3 Model summary: Station characteristics and program origin diversity .................. 102
4-4 Coefficients for final model: Station characteristics and program origin diversity . 102
4-5 Model summary: Station characteristics and provision of total informational programming .................................................................................................... 103
4-6 Coefficients for final model: Station characteristics and provision of total informational programming ............................................................................... 103
4-7 Model summary: Station characteristics and provision of local informational programming .................................................................................................... 104
4-8 Coefficients for final model: Station characteristics and provision of local informational programming ............................................................................... 104
4-9 Regression results: Station ownership summary ................................................. 105
4-10 Descriptive statistics-provision of any news and/or public affairs programming (station/ownership characteristics) ................................................................... 106
8
4-11 Descriptive statistics-provision of local news and/or public affairs programming station/ownership characteristics) ..................................................................... 107
4-12 Model summary: Market characteristics and vertical diversity (HHI) .................. 108
4-13 Coefficients for final model: Market characteristics and vertical diversity (HHI) . 108
4-14 Model summary: Market characteristics and horizontal diversity (COI) .............. 109
4-15 Coefficients for final model: Market characteristics and horizontal diversity (COI) ................................................................................................................. 109
4-16 Model summary: Market characteristics and program origin diversity ................ 110
4-17 Coefficients for final model: Market characteristics and program origin diversity ............................................................................................................ 110
4-18 Model summary: Market characteristics and provision of total informational programming .................................................................................................... 111
4-19 Coefficients for final model: Market characteristics and provision of total informational programming ............................................................................... 111
4-20 Model summary: Market characteristics and provision of local informational programming .................................................................................................... 112
4-21 Coefficients for final model: Station characteristics and provision of local informational programming ............................................................................... 112
4-22 Regression results: Market structure summary .................................................. 113

9
LIST OF ABBREVIATIONS
COI Choice Option Index. Average number of simultaneous program types available during a given time period.
HHI Herfindahl-Hirschman Index. A measure of market concentration. It is calculated by summing the squared market share of each firm in a market.
O&O Remember to use a tab between the abbreviations and the definitions
10
Abstract of Thesis Presented to the Graduate School of the University of Florida in Partial Fulfillment of the
Requirements for the Degree of Master of Arts in Mass Communication
MARKET COMPETITION, STATION OWNERSHIP AND PROGRMMING ON LOCAL BROADCST TELEVISON: AN EMPIRICAL ANALYSIS
By
Candace A. Holland
August 2012
Chair: Amy Jo Coffey Major: Mass Communication
This study examines the relationship between ownership structure, competitive
conditions in local television markets and the programming provided by commercial
broadcast stations. Previous research on the nature of these relationships has yielded
mixed results; this study seeks to provide some degree of clarification. Additionally,
through the inclusion of non-English language stations, it expands the sampling frame
used in previous studies.
In particular this study examines program type and source diversity as well and the
quantity of total and local informational programming broadcast. Results from an
analysis of 212 stations and 42 markets show that station financial strength and the
intensity of market competition (as measured by the number of commercial stations) are
the most important predictors of the programming provided. Both were positively related
to program type diversity and the quantity of informational programming (total and
local.) Interestingly, local ownership was not related to any of the programming
variables. These results suggest that consolidation may not be as harmful as critics
fear. They also suggest greater attention should be devoted to the number of stations
and the resources available to them than on the characteristics of individual owners.
11
CHAPTER 1 INTRODUCTION
Because they use a scarce public resource, it is widely held that broadcasters
have an obligation to serve the public and support the democratic process (Napoli,
2001b; Siebert, Peterson & Schramm, 1963). Indeed, broadcasting generally falls under
the social responsibility theory of the press outlined by Siebert, Peterson and Schramm
(1963) which holds that
the power and near monopoly position of the media impose on them an obligation to be socially responsible, to see that all sides are fairly presented and that the public has enough information to decide; and that if the media do not take on themselves such responsibility it may be necessary for some other agency of the public to enforce it (p.5).
In the case of broadcast media, the agency alluded to by Siebert et al., has
traditionally been the federal government (via the FCC), which has strived to ensure
broadcasters fulfill these responsibilities by mandating them to act in the ‘public interest,
convenience and necessity’ (Communications Act, 1934). The public interest is served
through “the maintenance of diverse viewpoints, some degree of local control and local
program orientation, a general balance of programming (including controversial topics),
and equitable treatment of political candidates” (Horwitz, 2005, p.187).
Diversity, along with competition and localism, is widely recognized as one of the
chief public policy goals underlying evaluation of broadcast operator performance
(Barrett, 2005; Compaine, 1995). Diverse programming is expected to cater to majority
and minority interests, national and local tastes and provide a balance of entertainment
and information content (with greater emphasis on the latter) (Levin, 1980). Given its
inherent value, policymakers have long been concerned with ensuring audiences are
exposed to diverse content from a variety of sources, and have enacted a number of
12
structural regulations (e.g. ownership rules) aimed at influencing the content provided to
audiences.
The provision of diverse content is contingent on both market and station factors.
That is, “Station behaviors are a function of the competitive dynamics and revenue
prospects within their local markets” (Napoli, 2004, p. 114). In addition, the
characteristics of station owners may influence programming output (Napoli, 2004).
In recent years, despite growing concern over concentration’s potential impact on
the public forum, the government has loosened ownership restrictions as proponents of
deregulation have argued that the potential efficiencies that could be captured by large
owners with access to sizeable resource pools would yield greater diversity. The
Telecommunications Act of 1996 represented the largest overhaul of broadcast law
since the Communications Act of 1934 was enacted more than sixty years earlier. In
1999, the FCC lifted its ban on duopoly ownership (Federal Communications
Commission, 1999). Later, in 2003, the FCC relaxed cross ownership rules (Federal
Communications Commission, 2003), though they were subsequently vacated in 2011
by the Third U.S. Circuit Court of Appeals (Pearson & Shields, 2011).
Whether deregulation has accomplished its intended goals is uncertain. While
there is a substantial body of literature on the relationship between competition and
program type diversity, previous research has failed to uncover any definitive
relationships. Rather, the findings have been mixed, with some studies suggesting a
positive link and others asserting a negative association. The relationship between
ownership and diversity is equally unclear.

13
The present study assesses horizontal (market-wide) and vertical (station-level)
diversity in local television (TV) markets and stations. Particular attention is devoted to
program origination and the quantity of news and public affairs programming provided. It
is assumed that locally produced programming better reflects community concerns,
interests, and needs, and enhances citizen knowledge and participation in the
democratic process. Literature regarding the provision of news and local affairs
programming (in relation to competition and station ownership) and program source
diversity is limited and findings have been largely qualified, holding under certain
circumstances. Consequently, this study seeks to fill gaps in the existing literature. This
study is also unique in that it includes a larger variety of stations, specifically non-
English language stations, which were previously excluded from the sampling frame.
For the ownership analysis, six data fields were obtained for the 212 stations
comprising the sample: owner type, national reach, duopoly status, owner location,
network affiliation and station revenue. Programming data was analyzed for all stations
for 14 randomly selected days with this information being used to measure vertical
diversity (measured using the HHI), source diversity (also measured with the HHI) and
the quantity of total and local informational programming provided (in total minutes.)
Multiple regression was used to analyze the relationship between station ownership and
programming.
A similar approach was used for the market analysis. Data for 42 markets was
collected, including the total number of stations in the market, the number of commercial
stations, the number of non-commercial stations and the number of TV households. As
with the station analysis, programming data was analyzed for a constructed 14-day
14
period; this data was used to calculate horizontal diversity (measured using both the
HHI and COI), source diversity (HHI) and the quantity of total and local informational
programming provided (total minutes). Multiple regression was used to examine the
relationship between variables.
Overall, the findings of this study suggest policymakers should not be as
concerned with who owns the media, as they are with the number of stations in a
market and the resources available to them. Financial strength was the strongest
ownership-related predictor of programming, while the number of commercial stations
was positively related to program type diversity and the quantity of informational
programming provided. Together, these findings suggest that, contrary to the fears of
media consolidation critics, ownership regulations may have limited impact on
programming. Moreover, market forces may drive innovation. It is important to note that
while it has implications for policymaking, this study is of an empirical nature and is not
a policy paper.
15
CHAPTER 2 LITERATURE REVIEW
Why Does Diversity Matter? Diversity, Media Policy and the Marketplace of Ideas
It is widely held that democracy is directly related to a media system of diverse
sources and owners (Horwitz, 2005). The marketplace of ideas concept suggests media
play a crucial social role, aiding the democratic process by supporting cultural pluralism,
citizen welfare, participation in well-informed decision-making (Croteau & Hoynes, 2005;
Glasser, 1984; Napoli, 1999, 2004) and “the smooth running of political, economic and
social processes” (Ishikawa & Muramatsu, 1996, p 201). Indeed, the Supreme Court
has stated “[The First] Amendment rests on the assumption that the widest possible
dissemination of information from diverse and antagonistic sources is essential to the
welfare of the public” (Associated Press v. United States, 1945). Diversity is central to
“effective freedom of expression and information” (Meier & Trappel, 1998, p.38) and
media contribute to diversity by reflecting societal differences, providing audience
members a number of choices and exposing audiences to viewpoints and attitudes
different from their own (Ishikawa & Muramatsu, 1996; McQuail, 1992; Napoli, 1999).
That is, media bolster the marketplace of ideas as
…citizens are free to choose from a wide range of ideas (content diversity), delivered from a wide range of sources (source diversity). The citizens then partake of this diversity (exposure diversity) to increase their knowledge, counter opposing viewpoints and become well-informed decision-makers who are better capable of fulfilling their democratic responsibilities in a self-governing society (Napoli, 1999, p.9).
Thus, it can be concluded that society is better off when there are many media “offering
a wide range of ideas, information and types of culture” (Meier & Trappel, 1998, p. 40).
While its value is agreed upon, a deep divide exists regarding how to best achieve
diversity, with proponents of the marketplace model on one side, and supporters of the
16
public sphere model on the other (Croteau & Hoynes, 2005; Einstein, 2004; Iosifides,
1999). The former believe market forces that drive firms toward efficiency will “create
the breadth of diverse voices in society…creat[ing] as much programming as the market
will bear” (Einstein, 2004, p. 2). That is, supply and demand create the conditions “to
expose people to the widest range of views and opinions” (Iosifides, 1999, p. 153). They
hold that these efficiencies can only be realized when the market is unencumbered by
government regulation. Critics of this school, however, believe it promotes cultural
standardization, homogeneity and excludes minority views (Iosifides, 1999). Free
market detractors hold that media companies put profit before the public interest; driven
by the bottom-line, media firms produce programs that will attract the largest audience
and, accordingly, produce the greatest profits under a system of advertiser-supported
media. The result is an overabundance of “common denominator” programs that appeal
to majority tastes. Overall, society is less well-off and minority viewers (in terms of
tastes, not ethnicity) are less satisfied as their preferences are undersupplied (Owen &
Wildman, 1992, pp. 99-100). Proponents of the public sphere model are also deeply
concerned about media conglomerates’ ability to control the information pipeline
(discussed in more detail later) (Einstein, 2002).
Reflecting the concerns of the public sphere school, government regulation or
legislation has been adopted to protect the integrity of the marketplace. Examples of
diversity initiatives enacted by the FCC are the Fairness Doctrine, Prime Time Access
Rules, Financial Interest and Syndication Rule and national, multiple and cross
ownership rules (Napoli, 1999; Wakshlag & Adams, 1985; Yan & Park, 2009). The past
20 years, however, have seen a notable policy shift as the FCC has adopted a market
17
philosophy, leading to massive deregulation culminating in the Telecommunications Act
of 1996 (Einstein, 2004).
In all cases it is important to note that a robust marketplace of ideas is not the end,
but merely a means of achieving broader social goals. Policy alone cannot guarantee a
well-functioning democracy or society. Nonetheless, promoting diversity and ensuring a
healthy marketplace of ideas remains a critical concern. Policies enacted to achieve
these goals are discussed in greater detail below.
Regulating Diversity
To promote a robust marketplace of ideas, the government established limits on
the number of stations that could be owned by a single entity (Horwitz, 2005). These
rules attempt to promote the public interest against intense commercial pressures; that
is, “to maximize diversification of program and service viewpoints as well as to prevent
any undue economic concentration contrary to the public interest” (FCC 1983 Notice of
Proposed Rulemaking, cited in Einstein, 2004, p. 16).
As Smith (2004) explains, two concepts underlie media regulation. First,
“broadcast airwaves serve as a modern-day town hall, a place where citizens can go to
find out information about issues that affect their communities;” (p. 12) second, citizens
make better decisions when they are exposed to a variety of opinions and viewpoints.
The concern is not promoting competition for competition’s sake, but rather because of
“its effects on the range of views available to the public” (Besen & Johnson, 1985, p.
367).
In policymaking, particular attention is devoted to localism, one of the guiding
principles of broadcast regulation. Its importance is related to U.S. political structure
(Smith, 2004): because government control is primarily concentrated in local
18
communities, attention to local affairs is critical. The FCC has consistently held that
locally owned stations are superior because “such ownership…would presumably be
closer to local needs and concerns, and thus the station would more accurately reflect
and project that community” than a distant owner (Gomery, 2000, p. 199). Therefore,
the FCC prohibited common ownership of two stations in the same market. However,
the FCC now permits such duopolies if eight independent voices remain post-merger
and only one station is among the top four in the market (FCC, 1999).
National ownership limits aim to strike a balance between the national networks
and local stations, allowing large owners to capitalize on economic efficiencies, yet
ensuring stations remain responsive to their local communities (Barrett, 2005; Horwitz,
2005). They are premised on the belief that “the greater the diversity of ownership in a
particular area, the less chance there is that a single person or group can have an
inordinate effect in a…programming sense, on public opinion at the regional level”
(Amendment of Sections 73.75, 73.240, and 73.636 of Commission’s Rules Relating to
Multiple Ownership of AM, FM, Television Broadcast Stations as cited in Horwitz, 2005).
The FCC began regulating television ownership in 1940 when it established a limit
of three stations per owner (Howard, 2006). In 1944, the cap was increased to five
stations (Howard, 2006). The limit was once again raised in 1954 — this time to seven
stations per owner (Barrett, 2005). With changes in technology and the competitive
landscape, philosophy began to shift from the public sphere perspective toward the
marketplace model in the 1980s. Policymakers became more confident in the market’s
ability to produce program-type diversity and serve minority interests (Napoli, 2004).
Consequently, in 1984, the FCC revised the limits to reflect the dramatic changes that
19
had taken place since TV’s emergence in the 1950s (Barrett, 2005). The station cap
was raised from seven to twelve, and, subsequently, group owners were prohibited from
reaching more than 25% of the national audience (Blevins, 2002). The era of
deregulation continued with the passage of the Telecommunications Act of 1996, which
eliminated numerical caps on the number of stations owned by a single source and
raised the limit on national reach to 35% (Blevins, 2002). This legislation was driven by
the belief that competition would be best promoted by removing regulatory barriers to
efficiency. In 2003, the FCC raised the national ownership limit to 45% (FCC, 2003).
Following heavy criticism from consumer groups, Congress intervened and established
a 39% cap (Barrett, 2005; Free Expression Policy Project, n.d.); this limit has remained
unchanged since its enactment.
Defining Diversity
While the importance of diversity is universally recognized, it is difficult to define
both conceptually and operationally (Entman & Wildman, 1992; Le Duc, 1982; Napoli,
1997; Owen, 1978). Einstein (2002) suggests this difficulty stems, in part, from the
conflict between the First Amendment and the regulation of speech. In cases like United
States v. O’Brien (1968), the Supreme Court has consistently ruled that regulation must
be “content neutral;” that is, unrelated to the subject matter or viewpoint conveyed.
Therefore, attempts to regulate specific programming are likely to be ruled
unconstitutional.1 As a consequence, policymakers have attempted to secure content
diversity through structural regulation (Einstein, 2002; Gomery, 2000; Horwitz, 2005;
Kleiman, 1991), which is seen as a proxy for behavioral regulation. Such regulations are
1 “But, above all else, the First Amendment means that government has no power to restrict expression
because of its message, its subject matter, or its content” (Police v. Mosley, 1972, p. 95).
20
guided by the belief that “if you regulate who makes television programming or how
many people make television programming, you will affect the different types of
programming that appear on the air” (Einstein, 2002, p. 6).
Beyond these constitutional issues, diversity is simply difficult to define because it
is multidimensional, encompassing “plurality of content, access to different points of
view, offering a wide range of choice, geographical diversity, etc.” (Iosifides, 1999,
p.154). Indeed, the term may refer to a multiplicity of outlets, of owners, of formats.
Diversity may entail offering informational programming. It may be the provision of
racially or ethnically based programming (Barron, 2000). At the most basic level,
diversity “refers to the…notion of unrestricted access to information (freedom of
reception) and unrestricted access to the means to impart information (freedom of
expression)” (Meier & Trappel, 1998, p. 42).
Many scholars have developed their own definitions of diversity, but there is no
consensus within the academic community on the best meaning. van der Wurff and Van
Cuilenburg (2001) distinguish between reflective and open diversity. Reflective diversity
refers to “whether media express different ideas or topics in the same proportion as
media users prefer them” (van der Wurff & Van Cuilenburg 2001); that is, whether
program supply corresponds with consumer demand. Open diversity suggests media
express all ideas and topics equally, regardless of public preferences (van der Wurff &
van Cuilenburg, 2001; McQuail, 1992); this is typically the dimension that receives
greater emphasis in policy circles. Napoli (1999) identified three aspects of diversity:
source (which encompasses programming, outlet ownership and workforce
composition), content (including format or program-type, demographic and
21
idea/viewpoint diversity) and exposure diversity (the content actually viewed). Wildman
and Owen (1985) also identify content diversity as one of three dimensions of diversity,
alongside diversity of ideas and access diversity. The former means media should
provide a broad array of views/ideas and not display favoritism toward one side, while
the latter refers to the idea that media should provide fair access to all. Similarly,
Entman and Wildman (1992) distinguish between product, idea and access diversity,
while still others identify diversity of ideas, products, issues, content, person and
geography (Iosifides, 1999).
Academics and policymakers have traditionally devoted greater attention to
diversity of supply than diversity of consumption (Entman & Wildman, 1992; McQuail,
1992; Napoli, 1997, 1999; Webster & Phalen, 1994). Policy makers are particularly
concerned about the impact of source and outlet diversity on content, arguably the most
“critical form of diversity” (Schurz Communications v. Federal Communications
Commission, 1992, p.1054).
Given the attention and concern devoted to content diversity, this dimension is a
focus of the current study. In particular, this study analyzes program type diversity, the
distribution of programs by category/genre (Noll, Peck & McGowan, 1973). This is the
“most direct measure of content diversity provided in the marketplace” (Park, 2005,
p.40). As Wildman (2007) explains, “Program diversity is an application of the more
general economic concept of product variety—the range of differentiated products a
market makes available to consumers—to media markets” (p. 159). A diverse program
mix increases viewer choice and the number of potential substitutes (Levin, 1980).
Diversity of program types is better for consumers because it “increases the likelihood
22
of maximizing the satisfaction of more categories of viewers and hence serves the
public interest” (Napoli, 1999, p.18).
It is important to note that the ultimate goal of regulation is the maximization of
viewpoint diversity, which refers to the availability of a variety of social, political, and
cultural perspectives in media content (Ho & Quinn, 2009; Napoli, 1999). A component
of content diversity, viewpoint diversity is most closely tied to a well-functioning
democracy and robust marketplace of ideas. It is believed that society benefits when a
variety of opinions and criticisms are available to its citizens (Entman & Wildman, 1992).
However, as Horwitz (2005) explains, there are inherent difficulties in measuring such
an elusive concept,
how can an empirically oriented social scientist measure viewpoint diversity? A perceptive reader can reasonably discern general differences of tone and coverage among the Wall Street Journal, USA Today, and The Nation, for instance. But even in this comparison, does one analyze the coverage according to some general reckoning or by particular item? By news article or op/ed column? Over a comprehensive week or by random sampling? And according to what kind of scale? If quantitative, by the frequency of with which an issue or event is covered or by column inches? If qualitative, what exactly does one look for when one conducts a content analysis? And this is news and opinion, presumably conducive to viewpoint analysis? How does one evaluate the viewpoints embedded in entertainment programming? (p. 199).
The majority of studies that have attempted to quantify viewpoint diversity have utilized
indices that are methodologically flawed. These measures fail to address measurement
uncertainty, are highly subjective, not easily replicable and based on small samples of
media content, thus limiting their generalizability (Ho & Quinn, 2009). Consequently,
policymakers have predominantly conceptualized content diversity solely in terms of
program type. Program type diversity allows researchers to establish connections
23
between economics (station and market factors) and the provision of content (Einstein,
2004) and is easier to assess objectively and quantitatively than viewpoint diversity.
Criticisms of Program Type Diversity
It is important to point out the weaknesses of measuring diversity via program
types. First, program type measures do not give a complete picture of content diversity
(Wildman, 2007). This approach considers only broad program types, and as Owen
(1978) suggests, there are differences not just among program types, but within them
as well. Moreover, genres are fluid and may evolve or disappear over time. However, as
Hillve, Majanen, and Rosengren (1997) point out, programs of a given type “are still
rather homogenous in their general tenor, so that the variation is greater between than
within programs” (p. 295). Therefore, measuring program type diversity “stands out as
the natural approach” (Hillve et al., 1997, p. 295). In addition, it is also important to point
out that these categories are not intended to be “exhaustive description[s] of the
television programming universe” or capture the nuances of individual programs
(Hellman, 2001, p.196), but rather to aid empirical analysis of a complex,
multidimensional concept.
Critics of program type diversity also contend simple classifications do not reveal
whether programs provide a single viewpoint or a multiplicity (Einstein, 2004).
Furthermore, the provision of diverse programs does not necessarily mean audiences
will consume them (Napoli, 1997). Likewise, knowing what proportion of all shows one
program type represents does not tell us about the sources providing the content. To
gain a complete picture of programming diversity on local television, all three
components must be considered. That is, researchers must look at who supplies
content, the actual content provided, and how it is consumed. Measuring consumption
24
is dependent on confidential third-party data that is prohibitively expensive;
nevertheless, the present study includes a variable for source diversity in an effort to
provide a more complete picture.
While entertainment programs necessarily contain some viewpoint, informational
programming is inherently better at articulating political perspectives (Horwitz, 2005),
which lay at the core of the marketplace of ideas and good governance. That is, news
and public affairs programming is perceived as better at delivering “a wide range of
diverse and antagonistic opinions and interpretations” than programs intended solely for
entertainment. Recognizing this difference, informational programming is included in the
current study as a proxy for viewpoint diversity.
Categories of Program Type Diversity
Within the broad category of program type diversity, researchers distinguish
between vertical and horizontal diversity. The former, also referred to as channel
diversity (Hillve, et al., 1997), is the overall distribution of programs by type provided by
a station over a period of time (Einstein, 2002; Grant, 1994; Li & Chiang, 2001; Litman,
1979). However, this only reflects the options available through a single source. A more
complete picture is provided by horizontal, or system diversity (Hillve et al., 1997), which
evaluates the variety of programs types available across all outlets during a given time
period. That is, it reflects the full range of options available to viewers (Einstein, 2002;
Grant, 1994; Li & Chaing, 2001) and illustrates “how the whole medium is performing
simultaneously” (Hellman, 2001, p. 185). While diversity within an individual station may
be low, diversity across the entire system may be enhanced as these stations may offer
program types not available through other outlets (Hellman, 2001; Hillve et al., 1997).
Moreover, an “effective combination of ‘vertically’ narrow channels, competing with
25
distinctly differentiated schedules (low channel diversity), may result in great overall
variety (high system diversity)” (Hellman, 2001, p. 185). Because horizontal and vertical
diversity “are not linearly related but represent different dimensions of program-type
diversity” (Aslama, Hellman & Sauri, 2004, p. 122), both measures must be evaluated in
order to understand what is happening in the market.
Concentration and Diversity — What’s at Stake?
Fears about the effects of concentration on mass media industries have persisted
since the early days of American media and proliferate across industries. For example,
newspaper magnate William Randolph Hearst used his publications to spark the
Spanish-American War (Noam, 2009). Similarly, when the big three broadcast networks
emerged, “warning bells rang from the left and right about control over hearts and
minds, pocketbooks, and voting booths” (Noam, 2009, p. 7). Recent developments in
the media industry have further magnified concerns and spurred intense debate
between free-market and consumer advocates. Hellman (2001) identifies diversity “as
one of the ‘vulnerable values at stake’ jeopardized by market pressures” (p. 182).
Global and National Ownership Trends
Over the past three decades, the media system has undergone sweeping
changes. Driven largely by technological change, markets have become more
competitive and international, as potential economies of scale and scope have become
more pronounced. This has encouraged corporate expansion through vertical,
horizontal and diagonal integration (Doyle, 2002). Paradoxically, as media giants have
grown larger, ownership rules have been relaxed, fueling further consolidation.
While the number of outlets has increased, the number of distinct owners has
dwindled (Horwitz, 2005). Bagdikian (2004) asserts that in 2003, five firms dominated
26
the global media industry, compared to 50 in 1983. McChesney (2004b) is slightly more
generous in his assessment of industry conditions, recognizing there are thousands of
media firms, but of differing significance. In his view, American media is essentially a
three-tiered system. In the first tier are the “vertically integrated powerhouses;” these
conglomerates own the major film studios, the major broadcast and cable networks,
nearly all of the cable systems and major publishing houses, among others. The second
tier includes 15 to 20 firms that specialize in one or two areas and are among the top
700 U.S. companies (e.g. Gannett and Clear Channel). The third tier comprises
thousands of small firms that fill unmet niches (2004b).
Even if media market structure doesn’t constitute a “monopoly” as Bagdikian
suggests, the fact remains that 20 to 25 large firms control the overwhelming majority of
media content produced worldwide. Moreover, 20 companies account for three-quarters
of global advertising revenue (McChesney, 2004a). Consequently, it could be argued
that “The global media system is fundamentally non-competitive in any meaningful
economic sense of the term” (McChesney, 2004a, p. 14).
The Local Television (TV) Landscape
The consolidation phenomenon is not unique to global or even national media,
however. The trend also applies to local television markets, the focus of the present
study. Included below are an overview of the factors driving consolidation, current
ownership trends and critics’ concerns about the changing landscape.
Drivers of acquisition
Station acquisition is driven primarily by economic efficiencies. Group owners are
able to provide services to multiple stations at a lower cost than if the same stations
operated independently (Besen & Johnson, 1985). These owners primarily benefit from
27
economies of scale, including centralized management (Besen & Johnson, 1985) and
the ability to “buy programs, equipment and supplies in bulk” (Einstein, 2002, p. 121). In
addition, large station groups maintain advantages over their smaller and/or
independent counterparts in retransmission consent, syndication, and talent
negotiations (Albiniak, 2010). Groups (particularly those with stations in top markets)
have greater bargaining power in retransmission consent and cable carriage
agreements (Albiniak, 2010). In syndication negotiations, large groups may secure
better deals because they are able to provide access to multiple markets (Einstein,
2002; Besen & Johnson, 1985). Large groups also have greater leverage in
negotiations with national spot advertisers and service providers like The Nielsen
Company or The Associated Press for similar reasons (Levin, 1970).
Ownership trends
Cooper (2003) concludes “virtually all of the… local media products markets are
concentrated and most are highly concentrated” (p. 10). In 2003, across all markets,
roughly nine in ten stations (85.9%) were group owned (Howard, 2006). Further, the
number of group owners decreased by nearly a third (32.4%) from 1995 to 2003 (from
210 to 142 groups) as the largest groups took over stations operated by their smaller
counterparts (Howard, 2006). The number of stations per owner rose from 3.7 in 1985
to 8.1 in 2003 (Howard, 2006).
According to the Pew Center’s Project for Excellence in Journalism (2010), the Big
Four networks continue to dominate local television ownership. In 2009, four of the top
five group owners were the parent companies of the major broadcast networks (see
below). Further, in 2008, owned and operated stations accounted for $6.1 billion of
$20.1 billion (30%) of total industry revenue.
28
As discussed previously, federal law prohibits a single owner from reaching more
than 39% of the national audience (Free Expression Policy Project, n.d.). According to
Broadcasting & Cable, in 2010, the three largest groups (CBS, News Corporation and
General Electric) each reached more than 30% of the national audience. CBS, the
largest owner, had 29 stations with a combined reach of 35.48%; these stations brought
in $2.36 billion revenue in 2009. In terms of national reach, CBS was followed by Fox’s
parent company, News Corporation (27 stations, 31.2% reach) and NBC’s then-owner,
General Electric (32 stations, 30.33%). Rounding out the top five were the Tribune
Company (28 stations, 27.55%) and ABC’s parent company, the Walt Disney Company
(10 stations; 23.14%) (Albiniak, 2010).
Broadcasting & Cable also tracks media ownership using a different methodology.
Traditionally, the FCC has applied a UHF discount, counting only half the station’s
market reach toward the national cap (the methodology used for the statistics above).
Following the digital transition, the majority of stations moved from VHF to UHF
channels, rendering this discount virtually moot. When the discount is removed, all of
the top seven station groups (Ion Media Networks, Univision Television Group, CBS
Corp., Fox Television Stations, NBC General Electric, Trinity Broadcasting, and Tribune
Co.) reach at least 35% of the national audience. Further, the top two station groups
(Ion and Univision) actually exceed the national ownership limit (63.9% and 42%
coverage, respectively) (Albiniak, 2010). It is possible, therefore, that the same
programs, talents and viewpoints are seen by one-third or more of the national audience
as owners share programming across stations in order to exploit economic efficiencies.
29
This is certainly not in keeping with the broadcaster’s obligation to act in the “public
interest, convenience, and necessity.”
Reasons for Concern
These trends are troubling because of the apparent power they grant a few media
giants. The major conglomerates’ properties span all mediums and reach the entire
country. Thus, they “control every means by which the population learns of its society”
and, consequently, have “become a major force in shaping contemporary American life”
(Bagdikian, 2004, p. 4). Indeed, following the announcement of the pending merger of
AOL and Time Warner, the largest deal in history at the time, McChesney asserted "The
system has become the plaything of a handful of billionaire investors who use their
power to commercially carpet-bomb every possible moment of our lives" (Hazen, 2000).
Certainly concentration is not a media-specific phenomenon, but media are unique
in that they do not sell consumer goods, but rather values and viewpoints (Bagdikian,
2004). Put another way, media are machines of cultural production whose goods are
consumed by nearly the entire population. As such, concentration in the
communications industry poses a substantial threat to democracy.
Below are critics’ main arguments against consolidation. Behind all of these
concerns is the larger fear that concentration may “corrupt the freedom of speech,
impair the practice of democracy, and impress an ideological pall on society” (Horowitz,
2005, p.181). In other words, the fear is that a few voices will dominate communication
channels, effectively muting the marketplace of ideas and undermining the public
interest (Doyle, 2002).
Media owners privilege some viewpoints and silence others (Bagdikian, 2004; Horwitz, 2005).
30
Viewpoint diversity suffers as corporations force out smaller, local competitors (Smith, 2004).
A small group of media elites control the public discourse and “shape information on which so many people depend to make decisions about everything from whom to vote for to what to eat” (Bagdikian, 1989).
Concentrated media “reproduce the prevailing structures of power and dominant cultural norms” (Horwitz, 2005, p.181).
Driven solely by commercial interests, media companies produce duplicative, bland programming in order to generate mass appeal (Bagdikian, 2004; Blevins, 2002; Golding & Murdock, 1996; Gomery, 1993; Meier & Trappel, 1998; Smith, 2004), resulting in “artificially narrowed choices” (Bagdikian, 2004, p. 4).
Concentration discourages product innovation, as a single concept can be efficiently repackaged for multiple outlets (Blevins, 2002) and favors marketable products over those with less commercial appeal (Horwitz, 2005).
The interests of stockholders and advertisers prevail over the public interest (Smith, 2004).
Programs with positive externalities (e.g., news and public affairs) are under- produced relative to their importance (Baker, 2002).
Media advance consumerism and inequality, and marginalize civic values and political action (McChesney, 2004a), undermining localism and the “social and civic ties that bind communities” (Horwitz, 2005, p. 187).
Journalistic values suffer in the face of pressure to maximize profits and the media’s watchdog function is undermined by its corporate ties (Horwitz, 2005), particularly as outlets are unlikely to publish criticisms of their own company or those policies they support (Shah, 2009).
News and public affairs programs have become more about entertainment and promoting the parent company’s other properties than creating an informed citizenry (Shah, 2009). Indeed, Williams (2002) found that networks devoted more coverage to their parent companies products than their competitors’. Further, firms that were less integrated and diversified showed less synergy bias than highly integrated and diversified companies. These results were confirmed by Cleary and Adams-Bloom (2009) who found networks were more likely to cover entertainment products produced by the networks’ parent companies than those produced by other sources; network products were also treated more positively than those produced by other sources.
Concentration creates nearly insurmountable barriers to entry for new firms (Bagdikian, 2004; Gomery, 1993; Shah, 2009).
31
While compelling, these arguments do not capture the full complexity of the
relationship between concentration and the content produced. It cannot be taken as a
given that concentration negatively impacts programming. All commercial stations face
the same commercial pressures and are driven by the same basic goal: profit-
maximization. Just as “small or medium-sized media firms can be irresponsible and
profit-driven,” large firms or those operating under monopoly conditions may fulfill their
social responsibilities as “an investment in goodwill and credibility” (Noam, 2009, p. 13).
That is, conglomerates may be capable of providing more diversity because large
organizations are able to capture economies of scale and spread production costs over
a wide audience (Iosifides, 1999); large firms may have the resources to innovate and
increase the range of output (Doyle, 2002). For example, station groups may convert
the efficiencies achieved into greater amounts of local informational programming (Yan
& Napoli, 2006).
Theoretical perspectives (based in economics) and empirical research on the
relationship between concentration and television content are discussed further below.
Market Structure and Program Type Diversity
Theoretical Perspectives
Program choice models strive to explain programming behavior in terms of market
structure (Beebe, 1977; Spence & Owen, 1977; Steiner, 1952). Schumpeter (1950) held
that monopolistic and oligopolistic market structures encourage innovation because
firms have the incentive to develop and test new products. This leads to product
diversity. Similarly, Steiner (1952) asserted that under certain conditions, monopoly
ownership promotes greater format diversity than competition. When all stations are
32
owned by a single entity, the owner will offer distinct programming on each station to
avoid cannibalizing its own audience, resulting in greater program type diversity.
These relationships, however, are rarely straightforward and are mediated by
additional variables. For example, diversity is contingent on the distribution of audience
preferences. When audiences have a strong preference for a particular format, multiple
stations will provide it. In this case, it is preferable for the firm/programmer to capture a
portion of the majority than offering minority preferences with a relatively small potential
audience. Diversity decreases as competitors duplicate the popular format. In this
scenario, a monopoly produces greater format diversity. When preferences are weak
and distributed across a number of formats, competition and monopoly produce similar
levels of diversity (Steiner, 1952). Steiner’s model, however, rests on the assumption
that audiences will consume only their preferred format; they will choose not to view if
this format is not available. That is, non-viewing represents the second best option.
Audience behavior indicators suggest that this assumption rarely, if ever, holds. Indeed,
Klein (1971) asserted that audiences consume the medium (television) rather than
particular programs. That is, television is an end in itself rather than the means to
access a specific show. Viewers first decide to watch television and then choose from
the available programs, settling for the program that offends them the least. This is
demonstrated by relatively consistent viewing levels on a given evening for a particular
timeslot year after year, regardless of the content broadcast.
To address the shortcomings of Steiner’s model, Beebe (1977) incorporated
secondary audience preferences. When this variable is added, competition contributes
to equal or greater diversity than under a monopoly structure. The monopoly will offer
33
the minimum number of formats it takes to attract a majority of viewers. Broadcasters
select programs that please as many viewers as possible and offend the fewest in order
to attract the largest share of the TV audience. If most audience members will accept
their second or third choice, then the monopolist is better served offering only one
format with mass appeal. In a competitive market, stations may find it more lucrative to
appeal to audience’s top preferences; that is, stations may maximize audience size by
appealing to specialized, heterogeneous tastes. The result is greater program diversity
under competition than monopoly.
Spence and Owen (1977) consider production costs and audience valuation in
their model. If a program type is to be offered, the ad revenue generated by the program
must cover or exceed the costs of broadcasting the format. Ad revenue is contingent on
an advertiser’s perception of audience value; if the audience for a program is not highly
valued, the revenue generated is unlikely to cover costs and the format will not be
offered. Because stations seek to maximize profits, they are also unlikely to offer
expensive programs that cut into the bottom line. Thus, high program costs and low
audience valuations for minority taste programs contribute to the loss of program type
diversity, leaving some audience preferences unsatisfied. These findings hold
regardless of market structure.
Audience value is influenced by market dynamics (market factors), the
characteristics of the outlet (media factors) and the traits of the audience (demographic
factors) (Napoli, 2003). Intense competition in the market is associated with low
audience value because there are more suppliers of audiences and these suppliers are
often substitutes for one another (Napoli, 2003). Given that the provision of a program
34
type is contingent on sufficient revenue, and that competition tends to drive down
audience value, it would seem that under Spence and Owen’s model, competition
negatively impacts program type diversity.
Also important in determining audience value are ownership and affiliation
characteristics. Network affiliates and group-owned stations can charge higher rates
than independent stations (Wirth & Wollert, 1984). Accordingly, given their substantial
resource advantage, it could be expected that these stations would produce greater
program diversity than independent owners, though this may be offset by their
obligation to carry network programming. More important is the fact that content tends
to skew toward the preferences of highly valued audience members, reducing the
amount of minority-targeted programming (minority does not necessarily refer to race or
ethnicity, but rather viewing preferences that fall outside the majority) (Napoli, 2003).
Table 2-1 outlines the major theories regarding market structure and the range of
program choices provided.
Empirical Research
Empirical research has failed to support any definitive relationship between
structural factors and program type diversity. While many studies have found that
intensifying competition leads to greater product diversity, others have found an inverse
relationship. It is clear that market structure affects diversity, but the nature of this
relationship is more complex than theory would suggest.
Regardless of the specific findings, diversity research can be divided into two
broad categories. First are descriptive studies, which provide an overview of how
diversity has shifted over time and help identify the structures associated with the
highest diversity levels (Napoli, 1997). For example, Dominick and Pearce (1976) found
35
an overall decrease in diversity from 1953 to 1974. While peaks occurred, from 1961 to
1963 and 1969 to 1970, there was a negative trend over the broader period. A number
of descriptive studies focusing on other mediums beyond broadcast television have
been conducted as well and have predominantly focused on cable (Bae, 1999; Barrett,
1995; Chan-Olmsted, 1996; DeJong & Bates, 1991).
The second category of diversity research includes studies that attempt to explain
how diversity arises (Napoli, 1997) — researchers may use a longitudinal approach to
track diversity, but the goal is explanation. Examples of explanatory research are
included below.
Long (1979) found the death of the DuMont network in the 1950s led to a decline
in horizontal program type diversity and the number of specialized appeal programs
(e.g., news, educational/instructional). The negative trend noted by Dominick and
Pearce continued into mid-1970s until a major industry shakeup occurred: ABC’s rise
from third to first in 1976 as a result of increased program expenditures and product
innovation. These market shifts encouraged CBS and NBC to offer new programming to
stay competitive and gain audience share. A short period of increasing program
diversity (larger number of program categories) occurred until competitive norms were
restored in the 1980s. This restoration resulted in decreasing program type diversity
(Wakshlag & Adams, 1985).
A number of explanatory studies have examined “diversity elasticity” (Greenberg &
Barnett, 1971), the change in diversity resulting from a change in the number of outlets
in a given market. Levin (1971) found that diversity increases with new station entry, but
as more stations are added, the rate of increase slows, resulting in diminishing marginal
36
returns. Indeed, as more stations are added, the additional content provided is likely to
be of an already popular program type rather than an entirely new category because
successful shows are imitated in the hopes of attaining similar success while less
popular shows (with lower revenue potential) are not emulated. van der Wurff and van
Cuilenburg (2001) also found a nonlinear relationship between competition and
diversity. While moderate competition encourages diversity, ruinous competition
produces “excessive sameness.” These findings indicate a positive linear relationship
between competition and diversity cannot be blindly accepted. Instead, the level of
diversity may be dependent on the type and degree of competition (Park, 2005; van der
Wurff & van Cuilenburg, 2001).
A number of explanatory studies have been conducted beyond the television
industry as well. In studies of the U.S. music industry, Peterson and Berger (1975)
along with Rothenbuhler and Dimmick (1982) found intense market competition was
associated with more hit songs and a greater diversity of producers and lyrical themes.
In radio, format diversity was positively correlated with the number of competitors
serving the market (Berry & Waldfogel, 2001; Chambers, 2003; Polinksy, 2007; Rogers
& Woodbury, 1996). Studies of the radio industry have tended to focus on local stations
more than comparable studies in television that have generally tended to focus on the
behaviors of national networks, which are largely absent in radio. Consequently, they
are of great relevance to this study of local television markets.
Though the majority of studies (like those above) have supported a positive (even
if mediated) link between competition and program type diversity, a number have found
the opposite across a range of industries (Burnett, 1992; Hellman & Soramaki, 1985;
37
Lin, 1995b). For example, Lin (1995a) found stable levels of diversity during the 1980s
despite the proliferation of alternate delivery systems that were expected to increase
diversity. In addition, Drushel (1998) found increasing concentration in the radio industry
following the passage of the 1996 Telecommunication Act did not yield increased
listener choice.
Overall, while the literature suggests a link may exist between market structure
and program diversity, the direction of this relationship is uncertain. As Napoli (1999)
summarizes, “Research in this area has thus not definitively answered the causality
question” (pg. 21). The current study builds on the existing literature to help ascertain
whether relationships exist and the relative strength of these associations. Table 2-2
outlines the research that has been conducted on market structure and diversity across
a number of industries, as well as the major variables used in these studies.
Ownership and Program Type Diversity
As Levin (1970) explains, “group ownership is said to reduce local single-station
ownership, reducing program diversity in the process, and pose potential anti-
competitive dangers.” Therefore, the FCC has enacted group ownership rules to
promote “maximum competition among broadcasters and the greatest possible diversity
of programming sources and viewpoint” (Federal Communications Commission, 1969).
These regulations are expected to produce economic efficiency and program balance
as well as diversity (Levin, 1970).
The majority of the research on diversity and ownership characteristics comes
from studies of radio and television news programming (discussed further below.)
38
Informational Programming
As noted previously, of greater concern than the sheer number of program types
available is the quantity of news and public affairs programs provided. These programs
are perceived as particularly important because of their positive impact on society. As
Napoli (2004) explains:
The value of such programming extends beyond the revenue it generates and the satisfaction consumers gain by consuming it. These positive externalities include enhanced citizen knowledge and decision making, better-informed political participation, and a citizenry better capable of influencing government to pursue its best interests (p. 112).
In addition, the quantity of news and public affairs programming provided may
serve as a proxy for viewpoint diversity (Wildman, 2007). Therefore, the relationship
between station and market factors and the provision of news and public affairs
programming merits special attention.
A number of market factors may affect the quantity of news and public affairs
programming provided.
Market Factors: Level of Competition
First, the intensity of market competition may be an important driver of the
provision of informational programming. Napoli and Yan (2007) found that while
competition (the number of commercial stations in a market) had no impact on the
likelihood a station would provide local news programming, it was positively related to
the amount of news aired by stations already offering this program type. In a similar
study, Yan and Napoli (2006) found stations in markets with a large number of
commercial stations were more likely to provide local public affairs programming,
though this variable was not related to the quantity provided. Moreover, Napoli (2001b)
found a statistically significant (albeit weak) positive relationship between the number of
39
commercial stations in a market and the amount of local affairs programming provided.
Powers (2001) found that as competition intensified, the number of newscasts
increased as stations provided more news programming in order to compete.
Outside broadcast television, Barrett (1995) found that competition among cable
operators within the same city yielded more local programming. Further, the majority of
studies from the newspaper industry have found a positive relationship between
competition and content diversity (Everett & Everett, 1989; George, 2007; Lacy, 1987,
1988; Litman & Bridges, 1986).
While the literature suggests competitive conditions lead to greater provision of
informational programming, it is possible competition actually harms diversity because
market pressures and the public interest are inherently at odds. As Hamilton (2006, p.
29) explains, “the failure of news outlets to earn revenues from the value of better voting
decisions means that news programs or products that focus on hard news will be
underproduced.” Indeed, seeking to maximize profit, stations may favor entertainment
programming (which often draws larger audiences) over informational fare (Park, 2005).
Competition may increase overall diversity, but the source of these gains must be
scrutinized closely; they are of limited value if they come at the cost of decreased
informational programming.
While not directly related to this study, there is a notable body of literature
exploring the impact of competition on news content. Atwater (1984) found a positive
relationship between the number of stations in a market and the number of unique news
stories. Similarly, in Denmark, competition led to more diverse news content (Powers,
Kristjansdottir & Sutton, 1994). Bae (1999) found greater content differentiation in cable
40
news programming as a result of competition. In a study of the Swedish television
industry, however, news was less informative and more commercialized as a result of
decreased competition (Hvitfelt as cited in Li and Chiang, 2001). Similarly, studies of the
newspaper industry have found little support for the relationship between content quality
and market competition (Lacy, 1988; McCombs, 1987, 1988). As Iosifides (1999)
concludes, “more media outlets do not necessarily ensure increased public
argumentation and discourse” (p. 159). The impact of competition on news content is
beyond the scope of the present study, however. Rather, the current analysis focuses
solely on the provision of informational content.
Market Factors: Market Size
Provision of informational programming is also related to market size. Therefore, in
large markets, larger potential audiences equate to greater revenue potential for a given
program (Napoli, 2004) and, consequently, a heightened ability to supply specialized
content (Doyle, 2002). Traditional program choice models assume programmers
consider potential audience size in deciding what programs to air (Beebe, 1977; Owen,
Beebe, & Manning, 1974; Spence & Owen, 1977; Steiner, 1952). With regards to
empirical research, the FCC (1984) found a positive relationship between market size
and the provision of local news and public affairs programming when these formats are
considered in combination. Napoli (2004) also found a positive relationship between
market size and the quantity of local news and public affairs programming provided; in
fact, market size was the most important explanatory factor.
Table 2-3 outlines the research that has been conducted on market structure and
informational programming for both the broadcast and print industries. It also includes
the variables used in these studies.
41
Station Factors: Local Ownership
Ownership of is among the key station characteristics that impact the quantity of
informational programming provided, and represents a particularly contentious policy
area. For more than 80% of Americans, local TV stations and newspapers are the
principle source of information about their local communities (Kimmelman, n.d.b). Yet,
“the economic pressures against localism are strong and growing everywhere” (Noam,
2009). As stations increasingly fall into the hands of fewer, often distant, corporate
owners, some fear that non-locally owned stations may ignore the needs of those they
are mandated to serve. That is, they may be unresponsive to community interests and
less likely to provide coverage of local issues.
The oft-cited example of the detrimental impact of consolidation is the coverage
(or, more appropriately, lack thereof) of a chemical spill in Minot, North Dakota
(Bagdikian, 2004; Consumers Union, n.d.). Following the spill, local police reached out
to the local radio stations after the emergency warning systems failed. They were
unable to reach anyone at the stations for an hour and a half because all six were
operated from afar by remote control; the content was prerecorded and used on stations
nationwide. The stations’ owner (Clear Channel) was located in San Antonio, thousands
of miles away from the community of license. Hundreds of local residents were
hospitalized from exposure to the spill (Bagdikian, 2004; Consumers Union, n.d.). As
the Minot example demonstrates, as a consequence of consolidation, “information that
is critical to all community members is not covered as extensively, making it more
difficult for citizens to get all the facts about community issues” (Consumers Union,
n.d.).
42
Certainly as critics of the Minot case would point out, local owners may be more in
touch with community interests than distant chain or network owners and, thus, provide
more programming focusing on the local community. Indeed, FCC license allocation
policies favoring local owners are premised on the assumption these owners have
greater ties to the market and will, thus, be more sensitive to the needs and interests of
the community of license than owners geographically removed from the communities
they are licensed to serve. It is assumed that “programming arrangements that favor
local autonomy over national-level decision making (e.g., independent stations vs.
network affiliates)” (Napoli and Yan, 2007, p.41) also better serve the local community.
It may also be, however, that stations owned by a strong national network or station
group are able to provide greater amounts of news and public affairs programming
because they have the resources to fund such productions and may be able to
capitalize on economies of scale. This is the argument often made by those in favor of
greater deregulation.
Empirical research has thus far failed to generate conclusive evidence for either
argument. Wirth and Wollert (1979) found no relationship between group ownership and
the quantity of news or public affairs programming provided. A number of studies,
however, have supported the arguments in favor of local ownership put forth by critics of
consolidation. Alexander and Brown (2004) found that local ownership is associated
with an increase in the total time devoted to news, with particular increases in local and
on-location news. Similarly, Napoli (2002) found evidence local ownership was
positively related to the quantity of public affairs programming provided.
43
Supporting the view of pro-deregulation advocates, Spavins, Denison, Roberts &
Frenette (2002) found that, compared to non-network-owned affiliates, network O&Os
provided a greater quantity of news and public affairs programming. These results were
supported by Napoli (2004), who found that when news and public affairs programming
are analyzed in combination, network owned-and-operated stations provided more
news and public affairs programming than other affiliates. This relationship holds only
for news programming; when the two are examined independently, there is no
difference between owner types in terms of the quantity of public affairs programming
provided. Nonetheless, these findings suggest that, contrary to the fears of
consolidation critics, “increased network ownership…may in fact promote the availability
of local news programming from these stations” (Napoli, 2004, p. 119).
Station Factors: Revenue
Another station characteristic impacting content output is station revenue.
Financially strong stations with the means to support the high costs of news production
may be more likely to provide this type of programming. Empirical support for this
assumption is inconclusive. It was supported by Wirth and Wollert (1979) who found a
significant relationship between revenues and local news programming. More recently,
however, Napoli (2004) found no relationship between revenues and local news
provision.
Table 2-4 includes an overview of the research that has been conducted on
ownership characteristics and informational content for both the broadcast and print
industries.
44
Measuring Diversity
Diversity and concentration fall on opposite ends of the same spectrum (McDonald
& Dimmick, 2003; McDonald & Lin, 2004). Concentration is “typically measured using
the reverse of common measures of diversity and therefore also refer to the same
underlying concept” (McDonald & Lin, 2004, p. 105).
Albarran (1996) suggests television concentration can be assessed in two ways:
by measuring a product’s share of audience (via circulation or ratings data) or by
calculating the top firms’ share of revenues/sales. Given the complexities of obtaining
ratings data for a large, national sample, the current study used the latter approach
(though modified to assess a program type’s share of total minutes).
A number of indices have been developed to assess diversity across research
traditions “and for different purposes” (Hillve et al., 1997, p. 297). Across all industries,
the four-firm concentration ratio (CR4) is the most commonly used index (Shepherd,
1970, 1979). This ratio is calculated by summing the market shares of the four largest
firms in an industry (Shughart, 2008). A market is considered concentrated if the top
four firms claim at least 50% of industry revenues (Albarran, 1996). However, this index
is not sensitive to each firm’s relative share; that is, it cannot distinguish between a
market dominated by a single firm and those with four firms of similar size (Noam,
2009). This index has been used very rarely, if ever, within media research to assess
program type diversity. Rather, four dominant approaches have emerged. These apply
to vertical diversity only, with horizontal diversity indices being discussed later.
First, Dominick and Pearce’s indicator measures the percentage of the schedule
accounted for by the most common program categories (somewhat like the CR4 index).
“It is derived by summing the percentages in the top three categories per season and
45
subtracting from 100...A low score would indicate a restricted range of choices for the
audience” (1976, p.73). The range depends on the number of identified categories, with
a minimum of zero in all cases if the top three categories represent the only program
types available. The maximum is calculated by dividing 100 by the number of categories
(assuming content is equally divided among categories). This number, indicating the
maximum for any one type if all categories are present, is then multiplied by three and
subtracted from 100. For example, if content is equally divided in 14 program types,
then a single type can equal, at most, 7% of the programming. The top three would
represent 21% of the programming, leaving a maximum index value of 79 (100-21). The
Dominick & Pearce index “is helpful in evaluating changes in the types of programming
that may dominate the…schedule” (Einstein, 2002, p. 6), but is of limited use in
evaluating the overall schedule beyond the top three program types (Einstein, 2002;
Kambara, 1992; Napoli, 1999).
Dominick and Pearce’s indicator is one-dimensional; it simply measures the
largest categories without consideration of the total number of program types. Litman
and Hasegawa (1996) suggest “the perfect diversity index should be sensitive to both
the number of categories and to the size distribution of programming within these
categories (p. 206). Therefore, more common are studies using “dual-concept” diversity
measures (Junge, 1994 cited in McDonald & Dimmick, 2003). In this view, “a measure
(index) of diversity is a summary description of a population with a class structure”
(Junge, 1994, p.16 cited in McDonald & Dimmick, 2003). The first dimension involves
the classification or categorization of elements, while the second consists of assigning
or allocating elements to these categories. Dual concept measures better capture the
46
true meaning of diversity by revealing how evenly elements are distributed across
categories (McDonald & Dimmick, 2003). These same authors discuss 13 measures of
dual concept diversity that fall into two categories: those based on Simpson’s D and
those based on the work of Good (1953, cited in McDonald & Dimmick, 2003) that use
logarithmic transformation.
Simpson’s D is the second primary diversity index. It is calculated by summing the
squared probabilities from all the categories and then subtracting this total from 1.0
(McDonald & Dimmick, 2003). D is the probability that two randomly selected elements
come from the same category. A probability of 0 indicates all elements fall within one
category (no diversity), while 1.0 indicates all the items are from different categories
(perfect diversity) (McDonald & Lin, 2004). Though easy to calculate and interpret,
Simpson’s D has been primarily used outside the field of communications (McDonald &
Dimmick, 2003).
A third diversity measure is the relative entropy index (H), conceived by Shannon
and Weaver (1963). Based on Good’s logarithmic transformations, this measure
considers both the number of program types offered and the concentration within those
categories (the time devoted to this type.) Entropy is calculated using the formula H=
−Σpi log2 pi, where H is variety and p is the probability of seeing program type i (Napoli,
2001a; Shannon & Weaver, 1963; Wakshlag & Adams, 1985). A value of zero
represents absolute concentration with all programs falling within one type. The
maximum value depends on the number of categories identified, but represents
maximum unpredictability with all types present in equal proportion (Wakshlag &
Adams, 1985). This index has been used in a number of previous studies, including
47
Aslama et al. (2004), Hillve et al. (1997), Ishikawa & Muramatsu (1996) and Wakshlag &
Adams (1985).
The fourth index, the Hirschman-Herfindahl Index, is the mostly commonly used in
communications research (Bates, 1993; Einstein, 2002; Napoli, 1999). A portion of the
HHI is mathematically equivalent to Simpson’s D, but values are inversely related to
diversity. That is, high values on the HHI actually correspond to low diversity, while the
same values would indicate high diversity using Simpson’s D. The precise calculation of
the Herfindahl Index is discussed further in the Methodology section.
McDonald and Dimmick (2003) tested all thirteen measures of dual concept
diversity using a common data set and found that in many cases it does not matter
which index is used. Some indices may be more appropriate in certain situations (e.g.,
when the index must be particularly sensitive to the number of categories), but that
discussion is outside the scope of the current study.
In the present study, the HHI is used to measure vertical diversity given its
widespread use in previous research. Two indices were used to assess horizontal
diversity: the HHI and Choice Option Index (COI). The first measures the breadth of
offerings; the second, the difference between the programs provided by all stations in
the market (Hellman, 2001). HHI is calculated the same way for both vertical and
horizontal diversity, but the latter captures the concentration of programming provided
by all stations in the market. That is, the index summarizes the overall distribution of
programming by type and reflects how varied and balanced programming is in the
market. For both vertical and horizontal diversity, the larger the range of genres
48
available and the more evenly programs are distributed across these categories, the
greater the diversity provided.
Examining how much time is devoted to each program type does not provide a
complete picture of horizontal diversity, however. It is also important to evaluate how
closely stations’ offerings resemble one another’s at any given point (referred to as
dissimilarity by Aslama et al., 2004). This is achieved via the Choice Option Index (COI)
(Hellman, 2001), which measures the average “number of simultaneous program types
available to the public” during a given time period (e.g., 15 minutes or half hour). The
COI is the more commonly used approach to measuring horizontal diversity. It has been
used in previous research by Einstein (2002, 2004), Levin (1971, 1980), Li and Chiang
(2001) and Litman (1979).
Research Questions
As discussed above, previous research has found both positive and negative
relationships between station ownership, program type and origin diversity as well as
the provision of informational programming. The following research questions were
explored to examine the relationship between these variables.
RQ1a: How does station ownership influence the diversity of content broadcast by local stations? RQ1b: How does station ownership influence the diversity of program origination sources provided by local television stations? RQ1c: How does station ownership influence the quantity of local news and public affairs programming provided by local television stations?
Uncertainty also exists regarding the relationship between market competition and
programming. The following research questions were asked to further investigate this
relationship.

49
RQ2a: How does the level of competition in local markets affect the diversity of programming provided by stations in these markets? RQ2b: How does the level of competition in local markets influence the diversity of program origination sources in these markets? RQ2c: How does the level of competition in local markets influence the quantity of local news and public affairs programming provided in these markets?
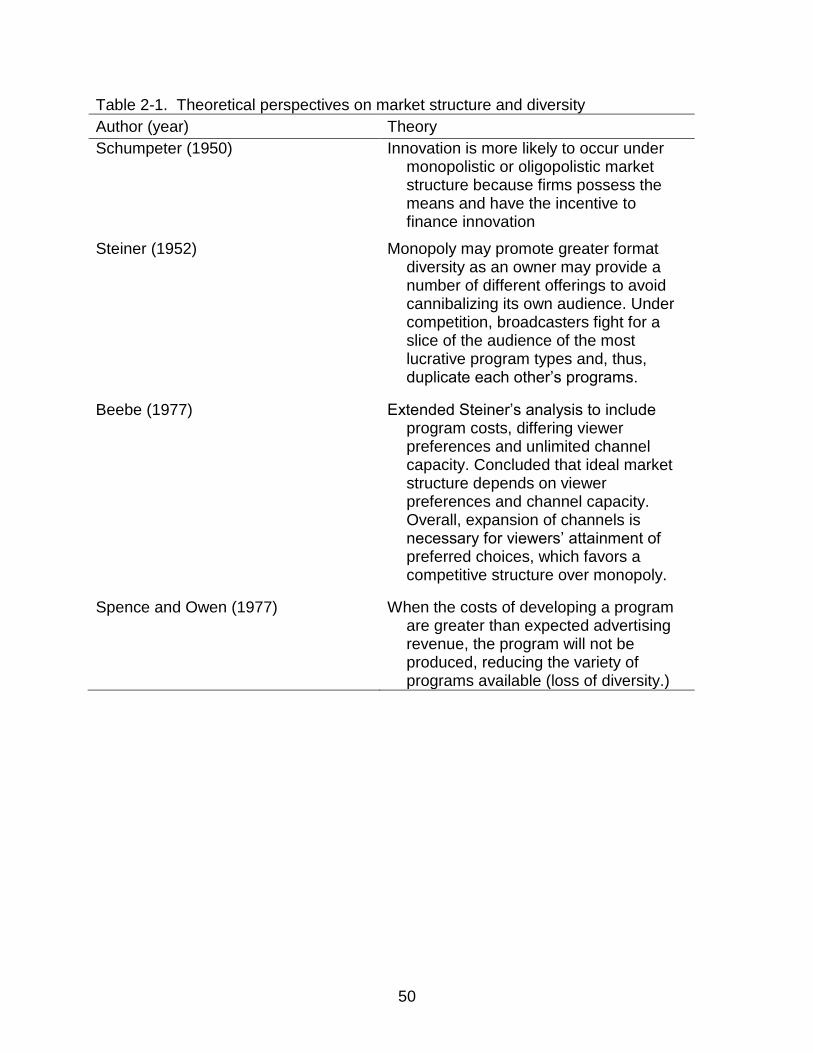
50
Table 2-1. Theoretical perspectives on market structure and diversity
Author (year) Theory
Schumpeter (1950) Innovation is more likely to occur under monopolistic or oligopolistic market structure because firms possess the means and have the incentive to finance innovation
Steiner (1952) Monopoly may promote greater format diversity as an owner may provide a number of different offerings to avoid cannibalizing its own audience. Under competition, broadcasters fight for a slice of the audience of the most lucrative program types and, thus, duplicate each other’s programs.
Beebe (1977) Extended Steiner’s analysis to include program costs, differing viewer preferences and unlimited channel capacity. Concluded that ideal market structure depends on viewer preferences and channel capacity. Overall, expansion of channels is necessary for viewers’ attainment of preferred choices, which favors a competitive structure over monopoly.
Spence and Owen (1977) When the costs of developing a program are greater than expected advertising revenue, the program will not be produced, reducing the variety of programs available (loss of diversity.)
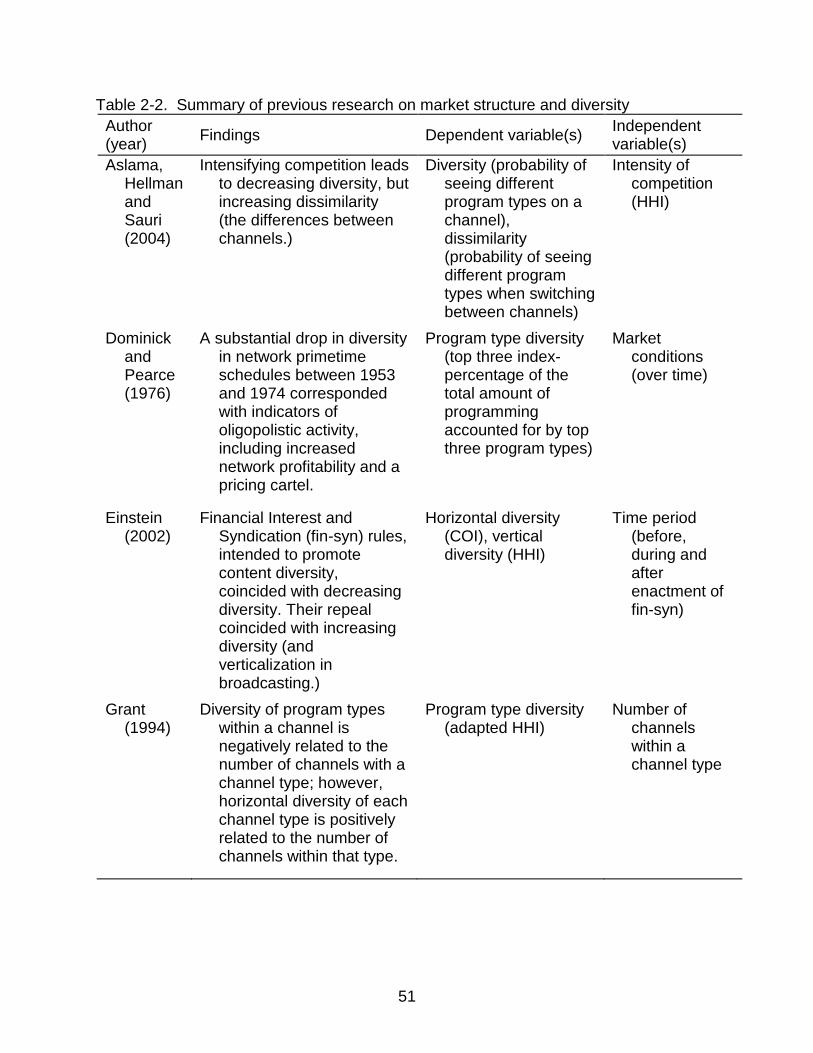
51
Table 2-2. Summary of previous research on market structure and diversity
Author (year)
Findings Dependent variable(s) Independent variable(s)
Aslama, Hellman and Sauri (2004)
Intensifying competition leads to decreasing diversity, but increasing dissimilarity (the differences between channels.)
Diversity (probability of seeing different program types on a channel), dissimilarity (probability of seeing different program types when switching between channels)
Intensity of competition (HHI)
Dominick and Pearce (1976)
A substantial drop in diversity in network primetime schedules between 1953 and 1974 corresponded with indicators of oligopolistic activity, including increased network profitability and a pricing cartel.
Program type diversity (top three index-percentage of the total amount of programming accounted for by top three program types)
Market conditions (over time)
Einstein (2002)
Financial Interest and Syndication (fin-syn) rules, intended to promote content diversity, coincided with decreasing diversity. Their repeal coincided with increasing diversity (and verticalization in broadcasting.)
Horizontal diversity (COI), vertical diversity (HHI)
Time period (before, during and after enactment of fin-syn)
Grant (1994)
Diversity of program types within a channel is negatively related to the number of channels with a channel type; however, horizontal diversity of each channel type is positively related to the number of channels within that type.
Program type diversity (adapted HHI)
Number of channels within a channel type
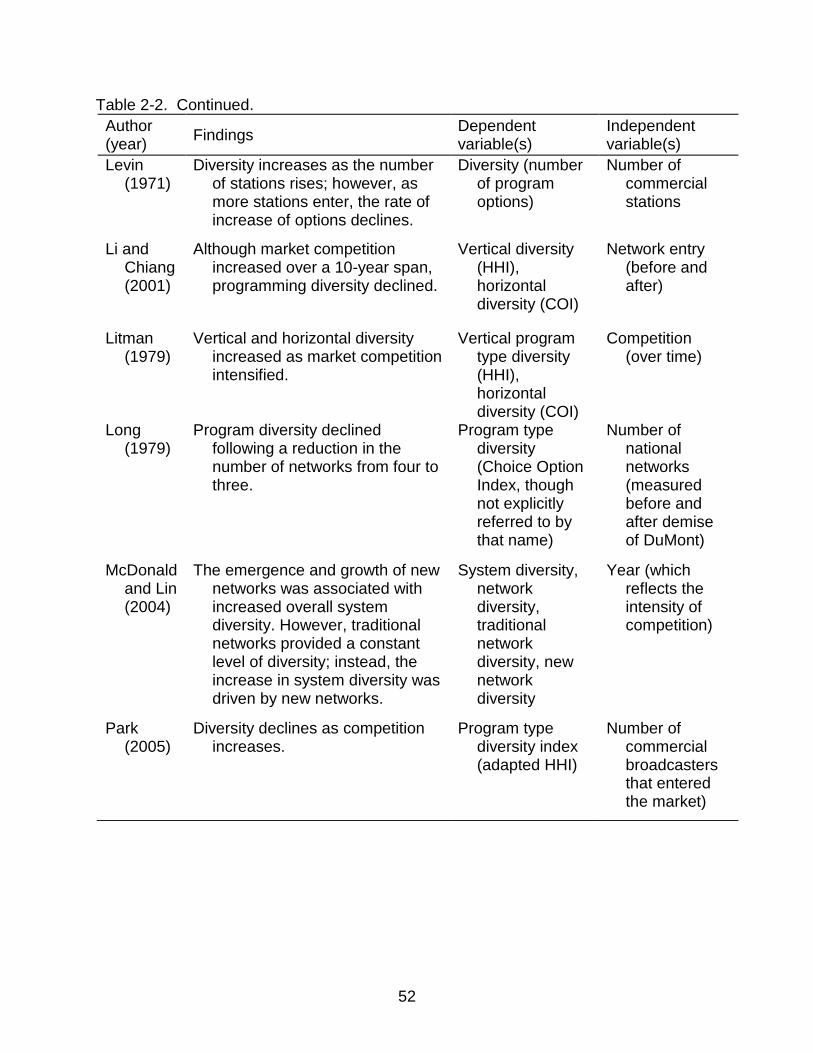
52
Table 2-2. Continued.
Author (year)
Findings Dependent variable(s)
Independent variable(s)
Levin (1971)
Diversity increases as the number of stations rises; however, as more stations enter, the rate of increase of options declines.
Diversity (number of program options)
Number of commercial stations
Li and Chiang (2001)
Although market competition increased over a 10-year span, programming diversity declined.
Vertical diversity (HHI), horizontal diversity (COI)
Network entry (before and after)
Litman (1979)
Vertical and horizontal diversity increased as market competition intensified.
Vertical program type diversity (HHI), horizontal diversity (COI)
Competition (over time)
Long (1979)
Program diversity declined following a reduction in the number of networks from four to three.
Program type diversity (Choice Option Index, though not explicitly referred to by that name)
Number of national networks (measured before and after demise of DuMont)
McDonald and Lin (2004)
The emergence and growth of new networks was associated with increased overall system diversity. However, traditional networks provided a constant level of diversity; instead, the increase in system diversity was driven by new networks.
System diversity, network diversity, traditional network diversity, new network diversity
Year (which reflects the intensity of competition)
Park (2005)
Diversity declines as competition increases.
Program type diversity index (adapted HHI)
Number of commercial broadcasters that entered the market)
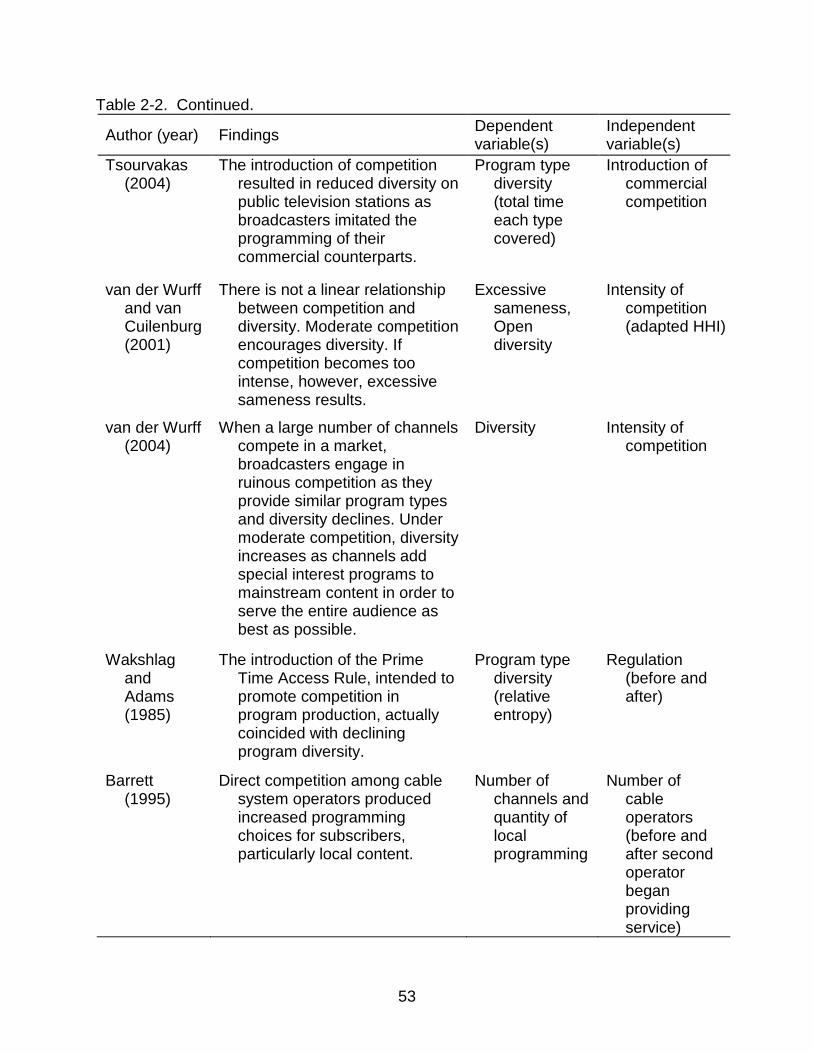
53
Table 2-2. Continued.
Author (year) Findings Dependent variable(s)
Independent variable(s)
Tsourvakas (2004)
The introduction of competition resulted in reduced diversity on public television stations as broadcasters imitated the programming of their commercial counterparts.
Program type diversity (total time each type covered)
Introduction of commercial competition
van der Wurff and van Cuilenburg (2001)
There is not a linear relationship between competition and diversity. Moderate competition encourages diversity. If competition becomes too intense, however, excessive sameness results.
Excessive sameness, Open diversity
Intensity of competition (adapted HHI)
van der Wurff (2004)
When a large number of channels compete in a market, broadcasters engage in ruinous competition as they provide similar program types and diversity declines. Under moderate competition, diversity increases as channels add special interest programs to mainstream content in order to serve the entire audience as best as possible.
Diversity Intensity of competition
Wakshlag and Adams (1985)
The introduction of the Prime Time Access Rule, intended to promote competition in program production, actually coincided with declining program diversity.
Program type diversity (relative entropy)
Regulation (before and after)
Barrett (1995)
Direct competition among cable system operators produced increased programming choices for subscribers, particularly local content.
Number of channels and quantity of local programming
Number of cable operators (before and after second operator began providing service)
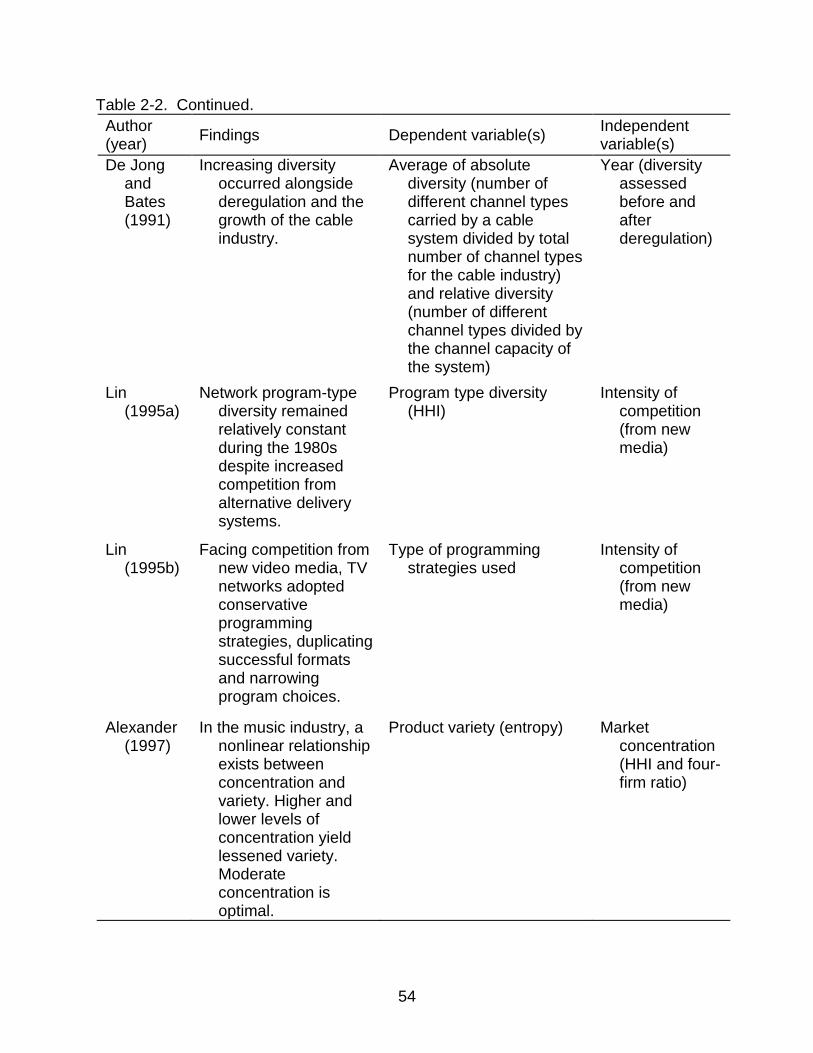
54
Table 2-2. Continued.
Author (year)
Findings Dependent variable(s) Independent variable(s)
De Jong and Bates (1991)
Increasing diversity occurred alongside deregulation and the growth of the cable industry.
Average of absolute diversity (number of different channel types carried by a cable system divided by total number of channel types for the cable industry) and relative diversity (number of different channel types divided by the channel capacity of the system)
Year (diversity assessed before and after deregulation)
Lin (1995a)
Network program-type diversity remained relatively constant during the 1980s despite increased competition from alternative delivery systems.
Program type diversity (HHI)
Intensity of competition (from new media)
Lin (1995b)
Facing competition from new video media, TV networks adopted conservative programming strategies, duplicating successful formats and narrowing program choices.
Type of programming strategies used
Intensity of competition (from new media)
Alexander (1997)
In the music industry, a nonlinear relationship exists between concentration and variety. Higher and lower levels of concentration yield lessened variety. Moderate concentration is optimal.
Product variety (entropy) Market concentration (HHI and four-firm ratio)
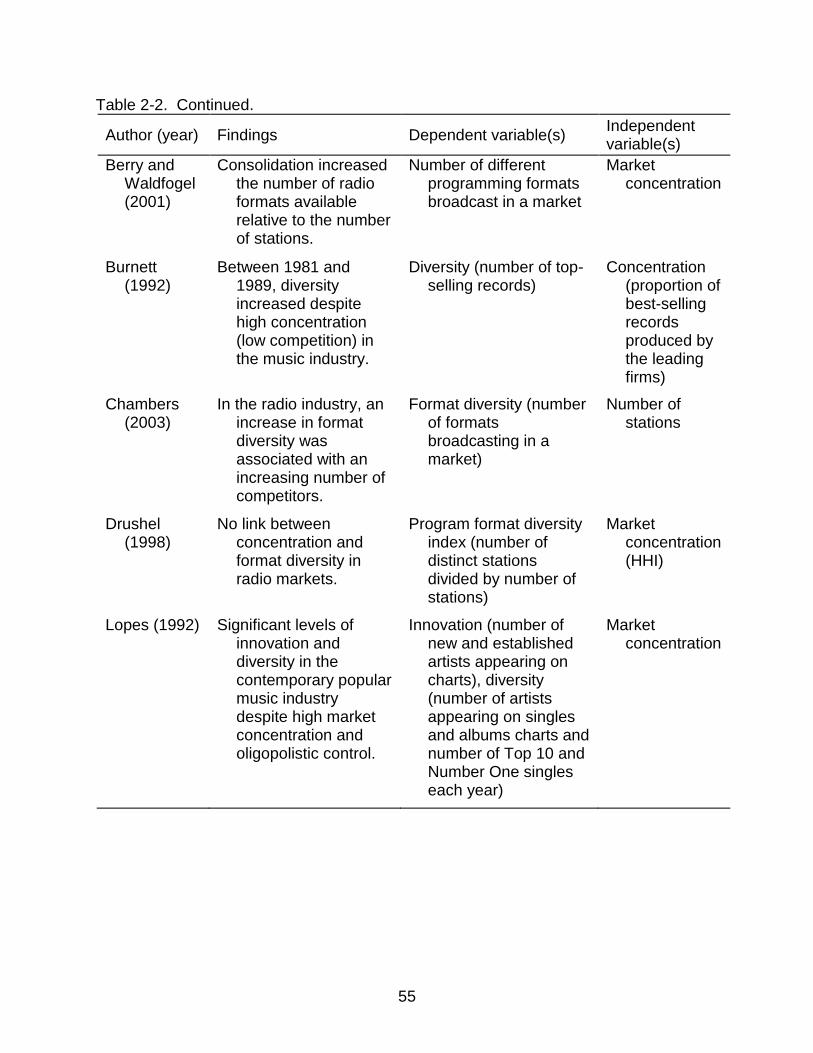
55
Table 2-2. Continued.
Author (year) Findings Dependent variable(s) Independent variable(s)
Berry and Waldfogel (2001)
Consolidation increased the number of radio formats available relative to the number of stations.
Number of different programming formats broadcast in a market
Market concentration
Burnett (1992)
Between 1981 and 1989, diversity increased despite high concentration (low competition) in the music industry.
Diversity (number of top-selling records)
Concentration (proportion of best-selling records produced by the leading firms)
Chambers (2003)
In the radio industry, an increase in format diversity was associated with an increasing number of competitors.
Format diversity (number of formats broadcasting in a market)
Number of stations
Drushel (1998)
No link between concentration and format diversity in radio markets.
Program format diversity index (number of distinct stations divided by number of stations)
Market concentration (HHI)
Lopes (1992) Significant levels of innovation and diversity in the contemporary popular music industry despite high market concentration and oligopolistic control.
Innovation (number of new and established artists appearing on charts), diversity (number of artists appearing on singles and albums charts and number of Top 10 and Number One singles each year)
Market concentration
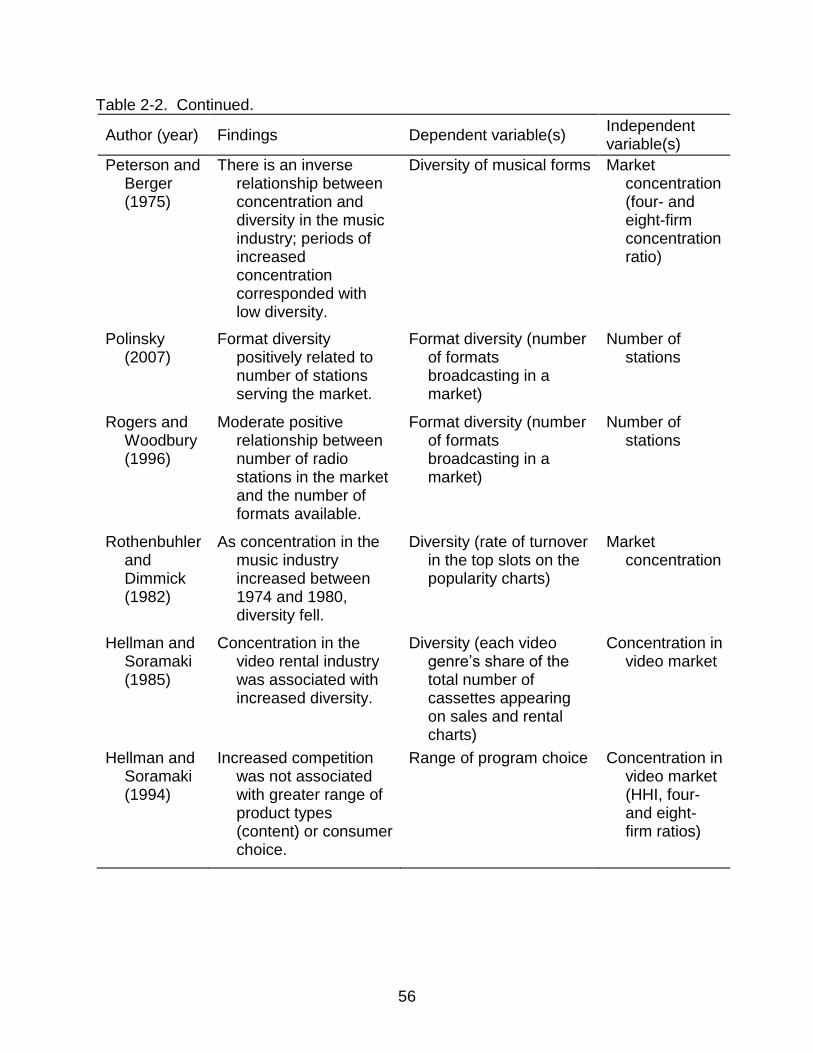
56
Table 2-2. Continued.
Author (year) Findings Dependent variable(s) Independent variable(s)
Peterson and Berger (1975)
There is an inverse relationship between concentration and diversity in the music industry; periods of increased concentration corresponded with low diversity.
Diversity of musical forms Market concentration (four- and eight-firm concentration ratio)
Polinsky (2007)
Format diversity positively related to number of stations serving the market.
Format diversity (number of formats broadcasting in a market)
Number of stations
Rogers and Woodbury (1996)
Moderate positive relationship between number of radio stations in the market and the number of formats available.
Format diversity (number of formats broadcasting in a market)
Number of stations
Rothenbuhler and Dimmick (1982)
As concentration in the music industry increased between 1974 and 1980, diversity fell.
Diversity (rate of turnover in the top slots on the popularity charts)
Market concentration
Hellman and Soramaki (1985)
Concentration in the video rental industry was associated with increased diversity.
Diversity (each video genre’s share of the total number of cassettes appearing on sales and rental charts)
Concentration in video market
Hellman and Soramaki (1994)
Increased competition was not associated with greater range of product types (content) or consumer choice.
Range of program choice Concentration in video market (HHI, four- and eight-firm ratios)

57
Table 2-3. Summary of previous research on market structure and informational content (broadcast and print.)
Author (year)
Findings Dependent variable(s) Independent variable(s)
Atwater (1984)
Additional stations contribute to the diversity of news content in terms of the number of unique stories. Larger markets covered a greater number of unique stories and devoted more local news time to these stories.
Number of unique news stories, news content diversity (ratio of number of unique news stories to total number of stories broadcast in a market)
Number of stations in a market
Bae (1999) The entrance of new news channels resulted in increased diversity of topics covered. Each additional network contributed to the diversity of news content by providing a number of unique stories.
Topics covered, number of unique stories
Number of national cable news networks
Bishop and Hakanen (2002)
The number of locally produced public affairs programs declined steeply as a result of deregulation in the 1980s. Large market stations better serve community needs than those in smaller markets.
Quantity of public affairs programming (number of programs, total hours)
Deregulation (before and after), market size (market rank)
Busterna (1980)
Multiple ownership did not have an adverse effect on quality of local news. Also, market size was associated with greater news expenditures
News quality (news expenditures)
Multiple ownership, market size (number of stations in market)
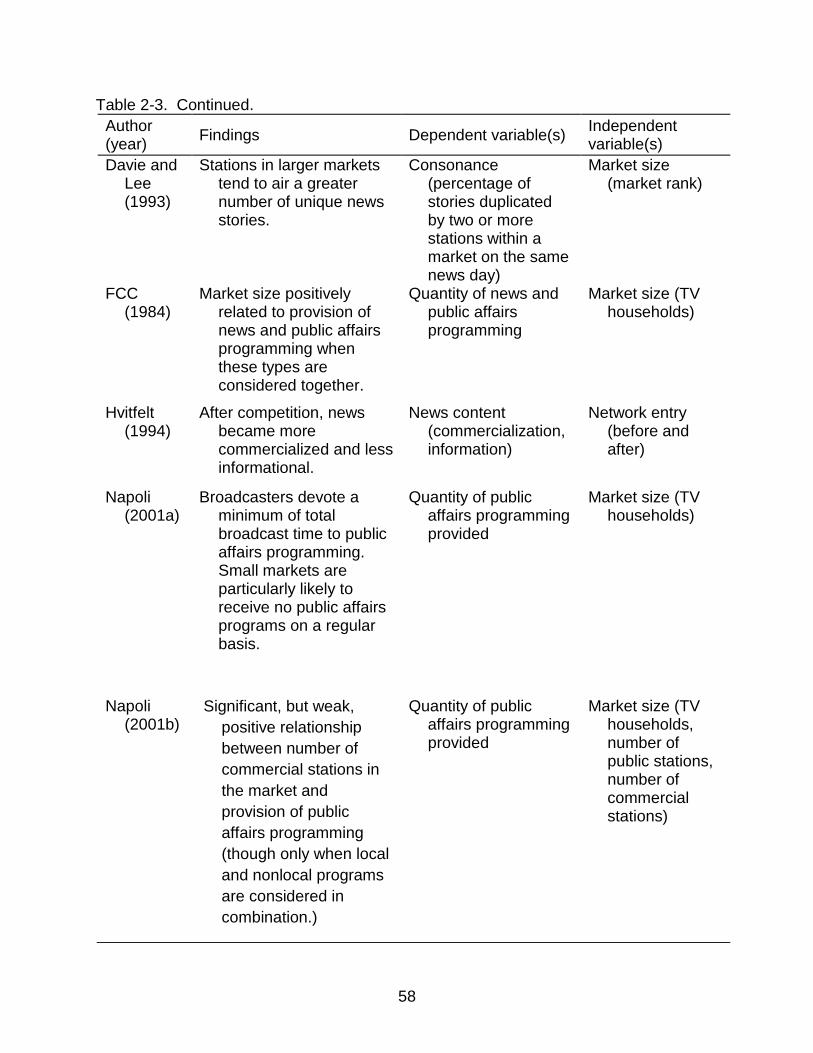
58
Table 2-3. Continued.
Author (year)
Findings Dependent variable(s) Independent variable(s)
Davie and Lee (1993)
Stations in larger markets tend to air a greater number of unique news stories.
Consonance (percentage of stories duplicated by two or more stations within a market on the same news day)
Market size (market rank)
FCC (1984)
Market size positively related to provision of news and public affairs programming when these types are considered together.
Quantity of news and public affairs programming
Market size (TV households)
Hvitfelt (1994)
After competition, news became more commercialized and less informational.
News content (commercialization, information)
Network entry (before and after)
Napoli (2001a)
Broadcasters devote a minimum of total broadcast time to public affairs programming. Small markets are particularly likely to receive no public affairs programs on a regular basis.
Quantity of public affairs programming provided
Market size (TV households)
Napoli (2001b)
Significant, but weak,
positive relationship
between number of
commercial stations in
the market and
provision of public
affairs programming
(though only when local
and nonlocal programs
are considered in
combination.)
Quantity of public affairs programming provided
Market size (TV households, number of public stations, number of commercial stations)

59
Table 2-3. Continued.
Author (year)
Findings Dependent variable(s)
Independent variable(s)
Napoli (2004)
The number of non-commercial stations in the market and the amount of news programming offered by competing affiliates are positively related to the provision of local news. Also, stations in larger markets provide more local news programming.
Quantity of local news and public affairs programming provided (in combination and separately)
Total number of commercial stations, total number of non-commercial stations in a station’s market, competing Big Four stations’ average hours of programming
Napoli and Yan (2007)
Market size, the number of commercial stations and the number of noncommercial stations in a market had no impact on the likelihood a station decided to offer news. However, number of commercial stations was positively related to the quantity of news provided.
Amount of local news programming broadcast
TV households, number of commercial stations, number of public stations
Powers (2001)
In small markets only financially strong, highly rated stations will increase news programming. In large markets, trailing stations compete by offering more news programming throughout the day. That is, stations may increase news programming output in response to the offerings of competitors.
Amount of news programming
Number of competitors in each market
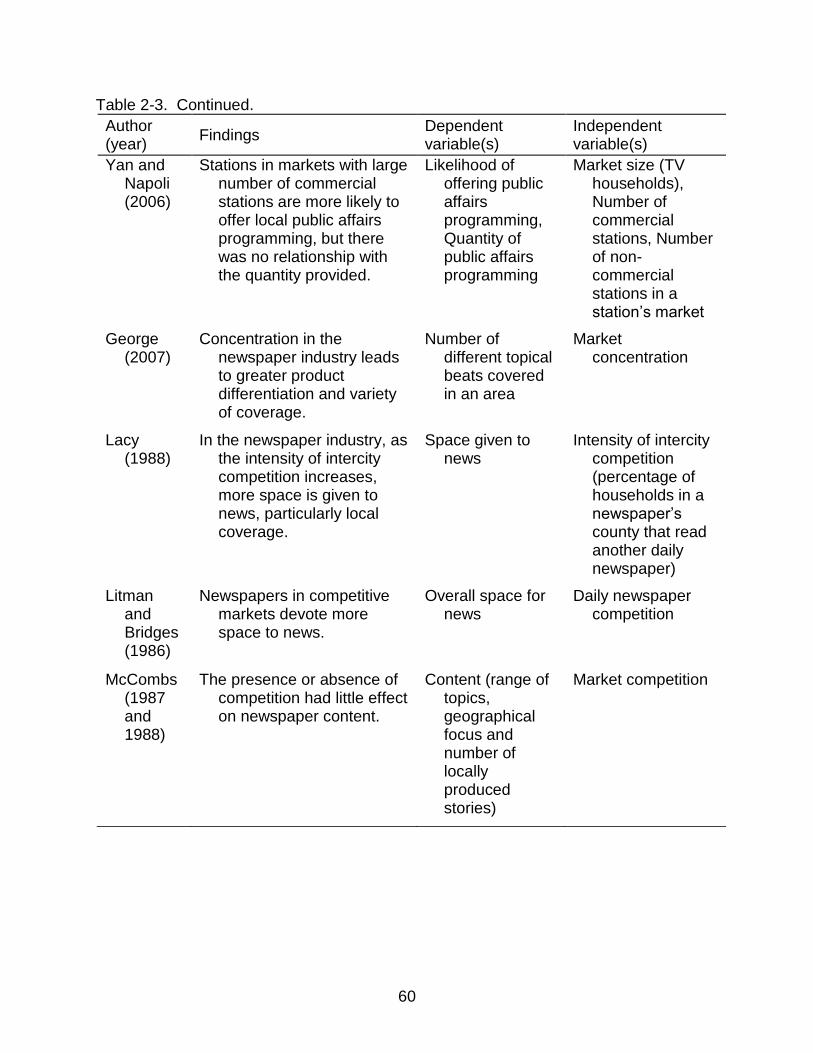
60
Table 2-3. Continued.
Author (year)
Findings Dependent variable(s)
Independent variable(s)
Yan and Napoli (2006)
Stations in markets with large number of commercial stations are more likely to offer local public affairs programming, but there was no relationship with the quantity provided.
Likelihood of offering public affairs programming, Quantity of public affairs programming
Market size (TV households), Number of commercial stations, Number of non-commercial stations in a station’s market
George (2007)
Concentration in the newspaper industry leads to greater product differentiation and variety of coverage.
Number of different topical beats covered in an area
Market concentration
Lacy (1988)
In the newspaper industry, as the intensity of intercity competition increases, more space is given to news, particularly local coverage.
Space given to news
Intensity of intercity competition (percentage of households in a newspaper’s county that read another daily newspaper)
Litman and Bridges (1986)
Newspapers in competitive markets devote more space to news.
Overall space for news
Daily newspaper competition
McCombs (1987 and 1988)
The presence or absence of competition had little effect on newspaper content.
Content (range of topics, geographical focus and number of locally produced stories)
Market competition
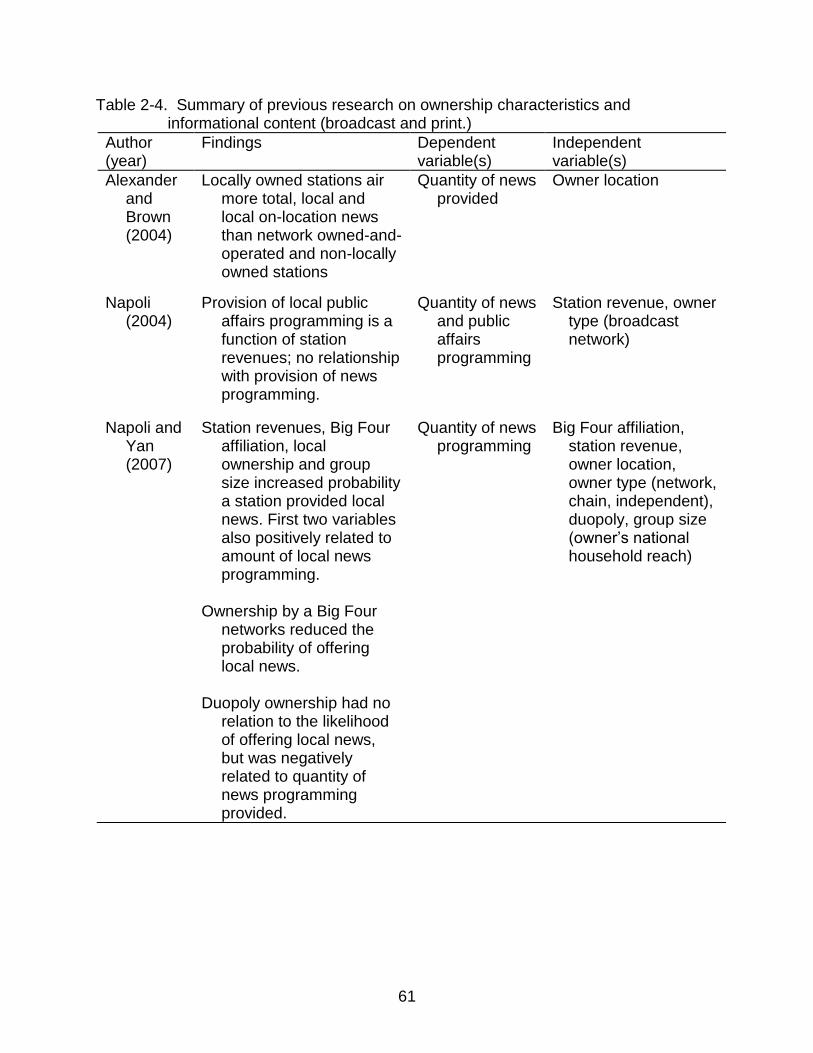
61
Table 2-4. Summary of previous research on ownership characteristics and informational content (broadcast and print.)
Author (year)
Findings Dependent variable(s)
Independent variable(s)
Alexander and Brown (2004)
Locally owned stations air more total, local and local on-location news than network owned-and-operated and non-locally owned stations
Quantity of news provided
Owner location
Napoli (2004)
Provision of local public affairs programming is a function of station revenues; no relationship with provision of news programming.
Quantity of news and public affairs programming
Station revenue, owner type (broadcast network)
Napoli and Yan (2007)
Station revenues, Big Four affiliation, local ownership and group size increased probability a station provided local news. First two variables also positively related to amount of local news programming.
Ownership by a Big Four
networks reduced the probability of offering local news.
Duopoly ownership had no
relation to the likelihood of offering local news, but was negatively related to quantity of news programming provided.
Quantity of news programming
Big Four affiliation, station revenue, owner location, owner type (network, chain, independent), duopoly, group size (owner’s national household reach)
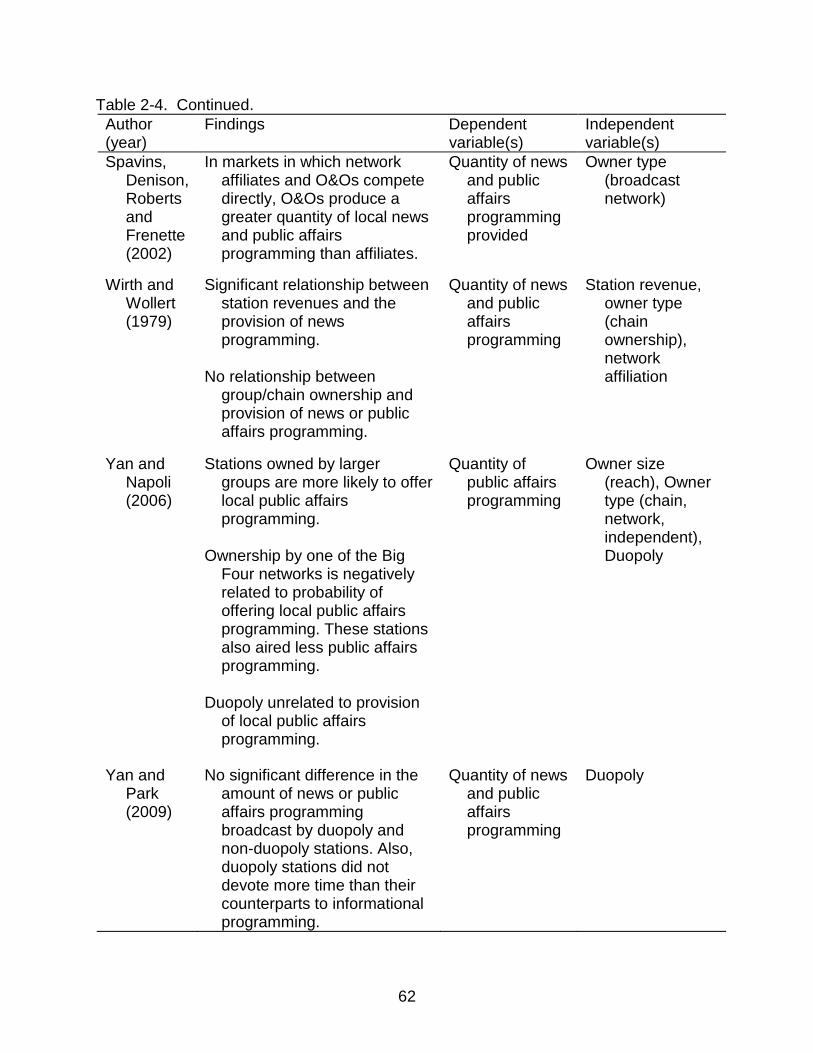
62
Table 2-4. Continued.
Author (year)
Findings Dependent variable(s)
Independent variable(s)
Spavins, Denison, Roberts and Frenette (2002)
In markets in which network affiliates and O&Os compete directly, O&Os produce a greater quantity of local news and public affairs programming than affiliates.
Quantity of news and public affairs programming provided
Owner type (broadcast network)
Wirth and Wollert (1979)
Significant relationship between station revenues and the provision of news programming.
No relationship between
group/chain ownership and provision of news or public affairs programming.
Quantity of news and public affairs programming
Station revenue, owner type (chain ownership), network affiliation
Yan and Napoli (2006)
Stations owned by larger groups are more likely to offer local public affairs programming.
Ownership by one of the Big
Four networks is negatively related to probability of offering local public affairs programming. These stations also aired less public affairs programming.
Duopoly unrelated to provision
of local public affairs programming.
Quantity of public affairs programming
Owner size (reach), Owner type (chain, network, independent), Duopoly
Yan and Park (2009)
No significant difference in the amount of news or public affairs programming broadcast by duopoly and non-duopoly stations. Also, duopoly stations did not devote more time than their counterparts to informational programming.
Quantity of news and public affairs programming
Duopoly
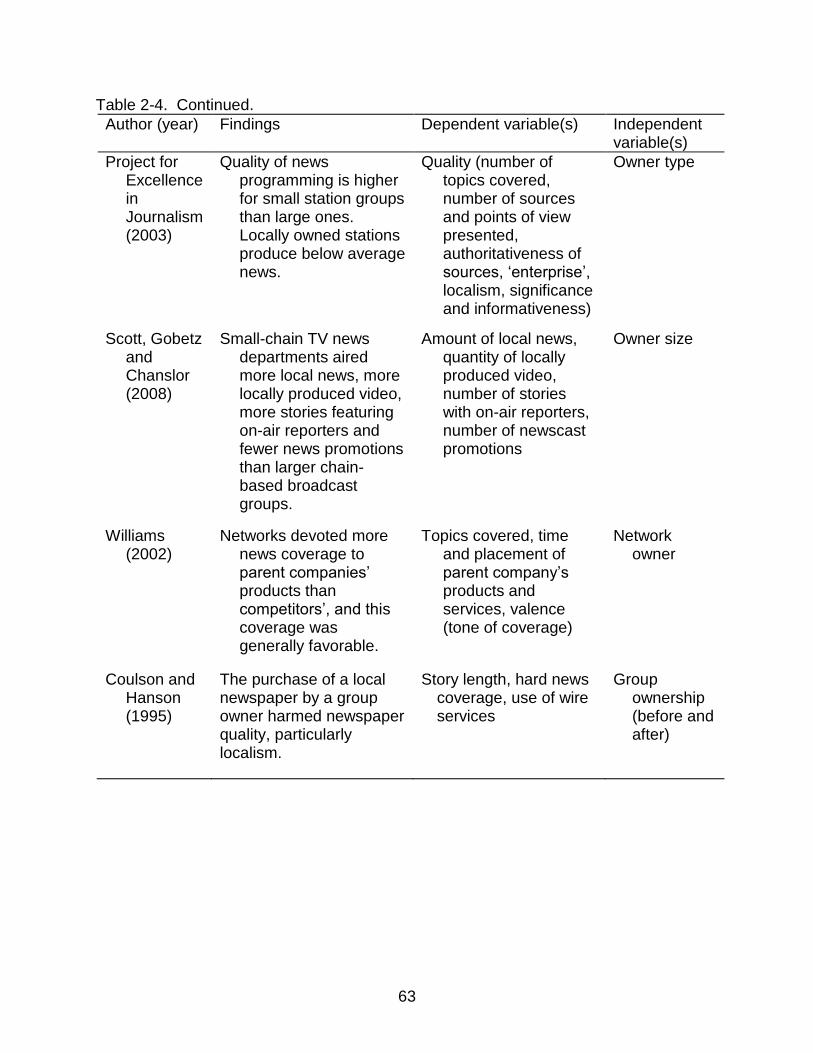
63
Table 2-4. Continued.
Author (year) Findings Dependent variable(s) Independent variable(s)
Project for Excellence in Journalism (2003)
Quality of news programming is higher for small station groups than large ones. Locally owned stations produce below average news.
Quality (number of topics covered, number of sources and points of view presented, authoritativeness of sources, ‘enterprise’, localism, significance and informativeness)
Owner type
Scott, Gobetz and Chanslor (2008)
Small-chain TV news departments aired more local news, more locally produced video, more stories featuring on-air reporters and fewer news promotions than larger chain-based broadcast groups.
Amount of local news, quantity of locally produced video, number of stories with on-air reporters, number of newscast promotions
Owner size
Williams (2002)
Networks devoted more news coverage to parent companies’ products than competitors’, and this coverage was generally favorable.
Topics covered, time and placement of parent company’s products and services, valence (tone of coverage)
Network owner
Coulson and Hanson (1995)
The purchase of a local newspaper by a group owner harmed newspaper quality, particularly localism.
Story length, hard news coverage, use of wire services
Group ownership (before and after)
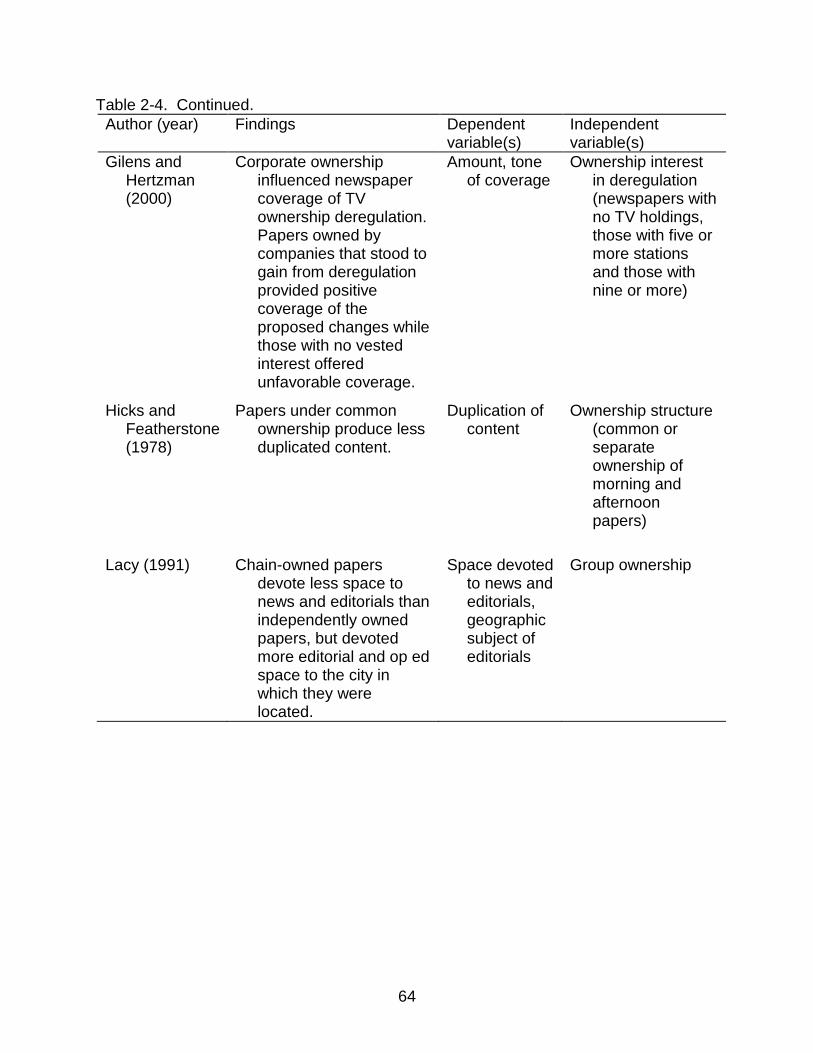
64
Table 2-4. Continued.
Author (year) Findings Dependent variable(s)
Independent variable(s)
Gilens and Hertzman (2000)
Corporate ownership influenced newspaper coverage of TV ownership deregulation. Papers owned by companies that stood to gain from deregulation provided positive coverage of the proposed changes while those with no vested interest offered unfavorable coverage.
Amount, tone of coverage
Ownership interest in deregulation (newspapers with no TV holdings, those with five or more stations and those with nine or more)
Hicks and Featherstone (1978)
Papers under common ownership produce less duplicated content.
Duplication of content
Ownership structure (common or separate ownership of morning and afternoon papers)
Lacy (1991) Chain-owned papers devote less space to news and editorials than independently owned papers, but devoted more editorial and op ed space to the city in which they were located.
Space devoted to news and editorials, geographic subject of editorials
Group ownership
65
CHAPTER 3 METHODOLOGY
This study utilized a secondary data analysis using information provided by
BIA/Kelsey and Tribune Media Services (TMS).
Ownership and market data were obtained from Broadcast Industry Analysts
(BIA), which publishes the Investing in Television Market Report and Investing in
Television Ownership Report each quarter. Stations were selected using stratified
sampling; three strata were identified (large, medium and small markets.) The same
method was used for the selection of the markets for analysis.
Program data was obtained from TMS. Programming was analyzed for a
constructed two-week period. The days comprising this period were randomly selected
from two periods that were determined to be representative of a typical broadcast
schedule. Nineteen data fields were obtained for every program, including the title,
description, duration, airdate and airtime and program type. Program duration and type
were used to calculate the program type diversity indices (HHI and COI) and the total
amount of informational programming provided. These same variables, as well as
program source, were used to calculate the diversity of sources and the quantity of local
informational programming provided.
Descriptive analysis was performed for the station characteristics. In addition,
multiple regression was used to further investigate the relationship between variables.
Regression was also used for the analysis of market conditions.
66
Independent Variables
Variables used to examine the relationship between ownership pattern and
programming output included owner type (independent owner, group owner, or network
owner), station owner’s national reach (if it is part of a station group or network-owned),
whether a station is part of a duopoly, whether a station is locally owned, whether the
station is a network affiliate, and station revenue. All of these variables have been used
in previous research. Table 3-1 contains all station/ownership variables used in the
study. Table 3-2 includes a description as well as the mean and standard deviation of all
variables used in the regression analysis; for categorical variables, the number of
stations in each category is included.
Five variables were included to assess how market forces are related to the
programming offered by local stations, including the total number of stations in the
market, the number of commercial stations, the number of non-commercial stations, the
number of television households and combined market revenue (for all commercial
stations). These variables reflect the intensity of competition in the market; all have
been used in previous research.
A more precise measure of competition, like the HHI, could not be calculated
because not all stations report their revenues to BIA; therefore it was impossible to
determine each station’s share of total advertising revenues. Though the current study
is only concerned with the diversity provided by commercial stations, the number of
non-commercial stations is included because they likely have a strong commitment to
informational programming and their presence may encourage commercial stations to
offer alternative formats (to appeal to a different audience) rather than competing head-
to-head (Napoli, 2004). Table 3-3 contains a list of market variables used in the study.
67
Table 4-4 includes a description, as well as the mean and standard deviation of all
market variables used in the present study.
Operational Definitions
The current study uses the FCC’s definitions of news and public affairs. News
programs are “reports dealing with current local, national and international events,
including weather and stock market reports, and commentary, analysis or sports news
when they are an integral part of a news program” (FCC, 1984, p. 171-172). Public
affairs programs are typically more focused on political and social issues than news
programs, and are defined as those
dealing with local, state, regional, national or international issues or problems, documentaries, mini-documentaries, panels, roundtables and vignettes, and extended coverage (whether live or recorded) of public events or proceedings, such as local council meetings, congressional hearings and the like. (FCC, 1984, p. 172)
While news and public affairs programming are distinct program types, for the
purposes of this study, they are combined under the larger category of informational
programming. These programs are among the primary means through which stations
fulfill their public service obligations; therefore, the amount provided can be used to
assess a station’s commitment to serving the community and supporting democratic
processes.
Following the definition put forth by Alexander and Brown (2004), local owners are
those whose headquarters are located in the station’s DMA. For example, Sinclair
Broadcasting, headquartered in Baltimore, is considered a local owner for its Baltimore
station, WBFF, but not for its Buffalo station, WUTV.
Non-commercial stations are defined as those that do not generate advertising
revenues. Instead, they are funded through viewer donations, government subsidies
68
and corporate underwriting. Commercial stations are those that generate revenue
through advertising.
Sampling of Stations for Ownership Analysis
Selection Criteria
The station sampling frame was a list of all U.S. television stations in BIA’s
database. Satellites (stations retransmitting another station’s signal), dark, non-
commercial (see above definition), religious and low power stations were removed from
the list and not considered in the diversity analysis; digital subchannels were also
excluded. To qualify for inclusion, stations had to be full-power, commercial, non-
religious, primary/main signal U.S. stations. Two hundred forty stations were randomly
selected from the final list.
Non-commercial stations were excluded because their primary mission is public
service. Therefore, it is assumed these stations have a strong commitment to
community interests and provide critical “merit” programming that may not be shown on
commercial stations. Additionally, while these stations offer a meaningful contribution to
diversity, their audiences are generally much smaller than their commercial counterparts
and, thus, their inclusion may suggest more diversity exists than is actually consumed
by viewers. Most importantly, this study examines the influence of competitive
pressures on programming. Public stations operate under a vastly different business
model than commercial stations, receiving government funding and soliciting viewer
donations rather than competing for advertising dollars. As a result, non-commercial
stations, while not entirely isolated, face less pressure to attract the largest audience in
the market (in order to maximize revenue) than their commercial counterparts.
Therefore, comparisons between these very different station types are tenuous at best.
69
Many religious stations (though they hold a commercial license) operate under a similar
model (collecting donations) and, consequently, are also excluded from this study.
Only primary/main signal stations were included because many digital
subchannels do not yet generate meaningful revenues given the relative novelty of
multicasting. In addition, subchannels are not readily available to all viewers (e.g., ADS
subscribers whose providers are not legally required to carry all broadcast feeds).
Moreover, many broadcasters are still experimenting with their subchannels. Many
simply carry the feed from one of the smaller networks like RTV or This TV or provide
24-hour weather, etc. Therefore, it was assumed that using primary signals, which are
actively programmed, would better reflect the impact of ownership and market factors
on the level of diversity provided.
Station Selection
Stations were selected using stratified random sampling. Stratified sampling was
used to ensure adequate representation of relevant variables and that sample selection
is made from a group with similar characteristics (a homogeneous population) (Wimmer
& Dominick, 2006). In the current study, the strata were based on the Designated
Market Areas (DMAs) for the 2009-2010 season defined by The Nielsen Company
(2009). It is important to note that while the programming information was obtained in
during the initial quarter of 2011, the station and market data was for 2009, the most
recent year available at the time of acquisition (Fall 2010). As a result, there is a gap
between these variables and their relationship with the diversity of offerings provided.
While this represents a limitation of the study, the findings should not be discredited
completely but rather viewed with the understanding that any relationships between
market or ownership characteristics and programming tend to remain stable over time
70
and are not likely to vary significantly over a short period of time. For example, while a
station’s revenue or market share or the number of TV households in a market
undoubtedly change from year to year, they should remain relatively consistent; major
shifts would not be expected to occur over a period of a year or two.
The 210 DMAs were divided into 3 similarly sized strata based on market size:
large market stations were defined as those in markets containing 500,000 or more TV
households (DMAs 1-64), mid-market stations were those in markets with 175,000 to
499,999 households (DMAs 65-138) and small market stations were those in markets
with fewer than 175,000 TV households (DMAs 139-210).
Within each stratum, stations were ordered first by market rank, then
alphabetically within each market. For example, New York (DMA 1) stations were
placed ahead of Houston (DMA 10) stations; within New York, WABC was listed ahead
of WCBS and WNBC. All stations were assigned a unique number. Using a random
number generator, eighty stations from each stratum were selected to ensure all market
sizes were equally represented.
The final analysis included 212 stations. Eight of the original 240 stations selected
were excluded because they did not attract a large enough audience to generate
meaningful revenue during 2010 or had gone dark since their selection and were no
longer broadcasting during the dates selected for analysis. Additionally, 20 more were
excluded because they were foreign language stations. These were included in the
sampling frame because they represent true choices, particularly for bilingual viewers
able to switch between English and non-English options. In addition, in some markets,
they account for a substantial proportion of revenue and market share. Therefore,
71
excluding them wouldn’t provide an accurate picture of the market. However, upon
obtaining the data, it was clear that these stations would likely distort the true
relationships between diversity and station/ownership characteristics because, for
reasons discussed below, all programming on these stations was considered to be of a
single type.
Sampling of Markets for Market Analysis
Forty-five DMAs were chosen from Nielsen’s list of 210. As with the
station/ownership analysis, the markets were selected using stratified random sampling.
The strata were once again, large (DMAs 1-64), mid-sized (DMAs 65-138) and small
(DMAs 139-210) markets. To ensure all market sizes were equally represented, fifteen
markets from each stratum were selected using a random number generator.
Programming data was collected for all qualifying stations within each DMA. Criteria for
inclusion were the same as for the individual stations (full-power, commercial, non-
religious, primary/main signal U.S. stations.)
Two U.S. border markets (Laredo, TX and Harlingen-Weslaco-Brownsville-
McAllen, TX) were excluded from analysis because Mexican stations accounted for a
portion of market revenues. A third market, Great Falls, MT, was excluded because it
included multiple dark stations that were not broadcasting during the days selected for
analysis.
Non-English language stations were included in the market-level analysis
because, as discussed above, these stations represent true choices for viewers and
may be major players in the market. Previous research has focused on English
language stations only. Therefore, the present study fills a gap in the literature.
72
Spanish and Asian language programs were considered separate types, but all
programs on these stations were classified as either Spanish or Asian language
regardless of genre. For example, Spanish language news programs and telenovelas
were both considered Spanish programming. The reasons for this approach were
twofold: 1) for simplicity and 2) because the researcher was not as familiar with foreign
language program titles and genres, which made program type verification (discussed
below) problematic. All Asian language programs fell under this broad umbrella
regardless of the specific language spoken; that is, programs in Chinese were treated
the same as those in Korean, Japanese, etc.
Program Sampling
Following the model of Yan and Napoli (2006), Napoli and Yan (2007) and Yan
and Park (2009), station programming schedules were examined for a constructed 14-
day (two-week) period for both the ownership and market analyses. Days comprising
the constructed weeks were selected from two periods: January 21 to February 2, 2011
and March 4 to March 27, 2011. These periods were selected because they were
considered reasonably representative of a typical broadcast schedule. First, they fell in
the heart of the broadcast season, which runs from September to May. In addition, they
fell outside February sweeps (February 3 to March 2, 2011) when stations are likely to
air special programming and/or promotions to maximize audience size. January 25 was
not included in the sampling frame because it was the date of President Obama’s State
of the Union address; given the widespread coverage devoted to this event, its inclusion
likely would have artificially inflated the amount of public affairs programming presented.
Each day during the defined period was assigned a unique number, and 14 days
were selected using a random number generator. Dates selected for analysis were
73
January 21 (Friday), January 24 (Monday), January 26 (Wednesday), January 29
(Saturday), March 4 (Friday), March 7 (Monday), March 9 (Wednesday), March 10
(Thursday), March 13 (Sunday), March 16 (Wednesday), March 18 (Friday), March 22
(Tuesday), March 24 (Thursday) and March 27 (Sunday).
Program schedules were obtained from Tribune Media Services (TMS, 2011).
Nineteen data fields were obtained for every program, including the title, description,
duration, airdate and airtime. Also included was a program type field, which placed
programs in one of over 100 categories (e.g., talk show, daytime soap, sports event,
public affairs, etc.). While direct program coding has advantages over using pre-
established classifications developed by the data provider, the latter approach was
more feasible than obtaining copies of programming from stations nationwide and
“reflects the predominant approach utilized and relied on by policymakers” (Napoli &
Yan, 2007, p.46).
Program-type Categories
The data provider identified 106 program types. Several types were aired only
infrequently (if at all) across all stations and markets. Moreover, though they were
classified as distinct types, several were closely related and differed only slightly from
one another (e.g., motorcycle racing vs. motorsports). Consequently, it could be
predicted that 106 genres would artificially inflate the level of diversity provided,
particularly the COI, which measures the number of unique programs available at any
given time. For example, using all of the types identified, it is possible that in a market
with four stations the COI would also be four even if all the programs aired were
different sporting events or sports-related programs that were classified as unique types
by TMS. Consequently, TMS’ program types were recoded into 39 broad categories
74
with similar characteristics. Each category is mutually exclusive, and every program falls
into only one of the categories.
The literature provided only limited explanation regarding how previous studies
using program types had devised these classifications. Consequently, with the
exception of the informational and public affairs programming categories, which were
based on FCC definitions discussed above, the collapsed categories used within this
study were entirely original. The broad categories were developed by grouping
programs with similar content or themes. For instance, the comedy category includes all
programs that seek to get a laugh from viewers, regardless of whether they are filmed in
a studio (e.g., sitcoms) or in front of a live audience outside a studio (e.g., stand-up
programs.) Similarly, the sports and recreation category includes sporting events and
talk or other programs focusing on athletics, regardless of the particular sport discussed
or shown. A few program types merit further discussion and are defined in greater detail
below.
The legal/criminal justice category includes non-fiction programs related to legal
affairs or crime; examples include America’s Most Wanted or call-in programs where
viewers can discuss legal matters with attorneys. These are distinguished from crime
dramas, which are scripted in nature. This category is also distinct from reality
programs, which are ostensibly nonfiction, but include characterization and story
development resembling scripted programs.
Dramedy includes programs that contain the humorous elements of a comedy and
serious content of a drama. They are a hybrid of two types that cannot be truly classified
as either a drama or a comedy. They may be more serialized than traditional comedies,
75
with greater emphasis devoted to character and storyline development; in addition,
greater emphasis may be placed on character backstories.
The children’s category includes programs produced specifically for children; this
may include movies and dramas targeted at children as well as cartoons. This also
includes educational programs for children.
The educational category includes programs intended to inform or instruct. It is
distinguished from the instructional category in that it tends to be of a formal academic
nature, while the latter tends to focus on soft skills.
The community category includes entertainment programs produced by
community members (e.g., local variety shows.) The entertainment focus is what
distinguishes these programs from public affairs programming, which are intended to
inform.
Certainly, these classifications are somewhat subjective and the same types could
have been collapsed a number of other ways. However, the approach used in this study
attempted to balance the differences between programs while recognizing the
similarities within them in order to practically quantify diversity.
Table 3-3 includes a full list of the collapsed categories and the original types
comprising them; it also contains each type’s mean proportion of total programming
minutes for both the station and market analyses.
The collapsed classifications were used in combination with program duration to
calculate two of the dependent variables in the study: level of diversity and amount of
informational programming provided by each station/market over the two-week period.
Tribune also provided a program origination field, which was used to determine the third
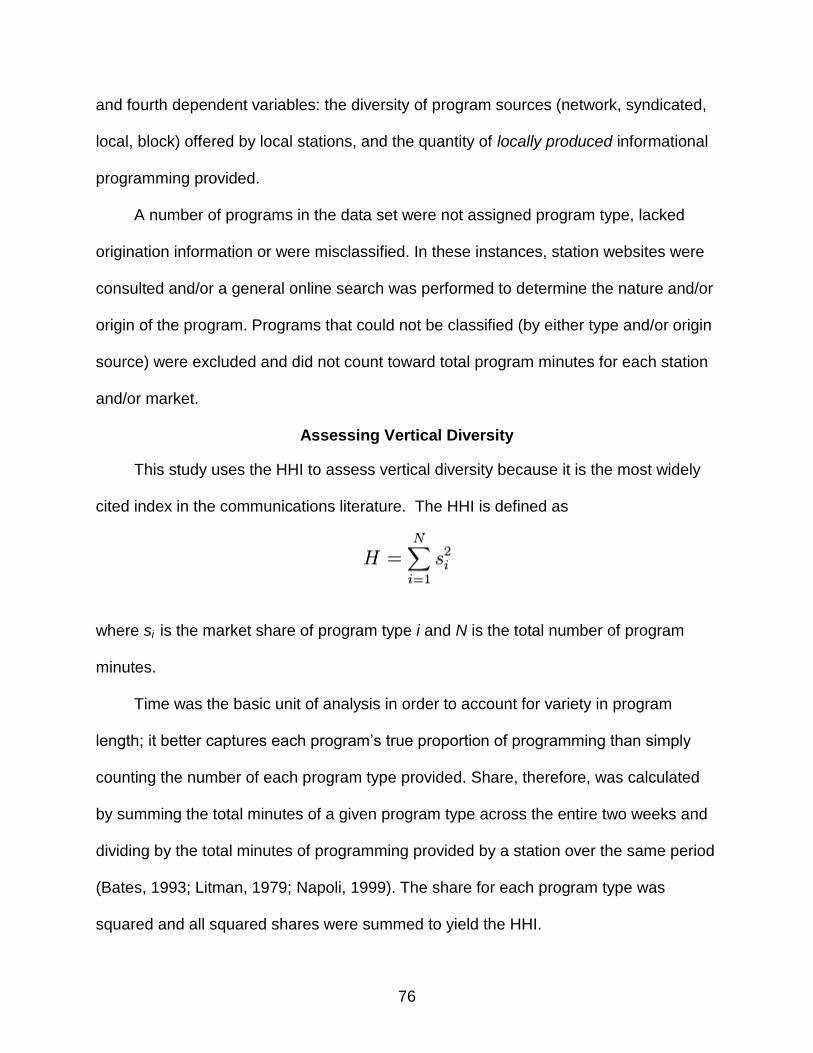
76
and fourth dependent variables: the diversity of program sources (network, syndicated,
local, block) offered by local stations, and the quantity of locally produced informational
programming provided.
A number of programs in the data set were not assigned program type, lacked
origination information or were misclassified. In these instances, station websites were
consulted and/or a general online search was performed to determine the nature and/or
origin of the program. Programs that could not be classified (by either type and/or origin
source) were excluded and did not count toward total program minutes for each station
and/or market.
Assessing Vertical Diversity
This study uses the HHI to assess vertical diversity because it is the most widely
cited index in the communications literature. The HHI is defined as
where si is the market share of program type i and N is the total number of program
minutes.
Time was the basic unit of analysis in order to account for variety in program
length; it better captures each program’s true proportion of programming than simply
counting the number of each program type provided. Share, therefore, was calculated
by summing the total minutes of a given program type across the entire two weeks and
dividing by the total minutes of programming provided by a station over the same period
(Bates, 1993; Litman, 1979; Napoli, 1999). The share for each program type was
squared and all squared shares were summed to yield the HHI.
77
HHI scores can range from zero, where each program type’s share is infinitely
small, to 10,000, where a single type accounts for 100% of all programming (Noam,
2009). The following guide to interpreting scores is typically applied to media markets,
but has been adapted for program types. Scores below 100 indicate highly diverse
programming; between 100-1000, diverse programming; and above 1,800, highly
concentrated programming (low diversity). If the index falls between 1000 and 1800,
programming is moderately diverse (based on Baseman & Owen, 1982). Bates (1993)
suggests that because media markets tend to fall within the latter level, greater
discrimination among categories is needed. This also holds true for program types.
Therefore, scores between 1800 and 2750 indicate high concentration (low diversity),
while indices greater than 2750 reflect very high concentration (very low diversity)
(based on Bates, 1993).
The index score and program type diversity are inversely related; HHI rises as
program types become more concentrated and declines as they become more diverse
(Litman, 1979). The index for each station was regressed against ownership
characteristics to determine the strength of the relationship between variables.
Assessing Horizontal Diversity
Following the model of Hellman (2001), both the HHI and Choice Option Index
were used to measure horizontal diversity. For both measures, program data were
collected for all qualifying stations in the 42 selected DMAs for the 14 days comprising
the constructed 2-week sampling period.
To calculate the Choice Option Index, the number of distinct program types
provided across all stations for each 15 minute period for the entire day (12 am to
11:59:59 pm) was counted. For example, if there were three stations in a market and all
78
aired a comedy during a given 15 minute interval, the number of distinct program types
was 1; if the stations offered a comedy, drama, and reality program, respectively, the
number was 3. The count for every interval for 14 days was summed and divided by the
total number of intervals to obtain an average measure of diversity. Perfect imitation (all
stations present the exact same program type) yields a score of 1, while the score for
perfect diversity is equal to the number of stations in the market (in a market with 3
stations, a 3 represents perfect diversity; in a market with 15 stations, 15 would indicate
perfect diversity) (Einstein, 2002, 2004; Hellman, 2001; Levin, 1980; Oba, 2004).
HHI was used to measure the breadth of programming provided by the market.
Share was calculated by summing the total minutes of each program type provided by
all stations in the market over the entire two weeks and dividing by the total minutes of
programming provided. The horizontal indices for each market were regressed against
market characteristics to determine the strength of the relationship between variables.
Assessing Public Service
While the availability of diverse programming options is valuable to consumers and
arguably furthers the public interest, it does not ensure provision of the most important
programs like news and public affairs that directly contribute to an active marketplace of
ideas. As Levin (1980) points out, “Rising levels of vertical (or horizontal) diversity need
not necessarily imply greater access to so-called merit programming” (p.60). Therefore,
this study devoted particular attention to the relationship between station ownership,
market structure and the provision of informational programming by local TV stations. It
further distinguishes between news and public affairs from any source and those that
are locally produced. Network provided programming may be a key (perhaps, the only)
source of informational programming for many stations; while valuable, of greater
79
importance to the local marketplace of ideas is the provision of news and public affairs
that is locally produced and focuses on the needs and interests of the community. In
addition, different factors may affect the provision of any news / public affairs
programming and the provision of locally produced news / public affairs programming.
Consequently, both are included in the current study.
Quantity of informational programming provided was calculated by summing the
total minutes of news and/or public affairs programming aired across all 14 days. For
market analysis, the total minutes provided by all stations in the market were summed.
The quantity of local informational programming provided was derived using the
program type and source classifications provided by TMS. Programs that were identified
as news or public affairs and were locally produced were counted in the analysis.
Multiple regression was used to estimate the effects of market competition and
station ownership characteristics on the quantity of informational programming provided.
In addition, t-tests and a one-way ANOVA were used to examine how ownership
impacts the amount of informational programming provided.
Assessing Localism (Program Origination)
As touched on above, locally produced programs (of any genre) are assumed to
further the goal of localism better than those from a distant source. Consequently,
program origination was examined to assess how market and ownership structure
impact localism.
Program origination was analyzed at both the station and market level using the
HHI. Programs were classified as being of network, syndicated, block or local
origination. A Block is used in conjunction with regional sports coverage and occurs
when a source (FOX, CBS, etc.) has the option to carry multiple team vs. team events

80
that would occupy the same timeslot; the matchup aired depends on the region. These
programs could be either network or syndicated programs and were thus distinguished
as a separate program source.
Share of schedule devoted to each of the four sources was calculated by summing
the total minutes of each type provided across the entire two weeks and dividing by the
total minutes of programming provided on that station. For the system level analysis,
share was calculated by summing total minutes of each type provided by all stations in
the market over the 14 days and dividing by the total minutes of programming provided
by all stations. Regression analysis was used to estimate the effects of market
competition and station ownership characteristics on the program origin diversity index.
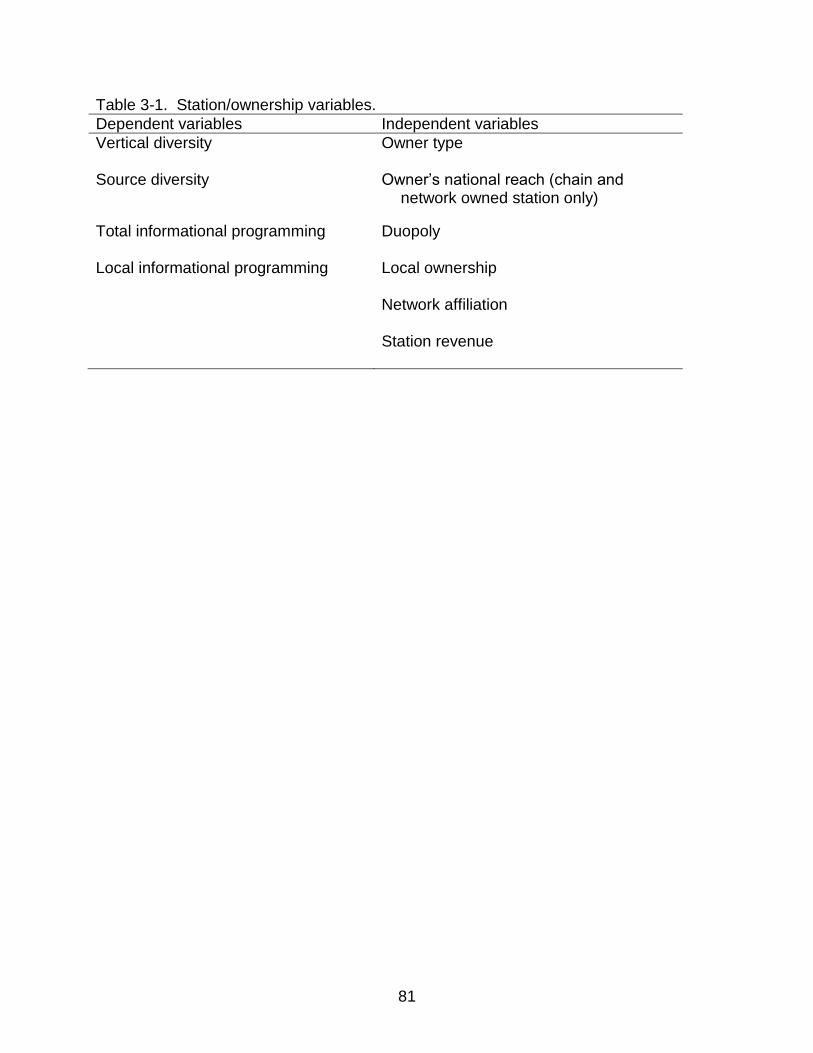
81
Table 3-1. Station/ownership variables.
Dependent variables Independent variables
Vertical diversity Owner type
Source diversity Owner’s national reach (chain and network owned station only)
Total informational programming Duopoly
Local informational programming Local ownership
Network affiliation
Station revenue
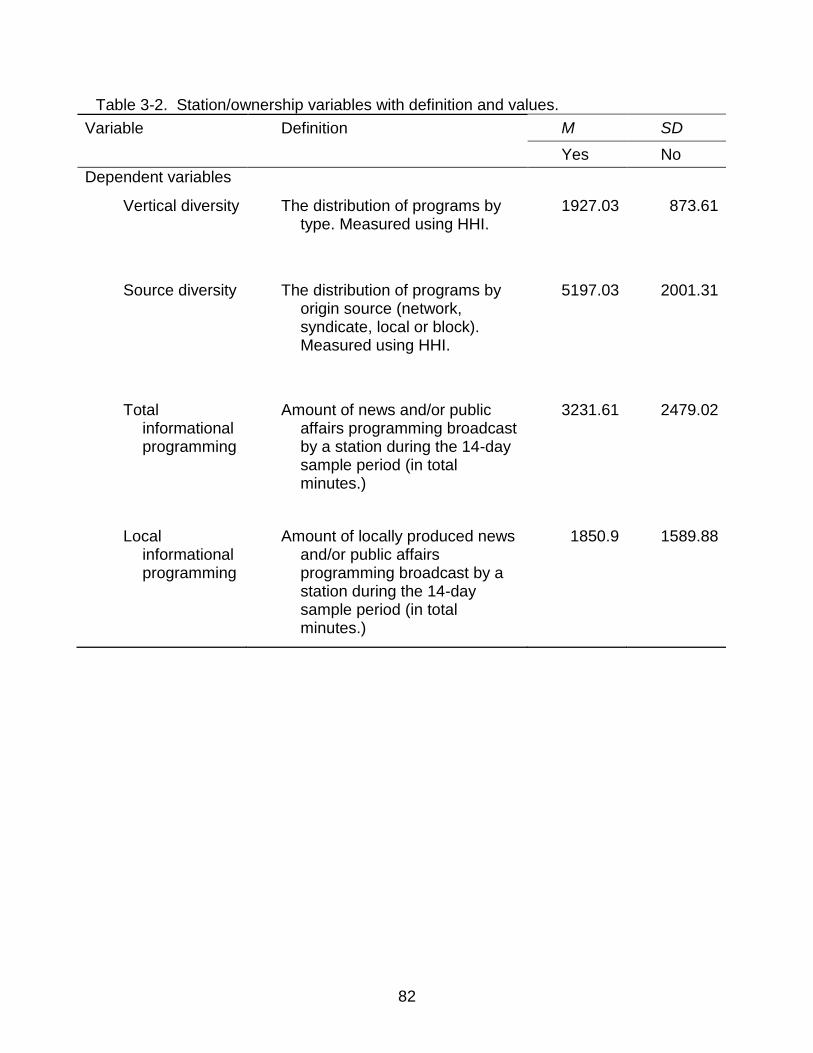
82
Table 3-2. Station/ownership variables with definition and values.
Variable Definition M SD
Yes No
Dependent variables
Vertical diversity The distribution of programs by type. Measured using HHI.
1927.03 873.61
Source diversity The distribution of programs by origin source (network, syndicate, local or block). Measured using HHI.
5197.03 2001.31
Total informational programming
Amount of news and/or public affairs programming broadcast by a station during the 14-day sample period (in total minutes.)
3231.61 2479.02
Local informational programming
Amount of locally produced news and/or public affairs programming broadcast by a station during the 14-day sample period (in total minutes.)
1850.9 1589.88
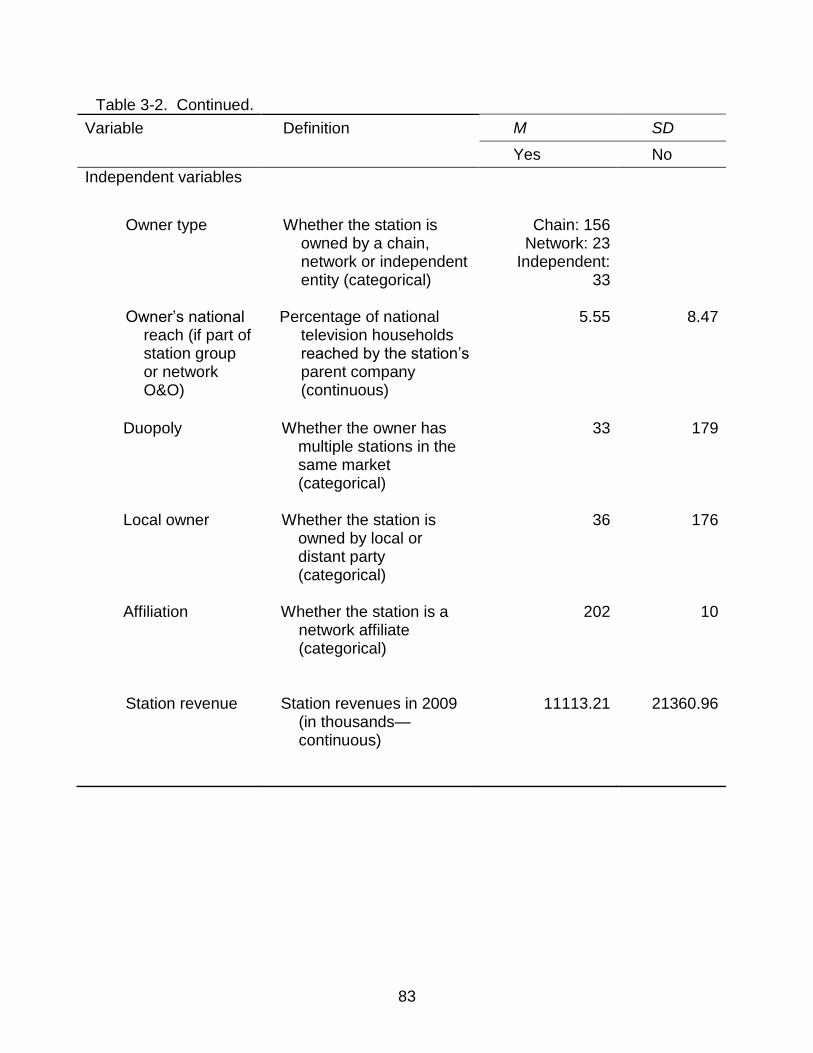
83
Table 3-2. Continued.
Variable Definition M SD
Yes No
Independent variables
Owner type Whether the station is owned by a chain, network or independent entity (categorical)
Chain: 156 Network: 23
Independent: 33
Owner’s national reach (if part of station group or network O&O)
Percentage of national television households reached by the station’s parent company (continuous)
5.55 8.47
Duopoly Whether the owner has multiple stations in the same market (categorical)
33 179
Local owner Whether the station is owned by local or distant party (categorical)
36 176
Affiliation Whether the station is a network affiliate (categorical)
202 10
Station revenue Station revenues in 2009 (in thousands— continuous)
11113.21 21360.96
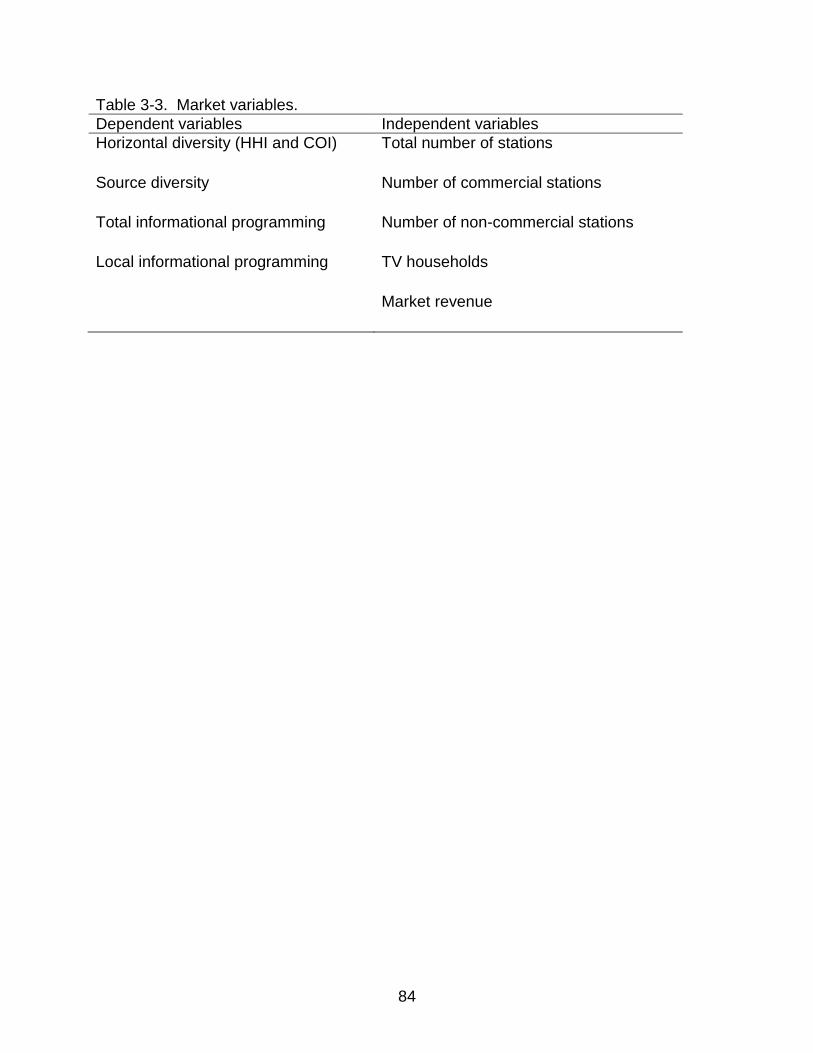
84
Table 3-3. Market variables.
Dependent variables Independent variables
Horizontal diversity (HHI and COI) Total number of stations
Source diversity Number of commercial stations
Total informational programming Number of non-commercial stations
Local informational programming TV households
Market revenue
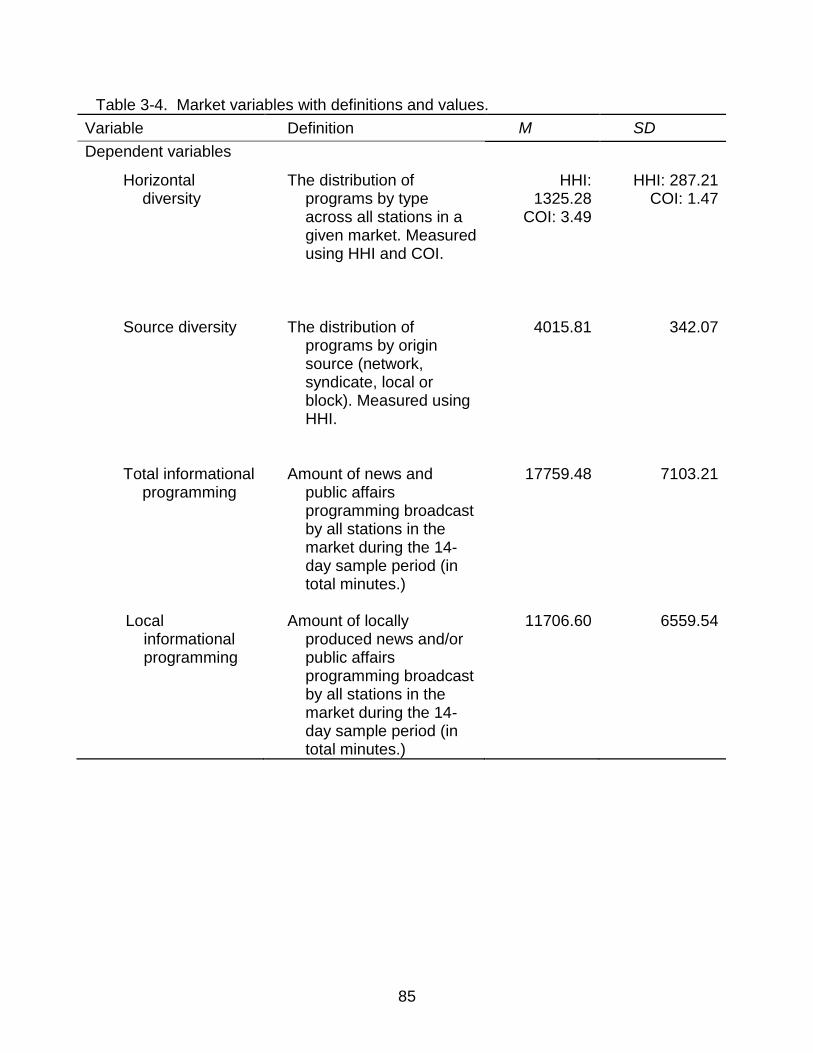
85
Table 3-4. Market variables with definitions and values.
Variable Definition M SD
Dependent variables
Horizontal diversity
The distribution of programs by type across all stations in a given market. Measured using HHI and COI.
HHI: 1325.28
COI: 3.49
HHI: 287.21 COI: 1.47
Source diversity The distribution of programs by origin source (network, syndicate, local or block). Measured using HHI.
4015.81 342.07
Total informational programming
Amount of news and public affairs programming broadcast by all stations in the market during the 14-day sample period (in total minutes.)
17759.48 7103.21
Local informational programming
Amount of locally produced news and/or public affairs programming broadcast by all stations in the market during the 14-day sample period (in total minutes.)
11706.60 6559.54
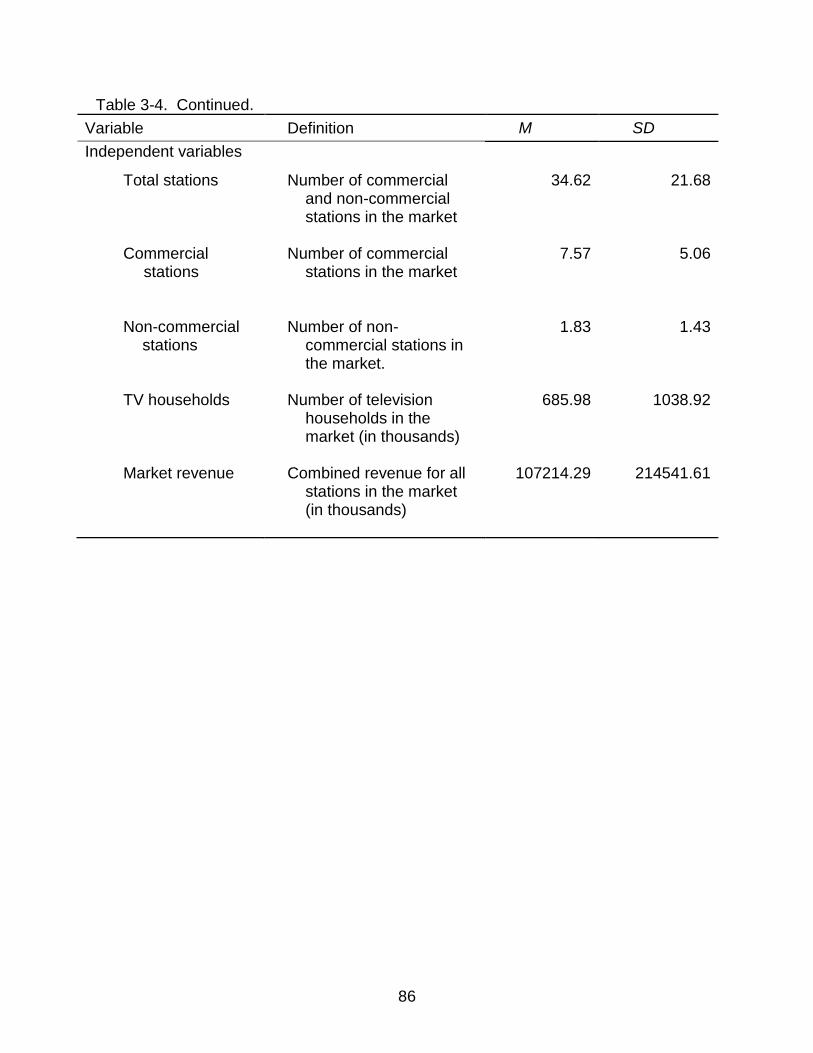
86
Table 3-4. Continued.
Variable Definition M SD
Independent variables
Total stations Number of commercial and non-commercial stations in the market
34.62 21.68
Commercial stations
Number of commercial stations in the market
7.57 5.06
Non-commercial stations
Number of non-commercial stations in the market.
1.83 1.43
TV households Number of television households in the market (in thousands)
685.98 1038.92
Market revenue Combined revenue for all stations in the market (in thousands)
107214.29 214541.61
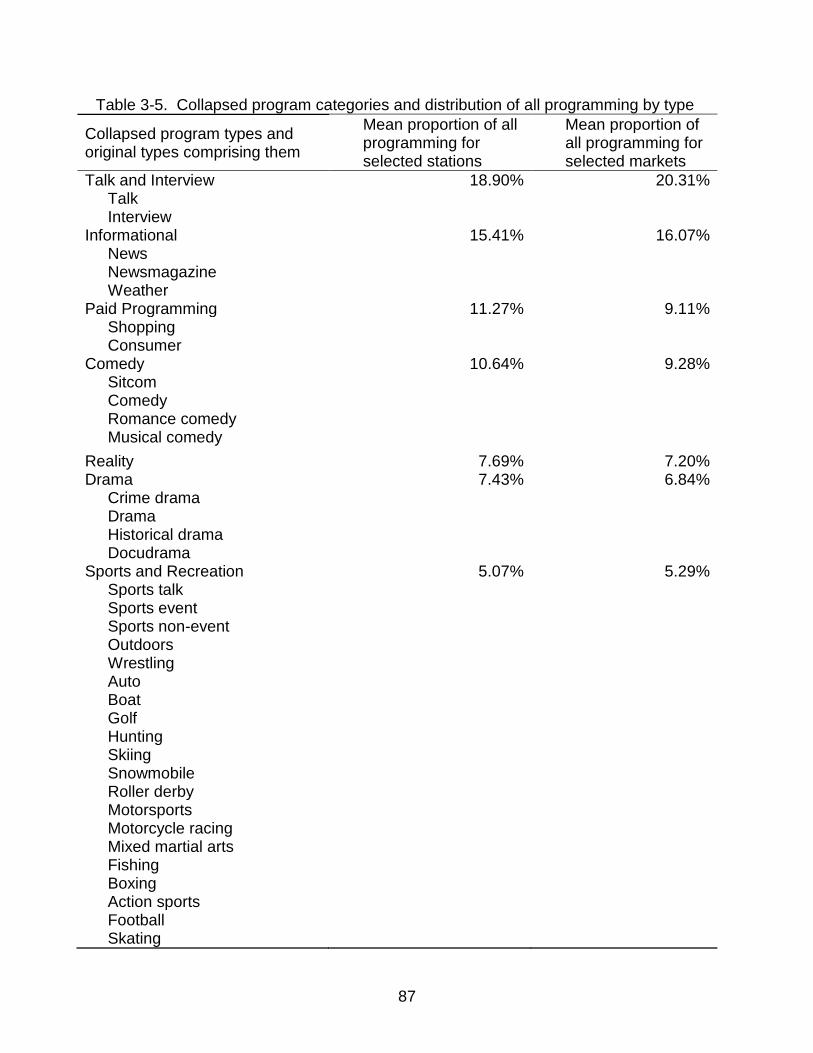
87
Table 3-5. Collapsed program categories and distribution of all programming by type
Collapsed program types and original types comprising them
Mean proportion of all programming for selected stations
Mean proportion of all programming for selected markets
Talk and Interview 18.90% 20.31% Talk Interview
Informational 15.41% 16.07% News Newsmagazine Weather
Paid Programming 11.27% 9.11% Shopping Consumer
Comedy 10.64% 9.28% Sitcom Comedy Romance comedy Musical comedy
Reality 7.69% 7.20% Drama 7.43% 6.84%
Crime drama Drama Historical drama Docudrama
Sports and Recreation 5.07% 5.29% Sports talk Sports event Sports non-event Outdoors Wrestling Auto Boat Golf Hunting Skiing Snowmobile Roller derby Motorsports Motorcycle racing Mixed martial arts Fishing Boxing Action sports Football Skating
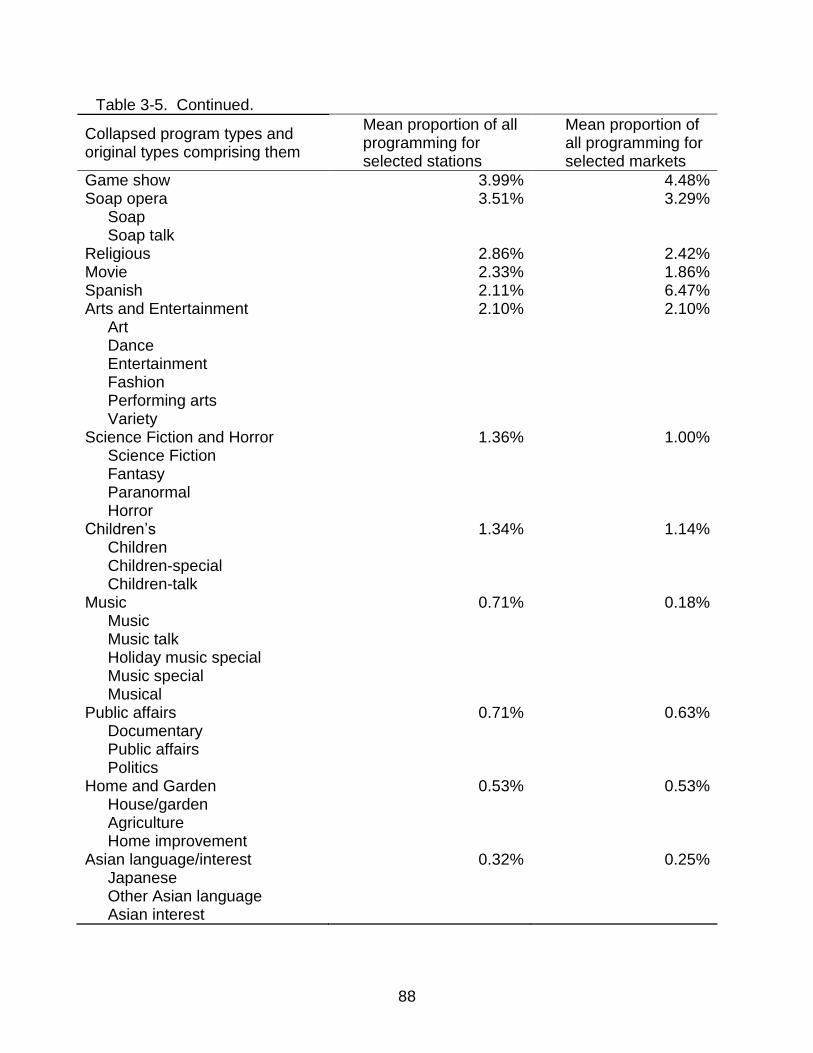
88
Table 3-5. Continued.
Collapsed program types and original types comprising them
Mean proportion of all programming for selected stations
Mean proportion of all programming for selected markets
Game show 3.99% 4.48% Soap opera 3.51% 3.29%
Soap Soap talk
Religious 2.86% 2.42% Movie 2.33% 1.86% Spanish 2.11% 6.47% Arts and Entertainment 2.10% 2.10%
Art Dance Entertainment Fashion Performing arts Variety
Science Fiction and Horror 1.36% 1.00% Science Fiction Fantasy Paranormal Horror
Children’s 1.34% 1.14% Children Children-special Children-talk
Music 0.71% 0.18% Music Music talk Holiday music special Music special Musical
Public affairs 0.71% 0.63% Documentary Public affairs Politics
Home and Garden 0.53% 0.53% House/garden Agriculture Home improvement
Asian language/interest 0.32% 0.25% Japanese Other Asian language Asian interest
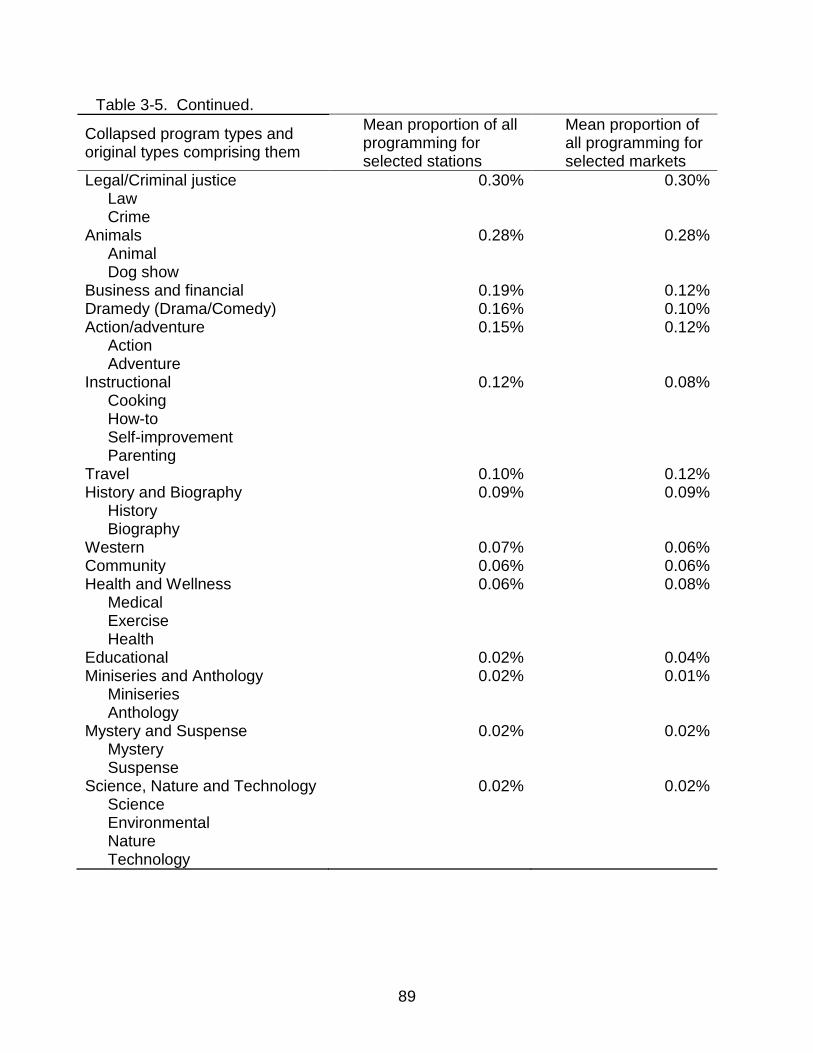
89
Table 3-5. Continued.
Collapsed program types and original types comprising them
Mean proportion of all programming for selected stations
Mean proportion of all programming for selected markets
Legal/Criminal justice 0.30% 0.30% Law Crime
Animals 0.28% 0.28% Animal Dog show
Business and financial 0.19% 0.12% Dramedy (Drama/Comedy) 0.16% 0.10% Action/adventure 0.15% 0.12%
Action Adventure
Instructional 0.12% 0.08% Cooking How-to Self-improvement Parenting
Travel 0.10% 0.12% History and Biography 0.09% 0.09%
History Biography
Western 0.07% 0.06% Community 0.06% 0.06% Health and Wellness 0.06% 0.08%
Medical Exercise Health
Educational 0.02% 0.04% Miniseries and Anthology 0.02% 0.01%
Miniseries Anthology
Mystery and Suspense 0.02% 0.02% Mystery Suspense
Science, Nature and Technology 0.02% 0.02% Science Environmental Nature Technology
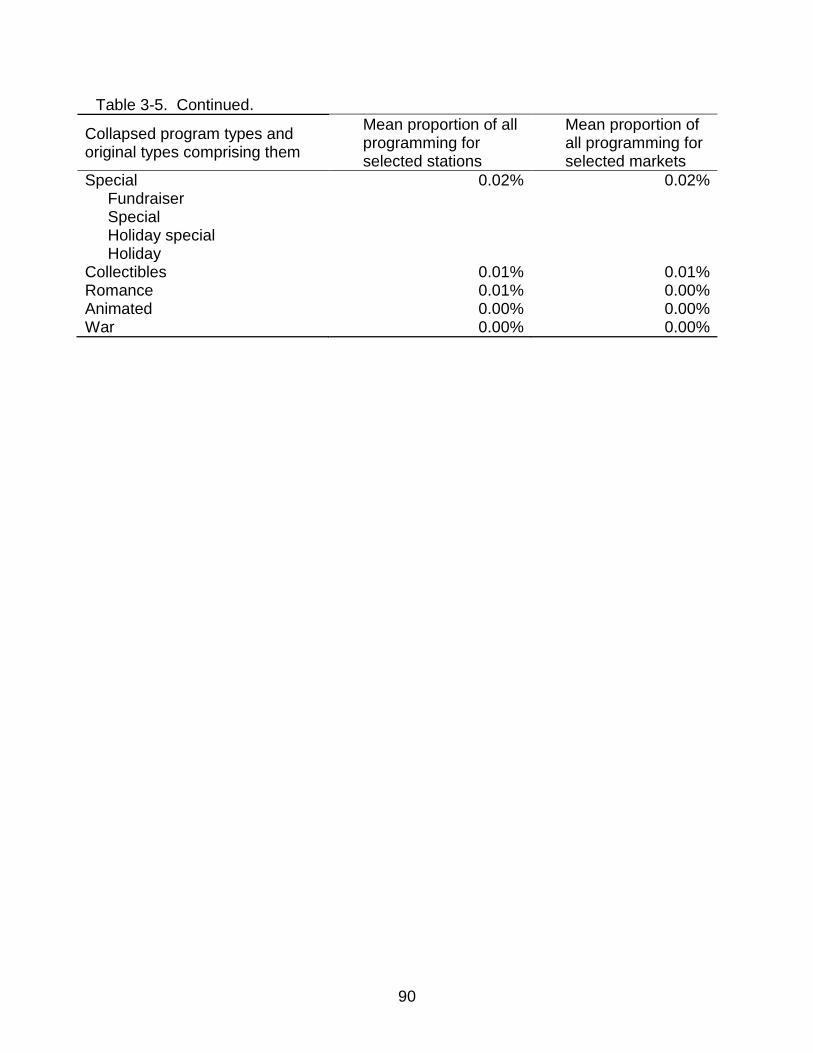
90
Table 3-5. Continued.
Collapsed program types and original types comprising them
Mean proportion of all programming for selected stations
Mean proportion of all programming for selected markets
Special 0.02% 0.02% Fundraiser Special Holiday special Holiday
Collectibles 0.01% 0.01% Romance 0.01% 0.00% Animated 0.00% 0.00% War 0.00% 0.00%
91
CHAPTER 4 RESULTS
Regression Results — Station Characteristics
This section provides results of regression analyses that estimate how ownership
characteristics are related to programming diversity and the amount of informational
programming provided by a station.
The enter method was used for all analyses. For the evaluation of station
characteristics, owner type was a categorical variable with three levels (chain, network
or independent); consequently, a dummy variable was used. Tolerance statistics and
correlation coefficients indicated no significant multicollinearity problems among the
independent variables. Analysis did reveal violations of the normality assumption.
Consequently, transformation was imposed on selected variables in the data set; when
transformation alone did not produce normality, outliers were also omitted. Data were
defined as normally distributed when skewness and kurtosis were in the +/- 1 range.
When transformation was performed (noted in the text), the natural log was used.
Vertical Program Type Diversity
Thirteen cases were removed in order to normalize the data. A significant
regression equation was found (F(7,191) = 49.102, p < .001), with an R2 of .643.
The station owner’s national household reach had a significant negative
relationship with program type diversity1, while network affiliation and duopoly status
were positively related to diversity. Programming on stations that were part of a group
that reached a large national audience (owner reach) was concentrated into a handful of
1 Note that the HHI is a measure of program type concentration. Therefore, positive values indicate
increasing concentration and decreasing diversity. Alternatively, negative values indicate increasing diversity.
92
types, while network affiliates and duopoly stations offered a greater mix of program
types.
An examination of beta coefficients indicates that network affiliation (β = .7711)
and the station owner’s national reach (β = .431) are the most important explanatory
factors; duopoly status has relatively weak explanatory power (β = -.147). Owner type,
owner location and station revenue were not significant predictors in this model. A
summary of the regression model is presented in Tables 4-1 and 4-2.
Diversity of Programming Sources
Regression results indicate an overall model of three variables (chain ownership,
duopoly status and station revenue) that significantly predict the diversity of
programming sources provided (F(7,204) = 5.702, p < .001). This model accounted for
16.4% of variation in source diversity (R2 = .164, see Table 4-3).
Chain ownership and station revenue are positively related to source diversity.
Chain owned stations offered programming from a larger variety of sources than
independents, and stations that generated higher revenue in 2009 also broadcast
programs from a greater variety of sources (see Table 4-4). These findings underscore
the importance of stations’ financial resources to the provision of programming from a
variety of sources.
While duopoly status is positively related to the diversity of program types
provided, it is negatively related to source diversity. That is, duopoly stations offer a
more diverse programming mix, but the programs aired come from fewer sources.
Network ownership, owner location, owner reach and network affiliation were not
significant predictors. A summary of the regression model is presented in Tables 4-3
and 4-4.
93
Total Informational Programming Provided
Owner reach and station revenue were transformed. A significant regression
model was found (F(7,204) = 23.414, p < .001), with an R2 of .445 (see Table 4-5).
There was a significant negative relationship between the station owner’s national
reach and minutes of news and/or public affairs programming (see Table 4-6). Duopoly
ownership was also negatively related to the provision of informational programming.
This is consistent with the findings of Napoli and Yan (2007). Taken together, these
findings challenge the logic that has driven the relaxation of national and multiple
ownerships limits: that large group owners would exploit economies of scale to facilitate
greater production of informational programming. It is striking to note, however, that
network affiliation is positively related to the provision of informational programming.
Overall, the most powerful predictor of the provision of informational programming
is station revenue, which was positively related to the dependent variable (β = .671).
Owner type and location were not significant predictors in this model.
Local Informational Programming Provided
A significant regression model was found (F(7,204) = 12.220, p < .001), with an R2
of .295. Among the independent variables, only chain ownership and station revenue
were significant predictors of the amount of local informational programming provided
by local stations. Both were positively related to local news and/or public affairs
programming minutes.
Once again, station revenue has the greatest predictive power (β = .531). None of
the remaining station variables (network ownership, owner location, owner reach,
duopoly status and network affiliation) were significantly related to local informational
programming minutes. Full regression results are presented in Tables 4-7 and 4-8.
94
A summary of all the findings related to ownership characteristics is presented in
Table 4-9.
Descriptive Statistics: Station Variables
The majority of programming for the selected stations (56.22%) fell into four
categories: talk and interview, informational, paid programming and comedy. Moreover,
the top seven types accounted for more than three-quarters (76.41%) of all
programming provided by local stations. While these ratios suggest programming is not
particularly diverse, the HHI score of 1030.99 suggests programming is only moderately
concentrated (Baseman & Owen, 1982). It should be noted, however, that these
proportions are for all stations taken together; there are differences in the level of
diversity provided across individual stations. Average program type diversity for the
sample stations during the sample period was 1927, indicating high concentration.
Moreover, the large standard deviation (873.61) indicates a wide range of diversity
among the stations.
One of the research questions asks how station ownership influences the amount
of informational programming provided by stations. On the aggregate level,
informational programming is second in terms of total minutes provided; however, as
noted above, individual differences exist between stations. These differences are
reflected in the results of the regression analysis.
Total Informational Programming
Of the 212 stations sampled, 185 (87.3%) broadcast at least one minute of
informational programming during the sample period. On average, the stations 3231.61
minutes of this programming during the constructed period.
95
A greater proportion of chain owned stations (89.1%) aired informational
programming than network (87%) or independently owned (78.8%) stations, though
these differences were not tested for statistical significance. The amount of
informational programming provided by the three owner types (chain, network,
independent) was compared using a one-way ANOVA. A significant difference was
found among owners (F(2,209) = 9.43, p <.001). Tukey’s HSD was used to determine
the nature of the differences. This analysis revealed that stations that were part of a
chain aired more informational programming (m = 3657.81, sd = 2414.83) than network
(m = 2042.22, sd = 2584.88) or independently (m = 2045.85, sd = 2080.94) owned
stations. O&O and independent stations were not significantly different from one
another.
Non-duopoly stations (88.3%) were more likely to air informational programming
than stations that are part of a duopoly (81.8%), but these differences were not tested
for statistical significance. An independent samples t test was conducted to compare the
mean minutes of informational programming broadcast by duopoly and non-duopoly
stations. The latter broadcast more news and/or public affairs programming (m =
3321.80, sd = 2436.35) than their counterparts (m = 2742.42, sd = 2685.47), but the
differences were not statistically significant (t(210) = 1.24, p > .05).
Among the 36 locally owned stations in the sample, 28 (77.8%) aired some news
and/or public affairs programming. In contrast, 157 of the 176 (89.2%) non-locally
owned stations broadcast informational programming during the sample period.
However, a t test revealed no significant difference in the amount of news and local
affairs programming broadcast by locally and non-locally owned stations (t(210) = -.466,
96
p > .05); the mean minutes aired by stations owned by a local entity (m = 3407.50, sd =
2522.23) did not significantly differ from the amount provided by stations owned by a
distant party (m = 3195.64, sd = 2475.83).
A greater proportion of network affiliated stations (88.1%) aired informational
programming than independent stations (70.0%). Affiliates also aired significantly more
of this programming, broadcasting more than 3300 minutes (m = 3322.24, sd =
2475.49) of informational programming, compared to independents’ average of 1400
minutes (m = 1401.00, sd = 1819.46), (t(210) = -2.42, p < .05).
Local Informational Programming
Of the 212 stations sampled, 174 (82.1%) broadcast at least one minute of local
informational programming during the sample period. On average, the stations in the
full sample aired 1850.90 minutes of this programming during the constructed period.
A greater proportion of network O&Os (82.6%) aired informational programming
than chain (84.6%) or independently owned (69.7%) stations. The amount of local
informational programming provided by these owner types was compared using a one-
way ANOVA. A significant difference was found among owners (F(2,209) = 6.11, p <
.01). Stations that were part of a chain broadcast more informational programming (m =
2049.40, sd = 1511.91) than independently (m = 1020.48, sd = 1207.42) owned
stations. O&O stations (m = 1696.00, sd = 2163.08) were not significantly different from
either of the other two groups.
Among the 33 stations that are part of a duopoly, 25 (75.8%) aired some local
news and/or public affairs programming. In contrast, 149 of the 179 (83.2%) non-
duopoly stations broadcast local informational programming during the sample period.
In addition, during the two-week sample period, duopoly stations (m = 1886.91, sd =
97
1912.71) aired slightly more local informational programming than their non-duopoly
counterparts (m = 1844.26, sd = 1529.17). The difference, however, was not statistically
significant (t(210) = -.141, p > .05).
A greater proportion of non-locally owned stations (84.1%) aired local news and/or
public affairs programming than their locally owned counterparts (72.2%). However, on
average, locally owned stations provided more minutes of local informational
programming (m = 2077.64, sd = 1747.84) than those owned by a distant entity (m =
1804.52, sd = 1556.92). The difference was not statistically significant (t(210) = -0.939,
p > .05).
A greater proportion of network-affiliated stations (82.7%) aired local informational
programming than independent stations (70.0%). No significant difference was found in
terms of the amount of local news and/or public affairs programming provided by
network affiliates (m = 1876.14, sd = 1582.64) and independent stations (m = 1341.00,
sd = 1737.49) (t(210) = -1.04, p > .05).
While such descriptive analyses provide insight into the relationship between
ownership variables and provision of informational programming, they should be
interpreted with caution as other variables may mediate these relationships.
Consequently, multivariate analysis was conducted to further investigate the
relationship between ownership variables and the provision of informational
programming.
Regression Results: Market Characteristics
Multiple regression was conducted to determine which market characteristics
(number of TV households, total number of stations in the market, number of
commercial stations, number of non-commercial stations and market revenue) were
98
predictors of five dependent variables measuring program type and source diversity as
well as the provision of informational programming. The enter method was used for all
analyses.
Tolerance statistics and correlation coefficients indicated a mutlicollinearity
problem; the number of TV households and market revenue were strongly related.
Consequently, market revenue was removed from the analysis for two reasons. First,
more recent data was available for TV households. In addition, while the analysis
focused on market level trends, the true concern was the programming provided by the
individual stations within the market; therefore, it was believed that the potential
audience for any given program was more directly related to station programming
strategies than overall market revenue.
The normality assumption was violated in all analyses. Consequently, logarithmic
transformation was imposed on all independent variables in the data set; when
transformation alone did not yield normality, outliers were also removed.
Program Type Diversity (HHI)
Two cases were removed in order to normalize the data. A significant regression
model was found (F(4,35) = 3.718, p < .05), with an R2 of .298. However, none of the
independent variables were significant predictors of the level of vertical program
diversity provided by all stations in the market. A summary of the regression model is
presented in Tables 4-12 and 4-13.
Horizontal Program Type Diversity (COI)
Regression results indicate an overall model of two variables (TV households and
number of commercial stations) that significantly predict the breadth of program type
diversity provided across stations (F(4,37) = 45.489, p < .001). This model accounted
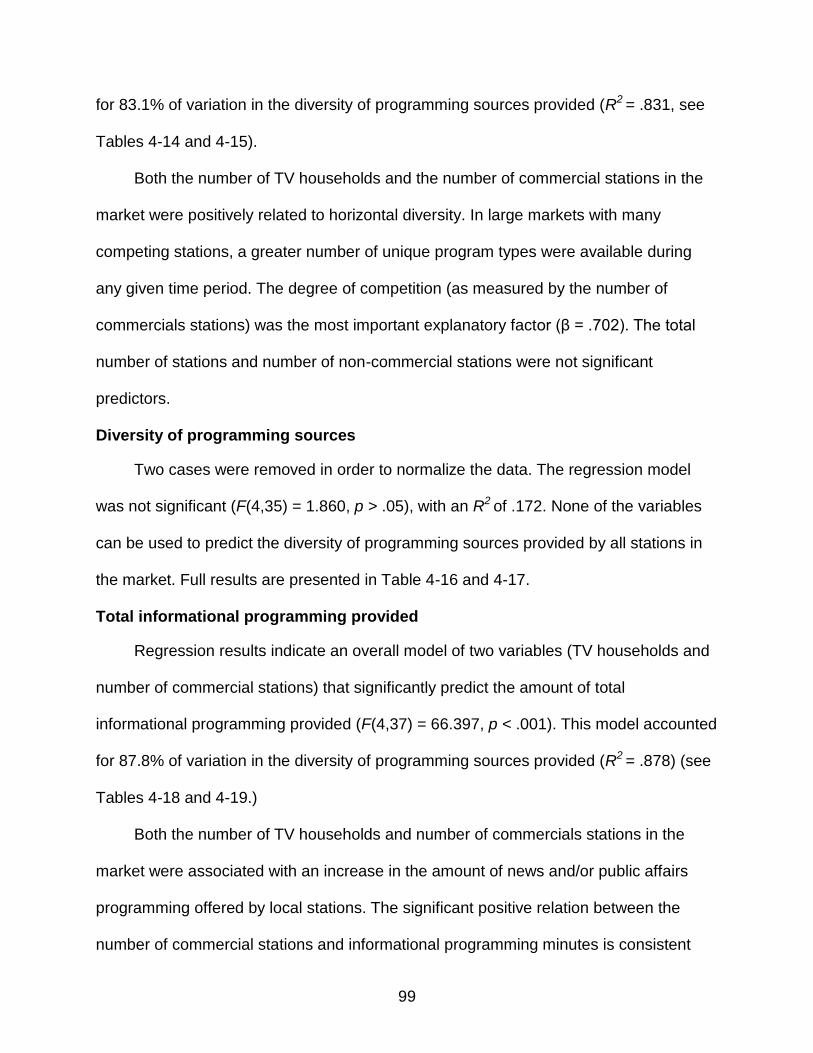
99
for 83.1% of variation in the diversity of programming sources provided (R2 = .831, see
Tables 4-14 and 4-15).
Both the number of TV households and the number of commercial stations in the
market were positively related to horizontal diversity. In large markets with many
competing stations, a greater number of unique program types were available during
any given time period. The degree of competition (as measured by the number of
commercials stations) was the most important explanatory factor (β = .702). The total
number of stations and number of non-commercial stations were not significant
predictors.
Diversity of programming sources
Two cases were removed in order to normalize the data. The regression model
was not significant (F(4,35) = 1.860, p > .05), with an R2 of .172. None of the variables
can be used to predict the diversity of programming sources provided by all stations in
the market. Full results are presented in Table 4-16 and 4-17.
Total informational programming provided
Regression results indicate an overall model of two variables (TV households and
number of commercial stations) that significantly predict the amount of total
informational programming provided (F(4,37) = 66.397, p < .001). This model accounted
for 87.8% of variation in the diversity of programming sources provided (R2 = .878) (see
Tables 4-18 and 4-19.)
Both the number of TV households and number of commercials stations in the
market were associated with an increase in the amount of news and/or public affairs
programming offered by local stations. The significant positive relation between the
number of commercial stations and informational programming minutes is consistent
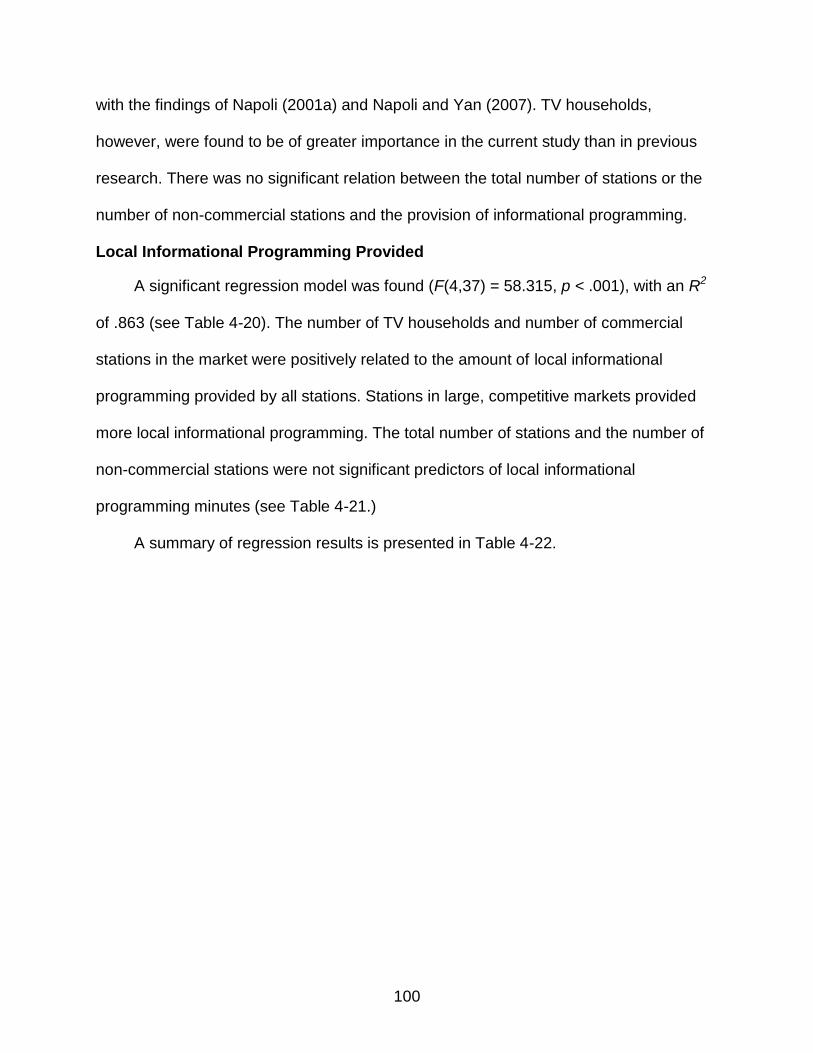
100
with the findings of Napoli (2001a) and Napoli and Yan (2007). TV households,
however, were found to be of greater importance in the current study than in previous
research. There was no significant relation between the total number of stations or the
number of non-commercial stations and the provision of informational programming.
Local Informational Programming Provided
A significant regression model was found (F(4,37) = 58.315, p < .001), with an R2
of .863 (see Table 4-20). The number of TV households and number of commercial
stations in the market were positively related to the amount of local informational
programming provided by all stations. Stations in large, competitive markets provided
more local informational programming. The total number of stations and the number of
non-commercial stations were not significant predictors of local informational
programming minutes (see Table 4-21.)
A summary of regression results is presented in Table 4-22.
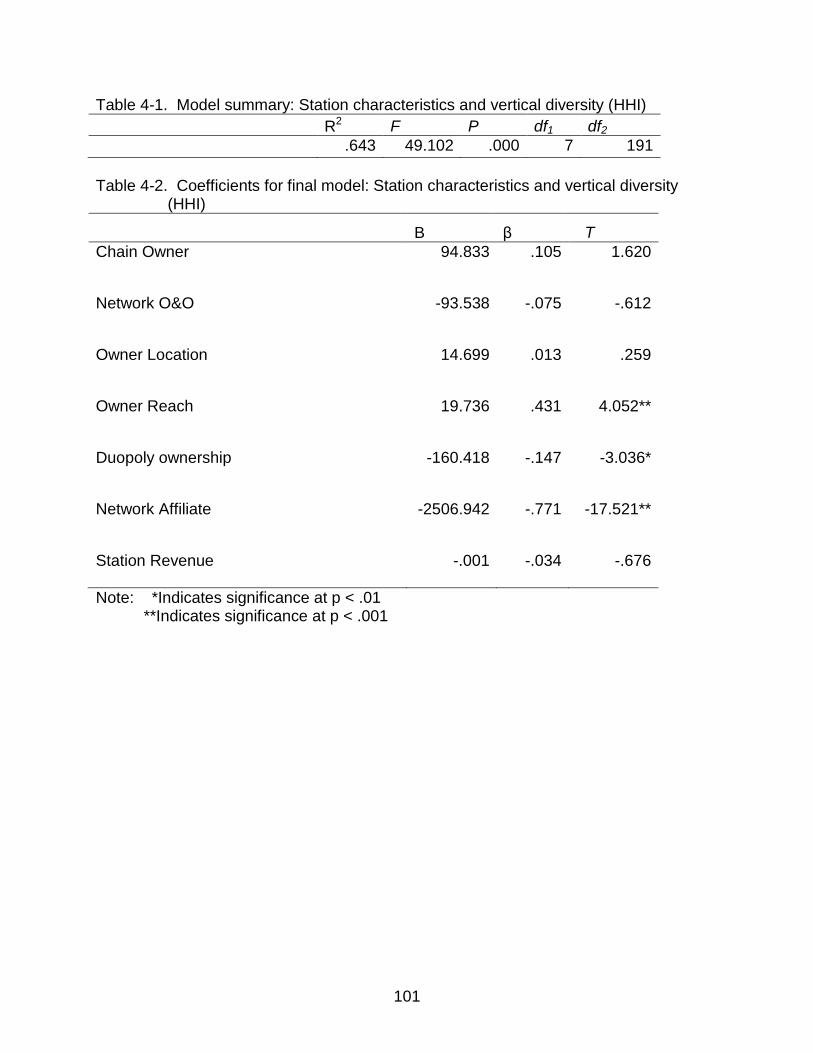
101
Table 4-1. Model summary: Station characteristics and vertical diversity (HHI)
R2 F P df1 df2
.643 49.102 .000 7 191
Table 4-2. Coefficients for final model: Station characteristics and vertical diversity
(HHI)
B β T
Chain Owner 94.833 .105 1.620
Network O&O -93.538 -.075 -.612
Owner Location 14.699 .013 .259
Owner Reach 19.736 .431 4.052**
Duopoly ownership -160.418 -.147 -3.036*
Network Affiliate -2506.942 -.771 -17.521**
Station Revenue -.001 -.034 -.676
Note: *Indicates significance at p < .01 **Indicates significance at p < .001
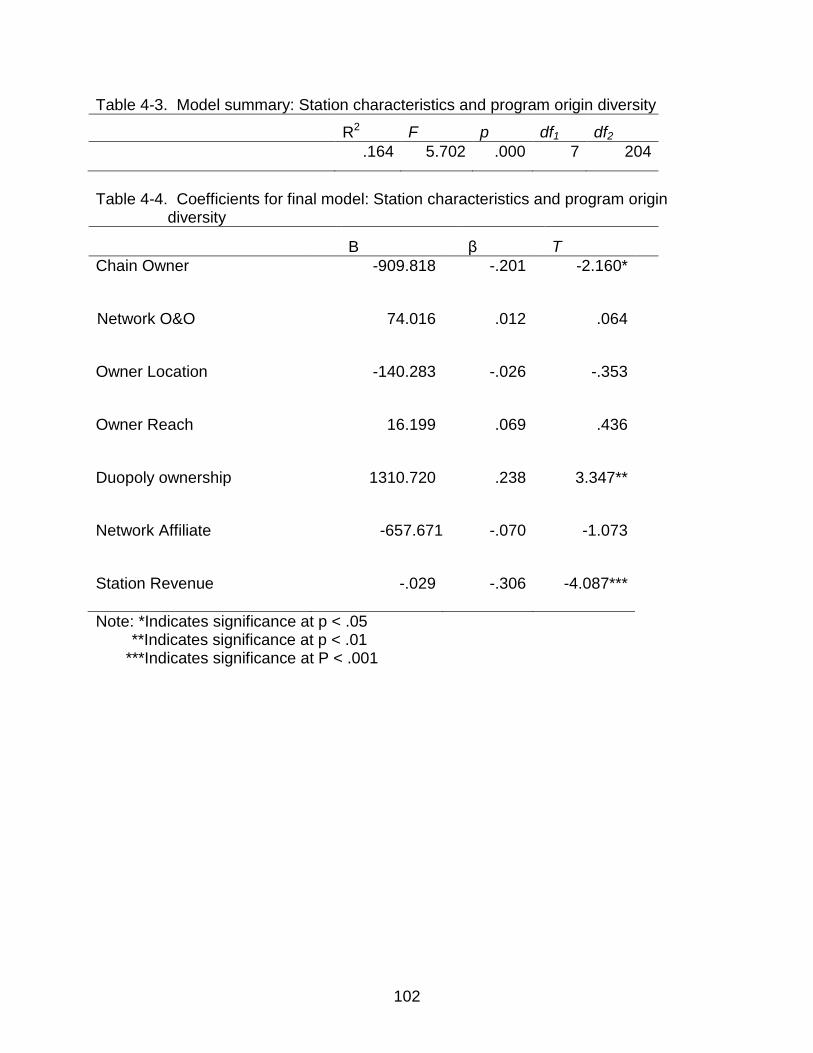
102
Table 4-3. Model summary: Station characteristics and program origin diversity
R2 F p df1 df2
.164 5.702 .000 7 204
Table 4-4. Coefficients for final model: Station characteristics and program origin
diversity
B β T
Chain Owner -909.818
-.201 -2.160*
Network O&O 74.016 .012 .064
Owner Location -140.283 -.026 -.353
Owner Reach 16.199 .069 .436
Duopoly ownership 1310.720 .238 3.347**
Network Affiliate -657.671 -.070 -1.073
Station Revenue -.029 -.306 -4.087***
Note: *Indicates significance at p < .05 **Indicates significance at p < .01
***Indicates significance at P < .001
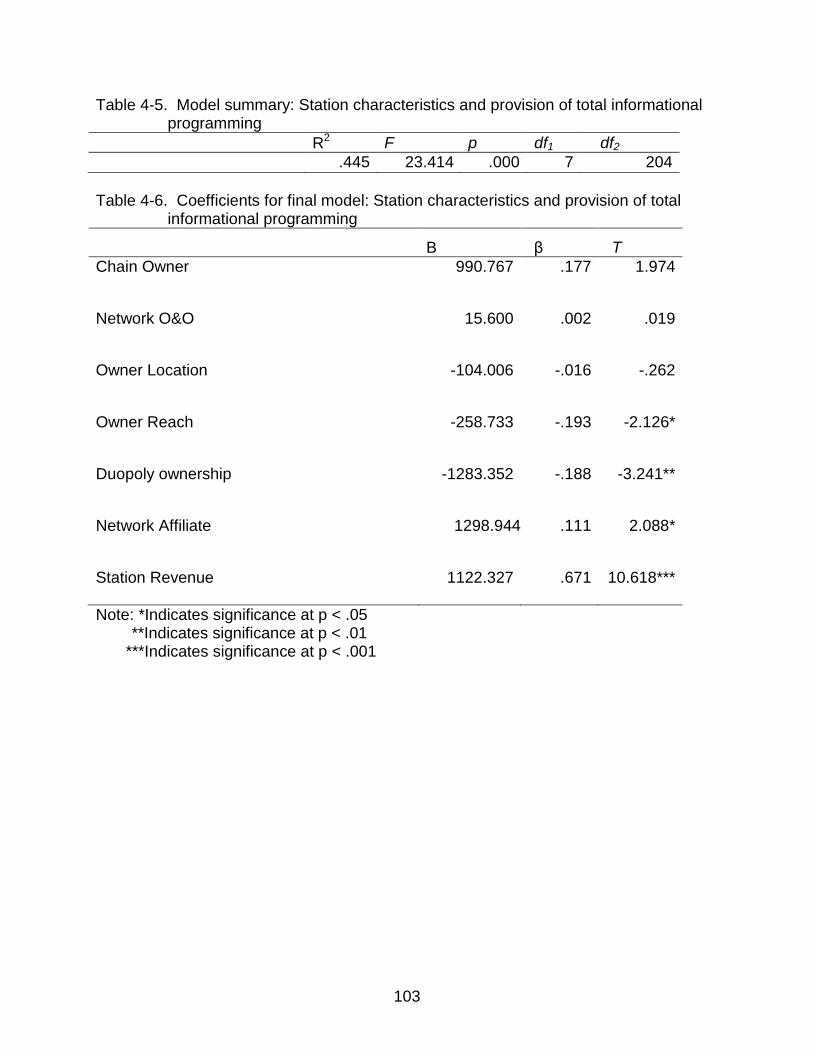
103
Table 4-5. Model summary: Station characteristics and provision of total informational programming
R2 F p df1 df2
.445 23.414 .000 7 204
Table 4-6. Coefficients for final model: Station characteristics and provision of total
informational programming
B β T
Chain Owner 990.767
.177
1.974
Network O&O 15.600 .002 .019
Owner Location -104.006 -.016 -.262
Owner Reach -258.733 -.193 -2.126*
Duopoly ownership -1283.352 -.188 -3.241**
Network Affiliate 1298.944 .111 2.088*
Station Revenue 1122.327 .671 10.618***
Note: *Indicates significance at p < .05 **Indicates significance at p < .01
***Indicates significance at p < .001
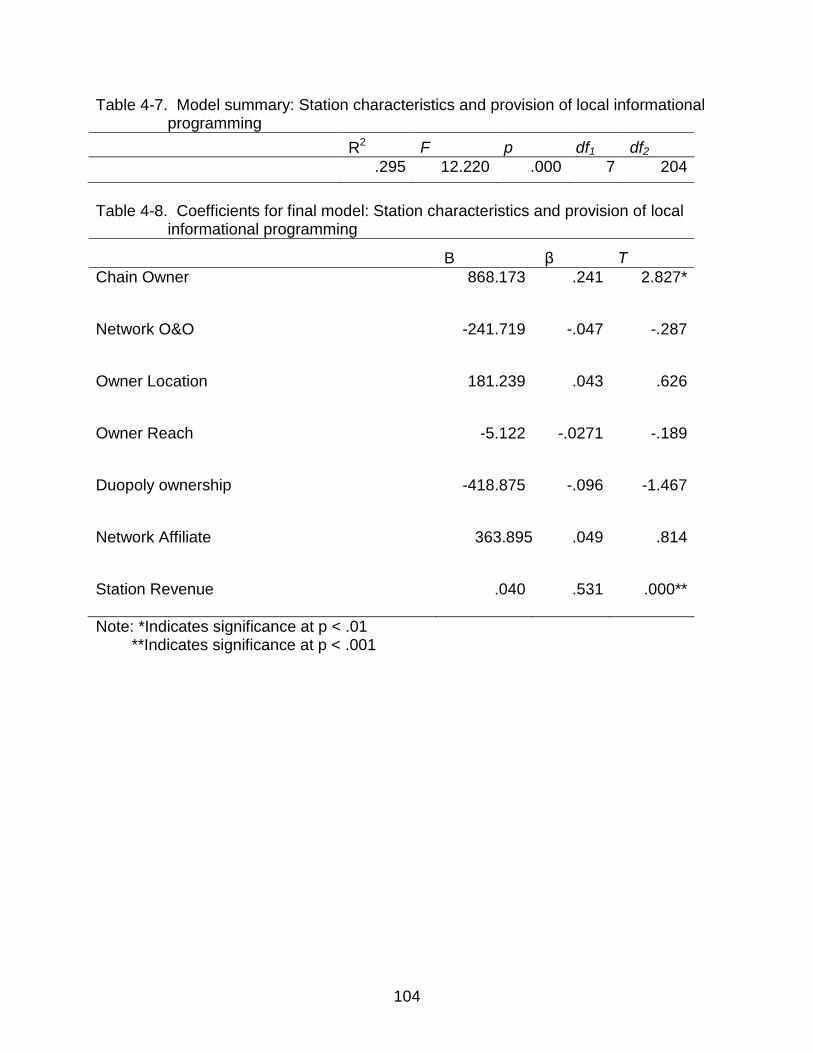
104
Table 4-7. Model summary: Station characteristics and provision of local informational programming
R2 F p df1 df2
.295 12.220 .000 7 204
Table 4-8. Coefficients for final model: Station characteristics and provision of local
informational programming
B β T
Chain Owner 868.173 .241 2.827*
Network O&O -241.719 -.047 -.287
Owner Location 181.239 .043 .626
Owner Reach -5.122 -.0271 -.189
Duopoly ownership -418.875 -.096 -1.467
Network Affiliate 363.895 .049 .814
Station Revenue .040 .531 .000**
Note: *Indicates significance at p < .01 **Indicates significance at p < .001
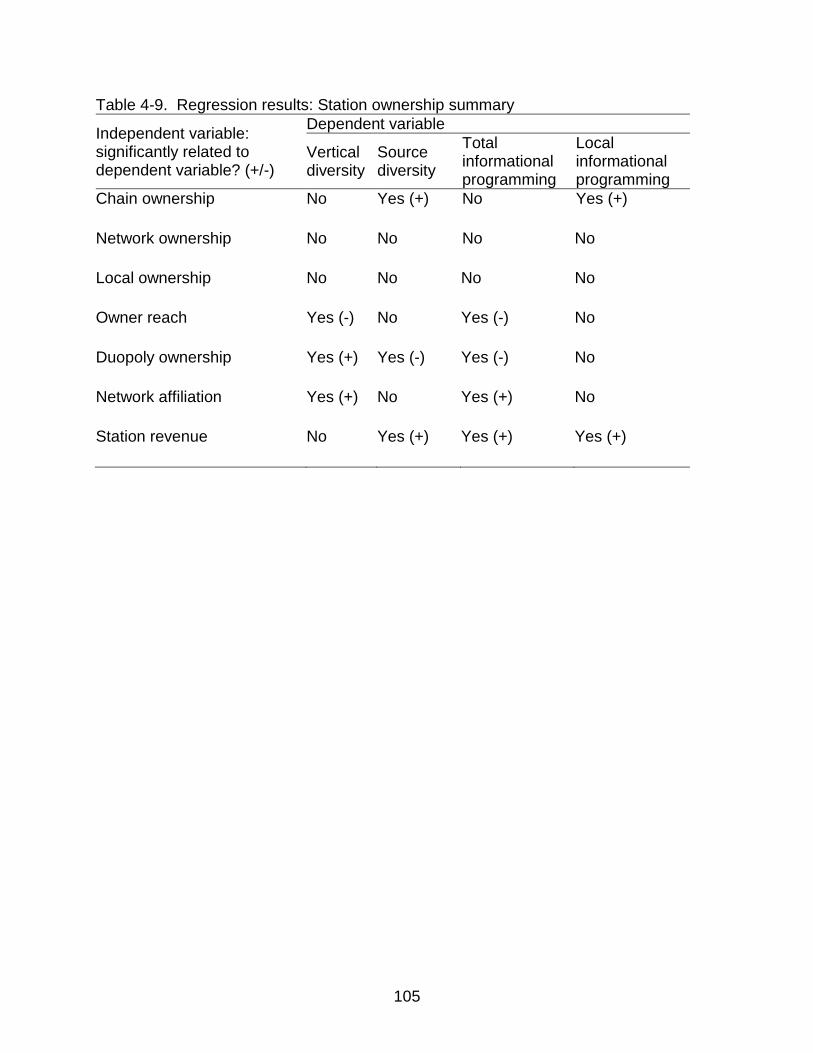
105
Table 4-9. Regression results: Station ownership summary
Independent variable: significantly related to dependent variable? (+/-)
Dependent variable
Vertical diversity
Source diversity
Total informational programming
Local informational programming
Chain ownership No Yes (+) No Yes (+)
Network ownership No No No No
Local ownership No No No No
Owner reach Yes (-) No Yes (-) No
Duopoly ownership Yes (+) Yes (-) Yes (-) No
Network affiliation Yes (+) No Yes (+) No
Station revenue No Yes (+) Yes (+) Yes (+)
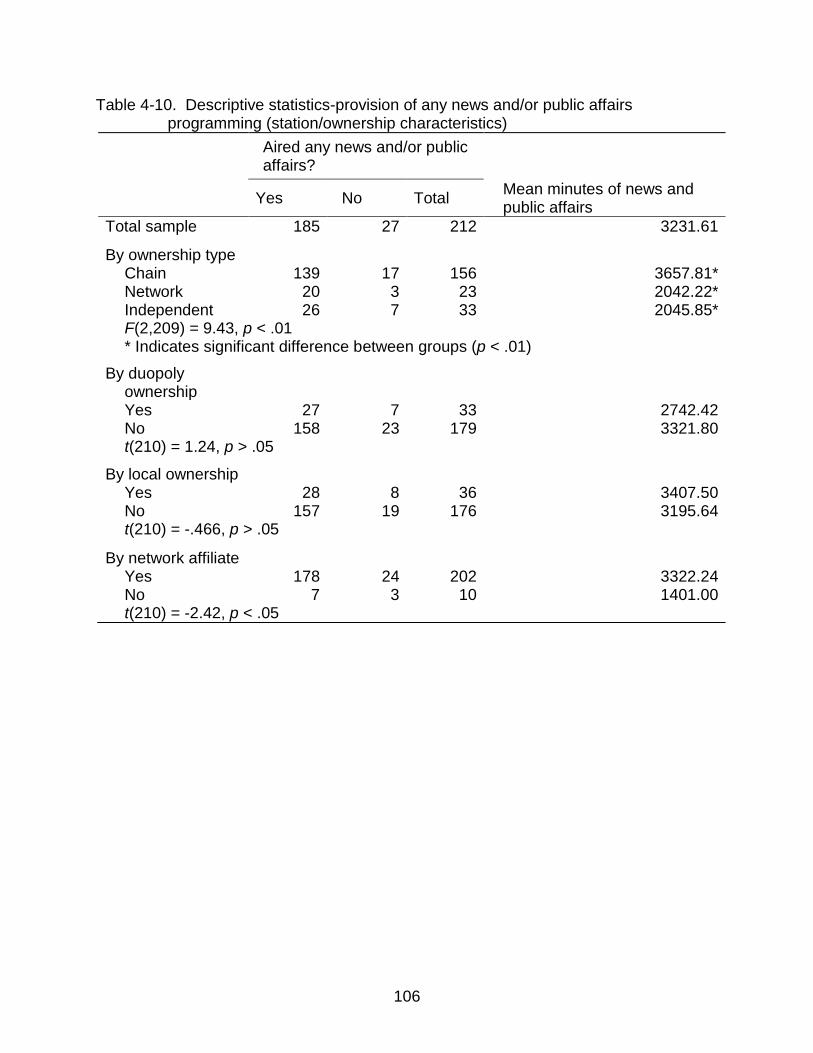
106
Table 4-10. Descriptive statistics-provision of any news and/or public affairs programming (station/ownership characteristics)
Aired any news and/or public affairs?
Yes No Total
Mean minutes of news and public affairs
Total sample 185 27 212 3231.61
By ownership type Chain 139 17 156 3657.81* Network 20 3 23 2042.22* Independent 26 7 33 2045.85* F(2,209) = 9.43, p < .01 * Indicates significant difference between groups (p < .01)
By duopoly ownership
Yes 27 7 33 2742.42 No 158 23 179 3321.80 t(210) = 1.24, p > .05
By local ownership Yes 28 8 36 3407.50 No 157 19 176 3195.64 t(210) = -.466, p > .05
By network affiliate Yes 178 24 202 3322.24 No 7 3 10 1401.00 t(210) = -2.42, p < .05
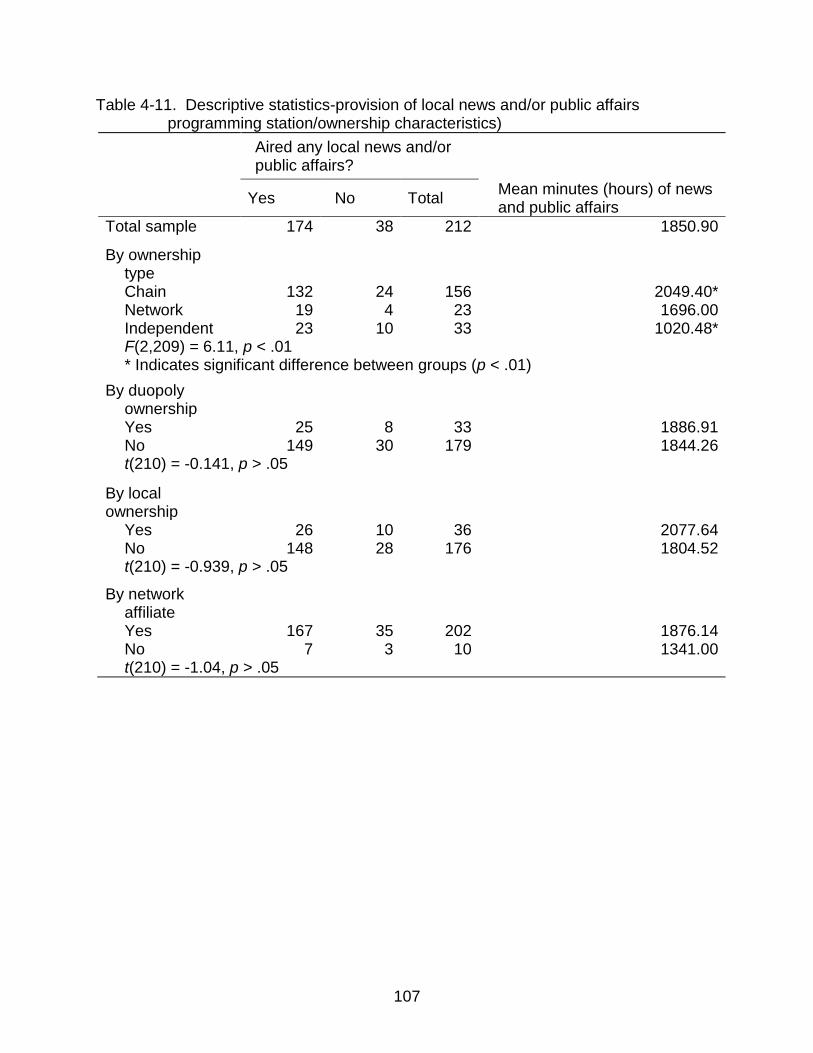
107
Table 4-11. Descriptive statistics-provision of local news and/or public affairs programming station/ownership characteristics)
Aired any local news and/or public affairs?
Yes No Total
Mean minutes (hours) of news and public affairs
Total sample 174 38 212 1850.90
By ownership type
Chain 132 24 156 2049.40* Network 19 4 23 1696.00 Independent 23 10 33 1020.48* F(2,209) = 6.11, p < .01 * Indicates significant difference between groups (p < .01)
By duopoly ownership
Yes 25 8 33 1886.91 No 149 30 179 1844.26 t(210) = -0.141, p > .05
By local ownership
Yes 26 10 36 2077.64 No 148 28 176 1804.52 t(210) = -0.939, p > .05
By network affiliate
Yes 167 35 202 1876.14 No 7 3 10 1341.00 t(210) = -1.04, p > .05
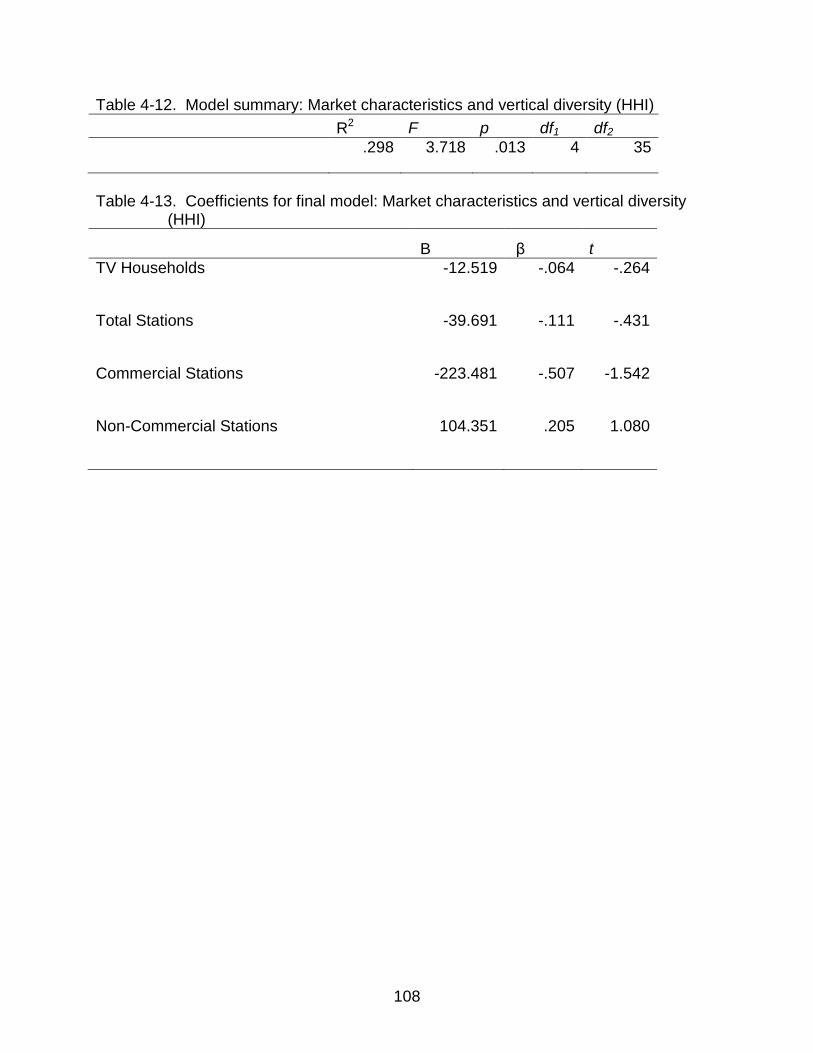
108
Table 4-12. Model summary: Market characteristics and vertical diversity (HHI)
R2 F p df1 df2
.298 3.718 .013 4 35
Table 4-13. Coefficients for final model: Market characteristics and vertical diversity
(HHI)
B β t
TV Households -12.519 -.064 -.264
Total Stations -39.691 -.111 -.431
Commercial Stations -223.481 -.507 -1.542
Non-Commercial Stations 104.351 .205 1.080
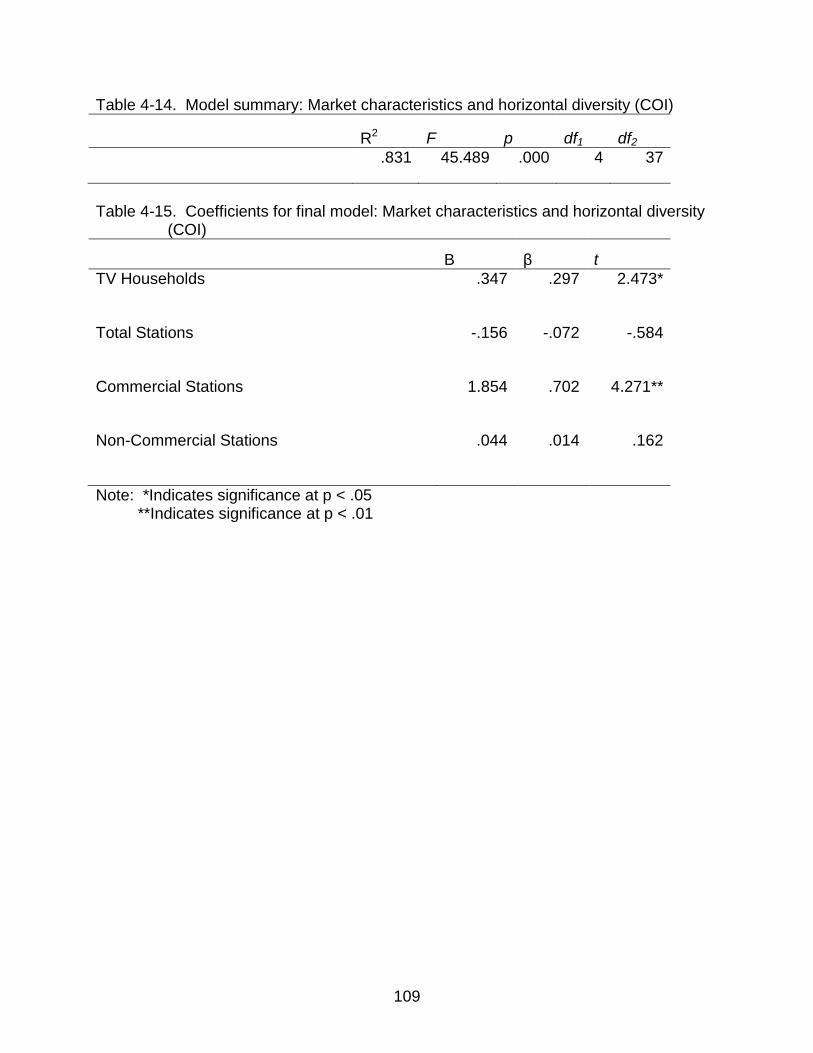
109
Table 4-14. Model summary: Market characteristics and horizontal diversity (COI)
R2 F p df1 df2
.831 45.489 .000 4 37
Table 4-15. Coefficients for final model: Market characteristics and horizontal diversity
(COI)
B β t
TV Households .347 .297 2.473*
Total Stations -.156 -.072 -.584
Commercial Stations 1.854 .702 4.271**
Non-Commercial Stations .044 .014 .162
Note: *Indicates significance at p < .05 **Indicates significance at p < .01
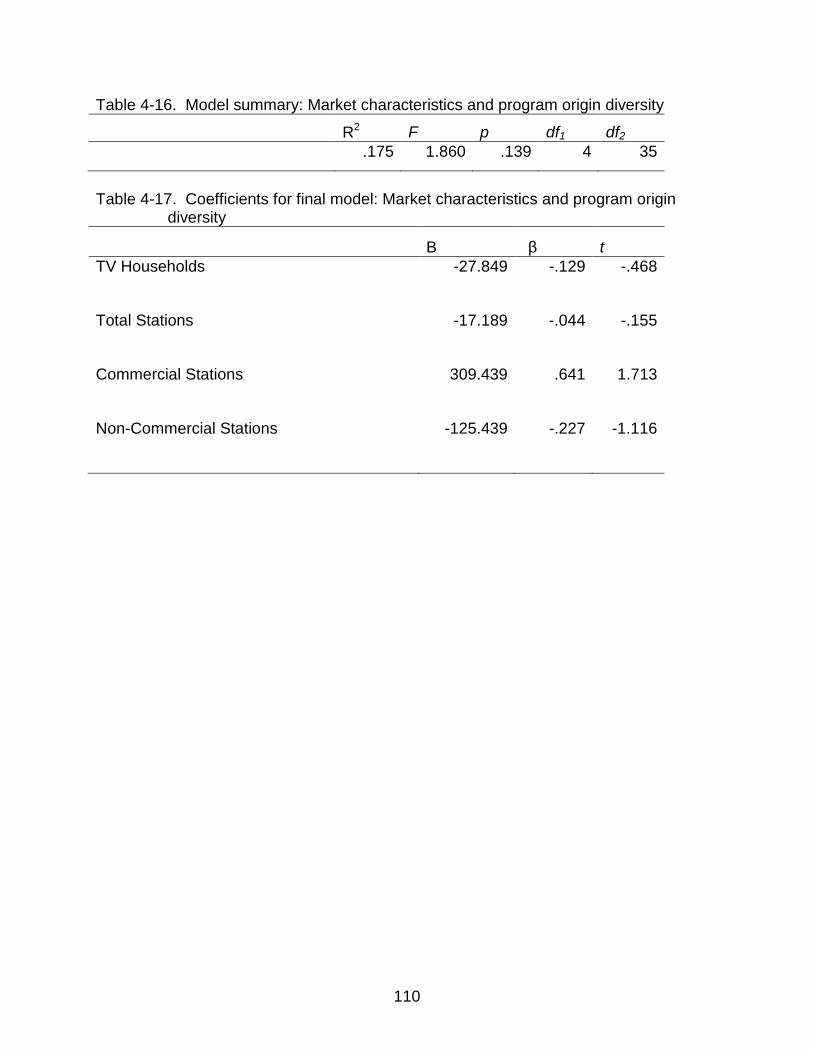
110
Table 4-16. Model summary: Market characteristics and program origin diversity
R2 F p df1 df2
.175 1.860 .139 4 35
Table 4-17. Coefficients for final model: Market characteristics and program origin
diversity
B β t
TV Households -27.849 -.129 -.468
Total Stations -17.189 -.044 -.155
Commercial Stations 309.439 .641 1.713
Non-Commercial Stations -125.439 -.227 -1.116
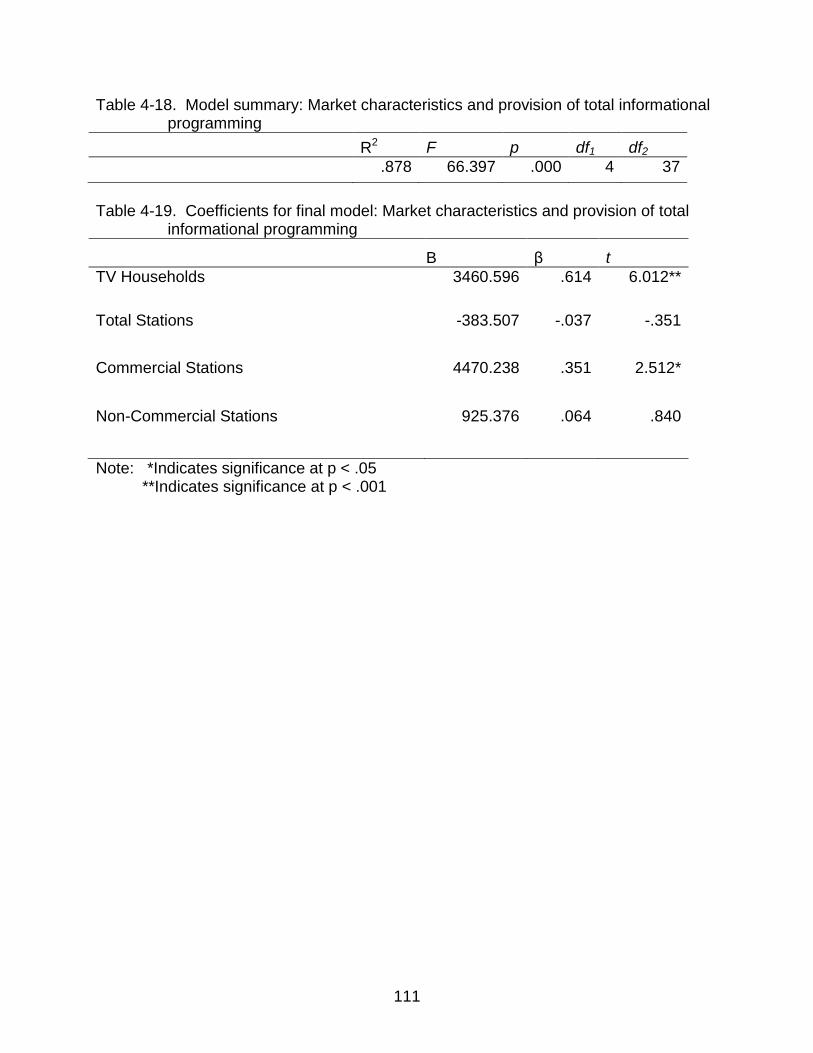
111
Table 4-18. Model summary: Market characteristics and provision of total informational programming
R2 F p df1 df2
.878 66.397 .000 4 37
Table 4-19. Coefficients for final model: Market characteristics and provision of total
informational programming
B β t
TV Households 3460.596 .614 6.012**
Total Stations -383.507 -.037 -.351
Commercial Stations 4470.238 .351 2.512*
Non-Commercial Stations 925.376 .064 .840
Note: *Indicates significance at p < .05 **Indicates significance at p < .001
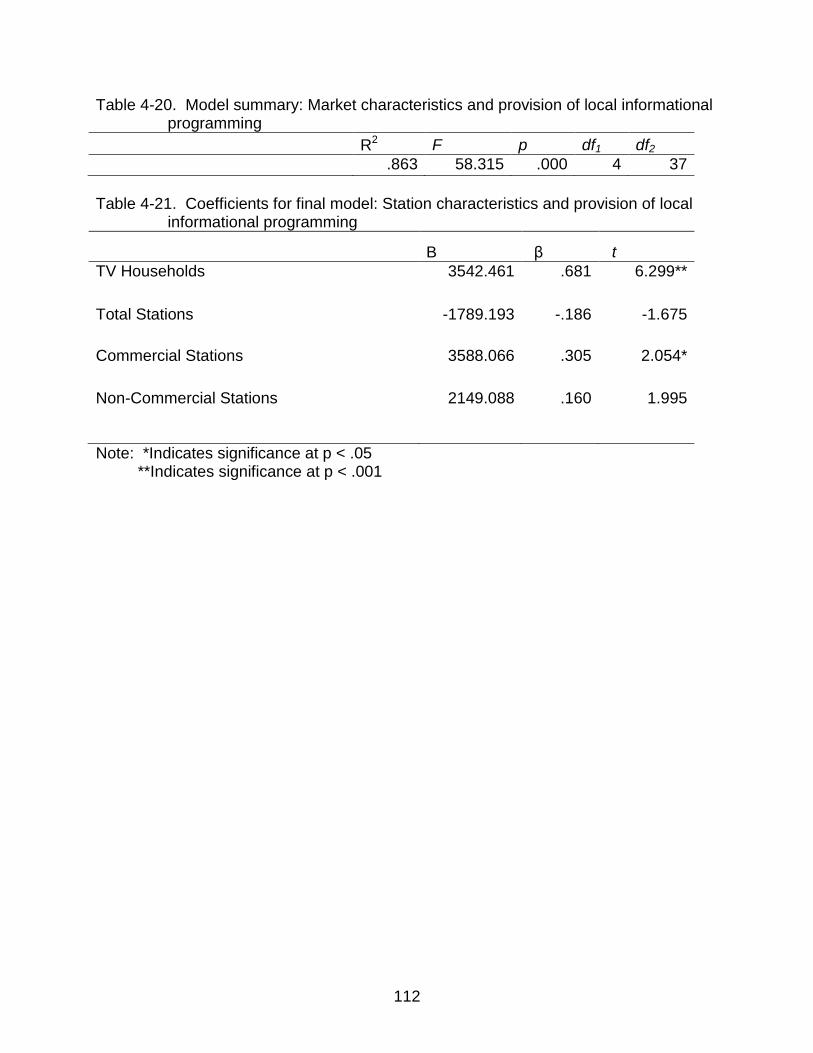
112
Table 4-20. Model summary: Market characteristics and provision of local informational programming
R2 F p df1 df2
.863 58.315 .000 4 37
Table 4-21. Coefficients for final model: Station characteristics and provision of local
informational programming
B β t
TV Households 3542.461 .681 6.299**
Total Stations -1789.193 -.186 -1.675
Commercial Stations 3588.066 .305 2.054*
Non-Commercial Stations 2149.088 .160 1.995
Note: *Indicates significance at p < .05 **Indicates significance at p < .001
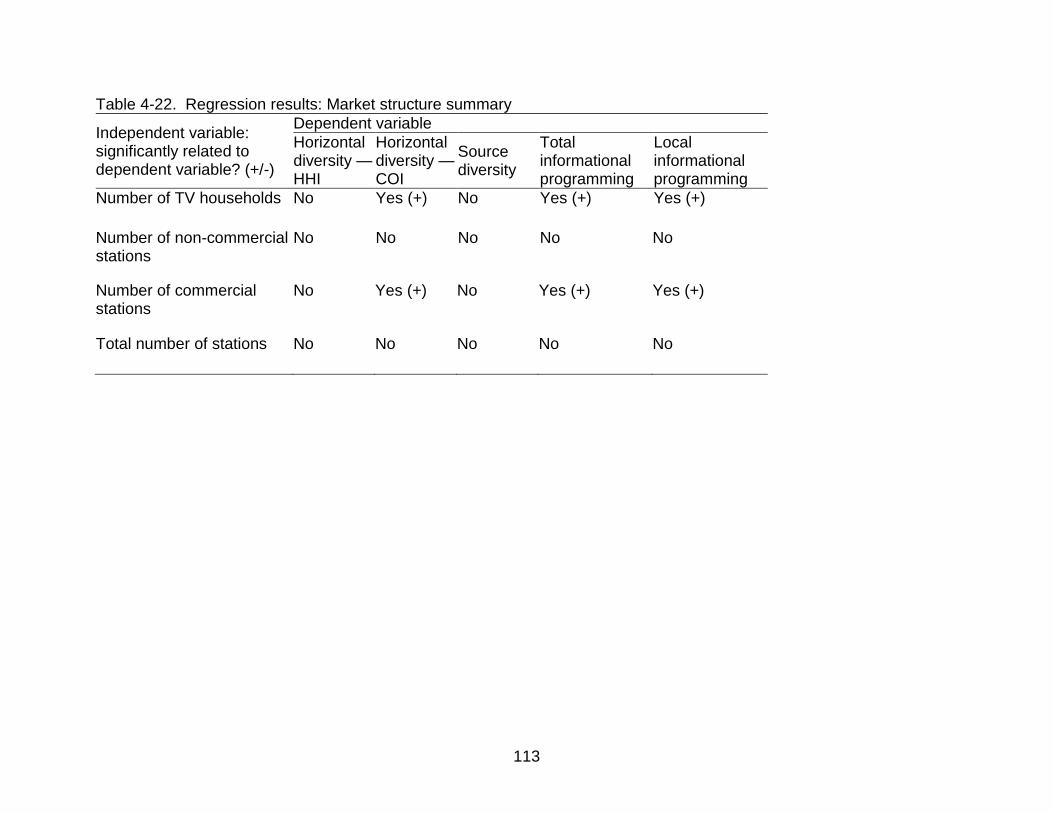
113
Table 4-22. Regression results: Market structure summary
Independent variable: significantly related to dependent variable? (+/-)
Dependent variable
Horizontal diversity — HHI
Horizontal diversity — COI
Source diversity
Total informational programming
Local informational programming
Number of TV households No Yes (+) No Yes (+) Yes (+)
Number of non-commercial stations
No No No No No
Number of commercial stations
No Yes (+) No Yes (+) Yes (+)
Total number of stations No No No No No
114
CHAPTER 5 DISCUSSION AND CONCLUSION
Over the past few decades, media industries have become increasingly
consolidated, and local television is no exception. Critics of consolidation contend
concentration harms localism and encourages an overabundance of “common
denominator” programs. Ownership regulations have been relaxed in recent years,
however, as policymakers have grown more confident in the market’s ability to produce
diverse programming serving a variety of tastes and interests. It is unclear, however,
whether these assumptions hold true. The present study has attempted to provide
clarity by examining the relationship between ownership characteristics and market
conditions and the programming provided by local television stations. In particular, it
was concerned with how these factors influence the level of program type and program
origin diversity as well as the quantity of total and local informational programming
provided.
In terms of the impact on program type diversity, this study found evidence both in
favor of and against consolidation. While large group owners provided less diverse
programming, network affiliation and duopoly ownership were positively related to
program type diversity.
With regard to informational programming, descriptive statistics show that the vast
majority of stations (87.3%) aired some news and/or public affairs programming during
the sample period. Chain owned stations broadcast significantly more informational
programming than network or independently owned stations, and network affiliates
broadcast more informational programming than independents. Significant differences
were not observed among the other station variables. Turning to the multivariate
115
analysis, station revenue was the most significant predictor of the quantity of both total
and local informational programming provided. These results are in line with previous
research in the area (Napoli, 2004; Napoli & Yan, 2007; Wirth & Wollert, 1979) and
highlight the importance of a station’s financial resources in the provision of news and
public affairs programming. While all stations have a strong incentive to produce
informational programming (particularly news) due to its lucrative revenue potential, it
may be that only stations with the resources to cover the high costs of production will
provide such content.
Source diversity was also greater for financially strong stations. Once again, this
points to the importance of station resources on the programming provided by local
stations. Wealthier stations are better positioned to take on the costs of local production
and may be less dependent on relatively inexpensive syndicated programming than
those with fewer resources.
The resource discussion goes beyond a station’s financial means, however.
According to the resource-based view (RBV) of strategy, a competitive advantage is
sustained by capitalizing on the firm’s internal resources (Barney, 1991; Henry, 2011).
In this view, firms are comprised of resources and capabilities that can be arranged to
create a competitive advantage. Put another way, the organization’s internal resources
influence how it behaves (the strategic choices made) in the external environment
(Barney, 1991; Henry, 2011). These resources may be tangible, such as physical,
financial, or human resources, or they may be intangible like intellectual or technical
resources and reputation (Henry, 2011). This theory explains a number of the findings in
this study. Regression analysis revealed that compared to independent stations, chain
116
owned stations offered programming from a greater variety of sources along with more
local informational programming. These stations have a number of resource advantages
over their counterparts. First, they tend to be financially strong, which enables them to
afford the equipment and personnel required to produce more informational
programming. In addition, they have access to a network of stations with which they can
share resources and information. They are also likely to have greater clout in
negotiating syndication agreements as well as some centralized management providing
leadership and support. Network affiliation was associated with greater vertical diversity
and informational programming. Like chain owned stations, affiliates are typically among
the financially strongest stations in a market, enabling them to take on the additional
costs incurred by informational programming. Moreover, these stations have access to
a powerful national network from which they receive programming; this is a particularly
advantageous relationship in terms of newsgathering.
RBV seems to have little explanatory power in terms of the duopoly and reach
variables as they have an opposite/confounding effect from what might be expected.
For example, supporters of deregulation argued that relaxing duopoly ownership rules
would allow stations to capture economies of scale that would encourage greater
production of informational programming. The current study found mixed evidence for
these benefits. While duopoly was positively related to program type diversity, duopoly
ownership was negatively related to the provision of total informational programming.
There was no significant relationship between duopoly ownership and the amount of
local informational programming provided; this in line with previous research in the area
(Yan & Napoli, 2006; Yan & Park, 2009). Given that previous research has provided
117
limited insight and the results of this study suggest that duopoly seems to both promote
and harm programming, further research should be conducted in this area. In terms of
reach, this was found to be negatively associated with vertical diversity and the
provision of informational programming. Potential explanations for these findings are
discussed further below.
Interestingly, local ownership was not significantly related to any of the dependent
variables. That is, the assumption that local owners are more responsive to and better
serve community needs and interests appears to lack empirical support. These findings
also call into question the emphasis placed on local ownership. This is not to say local
ownership is unimportant, but rather that other station characteristics have a greater
impact on programming and more effectively support localism.
In terms of RQ2a, the results provide mixed support for the argument that greater
competition encourages stations to provide more diverse content. Regression results
indicate market structure bears no relationship to the breadth of programming provided
(HHI). However, a positive relationship was found between the number of households
and number of commercial stations in a market and the number of simultaneous
program types available (COI). These findings support previous research that found
competition leads to increasing dissimilarity in programming (Aslama, Hellman & Sauri,
2004; Grant, 1994; Litman, 1979). Overall, it appears that, facing strong competition,
stations counterprogram in order to compete. The results suggest market incentives
alone are not sufficient to promote the provision of diverse content. While the options
available at any given point in time are enhanced, overall diversity appears to be
unaffected by the degree of competition.
118
In terms of RQ2b, none of the market variables were significantly related to the
mix of origin sources. It is unlikely competition will compel stations to offer more
programming from a greater variety of sources.
As suggested by previous research in the area (Napoli, 2001b; Napoli & Yan,
2007; Powers, 2001; Yan & Napoli, 2006), competition does appear to compel greater
provision of informational programming (RQ2c). Overall, more than 20% of all
programming shown by qualifying stations in all markets was informational in nature. In
addition, the number of TV households and number of commercial stations in the
market were positively related to the quantity of informational programming (both total
and local) provided. These results support marketplace logic that market forces provide
sufficient incentive to induce the provision of informational programming and the
relaxation of ownership limits that has taken place in recent years. They likely reflect the
greater revenue potential inherent in large markets; stations are willing to incur the
heavy costs of news and public affairs production because the incentive to do so
(potential profit) is strong and costs can be amortized through access to larger
audiences.
The number of non-commercial stations had no relationship with any of the
programming variables. In the area of informational programming, previous research
found mixed support for a relationship between programming and the presence of non-
commercial stations. Napoli (2004) found a negative relationship between the number of
non-commercial stations in the market and the quantity of both local news and total
local informational programming (news and public affairs together). Later studies (Yan &
Napoli, 2006: Napoli & Yan, 2007), however, found no relationship with the quantity of
119
local news programming provided. Researchers have consistently found no relationship
between public stations and the quantity of public affairs programming when this
program type is considered on its own (Napoli, 2001a, 2004). Because this study
considered news and public affairs programming together (like Napoli, 2004), it was
expected that a strong public station presence would potentially result in the provision of
less news and public affairs programming by commercial stations, as the latter would
offer alternative programming in order to avoid competing with public broadcasters, who
have a particularly strong commitment to the public interest. This does not appear to be
the case, however; rather, it appears the behavior of commercial stations is unaffected
by that of their public counterparts. It may be that commercial stations do not view these
stations as competitors; moreover, these stations may exist in a different product market
entirely. This is particularly true if one considers the content of the informational
programs offered. The news programs provided by non-commercial stations are of a
very different brand than those provided by commercial stations and, consequently,
attract a very different audience. In particular, these programs (e.g., NewsHour) air
content that is longer, more in depth and on topics that are not always popular with an
impatient, fickle audience that also needs to be "entertained." These programs also tend
to avoid the use of sound bites, relying instead on extended portions of news
conferences or interviews. Furthermore, as discussed above, the influence of non-
commercial stations on the provision of informational programming has historically had
mixed results. In previous studies, this variable has been far from conclusive and has
had a weak predictive history. Therefore, it may be that, all things considered, the
number of non-commercial stations is simply a weak driver of programming behavior.
120
While this been found to be of some significance in other studies and/or under different
circumstances, it is provides little (and in this study, no) explanatory power compared to
other market variables. It is also worth noting that considering news and public affairs
programming in combination may distort the overall programming picture. For instance,
public stations may be less likely than their commercial counterparts to incur the costs
of producing news, but more likely to provide public affairs programming. That is,
commercial stations and their non-commercial counterparts may demonstrate a
stronger relationship with a particular type of informational programming (either news or
public affairs). It would be interesting, therefore, to examine news and public affairs
programming separately (as previous studies have done) to get a better picture of how
each station type impacts diversity.
Overall, the findings of the present study suggest policy makers should not be as
concerned with the owners of media as with the number of stations in a market and the
resources available to them. Financial strength was the single most important station-
related predictor of programming, and the intensity of market competition (as measured
by the number of commercial stations) was positively related to the number of unique
programming options available at any given time as well as the quantity of informational
programming provided. Moreover, while the relationship between some variables (such
as station owner’s national reach) and programming indicate consolidation has a
detrimental effect on diversity and/or the provision of informational programming, many
other station variables (e.g., network affiliation and chain ownership) were actually
positively related to these variables. Taken together, these findings suggest that
ownership regulations may have limited effect on the programming viewers receive and
121
that market forces may actually improve diversity. This is not to say that regulations
should be entirely lifted; however, it does suggest that the fears of consolidation critics
may be overstated. It also suggests that licensing policies should be revisited in order to
encourage the greatest number of commercial stations possible per market. Obviously
this is not without its technical challenges (after all, “scarcity of the airwaves” is one of
the guiding principles of media policy), but as technology continues to improve, the
number of available frequencies should also increase. The digital transition increased
viewing options by default as multicasting increased the number of streams available for
broadcasting; it will be interesting to see how digital subchannels impact the media
landscape as multicasting emerges.
The current study is, of course, not without its limitations. First, for reasons
mentioned above, this study focused only on primary signals. This approach, however,
fails to reflect all of the options currently available to audiences. As mentioned above,
within the broadcast realm alone, digital subchannels, have the potential to increase
diversity as they provide additional viewing options in the market (assuming, of course,
they are actually utilized). In addition, many viewers subscribe to cable or satellite
television services, which provide a seemingly unlimited number of additional options,
including informational content. Therefore, the focus on local television is somewhat
shortsighted as it does not capture the alternatives available via other means.
Consequently, future research should explore what diversity looks like when all delivery
platforms are considered.
In addition, this study intentionally excluded the programming provided by religious
and public stations. However, these represent true choices for viewers in a market and
122
should be considered in future studies of market structure. Moreover, the current study
lumped foreign language programs into two broad categories, “Spanish” and “Asian,” for
the sake of simplicity. However, great diversity exists within these categories, and
viewers most definitely tune in for content reasons (just as some may select English
programming for the same reasons.) Therefore, future research should attempt to
distinguish between the programs provided on foreign language stations.
The conclusions presented must also be mediated by the fact that the current
study was only concerned with the quantity of informational programming provided.
However, this is not the only gauge of the extent to which stations fulfill their obligations
to their local communities. Beyond news and public affairs programming, stations air
public service announcements and political advertisements; these also contribute the
marketplace of ideas and, thus, merit inclusion. Future studies should also look at the
more intangible aspects of public service, such as newscast quality. Ownership and
market conditions may impact not only the provision of informational programming, but
also the content itself. Consequently, future research should look beyond quantitative
assessments of the extent to which broadcasters are serving local interests and needs;
it should also include indicators of quality such as subject matter, time devoted to
different topics, or production location, among others.
Another limitation is that this study utilized a mixed measurement approach. That
is, it used both continuous and categorical independent variables. Categorical variables
do not provide as much precision or statistical power as continuous variables.
Moreover, dummy variables are proxy variables with little mathematical value.
Therefore, while they allow prediction and a sense of comparison, they do not provide a
123
true “magnitude” of a variable’s measure, and the resulting analysis is less sensitive
than if continuous variables alone were used. This distinction as a measure may help
explain why reach (continuous) and chain ownership (categorical) seem to work in
opposing directions. Overall, the use of a mixed-measurement approach may not have
provided a true picture of the relationships between variables, particularly for those that
were categorical. Future studies, therefore, should attempt to operationalize all
variables in a way that allows them to be measured as continuous variables.
Furthermore, the present study was concerned only with the supply of diverse
programming, and ignored the demand side of the relationship. While there is great
concern about the supply of diverse programming, little attention has been paid to
consumer demand that may limit consumption of undesirable programming (e.g., news,
public affairs or minority interest programs). While media should certainly provide
informational and minority interest programming, it is difficult to objectively determine
what constitutes a sufficient amount. The quantities currently available may satisfy, or
even exceed, audience demand for such programming. Therefore, analysis of
consumption data is needed to determine whether stations are effectively fulfilling their
social responsibilities.
Perhaps most importantly, while program type diversity is a suitable measure of
product variety, it does not get to the heart of what policymakers truly seek to promote:
viewpoint diversity. The current study uses abundance as a proxy for diversity, but
numerical diversity does not ensure qualitative diversity — that is, a diversity of
messages. As suggested for informational programming, future research must seek to
examine not only the type of programming provided, but also the content of those

124
programs. While previous attempts to quantify viewpoint diversity have faced
methodological challenges, a direct approach must be taken in order to truly gauge how
well stations are providing access to a variety of views.
125
REFERENCES
Albarran, A.B. (1996). Media economics: Understanding markets, industries and concepts. Ames: Iowa State University Press.
Albiniak, P. (2010, April 12). B&C’s top 25 station groups 2010. Broadcasting & Cable. Retrieved from http://www.broadcastingcable.com/article/451325-B_C_s_Top_25_Station_Groups_2010.php
Alexander, P. (1997). Product variety and market structure. Journal of Economic Behavior & Organization, 32, 207–214. doi: 10.1016/S0167-2681(96)00902-X
Alexander, P.J., & Brown, K. (2004, June). Do local owners deliver more localism? Some evidence from local broadcast news. Retrieved from http://hraunfoss.fcc.gov/edocs_public/attachmatch/DOC-267448A1.pdf
Aslama, M., Hellman, H., & Sauri, T. (2004, April). Does market-entry regulation matter?: Competition in television broadcasting and programme diversity in Finland, 1993–2002. International Communication Gazette, 66, 113–132. doi:10.1177/0016549204041473
Associated Press v. United States, 326 U.S. 1 (1945).
Atwater, T. (1984). Product differentiation in local TV news. Journalism Quarterly, 61(4), 757–762. Retrieved from Communication & Mass Media Complete database.
Bae, H. S. (1999). Product differentiation in cable programming: The case in the cable national all-news networks. Journal of Media Economics, 12(4), 265–277. Retrieved from Communication & Mass Media Complete database.
Bagdikian, B.H. (1989). The lords of the global village. The Nation, 248(23), 805–20.
Bagdikian, B. H. (2004). The new media monopoly. Boston: Beacon Press.
Baker, C.E. (2002). Media concentration: Giving up on democracy. Florida Law Review,
54,839–919.
Barney, J. (1991). Firm resources and sustained competitive advantage. Journal of Management, 17(1), 99–120.
Barrett, M. (1995). Direct competition in cable television delivery: A case study of Paragould, Arkansas. Journal of Media Economics, 8(3), 77–93.
Barrett, M. (2005). The FCC’s media ownership rules and the implications for the network-affiliate relation. Journal of Media and Media Economics, 18(1), 1–19.
Barron, J.A. (2000). Structural regulation of the media and the diversity rationale. Federal Communications Law Journal, 52, p. 555–560.
126
Baseman, K.C., & Owen, B.M. (1982). A framework of economic analysis of electronic
media concentration issues. Prepared for the National Cable Television
Association for submission in FCC docket no. 82–434. Washington, DC:
Economists Inc.
Bates, B. J. (1993). Concentration in local television markets. Journal of Media Economics , 6 (3), 3–21.
Beebe, J. (1977). Institutional structure and program choices in television markets. Quarterly Journal of Economics, 91(1), 15–37. Retrieved from Business Source
Premier database.
Berry, S.T. & Waldfogel, J. (2001). Do mergers increase product variety? Evidence from
radio broadcasting. Quarterly Journal of Economics, 116(3), 1009–1025.
Retrieved from Business Source Premier database.
Besen, S.M., & Johnson, L.L. (1985). Regulation of broadcast station ownership:
Evidence and theory. In E.M. Noam (Ed.), Video media competition: Regulation,
economics, and technology. New York: Columbia University Press
BIA/Kelsey. (2010). Television station information [Data file]. Unpublished data set. Chantilly, VA: Author.
Bishop, R., & Hakanen, E. A. (2002). In the public interest? The state of local television programming fifteen years after deregulation. Journal of Communication Inquiry, 26(3), 261–276. doi: 10.1177/0196859902026003002
Blevins, J.L. (2002). Source diversity after the Telecommunication Act of 1996: Media oligarchs begin to colonize cyberspace. Television & New media, 3(1), p. 95–112.
Burnett, R. (1992). The implications of ownership changes on concentration and diversity in the phonogram industry. Communication Research, 19(6), 749–769. Retrieved from Communication & Mass Media Complete database.
Busterna, J.C. (1980). Ownership, CATV and expenditures for local television news. Journalism Quarterly, 57(2), 287–291.
Chambers, T. (2003). Radio programming diversity in the era of consolidation. Journal of Radio Studies, 10(1), 33–45. Retrieved from Communication & Mass Media Complete database.
Chan-Olmsted, S. (1996). From Sesame Street to Wall Street: An analysis of market competition in commercial children's television. Journal of Broadcasting & Electronic Media, 40(1), 30–44. Retrieved from Communication & Mass Media Complete database.
127
Cleary, J. & Adams-Bloom, T. (2009). The Family Business: Entertainment Products and the Network Morning News Shows. Mass Communication and Society, 12(1), 78–96. doi:10.1080/15205430801936006
Communications Act of 1934, Pub. L. No 73-416, 48 Stat. 1064 (1934).
Compaine, B.M. (1995). The impact of ownership on content: Does it matter? Cardozo Arts & Entertainment Law Journal, 13, p.755–775.
Consumers Union (n.d.). Local News. Retrieved September 24, 2010, from http://www.hearusnow.org/mediaownership/14/
Cooper, M. (2003). Media ownership and democracy in the digital information age: Promoting diversity with First Amendment principles and market structure analysis. Palo Alto, CA: Stanford Law School, Center for Internet & Society.
Coulson, D. C., & Hansen, A. (1995). The Louisville-Courier-Journal news content after purchase by Gannett. Journalism & Mass Communication Quarterly, 72(1), 205–215.
Croteau, D. R., & Hoynes, W. (2005). The business of media: Corporate media and the public interest. Thousand Oaks, California: Pine Forge Press.
Davie, W.R., & Lee, J.S. (1993). Television news technology: Do more sources mean less technology? Journal of Broadcasting & Electronic Media, 37(4), 453–464.
De Jong, A. S., & Bates, B. J. (1991). Channel diversity in cable television. Journal of Broadcasting & Electronic Media, 35, 159–166. Retrieved from HeinOnline Law Journal Library.
Dominick, J. R., & Pearce, M. C. (1976). Trends in network prime-time programming, 1953-74. Journal of Communication , 26, 70–80.
Doyle, G. (2002). Media ownership: The economics and politics of convergence and concentration in the UK and European media. London: SAGE.
Drushel, B. (1998). The Telecommunications Act of 1996 and radio market structure. Journal of Media Economics, 11(3), 3–20. Retrieved from Communication & Mass Media Complete database.
Einstein, M. (2002). Program diversity and the program selection process on broadcast network television. Washington, DC: Federal Communications Commission Media Bureau.
Einstein, M. (2004). Media diversity: Economics, ownership, and the FCC. Mahwah,
N.J: L. Erlbaum Associates.
128
Entman, R. M., & Wildman, S. S. (1992). Reconciling economic and non-economic perspectives on media policy: Transcending the "marketplace of ideas." Journal of Communication, 42(1), 5–19.
Everett, S. C., & Everett, S. E. (1989). How readers and advertisers benefit from local newspaper competition. Journalism Quarterly, 66, 76–79.
Federal Communications Commission (1969, Feb. 9). FCC Report & Order in Docket No. 16068.
Federal Communications Commission. (1984). Revision of programming and commercialization policies, ascertainment requirements, and program log requirements for commercial television stations, 1984 FCC LEXIS 2105.
Federal Communications Commission (1999, August 5). FCC revises local television ownership rules. Retrieved November 25, 2009, from http://www.fcc.gov/Bureaus/Mass_Media/News_Releases/1999/nrmm9019.html
Federal Communications Commission. (2003). 2002 biennial regulatory review—Review of the commission’s broadcast ownership rules and other rules adopted pursuant to section 202 of the Telecommunications Act of 1996 report and order and notice of proposed rulemaking, 03 FCC 127 (2003). Retrieved September 24, 2010 from http://hraunfoss.fcc.gov/edocs_public/attachmatch/FCC-03-127A1.doc
Free Expression Policy Project. Fact Sheets on Media Democracy. Retrieved September 24, 2010, from http://www.fepproject.org/factsheets/mediademocracy.html
George, L. (2007). What's fit to print: The effects of ownership concentration on product variety in daily newspaper markets. Information Economics and Policy, 19(3-4), 285–303. doi:10.1016/j.infoecopol.2007.04.002
Gilens, M., & Hertzman, C. (2000). Corporate ownership and news bias: Newspaper coverage of the 1996 Telecommunications Act. Journal of Politics, 62(2), 369–386.
Glasser, T. L. (1984). Competition and diversity among radio formats: Legal and structural issues. Journal of Broadcasting, 28, 127–142. Retrieved from HeinOnline Law Library.
Golding, P., & Murdock, G. (1996). Culture, communications, and political economy. In J. Curran and M. Gurevitch (Eds.), Mass Media & Society (pp. 11–30). London: Arnold.
Gomery, D. (1993). The centrality of media economics. Journal of Communication, 43(3), 190–198.
129
Gomery, D. (2000). The television industries: Broadcast, cable, and satellite. In B.M.
Compaine, & D. Gomery (Eds.), Who owns the media?: Competition and
concentration in the mass media industry (pp.193–283). Mahwah, NJ: Lawrence
Erlbaum Associates.
Grant, A. (1994). The promise fulfilled? An empirical analysis of program diversity on television. Journal of Media Economics, 7(1), 51. Retrieved from Communication & Mass Media Complete database.
Greenberg, E., & Barnett, H. J. (1971, May). TV program diversity- New evidence and old theories. American Economic Review, 89–93. Retrieved from Business Source Premier database.
Hamilton, J. (2006). All the news that's fit to sell: How the market transforms information into news. Princeton, N.J: Princeton University Press.
Hazen, D. (2000, April 26). Consumers Likely on the Short End as AOL Gobbles up Time Warner in World's Biggest Merger...So far. Retrieved from http://www.alternet.org/story/569
Hellman, H., & Soramaki, M. (1985). Economic concentration in the videocassette industry: A cultural comparison. Journal of Communication, 35(3), 122–134.
Hellman, H., & Soramäki, M. (1994). Competition and Content in the U.S. Video Market. Journal of Media Economics, 7(1), 29–49. doi: 10.1207/s15327736me0701_3
Hellman, H. (2001). Diversity—An end in itself? European Journal of Communication, 16(2), 181–208. doi: 10.1177/0267323101016002003.
Henry, A. (2011). Understanding strategic management. New York, NY. Oxford University Press.
Hicks, R. G., & Featherstone, J. S. (1978). Duplication of Newspaper Content in Contrasting Ownership Situations. Journalism Quarterly, 55(3), 549–553. Retrieved from EBSCOhost.
Hillve, P., Majanen, P., & Rosengren, K.E. (1997). Aspects of quality in TV programming: Structural diversity compared over time and space. European Journal of Communication, 12(3), 291–318.
Ho, D.E., & Quinn, K.M. (2009). Viewpoint diversity and consolidation: An empirical study. Stanford Law Review, 61(4), 781–868.
Horwitz, R. (2005). On Media Concentration and the Diversity Question. Information Society, 21(3), 181-204. doi:10.1080/01972240490951908.
130
Howard, H. (2006). Television Station Ownership in the United States: A Comprehensive Study (1940–2005). Journalism & Communication Monographs, 8(1), 1–86. Retrieved from Communication & Mass Media Complete database.
Iosifides, P. (1999). Diversity versus concentration in the deregulated mass media domain. Journalism & Mass Communication Quarterly, 76(1), 152–162.
Ishikawa, S., & Muramatsu, Y. (1996). Why measure diversity? In S. Ishikawa (Ed.),
Quality assessment of television (pp. 199–202). Luton, Bedfordshire: University
of Luton Press.
Kambara, N. (1992, March). Study of the diversity indices used for programming analysis. Studies of Broadcasting, 28, 195–206.
Kimmelman, Gene. "Deregulation of Media: Dangerous to Democracy." Retrieved September 24, 2010, from http://www.consumersunion.org/telecom/kimmel-303.htm
Kleiman, H. (1991). Content diversity and the FCC's minority and gender licensing policies. Journal of Broadcasting & Electronic Media, 35(4), 411. Retrieved from Communication & Mass Media Complete database.
Klein, P. (July 24, 1971). Why you watch what you watch when you watch. TV Guide, 6–10.
Lacy, S. (1987). The effects of intracity competition on daily newspaper content. Journalism Quarterly,64, 281–290. Retrieved from Communication & Mass Media Complete database.
Lacy, S. (1988). The impact of intercity competition on daily newspaper content. Journalism Quarterly, 65(2), 399–406. Retrieved from Communication & Mass Media Complete database.
Lacy, S. (1991). Effects of group ownership on daily newspaper content. Journal of Media Economics, 4(1), 35–47. doi: 10.1080/08997769109358202
Le Duc, D. R. (1982). Deregulation and the dream of diversity. Journal of Communication, 32(4), 164–178.
Levin, H.J. (1970). Competition, diversity, and the television group ownership rule. Columbia Law Review, 70(5), 791–835.
Levin, H. (1971). Program duplication, diversity, and effective viewer choices: Some empirical findings. American Economic Review, 61(2), 81–88. Retrieved from Business Source Premier database.
Levin, H. J. (1980). Fact and fancy in television regulation: An economic study of policy alternatives. New York: Russell Sage Foundation.
131
Li, S. S., & Chiang, C. (2001). Market competition and programming diversity: A study on the TV market in Taiwan. The Journal of Media Economics, 14(2), 105–119. Retrieved from Communication & Mass Media Complete database.
Lin, C.A. (1995a). Diversity of network prime-time program formats during the 1980s. Journal of Media Economics, 8(4), 17–48. Retrieved from Communication & Mass Media Complete database.
Lin, C.A. (1995b). Network prime-time programming strategies in the 1980s. Journal of
Broadcasting & Electronic Media, 39, 482–495. Retrieved from Communication & Mass Media Complete database.
Litman, B. R. (1979). The television networks, competition, and program diversity. Journal of Broadcasting , 23 (4), 393–409. Retrieved from HeinOnline Law Jour Lopes, P.D. (1992). Innovation and diversity in the popular music industry, 1969 to 1990. American Sociological Review, 57(1), 56–71.
Litman, B. R., & Bridges, J. (1986). An Economic Analysis of Daily Newspaper Performance. Newspaper Research Journal, 7(3), 9–26. Retrieved from EBSCOhost.
Litman, B.., & Hasegawa, K. (1996). Measuring diversity in US television programming: New evidence. In S. Ishikawa (Ed.), Quality assessment of television (pp. 199–202). Luton, Bedfordshire: University of Luton Press.
Long, S.L. (1979). A fourth television network and diversity: Some historical evidence. Journalism Quarterly, 56, 341–345. Retrieved from Communication & Mass Media Complete database.
Lopes, P.D. (1992). Innovation and diversity in the popular music industry, 1969 to 1990. American Sociological Review, 57(1), 56–71.
McCombs, M. (1987). Effect of monopoly in Cleveland on diversity of newspaper content. Journalism Quarterly, 64(4), 740–792. Retrieved from Communication & Mass Media Complete database.
McCombs, M.E. (1988). Concentration, monopoly, and content. In R.G. Picard, J.P.
Winter, M.E. McCombs, & S. Lacy (Eds.), Press concentration and monopoly:
New perspectives on newspaper ownership and operation (pp. 129–137).
Norwood, NJ: Ablex.
McChesney, R.W. (2004a). The political economy of international communications . In P. Thomas & Z. Nain (Eds.), Who owns the media?: Global trends and local resistances (pp.3–22). London: Zed Books.
McChesney, R.W. (2004b). The problem of the media: US communication politics in the 21st century. New York: Monthly Review Press.
132
McDonald, D.G. & Dimmick, J. (2003). The conceptualization and measurement of diversity. Communication Research, 30(1), 60–79. doi:10.1177/0093650202239026.
McDonald, D.G. & Lin, S.F. (2004). The effect of new networks on U.S. television diversity. Journal of Media Economics, 17(2), 105–121. Retrieved from Communication & Mass Media Complete database.
McQuail, D. (1992). Media performance: Mass communication and the public interest. Newbury Park, CA: Sage.
Meier, W.A., & Trappel, J. (1998). Media concentration and the public interest. In D.
McQuail, & K. Siune (Eds.), Media policy: Convergence, concentration, and
commerce (pp. 38–59). London: Sage Publications.
Napoli, P.M. (1997). Rethinking Program Diversity Assessment: An Audience-Centered Approach. Journal of Media Economics, 10(4), 59. Retrieved from Communication & Mass Media Complete database.
Napoli, P.M. (1999). Deconstructing the diversity principle. Journal of Communication, 49(4), 7–34. doi:10.1111/j.1460-2466.1999.tb02815.x
Napoli, P.M. (2001a). Markets conditions and public affairs programming: implications for digital television policy. Harvard International Journal of Press/Politics, 6(2), 15–29.
Napoli, P.M. (2001b). Social responsibility and commercial broadcast television: An assessment of public affairs programming. JMM: The International Journal on Media Management, 3(4), 226–233.
Napoli, P.M. (2002, August). Television station ownership characteristics and commitment to public service: An analysis of public affairs programming. Paper presented at the annual meeting of the Association for Education in Journalism and Mass Communication, Miami, FL.
Napoli, P.M. (2003). Audience economics: Media institutions and the audience marketplace. New York: Columbia University Press.
Napoli, P. M. (2004). Television station ownership characteristics and news and public-affairs programming: An expanded analysis of FCC data. Info: The Journal of Policy, Regulation, and Strategy for Telecommunications, Information, and Media, 6(2), 112–121.
Napoli, P.M., & Yan, M. (2007). Media ownership regulations and local news programming on broadcast television: An empirical analysis. Journal of Broadcasting & Electronic Media, 51(1), 39–57. doi:10.1080/08838150701308010.
133
The Nielsen Company. (2009). Local Television Market Universe Estimates. Retrieved July 23, 2010 from http://blog.nielsen.com/nielsenwire/wp-content/uploads/2009/08/2009-2010-dma-ranks.pdf
Noam, E. M. (2009). Media ownership and concentration in America. Oxford: Oxford University Press.
Noll, R. G., Peck, M. J., & McGowan, J. J. (1973). Economic aspects of television
regulation. Washington: Brookings Institution.
Oba, G. (2004). A case study of program-type diversity in Japanese evening television. Keio Communication Review, 26, 101–121.
Owen, B. M., Beebe, J. H., & Manning, W. G. (1974). Television economics. Lexington, Mass: Lexington Books.
Owen, B. M. (1978). The economic view of programming. Journal of Communication, 28(2), 43–50.
Owen, B. M., & Wildman, S. S. (1992). Video economics. Cambridge, Massachusetts: Harvard University Press.
Park, S. (2005). Competition's Effects on Programming Diversity of Different Program Types. JMM: The International Journal on Media Management, 7(1/2), 39–54. doi:10.1207/s14241250ijmm0701&2_5
Pearson, S., & Shields, T. (2011, July 7). FCC’s rules on media cross-ownership are vacated by federal appeals court. Bloomberg. Retrieved from http://www.bloomberg.com/news/2011-07-07/federal-appeals-court-vacates-fcc-rules-on-media-ownership.html
Peterson, R.A., & Berger, D.G. (1975). Cycles in symbol production: The case of popular music. American Sociological Review, 40(1), 158–173.
Police v. Mosley, 408 U.S. 92 (1972).
Polinsky, H. (2007). The factors affecting radio format diversity after the Telecommunications Act of 1996: Ownership concentration, stations and audience. Journal of Radio Studies, 14(2), 122–143. doi:10.1080/10955040701583205
Powers, A. (2001). Toward monopolistic competition in U.S. local television news. Journal of Media Economics, 14(2), 77–86. Retrieved from Communication & Mass Media Complete database.
Powers, A., Kristjansdottir, H., & Sutton, H. (1994). Competition in Danish television news. Journal of Media Economics, 7(4), 21. Retrieved from Communication & Mass Media Complete database.
134
Project for Excellence in Journalism. (2003). Does ownership matter in local television news: A five year study of ownership and quality. Retrieved from http://www.journalism.org/node/243
Project for Excellence in Journalism. (2010). Ownership. In The state of the news media. Retrieved from http://stateofthemedia.org/2010/local-tv-summary-essay/ownership/
Rogers, R. P., & Woodbury, J. R. (1996). Market structure, program diversity, and radio audience size. Contemporary Economic Policy, 14(1), 81–91.
Rothenbuhler, E.W., & Dimmick, J.W. (1982). Popular music: Concentration and diversity in the industry, 1974-1980. Journal of Communication, 32(4), 143–149.
Schumpeter, J.A. (1950). Capitalism, socialism, and democracy (3rd ed.). New York: Harper and Row.
Schurz Communications, Incorporated v. Federal Communications Commission and the United States of America. 982 F.2d 1043. (7th Cir. 1992).
Scott, D., Gobetz, R., & Chanslor, M. (2008). Chain versus independent television station ownership: Toward an investment model of commitment to local news quality. Communication Studies, 59(1), 84–98. doi:10.1080/10510970701648624.
Shah, A. (2009, January 2). Media conglomerates, mergers, concentration of ownership. Retrieved from http://www.globalissues.org/article/159/media-conglomerates-mergers-concentration-of-ownership
Shannon, C.E., & Weaver, W. (1963). The mathematical theory of communication. University of Illinois Press.
Shepherd, W. G. (1970). Market power and economic welfare. New York: Random House.
Shepherd, W. G. (1979). The economics of industrial organization. Englewood Cliffs, NJ: Prentice Hall.
Shughart II, W.F. (2008). Industrial concentration. The Concise Encyclopedia of Economics. Library of Economics and Liberty. Retrieved November 23, 2009 from http://www.econlib.org/library/Enc/IndustrialConcentration.html
Siebert, F. S., Peterson, T., & Schramm, W. (1963). Four theories of the press: The authoritarian, libertarian, social responsibility, and Soviet communist concepts of what the press should be and do. Urbana: University of Illinois Press.
135
Smith, L.K. (2004). Consolidation and news content: How media ownership policy impacts local television news (Doctoral dissertation). Retrieved from http://repositories.lib.utexas.edu/bitstream/handle/2152/1264/smithl25339.pdf?sequence=2
Spavins, T.C., Denison, L., Roberts, S., & Frenette, J. (2002). The measurement of local television news and public affairs programs. Washington, DC: Federal Communications Commission. Retrieved September 24, 2010, from http://hraunfoss.fcc.gov/edocs_public/attachmatch/DOC-226838A12.pdf
Spence, A.M. & Owen, B.M. (1977). Television programming: Monopolistic competition and welfare. Quarterly Journal of Economics, 91(1), 103–126. Retrieved from Business Source Premier database.
Steiner, P. (1952). Program patterns and preferences, and the workability of competition
in radio broadcasting. Quarterly Journal of Economics, 66(2), 194–223. Retrieved
from Business Source Premier database.
Telecommunications Act of 1996, Pub. L. No 104–114, 110 Stat. 56 (1996).
Tribune Media Services. (2011). TV schedules (Version 5.2) [Data file]. Unpublished data set. Queensbury, NY: Author.
Tsourvakas, G. (2004). Public television programming strategy before and after competition: The Greek case. Journal of Media Economics, 17(3), 193–205. doi: 10.1207/s15327736me1703_5
United States v. O’Brien, 391 U.S. 367 (1968).
van der Wurff, R., & van Cuilenburg, J. (2001). Impact of moderate and ruinous competition on diversity: The Dutch television market. Journal of Media Economics, 14(4), 213–229. Retrieved from Communication & Mass Media Complete database.
van der Wurff, R. (2004). Program choices of multichannel broadcasters and diversity of program supply in the Netherlands. Journal of Broadcasting & Electronic Media, 48, 134–150.
Wakshlag, J., & Adams, W. J. (1985). Trends in program variety and the prime time access rule. Journal of Broadcasting and Electronic Media, 29, 23–34. Retrieved from HeinOnline Law Journal Library.
Webster, J. G., & Phalen, P. F. (1994). Victim, consumer, or commodity? Audience models in communication policy. In J. S. Ettema & D. C. Whitney (Eds.), Audiencemaking: How the media create the audience. Thousand Oaks, CA: Sage.
136
Wildman, S.S., & Owen, B.M. (1985). Program competition, diversity and multichannel bundle in the new video industry. In E. Noam (Ed.), Video Media Competition: Regulation, Economics and Technology. New York: Columbia University Press.
Wildman, S.S. Indexing diversity. In P.M. Napoli (Ed.). (2007). Media diversity and localism: Meaning and metrics (pp. 151–176). Mahwah, NJ: Lawrence Erlbaum Associates.
Williams, D. (2002). Synergy Bias: Conglomerates and Promotion in the News. Journal of Broadcasting & Electronic Media, 46(3), 453–472. doi:10.1207/s15506878jobem4603_8
Wimmer, R. D., & Dominick, J. R. (2006). Mass media research. Boston: Wadsworth.
Wirth, M.O. and Wollert, J.A. (1979). Public interest programming: Taxation by regulation. Journal of Broadcasting, 23(3), 319–330.
Wirth, M.O., & Wollert, J.A. (1984). The effects of market structure on television news pricing. Journal of Broadcasting, 28(2), 215–224.
Yan, M., & Napoli, P. (2006). Market competition, station ownership, and local public affairs programming on broadcast television. Journal of Communication, 56(4), 795-812. doi:10.1111/j.1460-2466.2006.00320.x.
Yan, M.Z. & Park, Y.J. (2009). Duopoly ownership and local informational programming on broadcast television: Before-after comparisons. The Journal of Broadcasting and Electronic Media, 53(3), 383–399. doi:10.1080/08838150903102709.

137
BIOGRAPHICAL SKETCH
Candace Holland was born in Charleston, West Virginia, but grew up in Crystal
River, Florida. She graduated summa cum laude with a Bachelor of Science in
telecommunication with a specialization in management from the University of Florida in
2009. She also received a minor in business administration. Upon completion of her
graduate coursework, she worked as a Market Research Analyst for Ypartnership, an
Orlando, Florida based advertising and public relations agency. She is currently
employed as a Communications Specialist at The Nielsen Company, the world’s largest
marketing and information company, where she also completed multiple internships
during her undergraduate studies.