Embed Size (px)
Citation preview
for inland navigation in Europe
OBSERVATIONMARKET
2006 - 2

Market Observation | for inland navigation in Europe
1
Market Observation 2006-2
Report on the economic situation – mid-2007
Market Observation | for inland navigation in Europe2
Declaration of refusal of liability
The knowledge, information or data contained in the present document is used at the exclusive risk of the user. The liability of the European Community, the Central Commission and its Secretariat cannot be invoked in the event of use of the knowledge, information or data contained in the present document, nor the resulting consequences. The present document does not constitute an official undertaking on the part of the Commissions.
September 2007

3
Contents
General introduction
Chapter 1: Overview of demand for transport in 2006 and 2007
1. Evolution of economic growth2. Demand for transport in the inland navigation sector in Europe3. Inland navigation in Europe4. Inland navigation by geographical area
4.1 Network of inland waterways - France4.2 Network of inland waterways - Belgium4.3 Network of inland waterways - Netherlands4.4 Network of inland waterways - Germany4.5 Danube basin4.6 Activity in sea ports
5. Evolution of inland navigation by economic sector5.1 Agriculture5.2 Energy
5.3Iron and steel products5.4 Sand, gravel, stones and construction materials
Chapter 2: Overview of the offer of transport
New capacity on the marketN it th k t
Chapter 3: Water conditions
1. Water conditions and operating capacity2. Water conditions on the Rhine3. Water conditions on the upper reaches of the Danube
Chapter 4: Economic aspects
1. Operation of vessels in 20051.1 Dry transport1.2 Tanker transport1.3 Evolution of operating costs
2. Conclusions and forecasts
Appendices
2. Evolution of inland navigation transport services3. Evolution of transport of containers in the various geographic sectors4. Glossary5. Sources

Market Observation | for inland navigation in Europe4

5
General introduction
of the micro-economic performance of transport using inland waterways. The general trends
report; pending more exact and more complete information with more thorough analyses, it offers an initial glimpse of inland navigation in the recent past.
The methodology for taking the micro-economic aspects into account was the subject of arecent exchange of views with professional navigation experts. To apply this aspect to theevaluation and take into account the market and the profession as a whole, including theirspecific geographic and sectorial characteristics, the monitoring instrument currently beingdrawn up will be developed and completed as relevant information and appreciations fromthe profession become available.
Particular attention is paid to evaluation of the operation of the capacity available on themarket. An instrument in the form of an economic model is currently being studied, as area number of evaluations. With regard to the waves of investment observed in the sectors of both dry transport and tanker transport and in the absence of any real withdrawal from themarket of tonnage that a priori has become obsolete, it is necessary to evaluate as precisely aspossible the development of offer in relation to demand for the market as a whole, inasmuch asthe fleet in the two main sectors continues to be allocated globally to the goods transported.
Monitoring the appearance of new structural over-capacity indeed remains one of the decisiveaspects of this observation. In the same spirit, it appears to be important to monitor theevolution of the climate and the consequences this may have for navigation and transport onfreely flowing inland waterways. Even if a large part of the network will not suffer notableeffects in terms of rainfall and water management, the Rhine and the Danube, which still
As in the previous publications, the present edition contains mainly information on thenetwork of inland waterways of western and central Europe. Taking account of informationon operation remains a concern inasmuch as, particularly in the Danube basin and with theexception of basic statistics, very few elements are surveyed systematically and regularly inthe geographic sector in question.

Market Observation | for inland navigation in Europe6
7
Chapter 1Overzicht van de vervoersvraag in 2006 en 2007
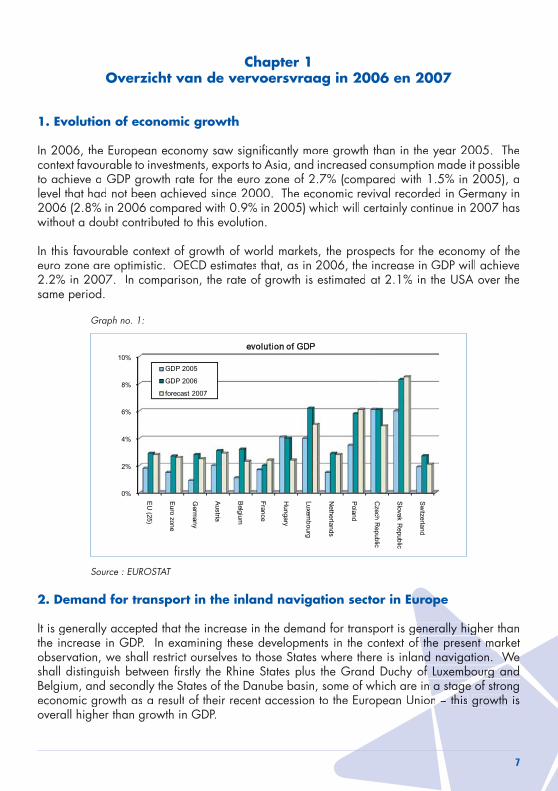
1. Evolution of economic growth
context favourable to investments, exports to Asia, and increased consumption made it possible
without a doubt contributed to this evolution.
In this favourable context of growth of world markets, the prospects for the economy of the
same period.
Graph no. 1:
0%
2%
4%
6%
8%
10%
EU
(25)
Euro
zone
Germ
any
Austria
Belgium
France
Hungary
Luxemb
ourg
Netherlands
Poland
Czech R
epublic
Slovak R
epublic
Sw
itzerland
evolution of GDP
GDP 2005
GDP 2006
forecast 2007
Source : EUROSTAT
2. Demand for transport in the inland navigation sector in Europe
It is generally accepted that the increase in the demand for transport is generally higher than enerally higthe increase in GDP. In examining these developments in the context of the present market the present mobservation, we shall restrict ourselves to those States where there is inland navigation. We nd navigation. We shall distinguish between firstly the Rhine States plus the Grand Duchy of Luxembourg and f Luxembourg urg and Belgium, and secondly the States of the Danube basin, some of which are in a stage on a stageage of strong
overall higher than growth in GDP.

Market Observation | for inland navigation in Europe8
Situation in the States of western Europe (Germany, Belgium, France, Grand Duchy of Luxembourg, Netherlands)
compared with the previous year. In France, on the other hand, rail freight transport has been regressing for a number of years. In general, demand for transport in these States has mainly been met by road and rail, whereas
Situation in the States of the Danube basin (Austria, Bulgaria, Croatia, Hungary, Romania, Serbia, Slovakia)
growth in this geographic sector. In this context, these States are currently showing a stronger increase in GDP and a proportionately higher development in the transport of goods. Thus
its flexibility, road transport is the main beneficiary of this. It should nevertheless be stressed that inland navigation also recorded honourable results.
Evolution in average performance of the various modes of transport
Danube area 2006/2004Inland navigationRail transportRoad transportWestern EuropeInland navigationRail transportRoad transport
Source : CEMT database
Situation in the States of central Europe (excluding the Danube basin)(Poland and Czech Republic)
In terms of economic growth, those States of central Europe where inland navigation exists are
road transport. Because of its infrastructure, however, inland navigation was not able to hold as strong a position as in the States of the Danube basin.

9
3. Inland navigation in Europe
Europe has been positive. The various geographic areas have seen varying levels of development;these have mainly been positive, but there have been occasional negative developments as well.More details will be given on this point later. Whereas the volumes transported on the Rhine
in containers. The development of world trade and the strong increase in exports, particularly from
through the sea ports of western Europe.This increase has not, however, produced a comparable increase in the transport of containers oninland navigation vessels. More detailed information on this point will be given later.
Graph no. 2
0
20000
40000
60000
80000
100000
120000
140000
(mio tkm)
2003 2004 2005 2006
services from inland navigation in Western Europe
international transport national transport
4. Inland navigation by geographical area
4.1 Network of inland waterways - France

Market Observation | for inland navigation in Europe10
waterways network. The evolution is particularly notable in the Paris basis, which recorded
representing almost 4 million tonnes.
4.2 Network of inland waterways - Belgium
waterways in Belgium at the time of drafting the present publication, the evolution of transport
The proportion occupied by inland navigation in the modal split in Belgium was relatively
4.3 Network of inland waterways - Netherlands
In the Netherlands, transport services on the inland waterways network increased by almost
transport services contributed to the increase in transport by inland waterway vessels in the
consequence of the bottleneck affecting the port of Rotterdam at the interface with transport by boat. In terms of handling in sea ports, however, the tonnage has increased significantly.
4.4 Network of inland waterways - Germany
whereas transport services were practically stagnant. The iron and steel products sector, in particular, benefited from the favourable situation of the world market. This was also the case
11
for the coal and coal-based products sector, which benefited from the increase in demand from the iron and steel sector and from power stations because of the high price of oil and oil-based products. In western Europe and particularly in Germany, inland navigation benefited from the upturn in the construction sector after a number of years of regression.
For tanker transport, demand increased throughout the year in the chemicals sector, which is
for transport for oil and oil-based products varied considerably because of the price of oil.
and from the sea ports of Amsterdam, Rotterdam and Antwerp are carried on this river.
difficulties encountered in the port of Rotterdam and to a lesser extent in the port of Antwerp.
more disappointing for inland navigation, particularly as the strong increase in the handling of
corresponding increase in transport on the inland waterways network. The proportion of inland
ports and their hinterland.
Market Observation | for inland navigation in Europe12
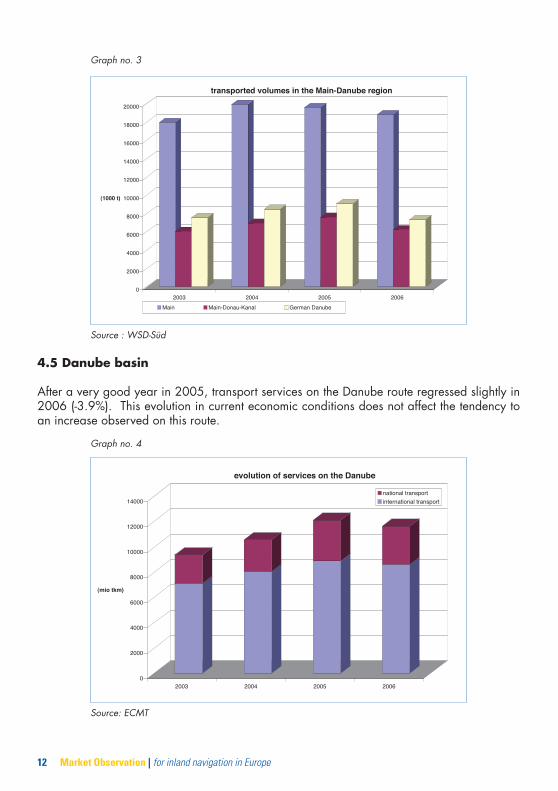
Graph no. 3
0
2000
4000
6000
8000
10000
12000
14000
16000
18000
20000
(1000 t)
6002500240023002
transported volumes in the Main-Danube region
Main Main-Donau-Kanal German Danube
Source : WSD-Süd
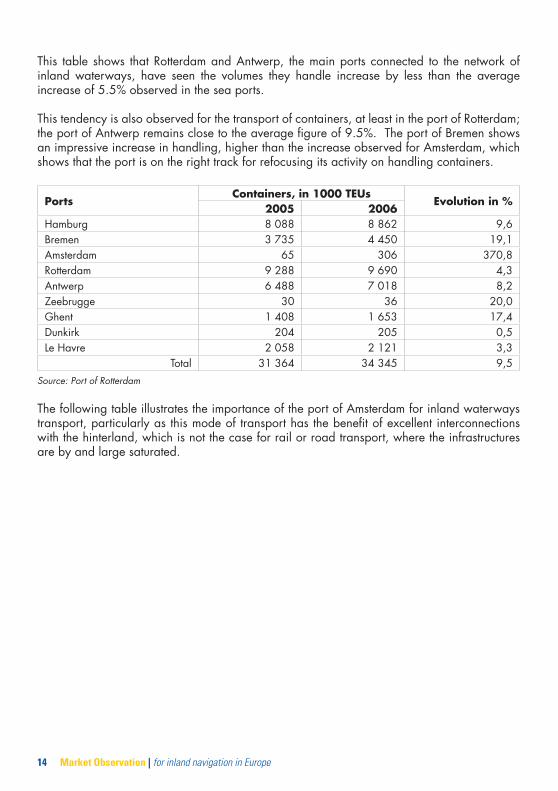
4.5 Danube basin
an increase observed on this route.
Graph no. 4
0
2000
4000
6000
8000
10000
12000
14000
(mio tkm)
2003 2004 2005 2006
evolution of services on the Danube
national transport
international transport
Source: ECMT

13
According to the forecasts for the evolution of demand for transport on this route, the potential
potential can only be developed if a number of bottlenecks hampering the development of inlandwaterways transport can be removed. The main problem here is the shallows that seriously limit the draught of vessels and often make it necessary to suspend the transport of goods duringperiods of low water. Projects for the development of the infrastructures are currently in hand on the Austrian part of
development measures aimed at converting the ports on the Danube into intermodal handlingpoints have also been approved.
evolution on the Rhine, the transport of containers on the Danube should develop gradually over
with a terminal specialising in handling containers and since that date has become an intermodal handling point.
4.6 Activity in the sea ports
As the German ports on the North Sea coast are developing considerably, it appears to be important for inland waterways transport and more particularly for navigation on the Rhine to keep an eye on the evolution of the ARA sea ports, as these are decisive in the matter of demand for transport in inland waterways. Transfers to other sea ports on the North Sea are scarcely of any benefit to inland navigation because of the current network of inland waterways.
The world context of strong economic growth and the use of increasingly large vessels for international transport by sea are reflected in the substantial increase in activity in the sea ports. The importance of the sea ports depends nevertheless on their connections with their hinterland for transport. If these connections are unsatisfactory, activity is transferred to othersea ports that are better served.
PortsGoods, in 1000 t
Evolution in %2005 2006
125 743 7,3Bremen 54 342Amsterdam 12,7Rotterdam 2,1Antwerp 167 3722 4,6Zeebrugge 22 222 24 143Ghent 34 557 4,214,Dunkirk 53 437 56 642
-1,6Total 5,5
Source: Port of Rotterdam
Market Observation | for inland navigation in Europe14
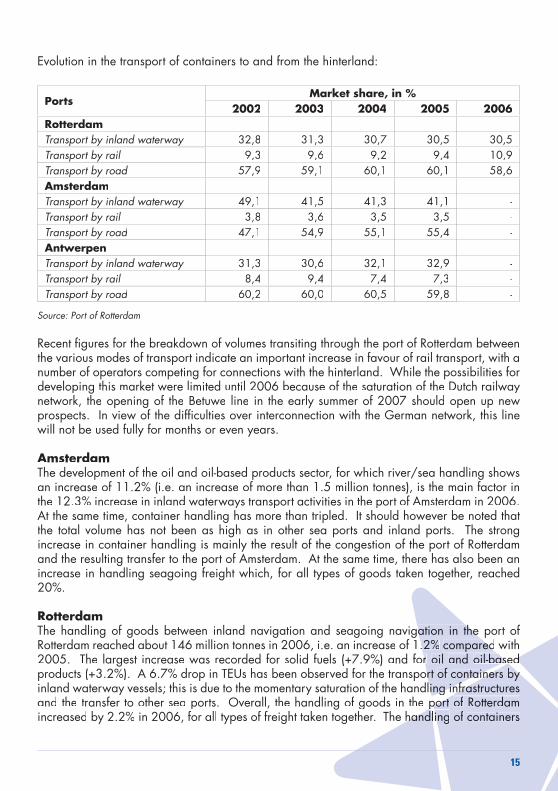
This table shows that Rotterdam and Antwerp, the main ports connected to the network of inland waterways, have seen the volumes they handle increase by less than the average
This tendency is also observed for the transport of containers, at least in the port of Rotterdam;
an impressive increase in handling, higher than the increase observed for Amsterdam, which shows that the port is on the right track for refocusing its activity on handling containers.
PortsContainers, in 1000 TEUs
Evolution in %2005 2006
Bremen 3 735Amsterdam 65Rotterdam 4,3AntwerpZeebrugge 36Ghent 1 653 17,4Dunkirk
2 121 3,3Total 31 364 34 345
Source: Port of Rotterdam
The following table illustrates the importance of the port of Amsterdam for inland waterways transport, particularly as this mode of transport has the benefit of excellent interconnections with the hinterland, which is not the case for rail or road transport, where the infrastructures are by and large saturated.
15
Evolution in the transport of containers to and from the hinterland:
PortsMarket share, in %
2002 2003 2004 2005 2006RotterdamTransport by inland waterway 31,3Transport by railTransport by roadAmsterdamTransport by inland waterway 41,5 41,3 41,1 -Transport by rail 3,6 3,5 3,5 -Transport by road 47,1 55,1 55,4 -AntwerpenTransport by inland waterway 31,3 32,1 -Transport by rail 7,4 7,3 -Transport by road -
Source: Port of Rotterdam
Recent figures for the breakdown of volumes transiting through the port of Rotterdam between the various modes of transport indicate an important increase in favour of rail transport, with a number of operators competing for connections with the hinterland. While the possibilities for
prospects. In view of the difficulties over interconnection with the German network, this line will not be used fully for months or even years.
AmsterdamThe development of the oil and oil-based products sector, for which river/sea handling shows
At the same time, container handling has more than tripled. It should however be noted that the total volume has not been as high as in other sea ports and inland ports. The strong increase in container handling is mainly the result of the congestion of the port of Rotterdam and the resulting transfer to the port of Amsterdam. At the same time, there has also been an increase in handling seagoing freight which, for all types of goods taken together, reached
RotterdamThe handling of goods between inland navigation and seagoing navigation in the port of ation in the
inland waterway vessels; this is due to the momentary saturation of the handling infrasing infnfrastructures

Market Observation | for inland navigation in Europe16
For oil and oil-based products, Rotterdam remains the main European port and there are plans to increase storage capacity there. The port of Rotterdam is also looking to a significant
with the rapid increase in the number of containers.
Antwerp
are connected with the handling of seagoing freight in the port of Antwerp, which recorded total
of the first half of the year. Apart from world growth and saturation of the port of Rotterdam, from which the port of Antwerp derived benefit, the growth is also the result of the opening of the Deurganck dock at the start of the year.
5. Evolution of inland navigation by economic sector
The indications given below concern mainly the Rhine basin and western Europe. This area has the highest transport volumes and benefits from the presence of heavy industry supplied by the ARA ports and which use the same ports for their exports. Although the economic situation of the various industries that use inland waterways transport is uniform on a European scale, the demand for transport by inland navigation vessel may vary from one region or industry to another.
5.1 Agriculture
the transport of other cereals increased. The transport of animal feed was also less, whereas
particularly the result of adapting crops to repeated periods of drought that affect the growth of certain plants and the interest in bio-energy and the growing of oleaginous plants, which will undoubtedly have an effect on demand for transport.

17
5.2 Energy
The tonnage of coal and coal-based products transported on the Rhine increased by more
steel industry operating at full capacity and the high level of consumption of steam coal by
During the same period, the transport of coal and coal-based products in the 25 Member
carried by inland waterways transport during the second half of the year.
a result of the particularly mild winter and the corresponding drop in the consumption of
There is a long-term trend towards an increase in the consumption of coal and coal-based
the sea ports. This tendency will be reflected by a structural increase in the tonnage carried on inland waterways, but there is still the possibility of temporary fluctuations in the demand for transport resulting from the current economic conditions.
Sector of oil and oil-based products
based products, which thus reached the level of 12 million tonnes.
The temporary drop in the price of oil on the world market observed between September and
the resulting low consumption of domestic fuel oil, as well as the requirement in Germany to ement
the prices of oil and oil-based products.
5.3 Iron and steel industry
The iron and steel sector continues to take advantage of strong European and world demand. nd world dd demand.
contributed to supporting demand for steel in Europe.
Market Observation | for inland navigation in Europe18
In view of the anticipated increase in world demand, although it will be less marked at the
appears to herald the start of a relative fall, despite strong demand for steel from European industry. This demand will also result in an increase in imports of steel. Thus the port of
of imported steel.
5.4 Sand, gravel, stone and construction materials
the lower Rhine area.The favourable evolution for the demand for transport for construction materials can be put down to the development of the market for construction and public works, particularly in Germany. Both the construction of housing and civil engineering companies benefit from this growth in this period of favourable economic circumstances. This tendency should continue
5.5 Chemicals
The forecasts are optimistic for this sector of the industry, in terms of both national demand and imports, so demand for transport ought to stay at the same level for the Rhine as well.
5.6 Transport of containers
For the transport of containers, despite the development of this type of transport in other river basins and on other transport routes than the Rhine, the traffic on the traditional Rhine provides decisive indications of market shares and the competitiveness of inland waterways transport .
1 Tables showing the evolution of container transport are given in Appendix 3.
19
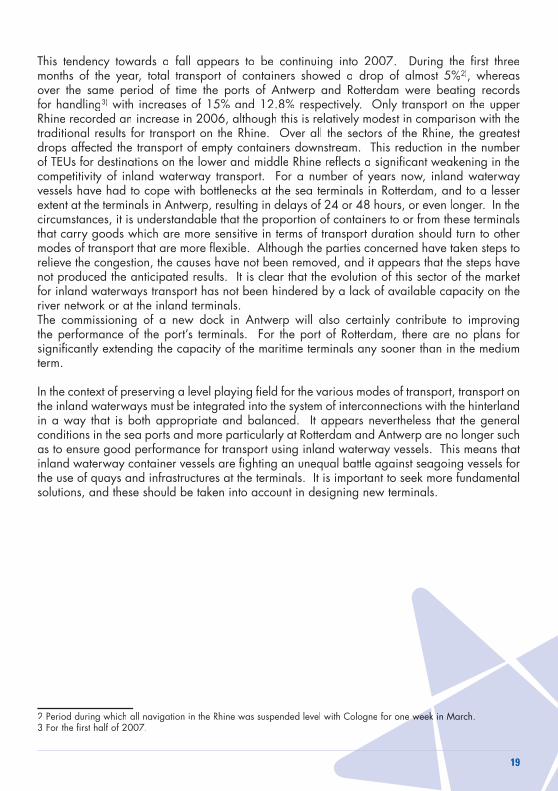
, whereasover the same period of time the ports of Antwerp and Rotterdam were beating recordsfor handling
drops affected the transport of empty containers downstream. This reduction in the number
competitivity of inland waterway transport. For a number of years now, inland waterway vessels have had to cope with bottlenecks at the sea terminals in Rotterdam, and to a lesser
circumstances, it is understandable that the proportion of containers to or from these terminals that carry goods which are more sensitive in terms of transport duration should turn to other modes of transport that are more flexible. Although the parties concerned have taken steps to relieve the congestion, the causes have not been removed, and it appears that the steps have not produced the anticipated results. It is clear that the evolution of this sector of the market for inland waterways transport has not been hindered by a lack of available capacity on the river network or at the inland terminals. The commissioning of a new dock in Antwerp will also certainly contribute to improving the performance of the port’s terminals. For the port of Rotterdam, there are no plans for significantly extending the capacity of the maritime terminals any sooner than in the medium term.
In the context of preserving a level playing field for the various modes of transport, transport on the inland waterways must be integrated into the system of interconnections with the hinterland in a way that is both appropriate and balanced. It appears nevertheless that the general conditions in the sea ports and more particularly at Rotterdam and Antwerp are no longer such as to ensure good performance for transport using inland waterway vessels. This means that inland waterway container vessels are fighting an unequal battle against seagoing vessels for the use of quays and infrastructures at the terminals. It is important to seek more fundamental solutions, and these should be taken into account in designing new terminals.

Market Observation | for inland navigation in Europe20

21
Chapter 2General overview of the offer of transport
New capacity on the marketThe evolution of the offer of transport on the market may be followed by referring to the new
there has been considerable activity in the shipyards, with production capacity being used to the full. For a variety of reasons, investment in transport capacity has been very high in recent years in this profession. In the dry goods sector, the situation may be qualified as satisfactory since it is adapted to the level of demand for transport and to the level of freight rates. These relatively advantageous operating conditions have allowed a renewal and the modernisation of the fleet, which is thus better suited to the demands of both the market.
The situation for tanker transport is somewhat different. While the recent past may also be qualified as satisfactory in terms of operation, it is above all the influence of new regulations and of the demands of shippers, particularly the oil companies, that make renewal of the fleet necessary.
of products in double-hulled vessels, the tanker navigation profession needs all its capacity to transform the fleet, which in future should comprise mainly double-hulled vessels. The
double-hulled vessels for almost all oil and oil-based products, on the basis of a transitional scheme spread over time. The market appears to be anticipating these new regulations, as some shippers are already imposing rules that go beyond the current regulations, particularly in terms of placing a limit on the age of the vessels used for the transport.
not available. As a result, the following table can only constitute an indication of the evolution of the offer on the market. More particularly, the number of 31 tanker vessels recorded for
The table also shows that the passenger vessel segment is a sustained activity. Both day trips,

Market Observation | for inland navigation in Europe22
Graph no. 5
2002 2003 2004 2005 2006 2002 2003 2004 2005 2006
0
40000
80000
120000
160000
200000
tonn
age
ogracdiuqilogracyrd
new capacities on the market
Source: IVR
Types of vessel2006 2007
number tonnage number tonnageself-propelled 42barges 23 5tankers 31 [44]*passenger vessels: - cruise- day excursion
12 [11]*
Source: IVR* : number of units forecast for 2007

23
Chapter 3Water conditions
1. Water conditions and operational capacity
The observation of water conditions is important in economic terms. The figures are given per day and in cm, but they are also converted into values for possible draught, which determines the theoretical loading capacity. The graphs below give the figures for the Kaub scale for the
For freight vessels of varying dimensions, this gives the following loading capacities according to draught.
according to vesseldimensions
Draught
1,50m 2,00m 2,50m 2,80m 3,50m
1 475t 2 225t
L : LengthB : Width
This figures show clearly the effect that water conditions have on the offer of transport. Periods of low water affect large vessels more particularly.
Market Observation | for inland navigation in Europe24
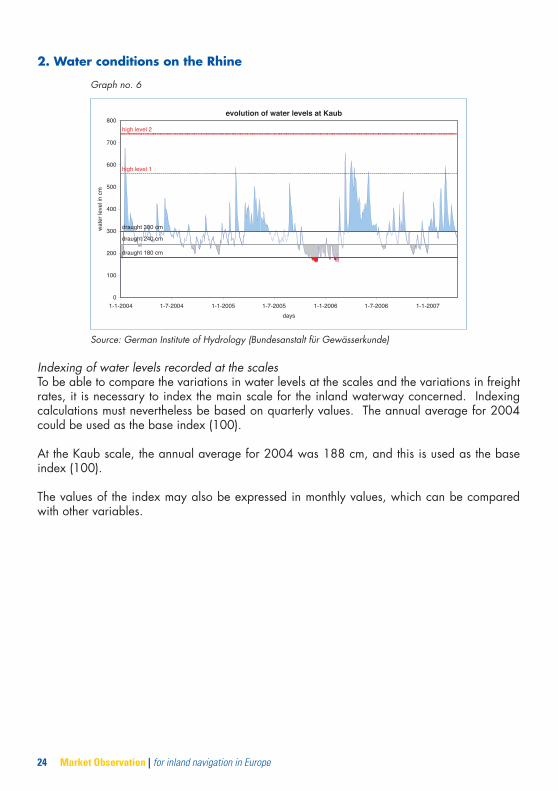
2. Water conditions on the Rhine
Graph no. 6
evolution of water levels at Kaub
0
100
200
300
400
500
600
700
800
1-1-2004 1-7-2004 1-1-2005 1-7-2005 1-1-2006 1-7-2006 1-1-2007
days
wat
er le
vel i
n cm
high level 2
high level 1
draught 300 cm
draught 240 cm
draught 180 cm
Source: German Institute of Hydrology (Bundesanstalt für Gewässerkunde)
Indexing of water levels recorded at the scalesTo be able to compare the variations in water levels at the scales and the variations in freight rates, it is necessary to index the main scale for the inland waterway concerned. Indexing
The values of the index may also be expressed in monthly values, which can be compared with other variables.
25
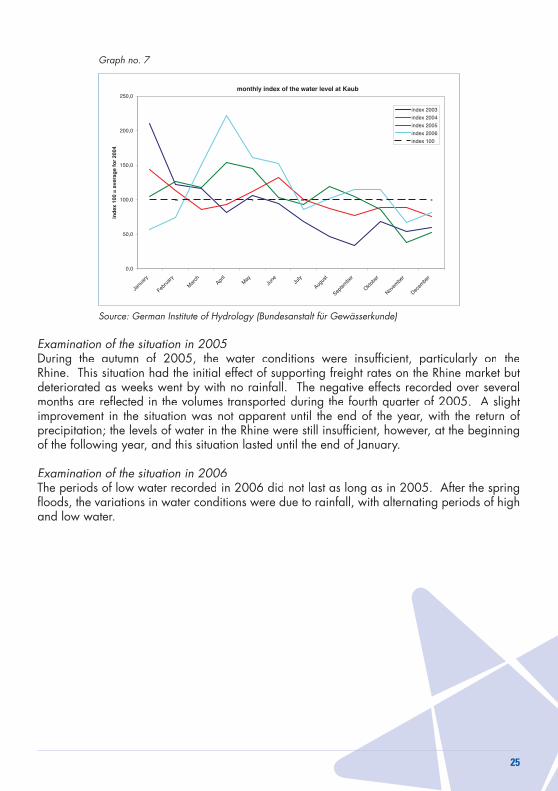
Graph no. 7
monthly index of the water level at Kaub
0,0
50,0
100,0
150,0
200,0
250,0
Janu
ary
Febru
ary
Mar
chApr
ilM
ayJu
ne July
Augus
t
Septe
mbe
r
Oktobe
r
Novem
ber
Decem
ber
ind
ex 1
00 =
ave
rag
e fo
r 20
04index 2003
index 2004
index 2005
index 2006
index 100
Source: German Institute of Hydrology (Bundesanstalt für Gewässerkunde)
Examination of the situation in 2005
Rhine. This situation had the initial effect of supporting freight rates on the Rhine market but deteriorated as weeks went by with no rainfall. The negative effects recorded over several
improvement in the situation was not apparent until the end of the year, with the return of precipitation; the levels of water in the Rhine were still insufficient, however, at the beginning of the following year, and this situation lasted until the end of January.
Examination of the situation in 2006
floods, the variations in water conditions were due to rainfall, with alternating periods of high and low water.
Market Observation | for inland navigation in Europe26
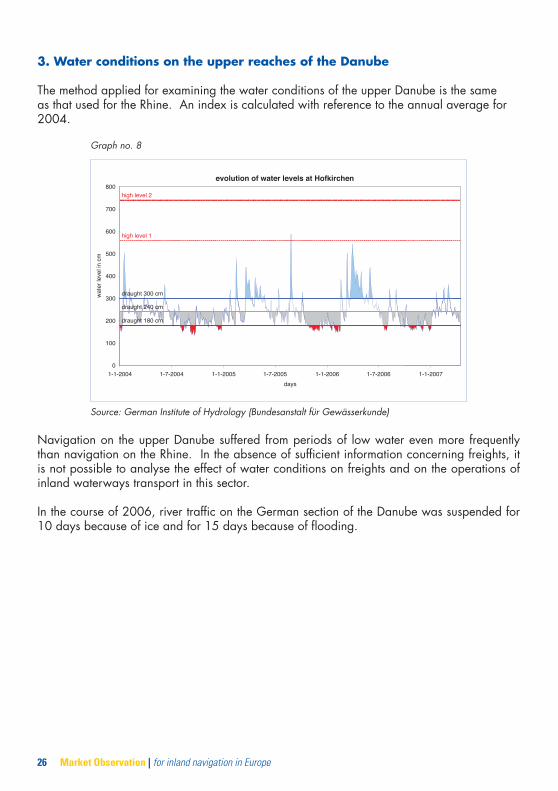
3. Water conditions on the upper reaches of the Danube
The method applied for examining the water conditions of the upper Danube is the same as that used for the Rhine. An index is calculated with reference to the annual average for
Graph no. 8
evolution of water levels at Hofkirchen
0
100
200
300
400
500
600
700
800
1-1-2004 1-7-2004 1-1-2005 1-7-2005 1-1-2006 1-7-2006 1-1-2007
days
wat
er le
vel i
n cm
high level 2
high level 1
draught 300 cm
draught 240 cm
draught 180 cm
Source: German Institute of Hydrology (Bundesanstalt für Gewässerkunde)
Navigation on the upper Danube suffered from periods of low water even more frequently than navigation on the Rhine. In the absence of sufficient information concerning freights, it is not possible to analyse the effect of water conditions on freights and on the operations of inland waterways transport in this sector.
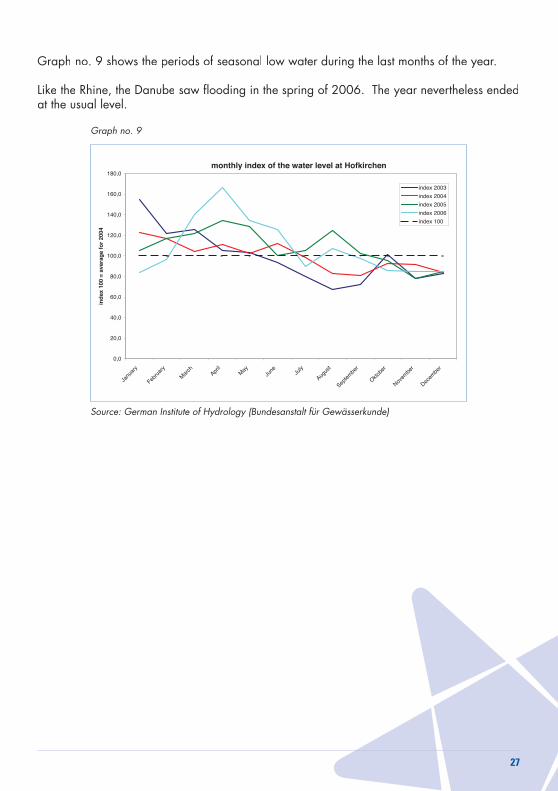
27
at the usual level.
Graph no. 9
monthly index of the water level at Hofkirchen
0,0
20,0
40,0
60,0
80,0
100,0
120,0
140,0
160,0
180,0
Janu
ary
Febru
ary
Mar
chApr
ilM
ayJu
ne July
Augus
t
Septe
mbe
r
Oktobe
r
Novem
ber
Decem
ber
ind
ex 1
00 =
ave
rag
e fo
r 20
04
index 2003
index 2004
index 2005
index 2006
index 100
Source: German Institute of Hydrology (Bundesanstalt für Gewässerkunde)

Market Observation | for inland navigation in Europe28
29
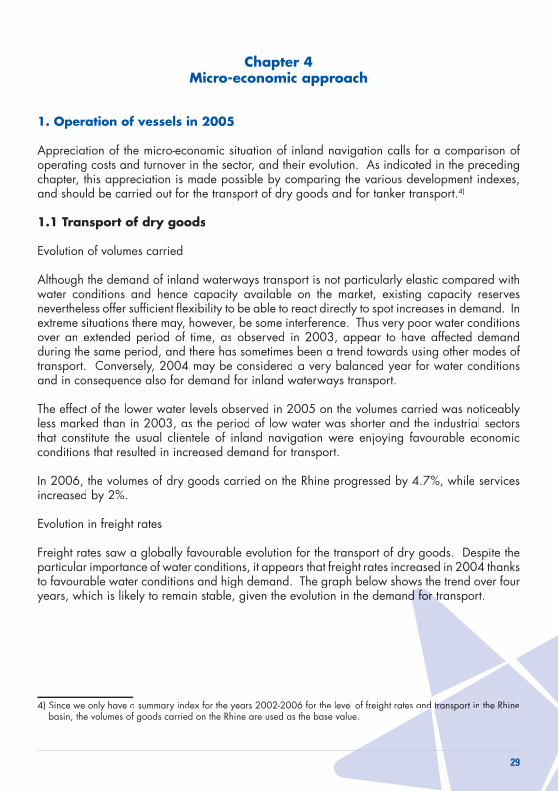
Chapter 4Micro-economic approach
1. Operation of vessels in 2005
Appreciation of the micro-economic situation of inland navigation calls for a comparison of operating costs and turnover in the sector, and their evolution. As indicated in the preceding chapter, this appreciation is made possible by comparing the various development indexes, and should be carried out for the transport of dry goods and for tanker transport.
1.1 Transport of dry goods
Evolution of volumes carried
Although the demand of inland waterways transport is not particularly elastic compared with water conditions and hence capacity available on the market, existing capacity reserves nevertheless offer sufficient flexibility to be able to react directly to spot increases in demand. In extreme situations there may, however, be some interference. Thus very poor water conditions
during the same period, and there has sometimes been a trend towards using other modes of
and in consequence also for demand for inland waterways transport.
that constitute the usual clientele of inland navigation were enjoying favourable economic conditions that resulted in increased demand for transport.
Evolution in freight rates
Freight rates saw a globally favourable evolution for the transport of dry goods. Despite the
to favourable water conditions and high demand. The graph below shows the trend over four years, which is likely to remain stable, given the evolution in the demand for transport.d for tr
basin, the volumes of goods carried on the Rhine are used as the base value.

Market Observation | for inland navigation in Europe30
Graph no. 10
quarterly evolution of the freight index for dry cargo
0
40
80
120
160
200
2002-1 2002-2 2002-3 2002-4 2003-1 2003-2 2003-3 2003-4 2004-1 2004-2 2004-3 2004-4 2005-1 2005-2 2005-3 2005-4 2006-1 2006-2 2006-3 2006-4 2007-1
inde
x 10
0 =
ave
rage
for
2004
freight indexes Trend
Source: NEA; CCNR Secretariat
Occupation level
The relative flexibility of the various markets, both geographic and in terms of the variety of goods carried, makes it difficult to represent the level of operation for the transport of dry goods. In addition, day-to-day operation varies more or less according to vessel dimensions and operating modes.
Seasonal aspects aside, the variations in demand for the transport of dry goods are not
not always optimal. The market for the transport of cereals is a good example of this. The
make full use of the capacity of a large vessel.
In general, the transport of dry goods shows that the commissioning of new vessels makes it possible to increase available capacity in proportion to the volumes carried. This evolution is set against a background of increased freight rates in the past few years.
These elements make it possible to state that the market and more particularly the occupation rate of vessels is evolving positively. The occupation rate could, however, be improved in certain segments by optimising procedures and transport.

31
Production/yield from the transport of dry goods The performance achieved by inland waterways transport is the result of the combination of the volumes carried and the freight rate. Examination of these two factors shows that, because of the long period of low water and despite the resulting restrictions on volumes carried, the
of the average freight rate dropped.
as “average” with, at the same time, a slight increase in operating costs due to the increase in the price of diesel.
Graph no. 11 reflects the interaction of water conditions, volumes carried and freight rates in a context of high demand for transport.
Graph no. 11
quartely evolution of the indexes for volumes, freight levels and water levels (dry cargo)
0
50
100
150
200
2003-1 2003-2 2003-3 2003-4 2004-1 2004-2 2004-3 2004-4 2005-1 2005-2 2005-3 2005-4 2006-1 2006-2 2006-3 2006-4 2007-1
inde
xes
index for volumes
index for freights
index der Water conditions
Source : CCNR Secretariat

Market Observation | for inland navigation in Europe32
Graph no. 12
quarterly evolution of the indexes for water level and production/yield on the dry cargo market
0
25
50
75
100
125
150
175
200
2003-1 2003-2 2003-3 2003-4 2004-1 2004-2 2004-3 2004-4 2005-1 2005-2 2005-3 2005-4 2006-1 2006-2 2006-3 2006-4 2007-1
inde
x va
lues
production index
index for water conditions
Source : CCNR Secretariat
rates and an increase in the volumes carried, despite the poor water conditions observed in
three years under examination in the present study, despite the increase in operating costs produced by the increase in the price of diesel.
1.2 Tanker transport
Demand for the transport of oil and oil-based products, which represents two-thirds of the volumes carried on the Rhine, showed important fluctuations. These variations were partly seasonal, but they were also the result of the variation in the price of oil on the world market and the level of stocks in the European States. Demand for the transport of chemicals, which represents about one-third of the volumes carried by tanker, was more stable.
Evolution in the volumes carried5
sector of the economy and has taken the form, over the past few years, of a regular increase in demand for transport.
transport of petrol and domestic fuel / diesel. We have detailed representative data for the evolution of freight rates for these two types of cargo. Since the micro-economic analysis carried out as part of the present market observation is based on the comparison of several representative factors likely to provide indications of trends in the general situation of this mode of transport, this paragraph will merely be an analysis, in the form of an index, of the volumes carried for these

33
two types of cargo on the transport routes taken into account in analysing freight rates.
Index of volumes carried
2003 2004 2005 2006
Petrol Fuel oil Petrol Fuel oil Petrol Fuel oil Petrol Fuel oil
Transport routes
ARA – Duisburg 147 136 100 100 98 108 44 119
ARA – Dortmund ns 216 100 100 698 130 190 170
ARA – Cologne 159 402 100 100 112 34 137 27
ARA – Frankfurt 542 142 100 100 ns 157 ns 167
ARA – Karlsruhe 40 111 100 100 83 103 86 224
ARA – Basle 190 134 100 100 61 119 27 111
Global index 174 140 100 100 170 144 96 156
n.s.: not significantSource: CCNR Secretariat, on the basis of CBS indications
The global index is determined by weighting each transport route on the basis of the volumes
Evolution in the level of freight rates
times considerable, as a result of both strong demand for transport and water conditions that, over a relatively long period of time, did not allow optimum operation of the capacity available.
Index of volumes carried
2003 2004 2005 2006
Petrol Fuel oil Petrol Fuel oil Petrol Fuel oil Petrol Fuel oil
Transport routes
ARA – Duisburg 184 191 100 100 136 139 158 163
ARA – Dortmund 156 159 100 100 124 126 140 142
ARA – Cologne 161 163 100 100 134 135 156 159
ARA – Frankfurt 163 165 100 100 151 152 158 160
ARA – Karlsruhe 158 160 100 100 149 150 15515 157
ARA – Basle 162 183 100 100 146 147 150 151
Global index 174 170 100 100 140 144 156 154
Source: CCNR Secretariat – P J K International b.v.
Market Observation | for inland navigation in Europe34
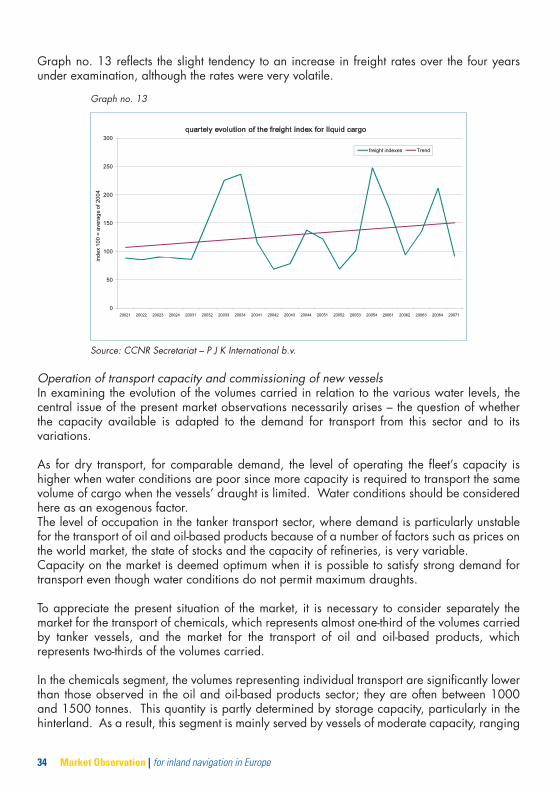
Graph no. 13 reflects the slight tendency to an increase in freight rates over the four years under examination, although the rates were very volatile.
Graph no. 13
0
50
100
150
200
250
300
20021 20022 20023 20024 20031 20032 20033 20034 20041 20042 20043 20044 20051 20052 20053 20054 20061 20062 20063 20064 20071
ind
ex
10
0 =
ave
rag
e o
f20
04
quartely evolution of the freight index for liquid cargo
freight indexes Trend
Source: CCNR Secretariat – P J K International b.v.
Operation of transport capacity and commissioning of new vesselsIn examining the evolution of the volumes carried in relation to the various water levels, the
the capacity available is adapted to the demand for transport from this sector and to its variations.
As for dry transport, for comparable demand, the level of operating the fleet’s capacity is higher when water conditions are poor since more capacity is required to transport the same volume of cargo when the vessels’ draught is limited. Water conditions should be considered here as an exogenous factor.The level of occupation in the tanker transport sector, where demand is particularly unstable for the transport of oil and oil-based products because of a number of factors such as prices on the world market, the state of stocks and the capacity of refineries, is very variable.
transport even though water conditions do not permit maximum draughts.
To appreciate the present situation of the market, it is necessary to consider separately the market for the transport of chemicals, which represents almost one-third of the volumes carried by tanker vessels, and the market for the transport of oil and oil-based products, which represents two-thirds of the volumes carried.
In the chemicals segment, the volumes representing individual transport are significantly lower
hinterland. As a result, this segment is mainly served by vessels of moderate capacity, ranging

35
to be made available rapidly.
large volumes, the largest units being operated at full load when demand and water conditions permit. During periods of low water and strong demand, small vessels become more interesting because they remain operational for longer without their loading capacity being affected.
An endogenous factor in the operation of capacity is the new vessels put into service with the prospect of the regulations being made stricter. In order to take into account new criteria for protecting the environment, a new classification of substances is being considered, as is the allocation of substances to vessels that correspond to the various safety standards. In this context, a new type of double-hulled vessel for the transport of those substances considered to be the most dangerous for the environment has been designed. In fact, for almost all substances assimilated to oil and oil-based products, use of this type of vessel will gradually become a requirement. The profession has therefore already begun to prepare for these
that of the existing fleet, which means that the fleet has been extended considerably. At the same time, very few vessels have been withdrawn from the market to leave room for this new capacity, whereas demand in the oil and oil-based products sector has tended rather to stagnate or even drop back slightly. Although there is as yet no tendency to structural overcapacity, the behaviour of the market in the present situation, which is characterised by moderate demand and optimum water conditions, reflects nevertheless a degree of saturation. In view of the large number of vessels already announced in the medium term, particular attention should be paid to monitoring capacity in this segment.
commissioned are able to carry chemicals, and therefore greater internal competition could be expected here.

Market Observation | for inland navigation in Europe36
Production/yield for tanker transportGraph no. 14 highlights the symmetry of the level of freight rates and water conditions.
Graph no. 14
quartely evolution of the indexes for volumes, freights and water levels(liquid cargo)
0
50
100
150
200
250
300
2003-1 2003-2 2003-3 2003-4 2004-1 2004-2 2004-3 2004-4 2005-1 2005-2 2005-3 2005-4 2006-1 2006-2 2006-3 2006-4 2007-1
inde
xes
index for volumes
index for freights
index der Water conditions
Source: CCNR Secretariat
Graph no. 15 gives a general overview of the evolution of the operating performance of transport by tanker vessels in relation to water conditions.
Graph no. 15
quarterly evolution of the indexes for water level and production/yield on the liquid cargo market
0
50
100
150
200
250
300
350
2003-1 2003-2 2003-3 2003-4 2004-1 2004-2 2004-3 2004-4 2005-1 2005-2 2005-3 2005-4 2006-1 2006-2 2006-3 2006-4 2007-1
inde
x va
lues
production index
index for water conditions

37
of oil and oil-based products. The first half of the year was marked by strong demand for transport, and this continued until the summer. Demand then dropped because of the increase in oil prices. Freight rates stayed at a high level because of the poor water conditions.
in a low level for freight rates. Even the seasonal increase in demand in the last quarter had only
in occupation because of anticipated purchases of stocks in view of the constant increase in oil prices. Water conditions were not sufficient to allow the operation of vessels at full loading capacity but this did not have any effect on the volumes carried, although freight rates increased significantly.
1.3 Evolution in operating costs
Structure of costs for freight vessels
2004Vessels for dry goods
IndividualsTanker vessels
Companies
Fuel costs
Personnel costs
Source: CCNR Secretariat
The structure of costs is merely indicative, and refers to a vessel of approximately
2003 2004 2005
Fuel costs
Personnel costs
Source: CCNR Secretariat

Market Observation | for inland navigation in Europe38
operating costs. Part of the consequences of this increase in costs, which cannot, however, be determined precisely, has been attenuated by the application of clauses included in transport contracts.
Graph no. 16
0
10
20
30
40
50
60
January February March April May June July August September Oktober November December
mo
nth
lyav
erag
efo
r10
0l
evolution of the gasoil prices
values 2003
values 2004
values 2005
values 2006
Source: CBRB
Graph no. 16 shows the increase in the price of diesel over a period of three years.
This data is indicative of these analyses. In the market, prices are negotiated and the variation
trends remain unchanged.
Annual averages
Year 2002 2003 2004 2005 2006Price of 100 litres of
diesel 46,67 52,12
Source: CBRB
It should be emphasised that, despite a downward trend in the price of diesel during the third
expected for the maintenance heading, because of strong demand at shipyards, which are currently saturated, combined with an increase in the price of spare parts.
39
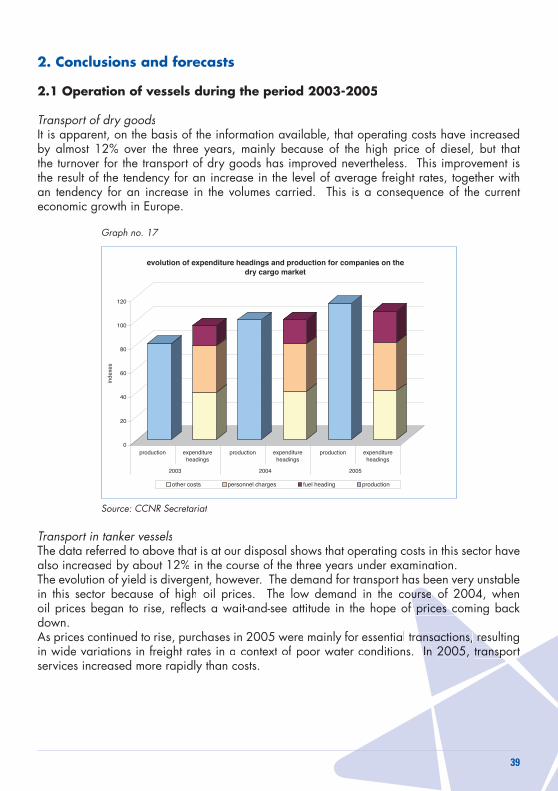
2. Conclusions and forecasts
2.1 Operation of vessels during the period 2003-2005
Transport of dry goodsIt is apparent, on the basis of the information available, that operating costs have increased
the turnover for the transport of dry goods has improved nevertheless. This improvement is the result of the tendency for an increase in the level of average freight rates, together with an tendency for an increase in the volumes carried. This is a consequence of the current economic growth in Europe.
Graph no. 17
0
20
40
60
80
100
120
inde
xes
production expenditureheadings
production expenditureheadings
production expenditureheadings
500240023002
evolution of expenditure headings and production for companies on the dry cargo market
other costs personnel charges fuel heading production
Source: CCNR Secretariat
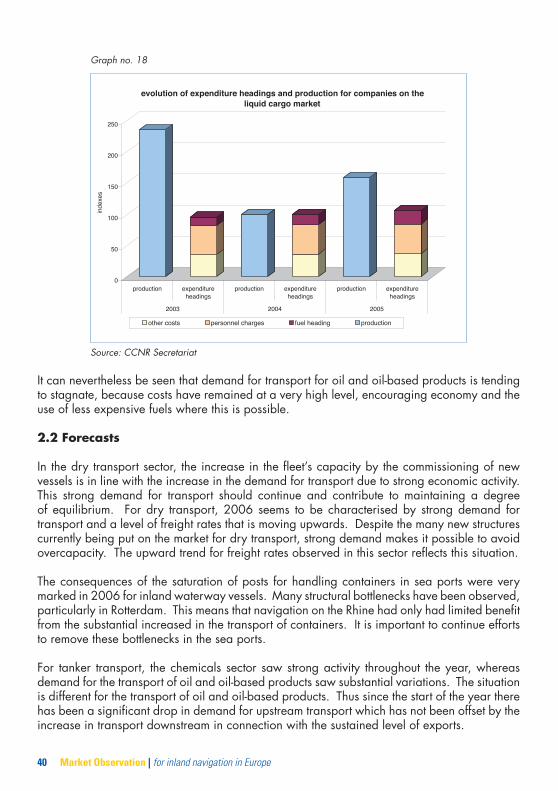
Transport in tanker vesselsThe data referred to above that is at our disposal shows that operating costs in this sector have
The evolution of yield is divergent, however. The demand for transport has been very unstable
oil prices began to rise, reflects a wait-and-see attitude in the hope of prices coming back prices cdown.
services increased more rapidly than costs.
Market Observation | for inland navigation in Europe40
Graph no. 18
0
50
100
150
200
250
inde
xes
production expenditureheadings
production expenditureheadings
production expenditureheadings
500240023002
evolution of expenditure headings and production for companies on the liquid cargo market
other costs personnel charges fuel heading production
Source: CCNR Secretariat
It can nevertheless be seen that demand for transport for oil and oil-based products is tending to stagnate, because costs have remained at a very high level, encouraging economy and the use of less expensive fuels where this is possible.
2.2 Forecasts
In the dry transport sector, the increase in the fleet’s capacity by the commissioning of new vessels is in line with the increase in the demand for transport due to strong economic activity. This strong demand for transport should continue and contribute to maintaining a degree
transport and a level of freight rates that is moving upwards. Despite the many new structures currently being put on the market for dry transport, strong demand makes it possible to avoid overcapacity. The upward trend for freight rates observed in this sector reflects this situation.
The consequences of the saturation of posts for handling containers in sea ports were very
particularly in Rotterdam. This means that navigation on the Rhine had only had limited benefit from the substantial increased in the transport of containers. It is important to continue efforts to remove these bottlenecks in the sea ports.
For tanker transport, the chemicals sector saw strong activity throughout the year, whereas demand for the transport of oil and oil-based products saw substantial variations. The situation is different for the transport of oil and oil-based products. Thus since the start of the year there has been a significant drop in demand for upstream transport which has not been offset by the increase in transport downstream in connection with the sustained level of exports.

41
In combination with the arrival on the market of a considerable number of new vessels, freight rates stagnated throughout the year at a level considered as the lowest the market could bear. This situation is evidence of very strong internal competition, produced not only by the conditions already mentioned but also by very balanced water conditions. This seems to constitute an indication of the emergence of overcapacity in this segment of the market. The inland waterways profession does not seem to be able to maintain a respectable level
possible to better determine current conditions for tanker transport in the light of traditionally
are lower than average. Although the autumn may in this way compensate in part for a year that has until now been completely uninteresting, the medium-term prospects remain morose.
expected whereas there is no sign of a similar evolution in demand.

Market Observation | for inland navigation in Europe42

43
Appendices
1. Offer of transport capacityTable of new vessels
Type of vessel
2002 2003 2004 2005
Number Capacity Number Capacity Number Capacity Number Capacity
Vessels for dry goodsPush barges
45 113 114 3414
71 32623 636
3412
Total 74 150 294 62 167 832 42 94 962 46 99046
Tanker vesselsTanker push barges
222
451
131 455 543 2 427
462 2527
Total 24 65 726 46 133 255 57 142 145 48 133387
Pusher tugsTugs
23 1
11
Total 5 1 2 0
Day-trip boats17
151
55
Total 26 11 6 10
Type of vesseltotal 2002 - 2005
Number Capacity
Vessels for dry goodsPush barges
141 361761
Total 224 512134
Tanker vesselsTanker push barges
167
Total 175 474513
Pusher tugsTugs
35
Total 8
Day-trip boats3716
Total 53 40684
Source: IVR

Market Observation | for inland navigation in Europe44
2. Evolution of transport services for inland waterways transport
CountryType of transport 2005 2006 Evolution in %
in million Tkm
Germany National
International 52745,2
Total 64095,6 63975,2 -0,2%
Austria National 37,3 137,3
International 1715,2
Total 1752,5 1837,2 4,8%
Belgium National 3067,0
International 5651,0
Total 8718,0 8718,0 0,0%
Bulgaria National 54,1
International
Total 754,7 759,4 0,6%
Croatia National
International
Total 118,6 116,4 -1,9%
France National
International
Total 7857,0 7952,0 1,2%
Hungary National
International
Total 2110,0 1898,0 -10,0%
G.D. Luxembourg (*) National
International
Total 342,0 380,0 11,1%
Netherlands National 10624,2
International 32873,5
Total 43067,0 43497,7 1,0%
Poland National
International
Total 639,8 689,5 7,8%
Czech Republic National 14,6
International 33,3 27,7
Total 93,5 42,3 -54,8%
Romania National
International
Total 5146,0 4957,0 -3,7%
Serbia National 454,2
International 1321,6
Total 1486,7 1703,5 14,6%
45
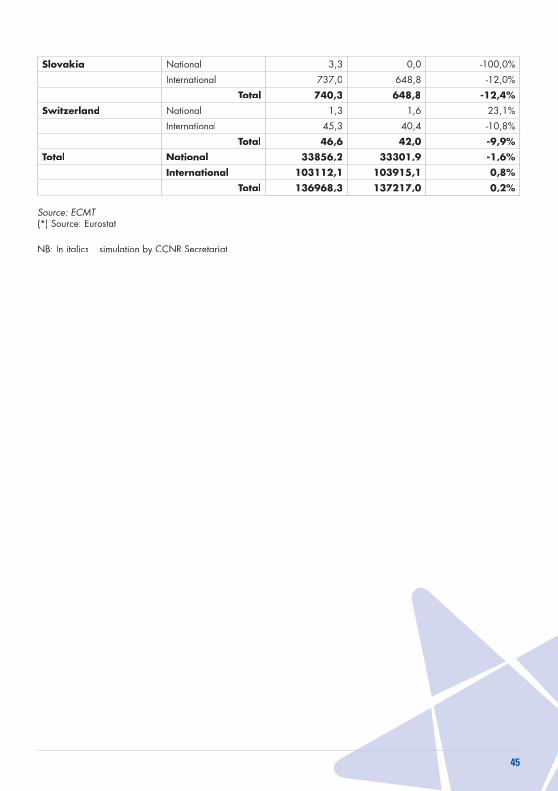
Slovakia National 3,3
International
Total 740,3 648,8 -12,4%
Switzerland National 1,3 1,6
International 45,3
Total 46,6 42,0 -9,9%
Total National 33856,2 33301,9 -1,6%
International 103112,1 103915,1 0,8%
Total 136968,3 137217,0 0,2%
Source: ECMT
Market Observation | for inland navigation in Europe46
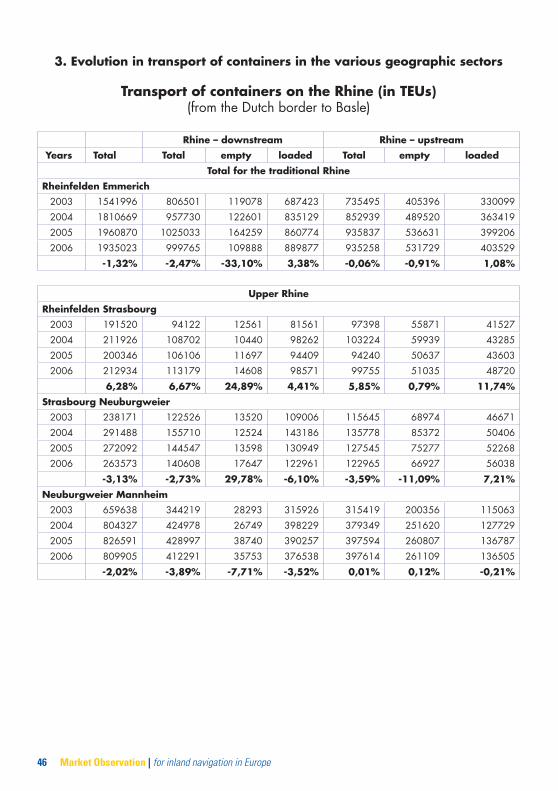
3. Evolution in transport of containers in the various geographic sectors
Transport of containers on the Rhine (in TEUs)
Rhine – downstream Rhine – upstream
Years Total Total empty loaded Total empty loaded
Total for the traditional Rhine
536631
-1,32% -2,47% -33,10% 3,38% -0,06% -0,91% 1,08%
Upper Rhine
12561 41527
6,28% 6,67% 24,89% 4,41% 5,85% 0,79% 11,74%
122526 115645 46671
12524
144547 127545 75277
263573 17647
-3,13% -2,73% 29,78% -6,10% -3,59% -11,09% 7,21%
35753
-2,02% -3,89% -7,71% -3,52% 0,01% 0,12% -0,21%

47
Middle Rhine
-3,80% -7,40% -43,88% -1,08% 0,21% 0,73% -0,54%
562142 316625
353477
-4,73% -7,09% -42,45% -1,28% -2,11% -2,62% -1,32%
Lower Rhine
641434
145651
-2,23% -3,71% -41,19% 2,92% -0,60% -1,32% 0,36%
1745474 362413
-0,48% -0,49% -25,45% 3,27% -0,47% -1,89% 1,40%
Source: St BA, Wiesbaden
Market Observation | for inland navigation in Europe48
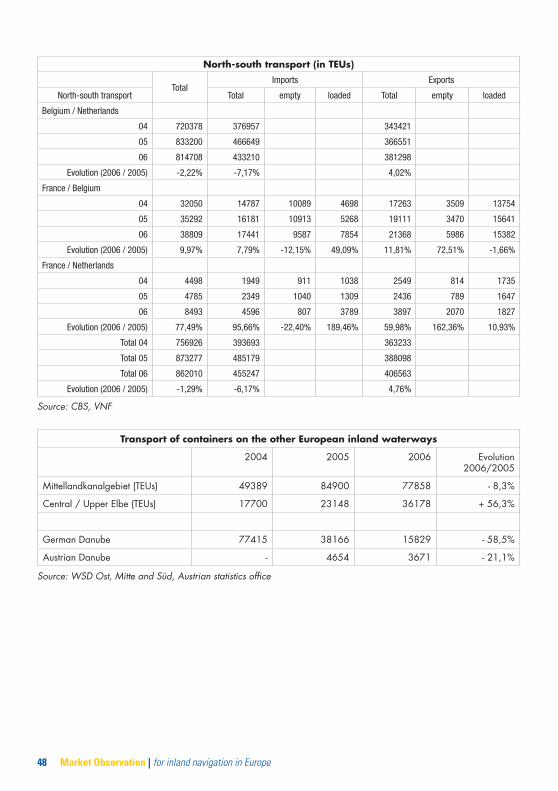
North-south transport (in TEUs)
TotalImports Exports
North-south transport Total empty loaded Total empty loaded
Belgium / Netherlands
04 720378 376957 343421
05 833200 466649 366551
06 814708 433210 381298
Evolution (2006 / 2005) -2,22% -7,17% 4,02%
France / Belgium
04 32050 14787 10089 4698 17263 3509 13754
05 35292 16181 10913 5268 19111 3470 15641
06 38809 17441 9587 7854 21368 5986 15382
Evolution (2006 / 2005) 9,97% 7,79% -12,15% 49,09% 11,81% 72,51% -1,66%
France / Netherlands
04 4498 1949 911 1038 2549 814 1735
05 4785 2349 1040 1309 2436 789 1647
06 8493 4596 807 3789 3897 2070 1827
Evolution (2006 / 2005) 77,49% 95,66% -22,40% 189,46% 59,98% 162,36% 10,93%
Total 04 756926 393693 363233
Total 05 873277 485179 388098
Total 06 862010 455247 406563
Evolution (2006 / 2005) -1,29% -6,17% 4,76%
Source: CBS, VNF
Transport of containers on the other European inland waterways
Evolution
German Danube 77415
Austrian Danube - 4654 3671
Source: WSD Ost, Mitte and Süd, Austrian statistics office
49
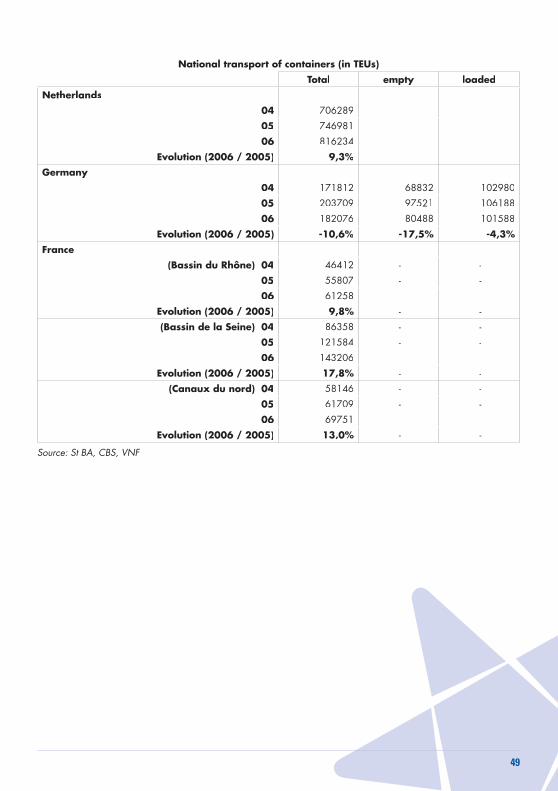
National transport of containers (in TEUs)
Total empty loaded
Netherlands
04
05
06
Evolution (2006 / 2005) 9,3%
Germany
04
05
06
Evolution (2006 / 2005) -10,6% -17,5% -4,3%
France
(Bassin du Rhône) 04 46412 - -
05 - -
06
Evolution (2006 / 2005) 9,8% - -
(Bassin de la Seine) 04 - -
05 - -
06
Evolution (2006 / 2005) 17,8% - -
(Canaux du nord) 04 - -
05 - -
06
Evolution (2006 / 2005) 13,0% - -
Source: St BA, CBS, VNF
Market Observation | for inland navigation in Europe50
4. Glossarium
20-foot Equivalent Units (TEUs)to their dimensions and for the description of the capacity of container vessels and terminals.
ARA ports: Abbreviation for the three major European ports of Amsterdam, Rotterdam and Antwerp.
Downstream navigation: navigation downriver
Downstream: Refers to the part of an inland waterway located between a given point and the embouchure or confluence.
Draught
Dry hold
Freight: Refers to goods being transported or the price of transport.
Handling: Transshipment of goods from one means of transport to another.
Holdto be transported.
Inland navigation / inland waterways transport: Transport of goods or persons on board a vessel intended for transport on a given network of inland waterways.
Inland waterway: Navigable inland waterways that may be used with a normal load by
lakes and canals.
Offer of transport or of capacity: Total loading capacity of the available fleet, expressed in tonnes.
Production/yield: The notion of production/yield as used in this publication is intended to define in index form the activity of inland waterways transport, taking into account a given level of demand and the freight rates applied on the market.
River/sea transport
network.
Service: Refers to the service of the transport of goods, expressed in tonnes/kilometre.
Tanker hold
51
Tonnes/kilometre (Tkm)( )transport of one tonne over one kilometre of an inland waterway. Determined by multiplying the volume carried in tonnes by the distance travelled in kilometres.
Transshipmentpanother seagoing freight vessel, even if the cargo has remained on land for any length of time before the transport continues.
Upstream navigationp g : Navigation travelling upstream.
Upstreamp : Refers to the part of an inland waterway located between a given point and the source.
Water conditions

Market Observation | for inland navigation in Europe52
5. Sources of information
International organisations Eurostat
National administrations
Economic institutes and consultants
P J K International b. v.
Inland waterways transport organisations
VBW
Industrial organisations MineralölwirtschaftsverbandBDI
Fédération Française de l’AcierFertilizer Industry Association
International Iron and Steel InstituteVerein der deutschen Kohleimporteure
53
PortsPort of AntwerpPort of RotterdamPort of Amsterdam
Groups of professional expertsp p
European Commission
LayoutBitfactory
CCNR Secretariat
Market Observation | for inland navigation in Europe54
Printed in September 2007
www.ccr-zkr.org

55

der Europäischen Binnenschifffahrt
BEOBACHTUNGMARKT
2006 - 2