Embed Size (px)
Citation preview
Market Briefing:Correlated Markets
Yardeni Research, Inc.
June 24, 2018
Dr. Edward Yardeni516-972-7683
Mali Quintana480-664-1333
Please visit our sites atwww.yardeni.comblog.yardeni.com
thinking outside the box
Table Of Contents Table Of ContentsTable Of Contents
June 24, 2018 / Market Briefing: Correlated Markets www.yardeni.com
Yardeni Research, Inc.
Industrial & Transportation Stock Prices 1S&P 500 & Commodity Prices 2S&P 500, Oil, & the Dollar 3Commodity Prices & the Dollar 4Commodity Prices & Currencies 5Copper, Oil, & the Dollar 6EM-MSCI 7EM-MSCIs, the Dollar, & Commodity Prices 8-9China Stock Market & Commodities 10Asian Stock Markets 11-12S&P 500 Sectors 13S&P 500 Industries 14Bank Stocks 15Technology Heavy Stock Markets 16Commodity Heavy Stock Markets 17Capital Goods Heavy Stock Markets 18S&P 500 Indices: MEI, CUT 19Misc 20CRB & Copper 21Russia Price Index & Crude Oil Price 22Expected Inflation & CRB Raw Industrials Index 23
2008 2009 2010 2011 2012 2013 2014 2015 2016 2017 2018 20192000
3500
5000
6500
8000
9500
11000
12500
6000
9000
12000
15000
18000
21000
24000
27000
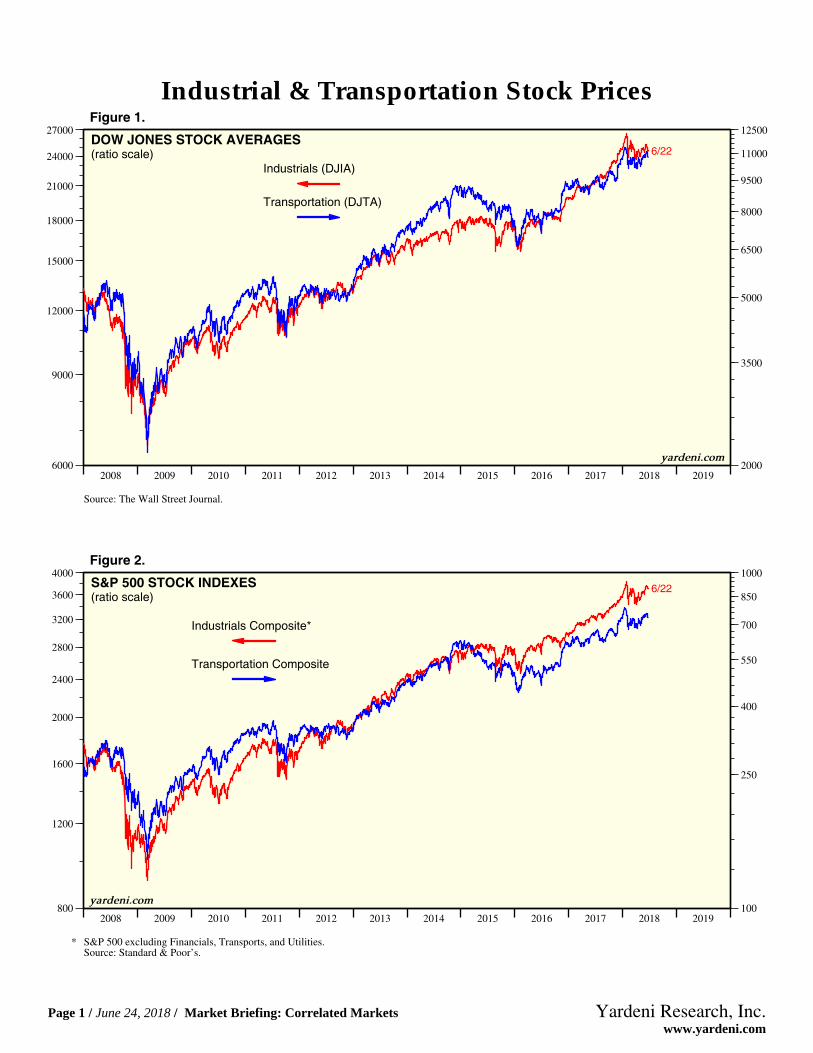
6/22DOW JONES STOCK AVERAGES(ratio scale)
Industrials (DJIA)
Transportation (DJTA)
Source: The Wall Street Journal.
yardeni.com
Figure 1.
2008 2009 2010 2011 2012 2013 2014 2015 2016 2017 2018 2019100
250
400
550
700
850
1000
800
1200
1600
2000
2400
2800
3200
3600
4000
6/22S&P 500 STOCK INDEXES(ratio scale)
Industrials Composite*
Transportation Composite
* S&P 500 excluding Financials, Transports, and Utilities.Source: Standard & Poor’s.
yardeni.com
Figure 2.
Industrial & Transportation Stock Prices
Page 1 / June 24, 2018 / Market Briefing: Correlated Markets www.yardeni.com
Yardeni Research, Inc.
2005 2006 2007 2008 2009 2010 2011 2012 2013 2014 2015 2016 2017 2018 2019600
800
1000
1200
1400
1600
1800
2000
2200
2400
2600
2800
3000
250
350
450
550
650
750
850
6/22
6/22
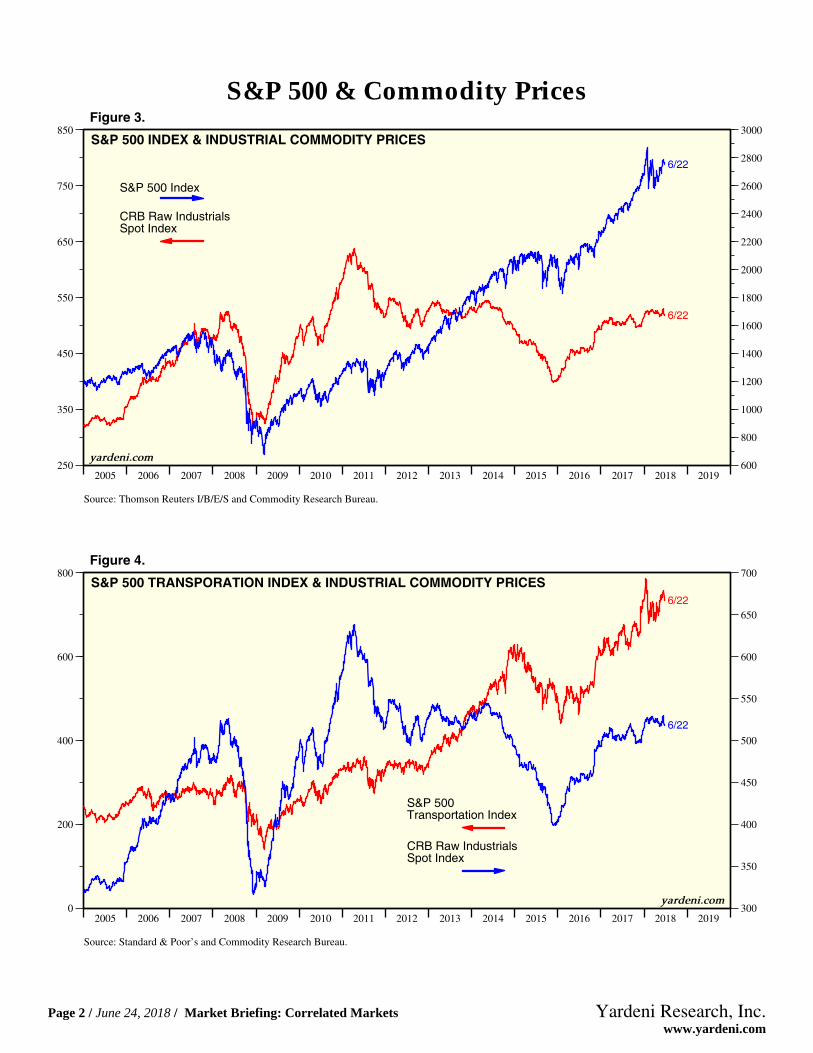
S&P 500 INDEX & INDUSTRIAL COMMODITY PRICES
S&P 500 Index
CRB Raw IndustrialsSpot Index
Source: Thomson Reuters I/B/E/S and Commodity Research Bureau.
yardeni.com
Figure 3.
2005 2006 2007 2008 2009 2010 2011 2012 2013 2014 2015 2016 2017 2018 2019300
350
400
450
500
550
600
650
700
0
200
400
600
800
6/22
6/22
S&P 500 TRANSPORATION INDEX & INDUSTRIAL COMMODITY PRICES
S&P 500Transportation Index
CRB Raw IndustrialsSpot Index
Source: Standard & Poor’s and Commodity Research Bureau.
yardeni.com
Figure 4.
S&P 500 & Commodity Prices
Page 2 / June 24, 2018 / Market Briefing: Correlated Markets www.yardeni.com
Yardeni Research, Inc.
2006 2007 2008 2009 2010 2011 2012 2013 2014 2015 2016 2017 2018 201910
30
50
70
90
110
130
150
170
400
600
800
1000
1200
1400
1600
1800
2000
2200
2400
2600
2800
3000
6/22
6/21
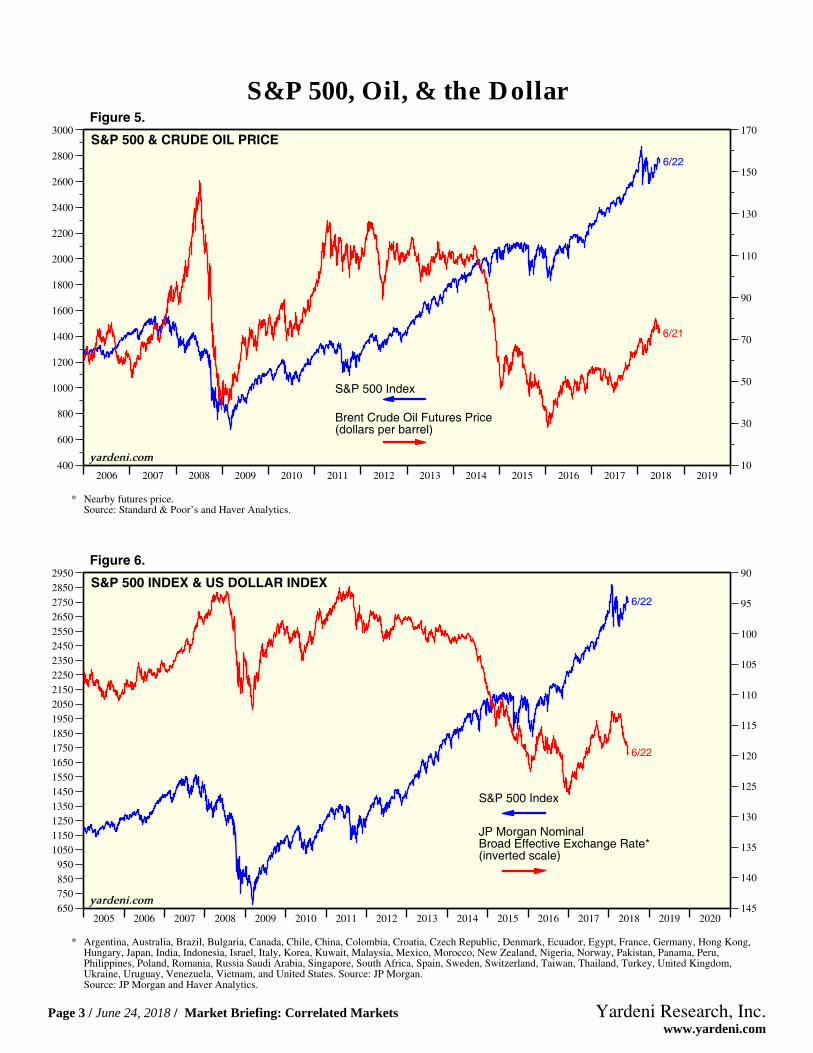
S&P 500 & CRUDE OIL PRICE
Brent Crude Oil Futures Price(dollars per barrel)
S&P 500 Index
* Nearby futures price.Source: Standard & Poor’s and Haver Analytics.
yardeni.com
Figure 5.
2005 2006 2007 2008 2009 2010 2011 2012 2013 2014 2015 2016 2017 2018 2019 2020145
140
135
130
125
120
115
110
105
100
95
90
650750850950
10501150125013501450155016501750185019502050215022502350245025502650275028502950
6/22
6/22
S&P 500 INDEX & US DOLLAR INDEX
JP Morgan NominalBroad Effective Exchange Rate*(inverted scale)
S&P 500 Index
* Argentina, Australia, Brazil, Bulgaria, Canada, Chile, China, Colombia, Croatia, Czech Republic, Denmark, Ecuador, Egypt, France, Germany, Hong Kong,Hungary, Japan, India, Indonesia, Israel, Italy, Korea, Kuwait, Malaysia, Mexico, Morocco, New Zealand, Nigeria, Norway, Pakistan, Panama, Peru,Philippines, Poland, Romania, Russia Saudi Arabia, Singapore, South Africa, Spain, Sweden, Switzerland, Taiwan, Thailand, Turkey, United Kingdom,Ukraine, Uruguay, Venezuela, Vietnam, and United States. Source: JP Morgan.Source: JP Morgan and Haver Analytics.
yardeni.com
Figure 6.
S&P 500, Oil, & the Dollar
Page 3 / June 24, 2018 / Market Briefing: Correlated Markets www.yardeni.com
Yardeni Research, Inc.
95 96 97 98 99 00 01 02 03 04 05 06 07 08 09 10 11 12 13 14 15 16 17 18 19 20200
300
400
500
600
700
130
125
120
115
110
105
100
95
90
85
80
6/22
6/22
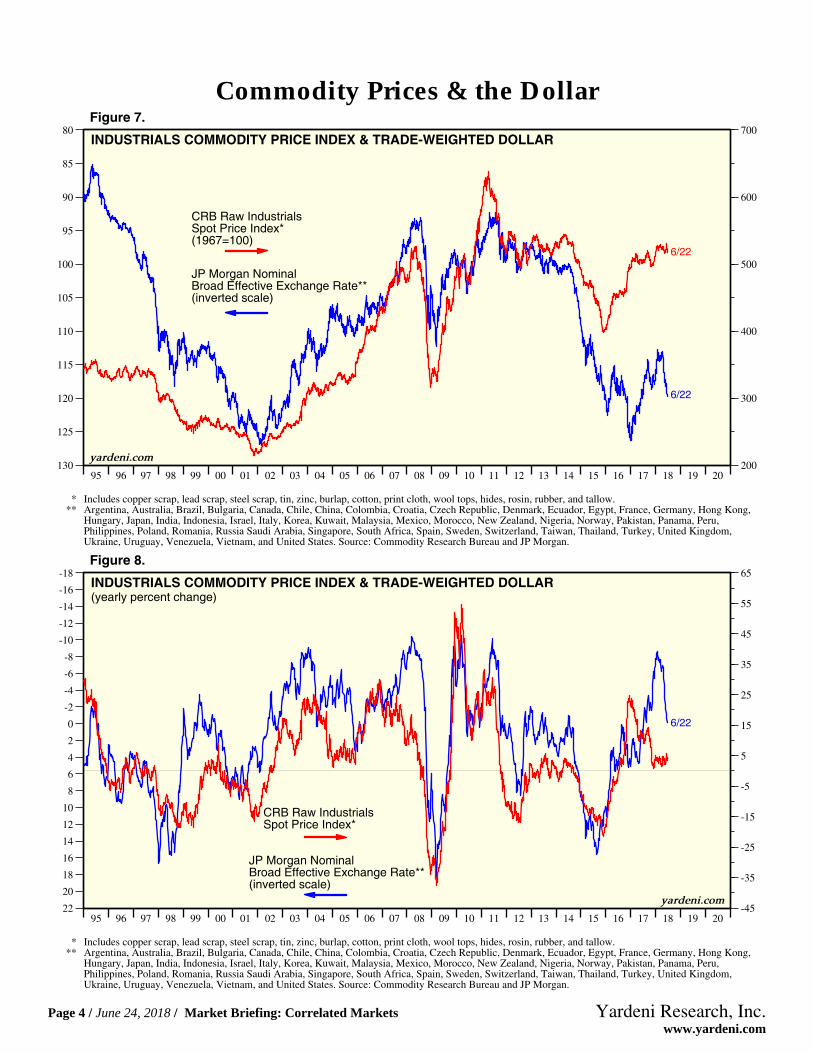
INDUSTRIALS COMMODITY PRICE INDEX & TRADE-WEIGHTED DOLLAR
JP Morgan NominalBroad Effective Exchange Rate**(inverted scale)
CRB Raw IndustrialsSpot Price Index*(1967=100)
* Includes copper scrap, lead scrap, steel scrap, tin, zinc, burlap, cotton, print cloth, wool tops, hides, rosin, rubber, and tallow.** Argentina, Australia, Brazil, Bulgaria, Canada, Chile, China, Colombia, Croatia, Czech Republic, Denmark, Ecuador, Egypt, France, Germany, Hong Kong,
Hungary, Japan, India, Indonesia, Israel, Italy, Korea, Kuwait, Malaysia, Mexico, Morocco, New Zealand, Nigeria, Norway, Pakistan, Panama, Peru,Philippines, Poland, Romania, Russia Saudi Arabia, Singapore, South Africa, Spain, Sweden, Switzerland, Taiwan, Thailand, Turkey, United Kingdom,Ukraine, Uruguay, Venezuela, Vietnam, and United States. Source: Commodity Research Bureau and JP Morgan.
yardeni.com
Figure 7.
95 96 97 98 99 00 01 02 03 04 05 06 07 08 09 10 11 12 13 14 15 16 17 18 19 20-45
-35
-25
-15
-5
5
15
25
35
45
55
65
22
20
18
16
14
12
10
8
6
4
2
0
-2
-4
-6
-8
-10
-12
-14
-16
-18
6/22
INDUSTRIALS COMMODITY PRICE INDEX & TRADE-WEIGHTED DOLLAR(yearly percent change)
JP Morgan NominalBroad Effective Exchange Rate**(inverted scale)
CRB Raw IndustrialsSpot Price Index*
* Includes copper scrap, lead scrap, steel scrap, tin, zinc, burlap, cotton, print cloth, wool tops, hides, rosin, rubber, and tallow.** Argentina, Australia, Brazil, Bulgaria, Canada, Chile, China, Colombia, Croatia, Czech Republic, Denmark, Ecuador, Egypt, France, Germany, Hong Kong,
Hungary, Japan, India, Indonesia, Israel, Italy, Korea, Kuwait, Malaysia, Mexico, Morocco, New Zealand, Nigeria, Norway, Pakistan, Panama, Peru,Philippines, Poland, Romania, Russia Saudi Arabia, Singapore, South Africa, Spain, Sweden, Switzerland, Taiwan, Thailand, Turkey, United Kingdom,Ukraine, Uruguay, Venezuela, Vietnam, and United States. Source: Commodity Research Bureau and JP Morgan.
yardeni.com
Figure 8.
Commodity Prices & the Dollar
Page 4 / June 24, 2018 / Market Briefing: Correlated Markets www.yardeni.com
Yardeni Research, Inc.
2000 2001 2002 2003 2004 2005 2006 2007 2008 2009 2010 2011 2012 2013 2014 2015 2016 2017 2018 2019 2020200
300
400
500
600
700
1.7
1.6
1.5
1.4
1.3
1.2
1.1
1.0
.9
.8
6/22
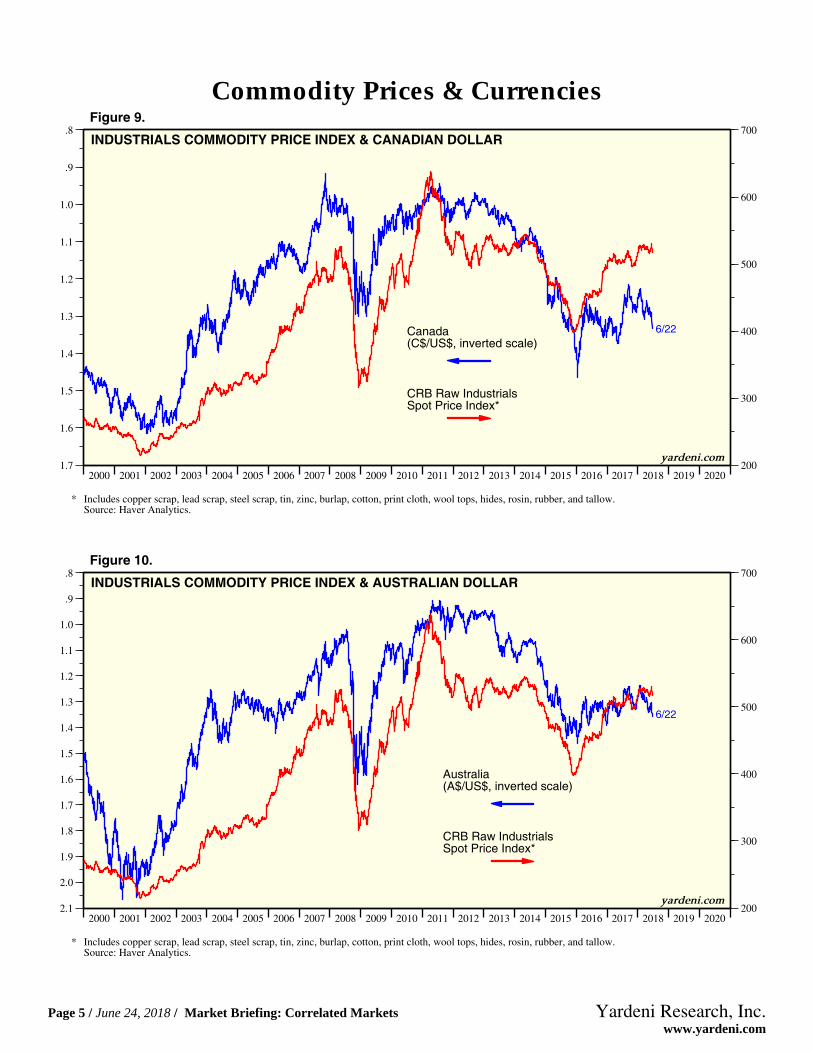
INDUSTRIALS COMMODITY PRICE INDEX & CANADIAN DOLLAR
CRB Raw IndustrialsSpot Price Index*
Canada(C$/US$, inverted scale)
* Includes copper scrap, lead scrap, steel scrap, tin, zinc, burlap, cotton, print cloth, wool tops, hides, rosin, rubber, and tallow.Source: Haver Analytics.
yardeni.com
Figure 9.
2000 2001 2002 2003 2004 2005 2006 2007 2008 2009 2010 2011 2012 2013 2014 2015 2016 2017 2018 2019 2020200
300
400
500
600
700
2.1
2.0
1.9
1.8
1.7
1.6
1.5
1.4
1.3
1.2
1.1
1.0
.9
.8
6/22
INDUSTRIALS COMMODITY PRICE INDEX & AUSTRALIAN DOLLAR
CRB Raw IndustrialsSpot Price Index*
Australia(A$/US$, inverted scale)
* Includes copper scrap, lead scrap, steel scrap, tin, zinc, burlap, cotton, print cloth, wool tops, hides, rosin, rubber, and tallow.Source: Haver Analytics.
yardeni.com
Figure 10.
Commodity Prices & Currencies
Page 5 / June 24, 2018 / Market Briefing: Correlated Markets www.yardeni.com
Yardeni Research, Inc.
2005 2006 2007 2008 2009 2010 2011 2012 2013 2014 2015 2016 2017 2018 2019 2020100
150
200
250
300
350
400
450
500
250
300
350
400
450
500
550
600
650
700
6/22
6/22
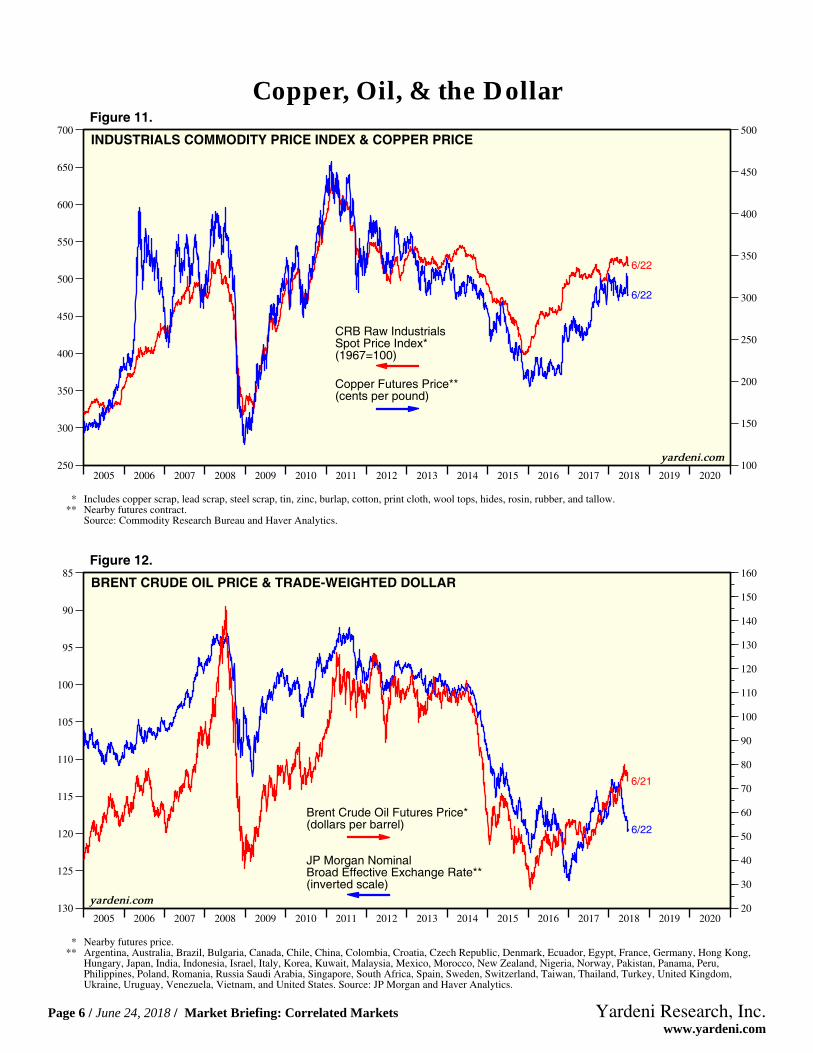
INDUSTRIALS COMMODITY PRICE INDEX & COPPER PRICE
Copper Futures Price**(cents per pound)
CRB Raw IndustrialsSpot Price Index*(1967=100)
* Includes copper scrap, lead scrap, steel scrap, tin, zinc, burlap, cotton, print cloth, wool tops, hides, rosin, rubber, and tallow.** Nearby futures contract.
Source: Commodity Research Bureau and Haver Analytics.
yardeni.com
Figure 11.
2005 2006 2007 2008 2009 2010 2011 2012 2013 2014 2015 2016 2017 2018 2019 202020
30
40
50
60
70
80
90
100
110
120
130
140
150
160
130
125
120
115
110
105
100
95
90
85
6/22
6/21
BRENT CRUDE OIL PRICE & TRADE-WEIGHTED DOLLAR
JP Morgan NominalBroad Effective Exchange Rate**(inverted scale)
Brent Crude Oil Futures Price*(dollars per barrel)
* Nearby futures price.** Argentina, Australia, Brazil, Bulgaria, Canada, Chile, China, Colombia, Croatia, Czech Republic, Denmark, Ecuador, Egypt, France, Germany, Hong Kong,
Hungary, Japan, India, Indonesia, Israel, Italy, Korea, Kuwait, Malaysia, Mexico, Morocco, New Zealand, Nigeria, Norway, Pakistan, Panama, Peru,Philippines, Poland, Romania, Russia Saudi Arabia, Singapore, South Africa, Spain, Sweden, Switzerland, Taiwan, Thailand, Turkey, United Kingdom,Ukraine, Uruguay, Venezuela, Vietnam, and United States. Source: JP Morgan and Haver Analytics.
yardeni.com
Figure 12.
Copper, Oil, & the Dollar
Page 6 / June 24, 2018 / Market Briefing: Correlated Markets www.yardeni.com
Yardeni Research, Inc.
2009 2010 2011 2012 2013 2014 2015 2016 2017 2018 201920000
25000
30000
35000
40000
45000
50000
55000
60000
65000
70000
75000
400
600
800
1000
1200
1400
1600
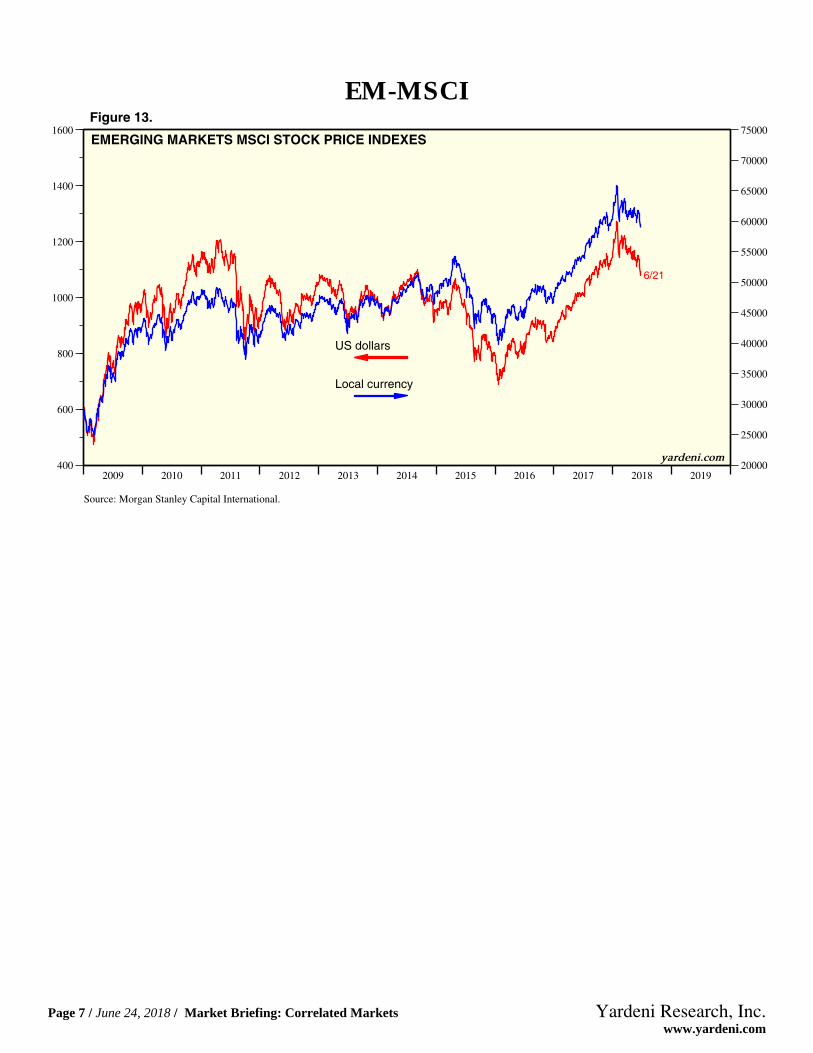
6/21
EMERGING MARKETS MSCI STOCK PRICE INDEXES
US dollars
Local currency
Source: Morgan Stanley Capital International.
yardeni.com
Figure 13.
EM-MSCI
Page 7 / June 24, 2018 / Market Briefing: Correlated Markets www.yardeni.com
Yardeni Research, Inc.
2001 2002 2003 2004 2005 2006 2007 2008 2009 2010 2011 2012 2013 2014 2015 2016 2017 2018 2019 20200
10000
20000
30000
40000
50000
60000
70000
130
125
120
115
110
105
100
95
90
85
6/22
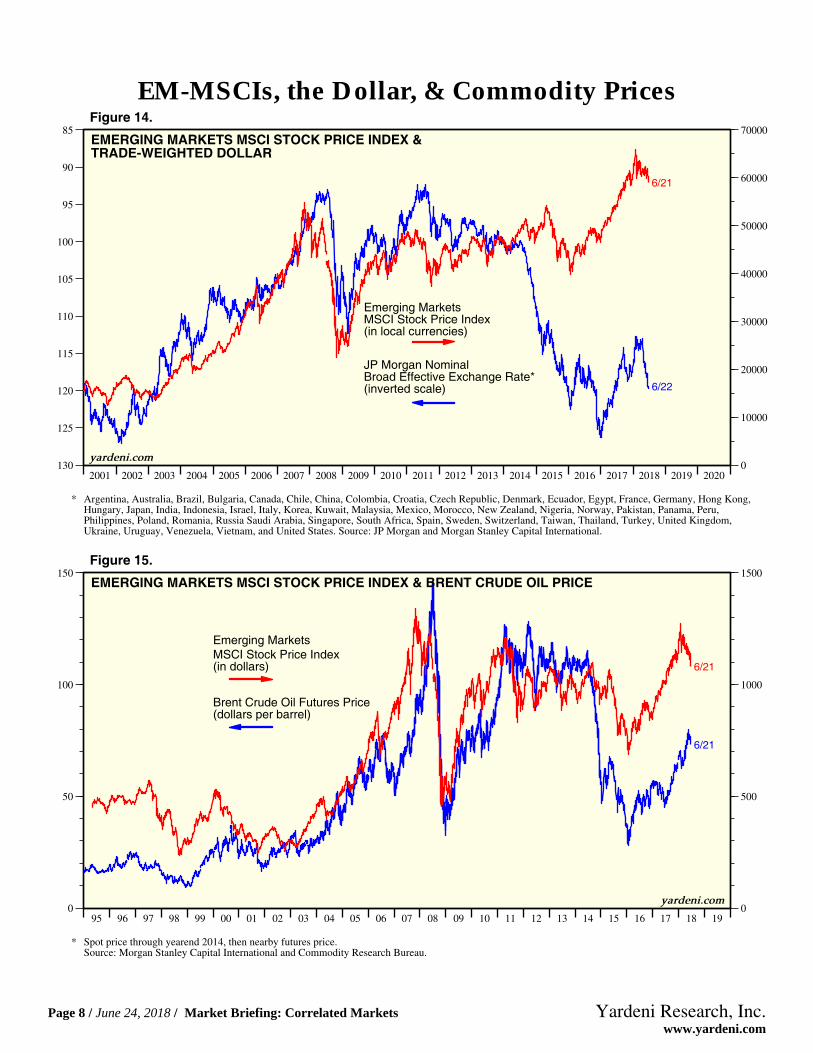
6/21
EMERGING MARKETS MSCI STOCK PRICE INDEX &TRADE-WEIGHTED DOLLAR
Emerging MarketsMSCI Stock Price Index(in local currencies)
JP Morgan NominalBroad Effective Exchange Rate*(inverted scale)
* Argentina, Australia, Brazil, Bulgaria, Canada, Chile, China, Colombia, Croatia, Czech Republic, Denmark, Ecuador, Egypt, France, Germany, Hong Kong,Hungary, Japan, India, Indonesia, Israel, Italy, Korea, Kuwait, Malaysia, Mexico, Morocco, New Zealand, Nigeria, Norway, Pakistan, Panama, Peru,Philippines, Poland, Romania, Russia Saudi Arabia, Singapore, South Africa, Spain, Sweden, Switzerland, Taiwan, Thailand, Turkey, United Kingdom,Ukraine, Uruguay, Venezuela, Vietnam, and United States. Source: JP Morgan and Morgan Stanley Capital International.
yardeni.com
Figure 14.
95 96 97 98 99 00 01 02 03 04 05 06 07 08 09 10 11 12 13 14 15 16 17 18 190
500
1000
1500
0
50
100
150
6/21
6/21
EMERGING MARKETS MSCI STOCK PRICE INDEX & BRENT CRUDE OIL PRICE
Emerging MarketsMSCI Stock Price Index(in dollars)
Brent Crude Oil Futures Price(dollars per barrel)
* Spot price through yearend 2014, then nearby futures price.Source: Morgan Stanley Capital International and Commodity Research Bureau.
yardeni.com
Figure 15.
EM-MSCIs, the Dollar, & Commodity Prices
Page 8 / June 24, 2018 / Market Briefing: Correlated Markets www.yardeni.com
Yardeni Research, Inc.
95 96 97 98 99 00 01 02 03 04 05 06 07 08 09 10 11 12 13 14 15 16 17 18 19 200
500
1000
1500
200
300
400
500
600
700
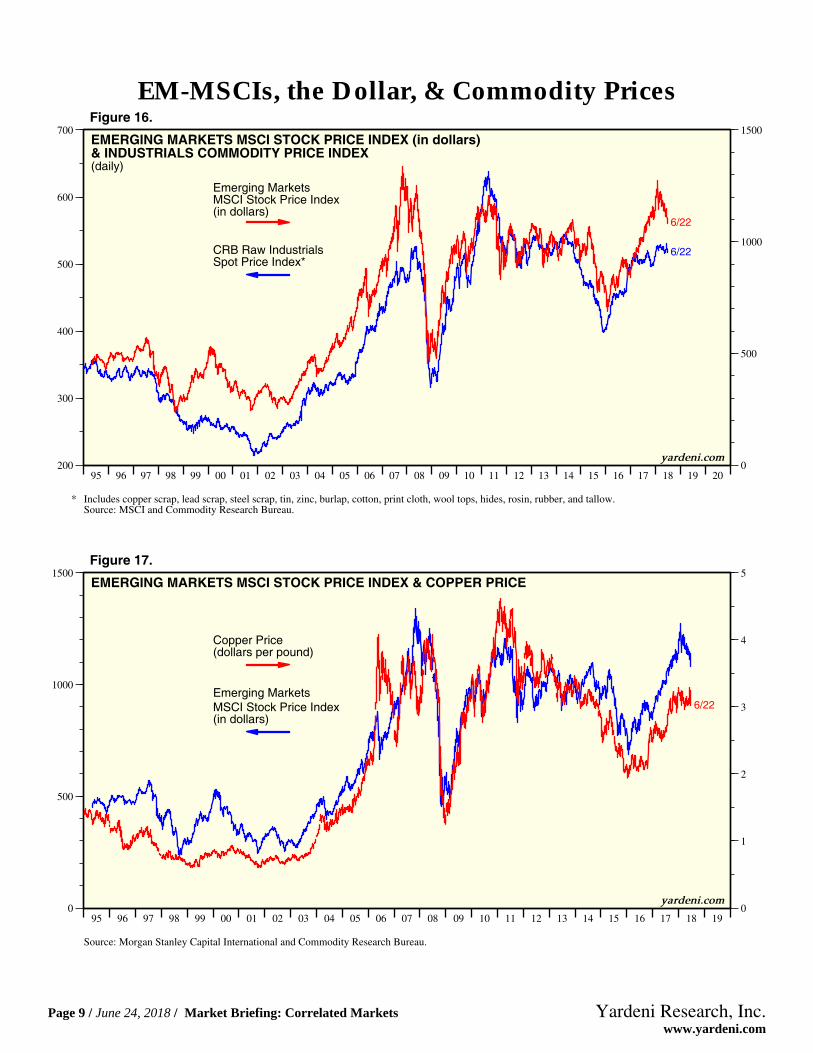
6/22
6/22
EMERGING MARKETS MSCI STOCK PRICE INDEX (in dollars)& INDUSTRIALS COMMODITY PRICE INDEX(daily)
Emerging MarketsMSCI Stock Price Index(in dollars)
CRB Raw IndustrialsSpot Price Index*
* Includes copper scrap, lead scrap, steel scrap, tin, zinc, burlap, cotton, print cloth, wool tops, hides, rosin, rubber, and tallow.Source: MSCI and Commodity Research Bureau.
yardeni.com
Figure 16.
95 96 97 98 99 00 01 02 03 04 05 06 07 08 09 10 11 12 13 14 15 16 17 18 190
1
2
3
4
5
0
500
1000
1500
6/22
EMERGING MARKETS MSCI STOCK PRICE INDEX & COPPER PRICE
Emerging MarketsMSCI Stock Price Index(in dollars)
Copper Price(dollars per pound)
Source: Morgan Stanley Capital International and Commodity Research Bureau.
yardeni.com
Figure 17.
EM-MSCIs, the Dollar, & Commodity Prices
Page 9 / June 24, 2018 / Market Briefing: Correlated Markets www.yardeni.com
Yardeni Research, Inc.
2009 2010 2011 2012 2013 2014 2015 2016 2017 2018 2019100
200
300
400
500
20
30
40
50
60
70
80
90
100
110
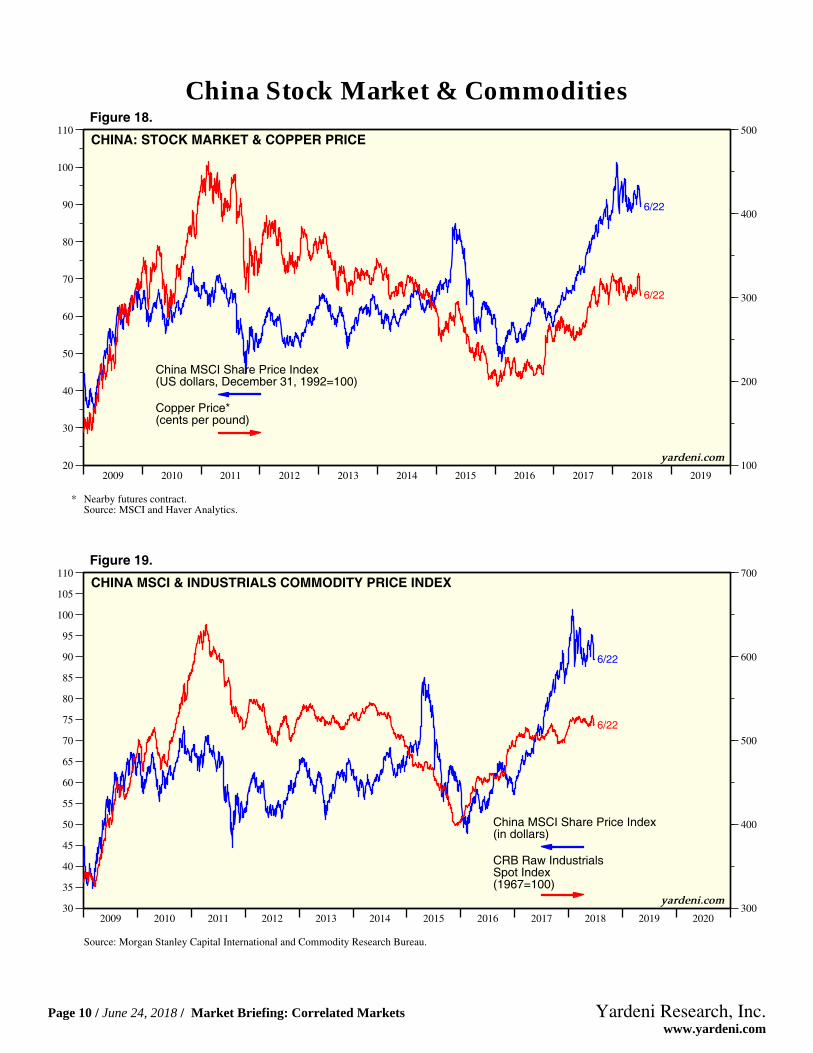
6/22
6/22
CHINA: STOCK MARKET & COPPER PRICE
China MSCI Share Price Index(US dollars, December 31, 1992=100)
Copper Price*(cents per pound)
* Nearby futures contract.Source: MSCI and Haver Analytics.
yardeni.com
Figure 18.
2009 2010 2011 2012 2013 2014 2015 2016 2017 2018 2019 2020300
400
500
600
700
30
35
40
45
50
55
60
65
70
75
80
85
90
95
100
105
110
6/22
6/22
CHINA MSCI & INDUSTRIALS COMMODITY PRICE INDEX
China MSCI Share Price Index(in dollars)
CRB Raw IndustrialsSpot Index(1967=100)
Source: Morgan Stanley Capital International and Commodity Research Bureau.
yardeni.com
Figure 19.
China Stock Market & Commodities
Page 10 / June 24, 2018 / Market Briefing: Correlated Markets www.yardeni.com
Yardeni Research, Inc.
2006 2007 2008 2009 2010 2011 2012 2013 2014 2015 2016 2017 2018 20196000
8000
10000
12000
14000
16000
18000
20000
22000
24000
500
1000
1500
2000
2500
3000
3500
4000
4500
5000
5500
6000
6500
7000
6/22
6/22
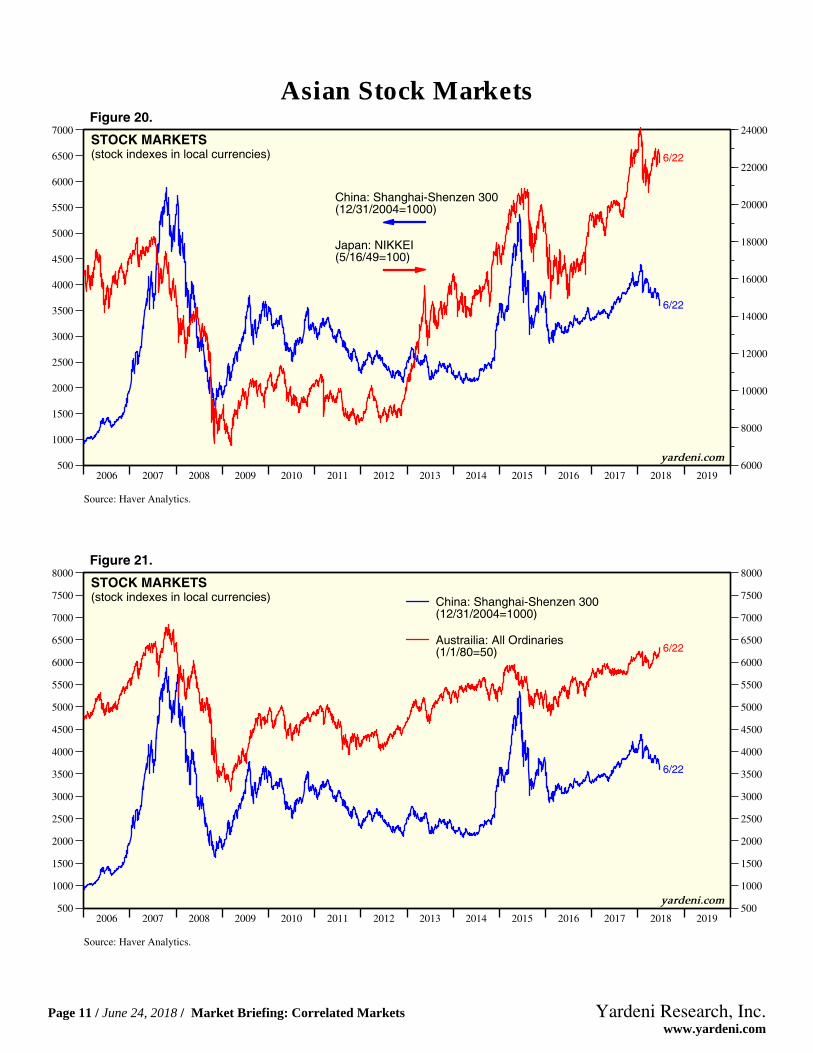
STOCK MARKETS(stock indexes in local currencies)
China: Shanghai-Shenzen 300(12/31/2004=1000)
Japan: NIKKEI(5/16/49=100)
Source: Haver Analytics.
yardeni.com
Figure 20.
2006 2007 2008 2009 2010 2011 2012 2013 2014 2015 2016 2017 2018 2019500
1000
1500
2000
2500
3000
3500
4000
4500
5000
5500
6000
6500
7000
7500
8000
500
1000
1500
2000
2500
3000
3500
4000
4500
5000
5500
6000
6500
7000
7500
8000
6/22
6/22
STOCK MARKETS(stock indexes in local currencies) China: Shanghai-Shenzen 300
(12/31/2004=1000)
Austrailia: All Ordinaries(1/1/80=50)
Source: Haver Analytics.
yardeni.com
Figure 21.
Asian Stock Markets
Page 11 / June 24, 2018 / Market Briefing: Correlated Markets www.yardeni.com
Yardeni Research, Inc.
96 97 98 99 00 01 02 03 04 05 06 07 08 09 10 11 12 13 14 15 16 17 18 19 20160
150
140
130
120
110
100
90
80
70
5000
10000
15000
20000
25000
6/22
6/22
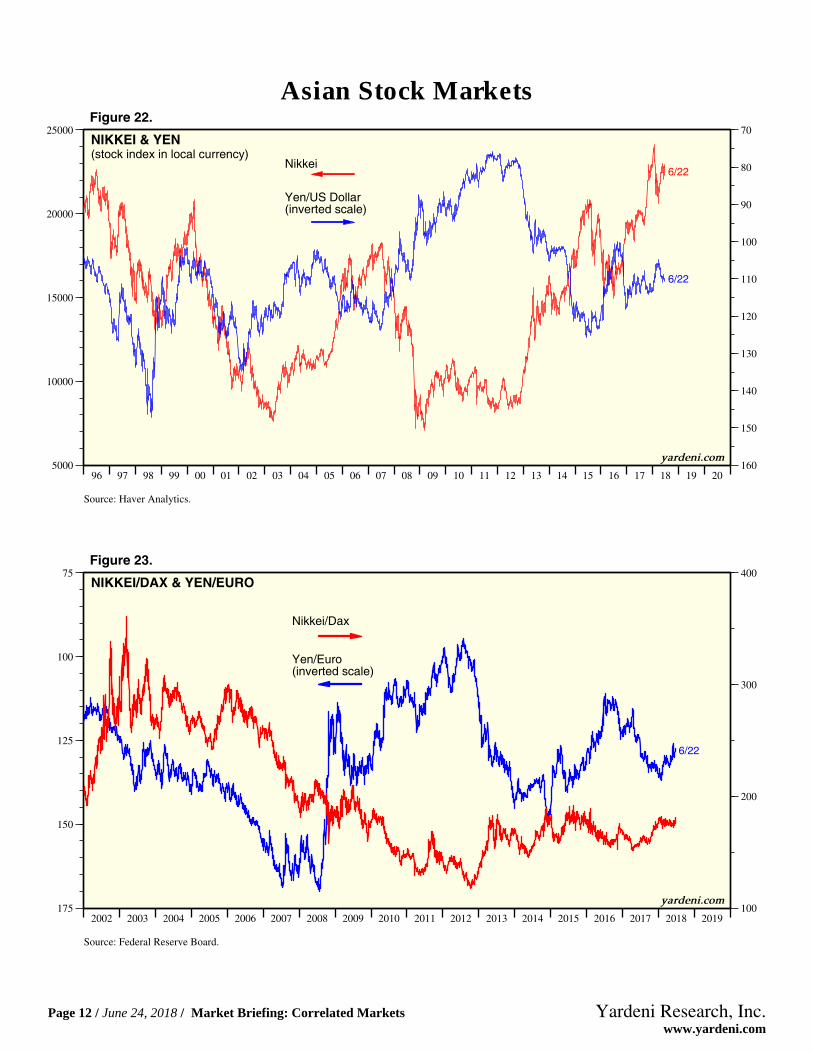
NIKKEI & YEN(stock index in local currency)
Nikkei
Yen/US Dollar(inverted scale)
Source: Haver Analytics.
yardeni.com
Figure 22.
2002 2003 2004 2005 2006 2007 2008 2009 2010 2011 2012 2013 2014 2015 2016 2017 2018 2019100
200
300
400
175
150
125
100
75
6/22
NIKKEI/DAX & YEN/EURO
Yen/Euro(inverted scale)
Nikkei/Dax
Source: Federal Reserve Board.
yardeni.com
Figure 23.
Asian Stock Markets
Page 12 / June 24, 2018 / Market Briefing: Correlated Markets www.yardeni.com
Yardeni Research, Inc.
2005 2006 2007 2008 2009 2010 2011 2012 2013 2014 2015 2016 2017 2018 2019 202025
50
75
100
125
150
175
.1
.2
.3
.4
.5
.6
6/22
6/21
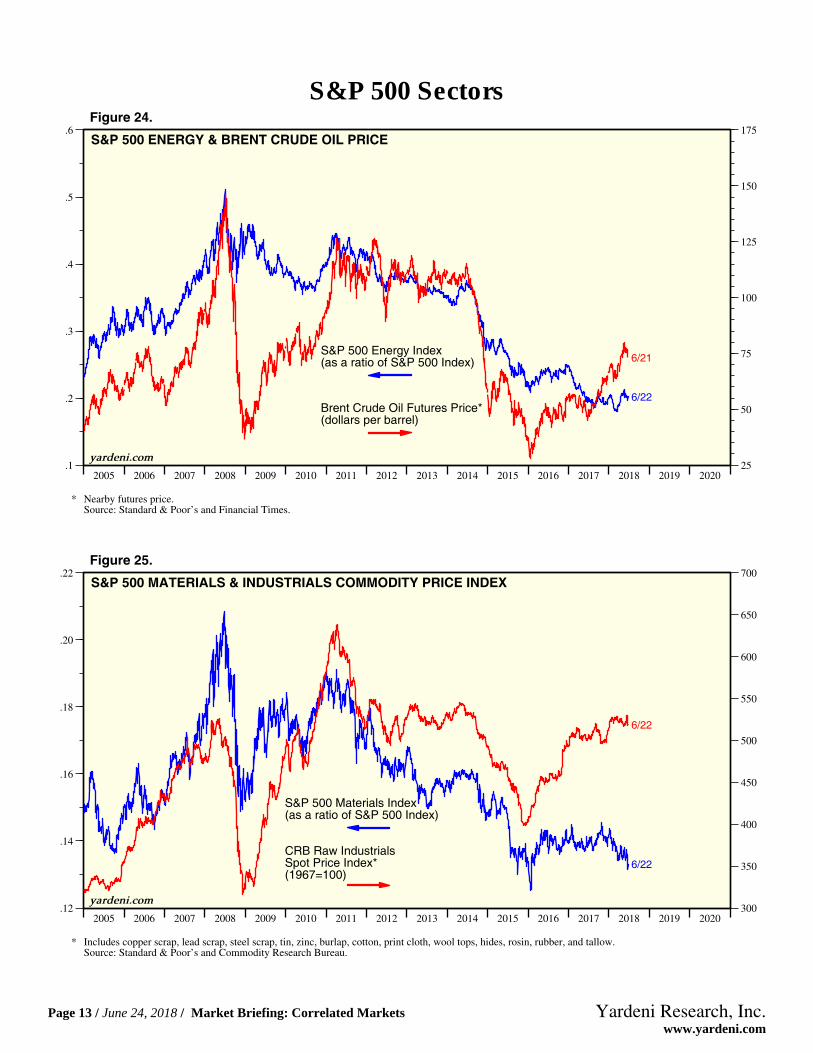
S&P 500 ENERGY & BRENT CRUDE OIL PRICE
S&P 500 Energy Index(as a ratio of S&P 500 Index)
Brent Crude Oil Futures Price*(dollars per barrel)
* Nearby futures price.Source: Standard & Poor’s and Financial Times.
yardeni.com
Figure 24.
2005 2006 2007 2008 2009 2010 2011 2012 2013 2014 2015 2016 2017 2018 2019 2020300
350
400
450
500
550
600
650
700
.12
.14
.16
.18
.20
.22
6/22
6/22
S&P 500 MATERIALS & INDUSTRIALS COMMODITY PRICE INDEX
S&P 500 Materials Index(as a ratio of S&P 500 Index)
CRB Raw IndustrialsSpot Price Index*(1967=100)
* Includes copper scrap, lead scrap, steel scrap, tin, zinc, burlap, cotton, print cloth, wool tops, hides, rosin, rubber, and tallow.Source: Standard & Poor’s and Commodity Research Bureau.
yardeni.com
Figure 25.
S&P 500 Sectors
Page 13 / June 24, 2018 / Market Briefing: Correlated Markets www.yardeni.com
Yardeni Research, Inc.
95 96 97 98 99 00 01 02 03 04 05 06 07 08 09 10 11 12 13 14 15 16 17 18 19 200
200
400
600
800
1000
1200
1400
1600
1800
2000
2200
2400
2600
2800
3000
0
200
400
600
800
1000
1200
1400
1600
1800
2000
2200
2400
2600
2800
3000
6/22
6/22
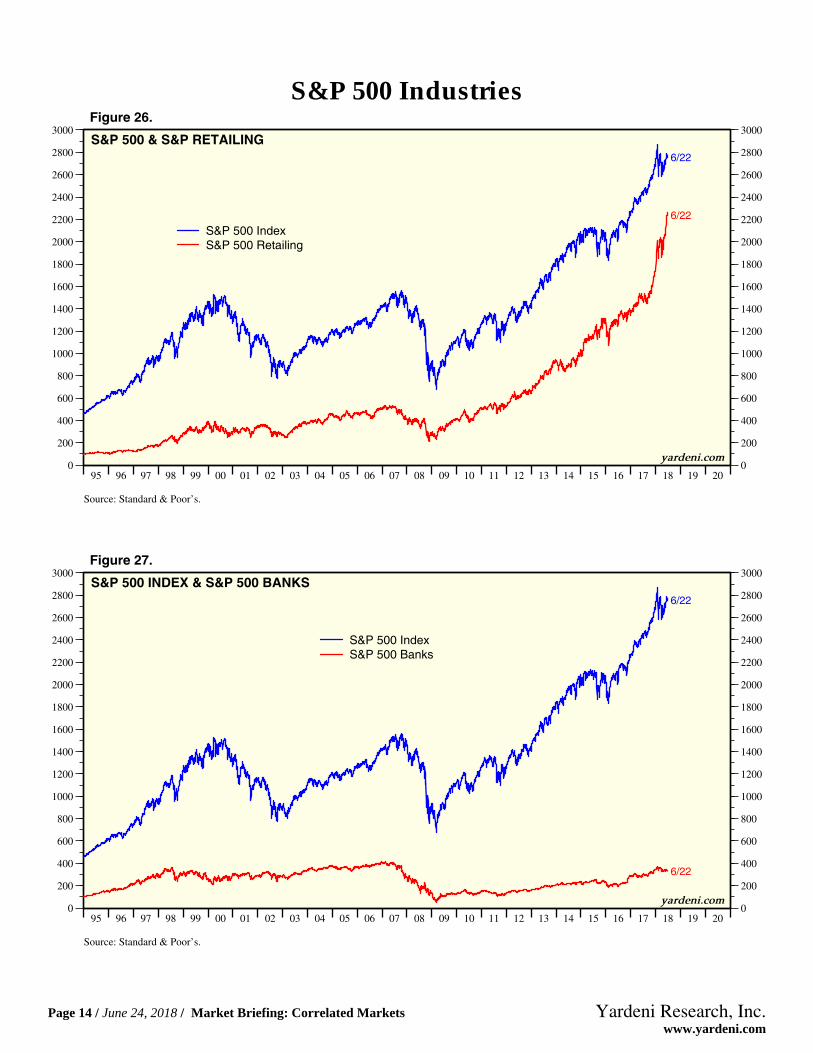
S&P 500 & S&P RETAILING
S&P 500 RetailingS&P 500 Index
Source: Standard & Poor’s.
yardeni.com
Figure 26.
95 96 97 98 99 00 01 02 03 04 05 06 07 08 09 10 11 12 13 14 15 16 17 18 19 200
200
400
600
800
1000
1200
1400
1600
1800
2000
2200
2400
2600
2800
3000
0
200
400
600
800
1000
1200
1400
1600
1800
2000
2200
2400
2600
2800
3000
6/22
6/22
S&P 500 INDEX & S&P 500 BANKS
S&P 500 BanksS&P 500 Index
Source: Standard & Poor’s.
yardeni.com
Figure 27.
S&P 500 Industries
Page 14 / June 24, 2018 / Market Briefing: Correlated Markets www.yardeni.com
Yardeni Research, Inc.
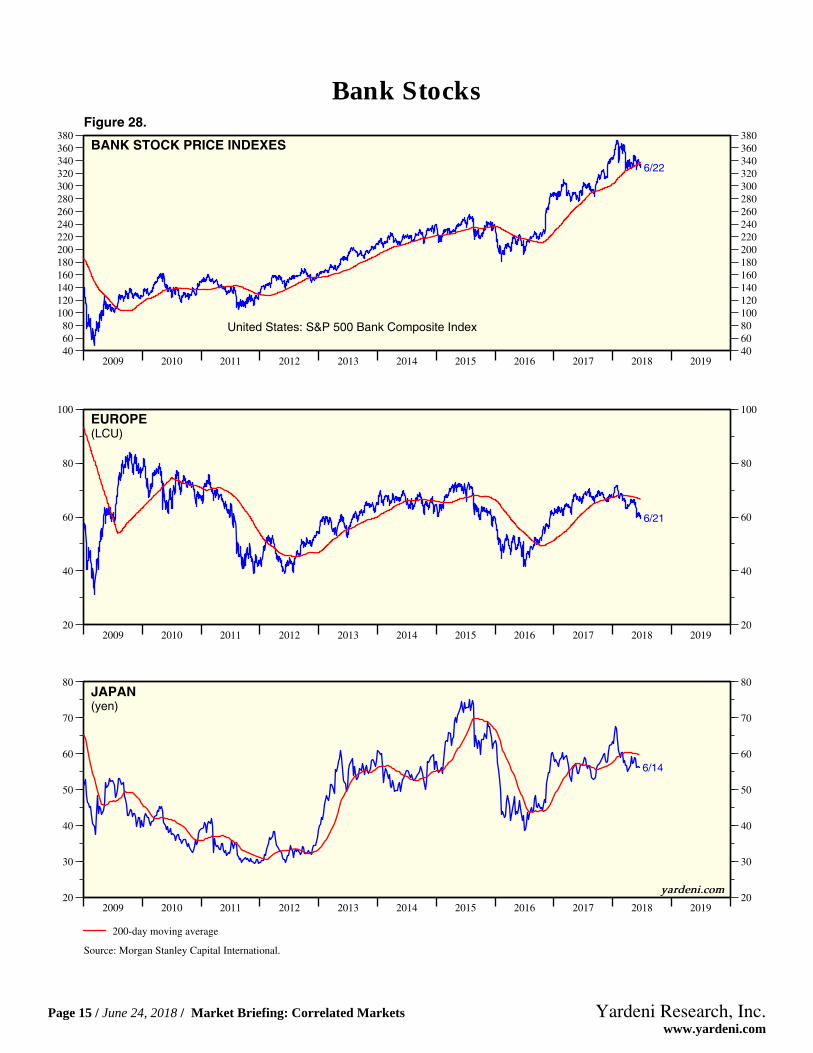
Figure 28.
2009 2010 2011 2012 2013 2014 2015 2016 2017 2018 2019406080100120140160180200220240260280300320340360380
406080
100120140160180200220240260280300320340360380
6/22
BANK STOCK PRICE INDEXES
United States: S&P 500 Bank Composite Index
2009 2010 2011 2012 2013 2014 2015 2016 2017 2018 201920
40
60
80
100
20
40
60
80
100
6/21
EUROPE(LCU)
2009 2010 2011 2012 2013 2014 2015 2016 2017 2018 201920
30
40
50
60
70
80
20
30
40
50
60
70
80
6/14
JAPAN(yen)
200-day moving average
Source: Morgan Stanley Capital International.
yardeni.com
Bank Stocks
Page 15 / June 24, 2018 / Market Briefing: Correlated Markets www.yardeni.com
Yardeni Research, Inc.
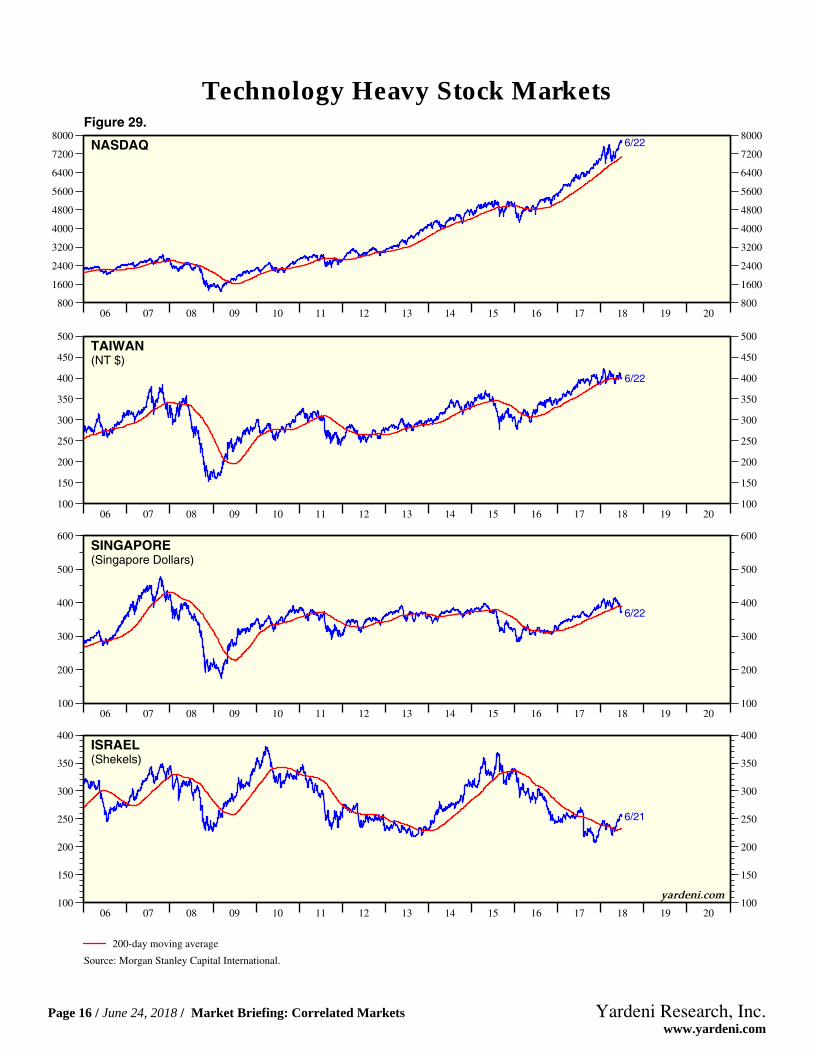
Figure 29.
06 07 08 09 10 11 12 13 14 15 16 17 18 19 20800
1600
2400
3200
4000
4800
5600
6400
7200
8000
800
1600
2400
3200
4000
4800
5600
6400
7200
80006/22NASDAQ
06 07 08 09 10 11 12 13 14 15 16 17 18 19 20100
150
200
250
300
350
400
450
500
100
150
200
250
300
350
400
450
500
6/22
TAIWAN(NT $)
06 07 08 09 10 11 12 13 14 15 16 17 18 19 20100
200
300
400
500
600
100
200
300
400
500
600
6/22
SINGAPORE(Singapore Dollars)
06 07 08 09 10 11 12 13 14 15 16 17 18 19 20100
150
200
250
300
350
400
100
150
200
250
300
350
400
6/21
ISRAEL(Shekels)
200-day moving average
Source: Morgan Stanley Capital International.
yardeni.com
Technology Heavy Stock Markets
Page 16 / June 24, 2018 / Market Briefing: Correlated Markets www.yardeni.com
Yardeni Research, Inc.
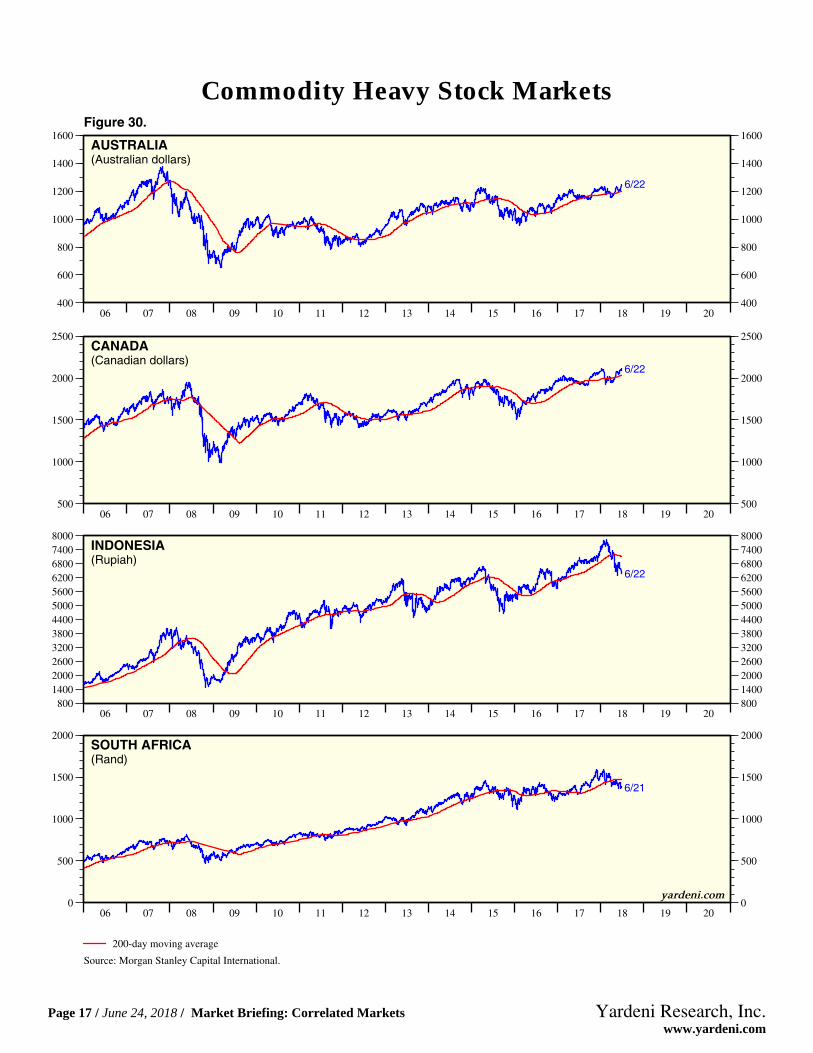
Figure 30.
06 07 08 09 10 11 12 13 14 15 16 17 18 19 20400
600
800
1000
1200
1400
1600
400
600
800
1000
1200
1400
1600
6/22
AUSTRALIA(Australian dollars)
06 07 08 09 10 11 12 13 14 15 16 17 18 19 20500
1000
1500
2000
2500
500
1000
1500
2000
2500
6/22
CANADA(Canadian dollars)
06 07 08 09 10 11 12 13 14 15 16 17 18 19 20800140020002600320038004400500056006200680074008000
800140020002600320038004400500056006200680074008000
6/22
INDONESIA(Rupiah)
06 07 08 09 10 11 12 13 14 15 16 17 18 19 200
500
1000
1500
2000
0
500
1000
1500
2000
6/21
SOUTH AFRICA(Rand)
200-day moving average
Source: Morgan Stanley Capital International.
yardeni.com
Commodity Heavy Stock Markets
Page 17 / June 24, 2018 / Market Briefing: Correlated Markets www.yardeni.com
Yardeni Research, Inc.
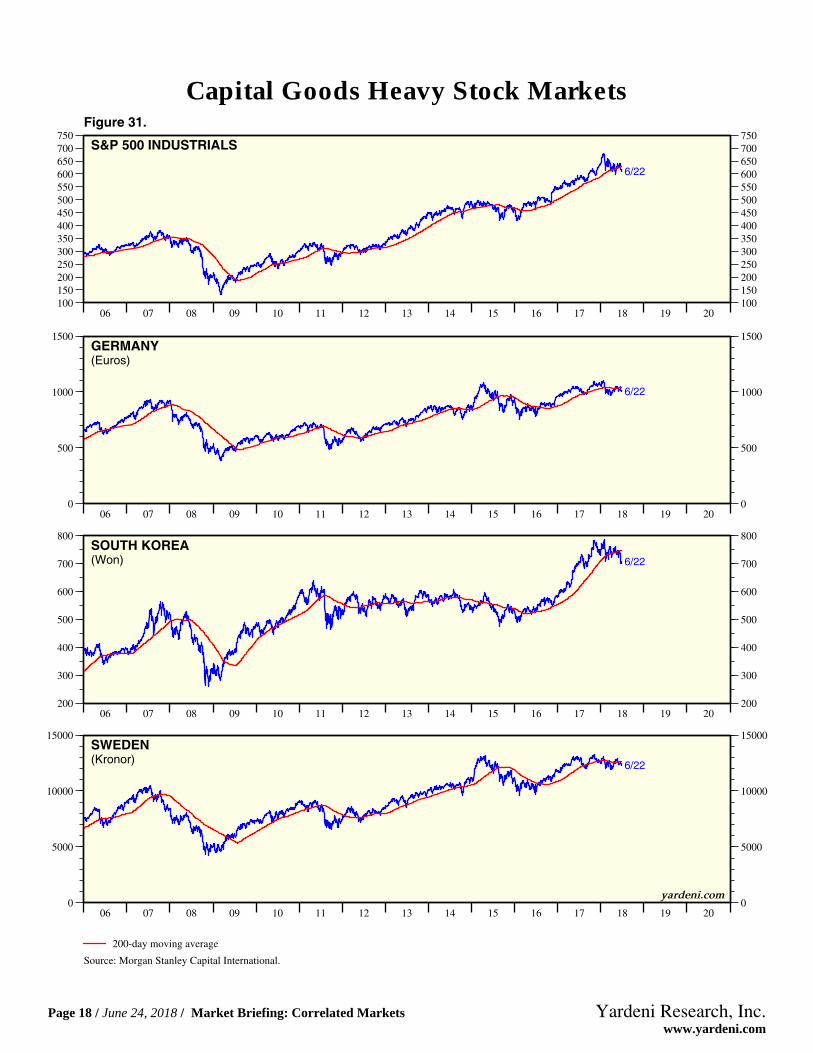
Figure 31.
06 07 08 09 10 11 12 13 14 15 16 17 18 19 20100150200250300350400450500550600650700750
100150200250300350400450500550600650700750
6/22
S&P 500 INDUSTRIALS
06 07 08 09 10 11 12 13 14 15 16 17 18 19 200
500
1000
1500
0
500
1000
1500
6/22
GERMANY(Euros)
06 07 08 09 10 11 12 13 14 15 16 17 18 19 20200
300
400
500
600
700
800
200
300
400
500
600
700
800
6/22SOUTH KOREA(Won)
06 07 08 09 10 11 12 13 14 15 16 17 18 19 200
5000
10000
15000
0
5000
10000
15000
6/22
SWEDEN(Kronor)
yardeni.com
200-day moving average
Source: Morgan Stanley Capital International.
Capital Goods Heavy Stock Markets
Page 18 / June 24, 2018 / Market Briefing: Correlated Markets www.yardeni.com
Yardeni Research, Inc.
2007 2008 2009 2010 2011 2012 2013 2014 2015 2016 2017 2018160
180
200
220
240
260
280
300
320
340
360
380
400
420
2000
4000
6000
8000
10000
12000
14000
8/10
8/10
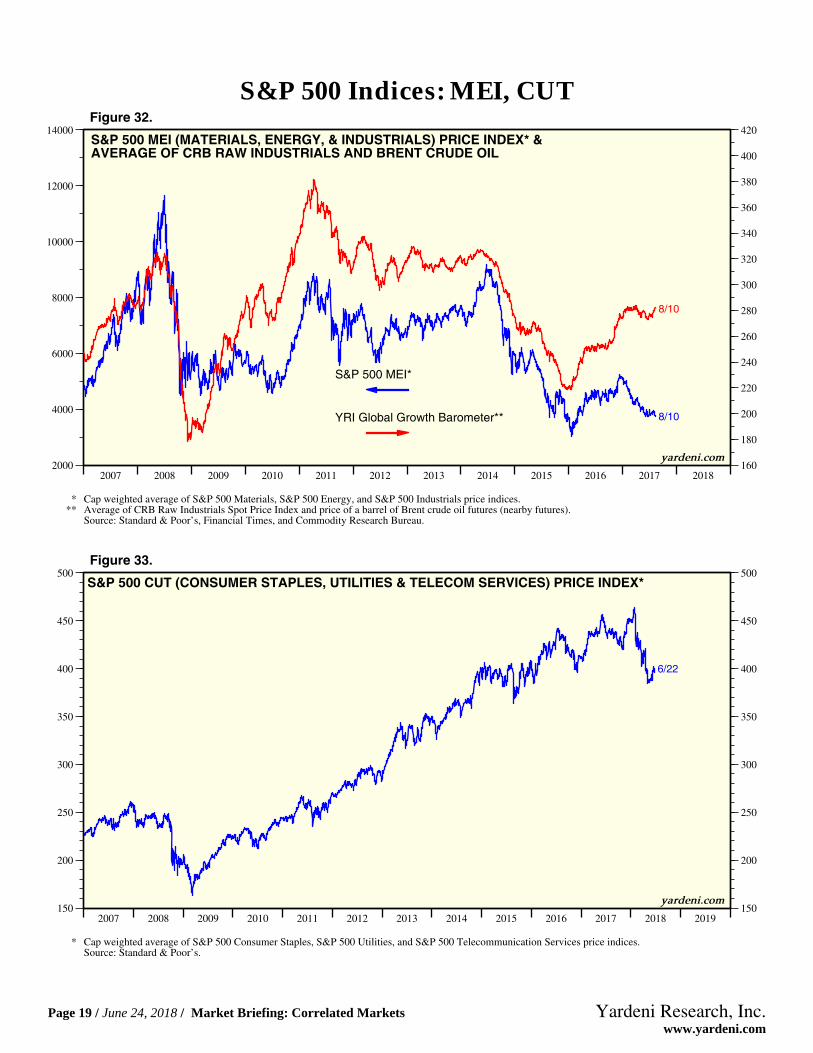
S&P 500 MEI (MATERIALS, ENERGY, & INDUSTRIALS) PRICE INDEX* &AVERAGE OF CRB RAW INDUSTRIALS AND BRENT CRUDE OIL
S&P 500 MEI*
YRI Global Growth Barometer**
* Cap weighted average of S&P 500 Materials, S&P 500 Energy, and S&P 500 Industrials price indices.** Average of CRB Raw Industrials Spot Price Index and price of a barrel of Brent crude oil futures (nearby futures).
Source: Standard & Poor’s, Financial Times, and Commodity Research Bureau.
yardeni.com
Figure 32.
2007 2008 2009 2010 2011 2012 2013 2014 2015 2016 2017 2018 2019150
200
250
300
350
400
450
500
150
200
250
300
350
400
450
500
6/22
S&P 500 CUT (CONSUMER STAPLES, UTILITIES & TELECOM SERVICES) PRICE INDEX*
* Cap weighted average of S&P 500 Consumer Staples, S&P 500 Utilities, and S&P 500 Telecommunication Services price indices.Source: Standard & Poor’s.
yardeni.com
Figure 33.
S&P 500 Indices: MEI, CUT
Page 19 / June 24, 2018 / Market Briefing: Correlated Markets www.yardeni.com
Yardeni Research, Inc.
96 97 98 99 00 01 02 03 04 05 06 07 08 09 10 11 12 13 14 15 16 17 18 191.2
1.4
1.6
1.8
2.0
2.2
3000
4000
5000
6000
7000
8000
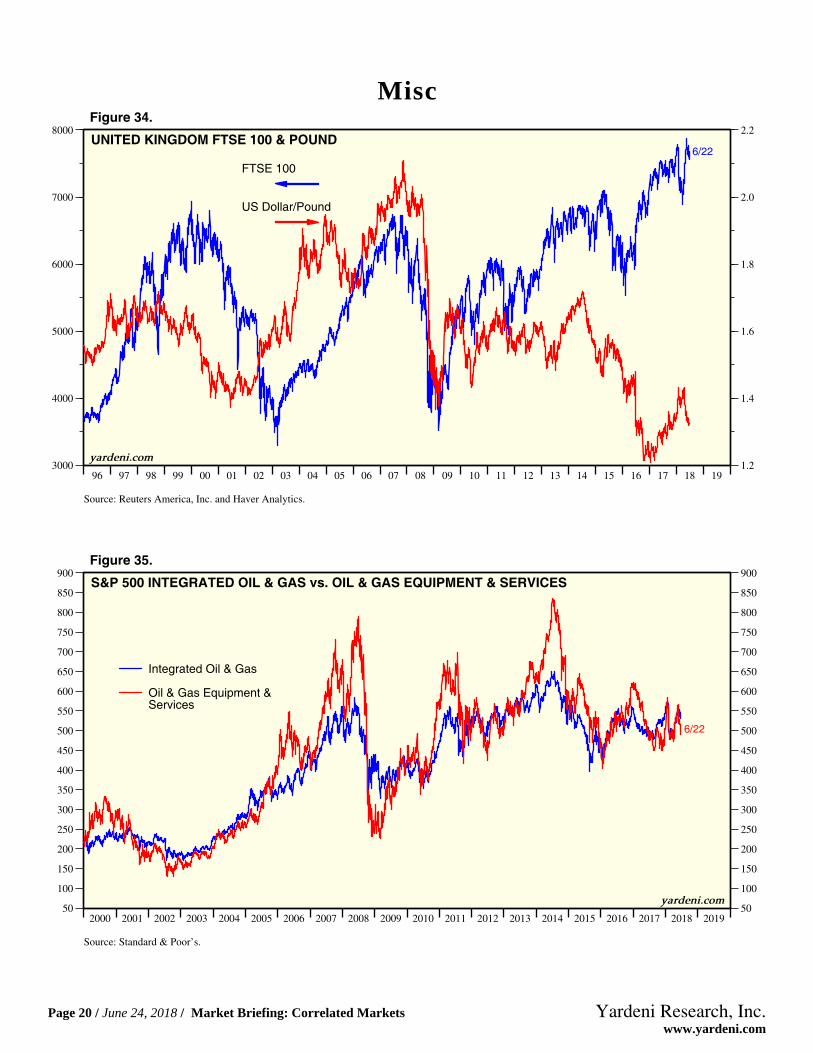
6/22UNITED KINGDOM FTSE 100 & POUND
FTSE 100
US Dollar/Pound
Source: Reuters America, Inc. and Haver Analytics.
yardeni.com
Figure 34.
2000 2001 2002 2003 2004 2005 2006 2007 2008 2009 2010 2011 2012 2013 2014 2015 2016 2017 2018 201950
100
150
200
250
300
350
400
450
500
550
600
650
700
750
800
850
900
50
100
150
200
250
300
350
400
450
500
550
600
650
700
750
800
850
900
6/22
S&P 500 INTEGRATED OIL & GAS vs. OIL & GAS EQUIPMENT & SERVICES
Integrated Oil & Gas
Oil & Gas Equipment &Services
Source: Standard & Poor’s.
yardeni.com
Figure 35.
Misc
Page 20 / June 24, 2018 / Market Briefing: Correlated Markets www.yardeni.com
Yardeni Research, Inc.
2004 2005 2006 2007 2008 2009 2010 2011 2012 2013 2014 2015 2016 2017 2018 2019 2020100
200
300
400
500
300
350
400
450
500
550
600
650
700
6/22
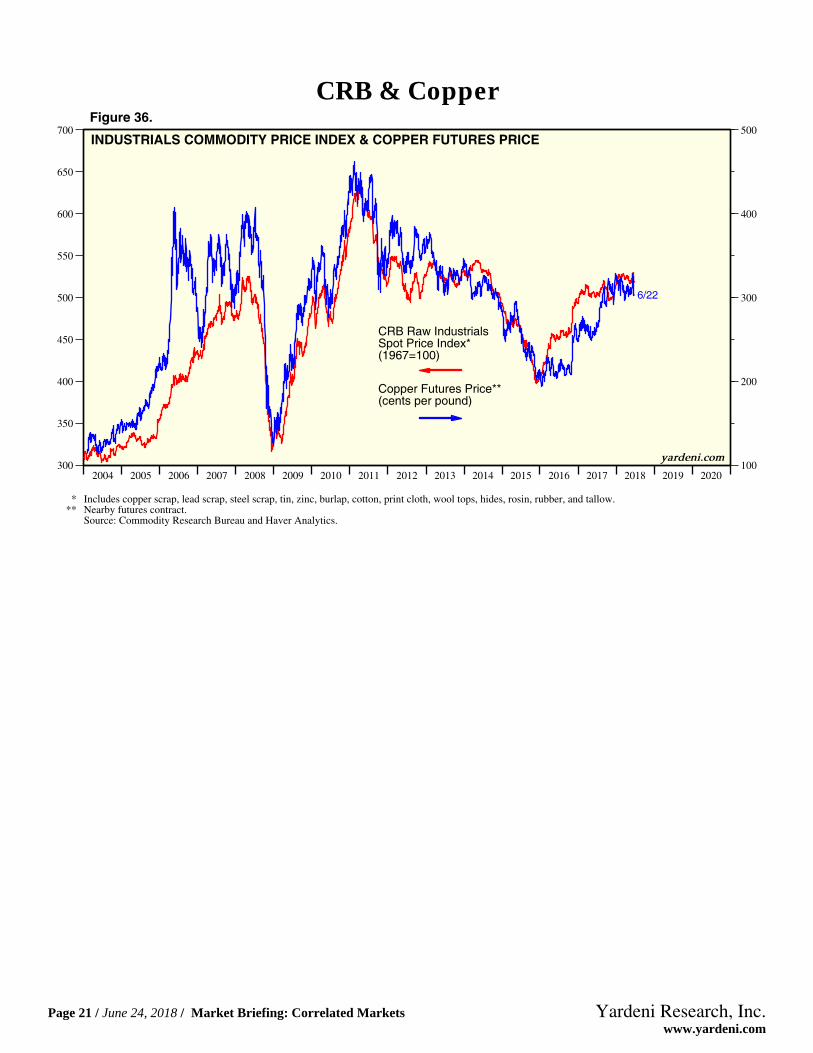
INDUSTRIALS COMMODITY PRICE INDEX & COPPER FUTURES PRICE
Copper Futures Price**(cents per pound)
CRB Raw IndustrialsSpot Price Index*(1967=100)
* Includes copper scrap, lead scrap, steel scrap, tin, zinc, burlap, cotton, print cloth, wool tops, hides, rosin, rubber, and tallow.** Nearby futures contract.
Source: Commodity Research Bureau and Haver Analytics.
yardeni.com
Figure 36.
CRB & Copper
Page 21 / June 24, 2018 / Market Briefing: Correlated Markets www.yardeni.com
Yardeni Research, Inc.
95 96 97 98 99 00 01 02 03 04 05 06 07 08 09 10 11 12 13 14 15 16 17 18 190
50
100
150
0
500
1000
1500
2000
6/21
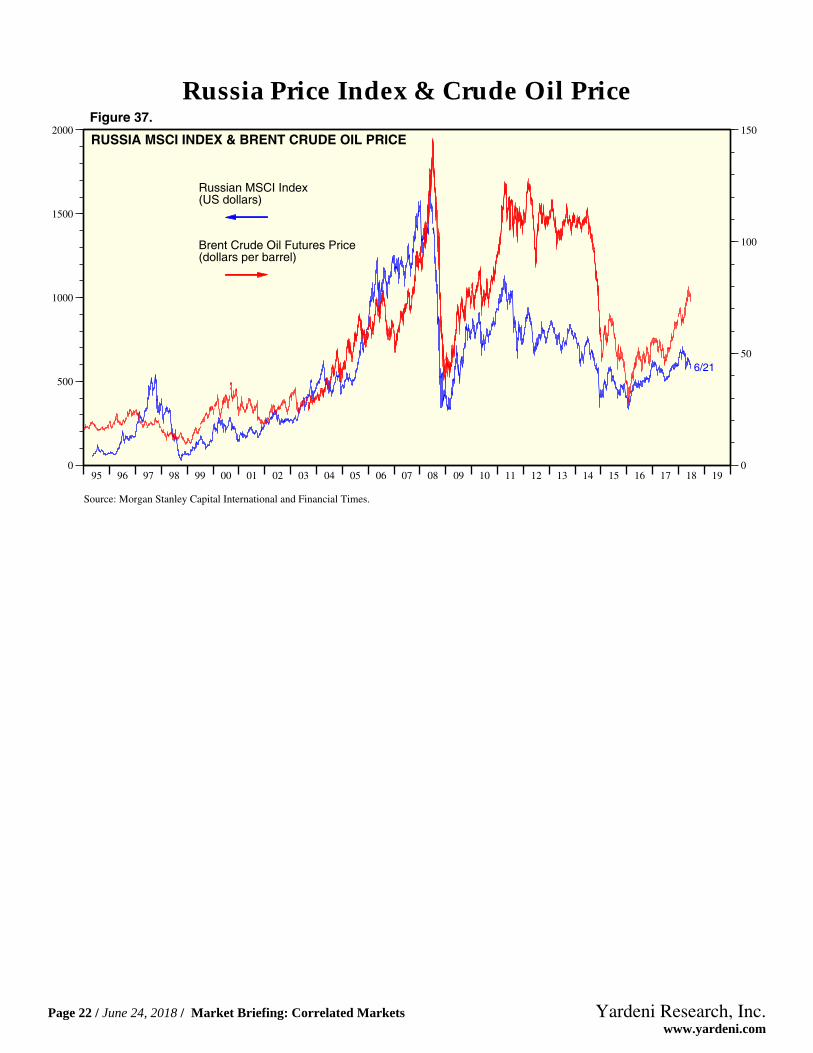
RUSSIA MSCI INDEX & BRENT CRUDE OIL PRICE
Brent Crude Oil Futures Price(dollars per barrel)
Russian MSCI Index(US dollars)
Source: Morgan Stanley Capital International and Financial Times.
Figure 37.
Russia Price Index & Crude Oil Price
Page 22 / June 24, 2018 / Market Briefing: Correlated Markets www.yardeni.com
Yardeni Research, Inc.
2007 2008 2009 2010 2011 2012 2013 2014 2015 2016 2017 2018 2019 2020200
300
400
500
600
700
.0
.2
.4
.6
.8
1.0
1.2
1.4
1.6
1.8
2.0
2.2
2.4
2.6
2.8
3.0
3.2
3.4
6/22
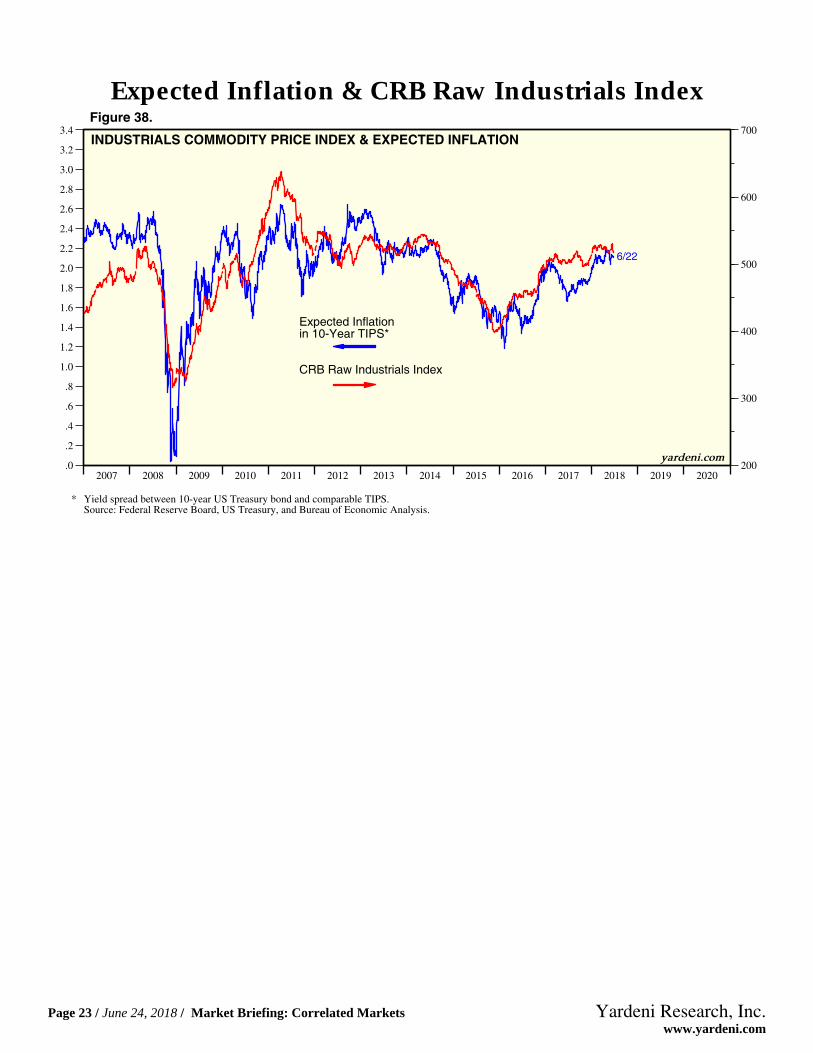
INDUSTRIALS COMMODITY PRICE INDEX & EXPECTED INFLATION
Expected Inflationin 10-Year TIPS*
CRB Raw Industrials Index
* Yield spread between 10-year US Treasury bond and comparable TIPS.Source: Federal Reserve Board, US Treasury, and Bureau of Economic Analysis.
yardeni.com
Figure 38.
Expected Inflation & CRB Raw Industrials Index
Page 23 / June 24, 2018 / Market Briefing: Correlated Markets www.yardeni.com
Yardeni Research, Inc.
http://blog.yardeni.com
http://blog.yardeni.com
Copyright (c) Yardeni Research, Inc. 2018. All rights reserved. The informationcontained herein has been obtained from sources believed to be reliable, but is notnecessarily complete and its accuracy cannot be guaranteed. No representation orwarranty, express or implied, is made as to the fairness, accuracy, completeness, orcorrectness of the information and opinions contained herein. The views and the otherinformation provided are subject to change without notice. All reports posted onwww.yardeni.com, blog.yardeni.com, and YRI’s Apps for iPads and iPhones are issuedwithout regard to the specific investment objectives, financial situation, or particular needsof any specific recipient and are not to be construed as a solicitation or an offer to buy or sellany securities or related financial instruments. Past performance is not necessarily a guideto future results. Company fundamentals and earnings may be mentioned occasionally, butshould not be construed as a recommendation to buy, sell, or hold the company’s stock.Predictions, forecasts, and estimates for any and all markets should not be construed asrecommendations to buy, sell, or hold any security--including mutual funds, futurescontracts, and exchange traded funds, or any similar instruments.
The text, images, and other materials contained or displayed on any Yardeni Research, Inc.product, service, report, email or website are proprietary to Yardeni Research, Inc. andconstitute valuable intellectual property. No material from any part of www.yardeni.com, blog.yardeni.com, and YRI’s Apps for iPads and iPhones may be downloaded, transmitted,broadcast, transferred, assigned, reproduced or in any other way used or otherwisedisseminated in any form to any person or entity, without the explicit written consent ofYardeni Research, Inc. All unauthorized reproduction or other use of material from YardeniResearch, Inc. shall be deemed willful infringement(s) of this copyright and other proprietaryand intellectual property rights, including but not limited to, rights of privacy. YardeniResearch, Inc. expressly reserves all rights in connection with its intellectual property,including without limitation the right to block the transfer of its products and services and/orto track usage thereof, through electronic tracking technology, and all other lawful means,now known or hereafter devised. Yardeni Research, Inc. reserves the right, without furthernotice, to pursue to the fullest extent allowed by the law any and all criminal and civilremedies for the violation of its rights.
The recipient should check any email and any attachments for the presence of viruses.Yardeni Research, Inc. accepts no liability for any damage caused by any virus transmittedby this company’s emails, website, blog and Apps. Additional information available onrequest.