Embed Size (px)
Citation preview

International Journal of Seed Spices
27
Market arrivals and price behaviour of coriander seeds inRajasthan, India
M.D. Meena*, G.Lal and S.S. MeenaICAR-National Research Centre on Seed Spice, Ajmer 305 206 (Rajasthan)
AbstractPresent study was undertaken to study seasonality in arrivals and prices of coriander seeds in Rajasthan, a secondlargest coriander producer in India, using monthly data from January, 2008 to June, 2019. The results of the studydepicted the typical seasonal pattern in coriander arrivals. seasonality index shows more than two hundred percentarrivals during peak months i.e. from February to April. Almost 50 to 60 per cent of annual productions arrives inmarkets during March, April and May months. The variation in prices was comparatively lower than arrivals. Followingthe law of demand, lowest index in prices was measured in February and highest was seen in November. SeasonalIndex for prices varies between 88 to 111 per cent. The coefficient of variation was measured high in arrivals thanprices. The prices has shown increasing trend till 2014 but started declining in later years resulted in decreasing supplyin the studied market in recent years. There was inverse relationship between arrivals and prices in five out of sixstudied markets. Findings of this study highlights lower prices during peak arrival seasons adversely affects theincome of coriander growers in the states, consequently coriander acreage in the state is shrinking. Therefore it isrecommend that coriander seed should be covered under price policy support for adherence to ceiling and floor price sothat further decline in area under this crop can be arrested.
Key words : Arrivals, coriander seed, price, Rajasthan
IntroductionCoriander (Coriandrum sativum L.) is a major seed spicecrop grown in the country under 5.44 lakh ha with nationalproduction of 7.21 lakh tonnes during 2017-18. It is mainlygrown in Madhya Pradesh (2.79 lakh ha), Rajasthan (0.98lakh ha) and Gujarat (0.75 lakh ha) states. Rajasthan (1.30lakh tonnes) is the second largest coriander producingstate in the country, next only to Madhya Pradesh (3.91lakh tonnes), contributing eighteen percent to national areaand production both during 2017-18 (Spice board, 2019-20). In Rajasthan, its cultivation mainly concentrated inBaran, Kota and Jhalawad districts, jointly contributingmore than ninety percent to the states area and productionboth (Table 1). Continuously declining acreage under thiscrop is point to ponder. Prices play a crucial role in areaallocation to a crop (Kumar et al., 2012; Singh et al., 2016;Meena et al., 2018). Continuous decreasing prices since2014 till 2018 may be a main reason for its shrinking areain the state as well as country. More than this, low pricesduring peak seasons further jeopardises the farmersincome. Prices of agricultural commodity generallyexhibited seasonal movements are tangled to the annualnature of the crop (Flaskerud & Johnson 1993). Theseasonal nature of field crops made total supply to the
International J. Seed Spices 10(1), January 2020:27-38
*Corresponding author email: [email protected]
market in short period of time leads to lowest prices nearharvest and the highest prices near the end of themarketing year. Prices follow an upward trend, stayingon-track with the pattern of forward price bids initially laiddown at harvest (Welch, 2011). For most of the field crops,seasonality occurs over a period of 12 month. Seasonalanalysis helps to identify the timing of a season’s highand low and to estimate difference between the high andlow price which are very helpful to take various decisionsby farmers and other stakeholders in supply chain.Data base and methodologyThe present study is based on the prices and arrivals ofcoriander seeds in major APMC markets in Rajasthan.Six markets namely, Atru, Baran, Bhawanimandi, Itawa,Kota and Ramganjmandi were selected based onmaximum arrivals of coriander seeds in the state. Theinformation on arrivals and prices in above markets fromJanuary, 2008 to June, 2019 (138 months) are consideredin the study. The daily basis data were collected fromAgmarknet website were smoothened to monthly basis.Analysis of data :According to multiplicative model price series can bedecomposed into four component i.e. Trend, Cyclical,Seasonal and Irregular components.
International Journal of Seed Spices
28
P= T*C*S*EWhere; P is price, T is Trend component, C is Cyclicalcomponent, S is Seasonal component and E is Randomcomponent.To study trends in arrivals and prices, compound growthrates of arrivals and prices of coriander seeds in studymarkets was worked out as belowY=abt
Where; Y is monthly arrivals/prices, a is constant, b istrend co-efficient and t is time periodAnnual compound growth rate (CGR) is calculated asCGR (%) = (Antilog of b-1) × 100This study focused on the seasonal component byremoving other components (viz; trend, cyclical andrandom) from price series. To estimate the seasonal priceindex, central moving average (CMA) was estimated usingthe following formula
∑PiCMAt =
n
( )t -1
i =2 n-1
Where: CMA = Central Moving Average, P = Nominalprice, n= number of periodsCMA eliminates random variations and emphasizessystematic movements of variables series. This techniquesubstitutes the observed value in the time series by theaverage of that value and a given number of theobservations taken immediately before and after it.Consequently, the CMA has the same trend as the price,show cyclical fluctuations appearing in the original series.The CMA represents the trend and cyclical componentsof the original series, and eliminates seasonality andrandomness (Bashir, 2003).The formula for seasonal index (SI) can then be writtenasSI= TCSEi/TCi=SEi=(Pi/CMAi)*100SI includes seasonal fluctuation in addition to randomness(E). The SI is already deflated as it is calculated by dividingnominal price series (the original price) by another nominalseries (for details see Abba, 2009).
Results and discussionCultivation of coriander in study areaCoriander cultivation in Rajasthan mainly concentrated inHadoti region comprised of Kota, Baran, Bundi andJhalawad districts. During study period, Kota, Baran andJhalawad districts jointly contributes 93 to 96 per centshare to states total area and production. Since 2008-09the coriander acreage in the state shown decreasing trend
at compound growth of -2.2 per cent per annum. After2011-12 its area and production reduced to less than halfin Baran district; the second largest coriander growingdistrict of Rajasthan. In same period, production decreasedat more than double rate (-4.9%) indicates increasingvulnerability of this crop in main coriander growing beltsof the state (Table 1). The productivity of coriander reduceddrastically from 700 to 574 kg/ha during the year 2013-14and 2014-15, respectively due to continuous increase inseverity of seed and soil borne stem gall disease in popularcultivated varieties like RCr-436 and CS-6 in the last fouryears. (Singh et al., 2016 and Malhotra et al/, 2016). Thesevere attack of stem gall in these districts coupled withdecreasing market price for this crops (Fig. 5) since 2013-14 havocked the coriander growers resulting continuouslyfalling acreage and production of this crop in study area.Shrinking coriander acreage needs attention of theresearcher and policymakers at central and state levels.Arrivals pattern of coriander seedsBased on quantity of arrivals Atru, Baran, Itawa,Ramganjmandi, Kota and Bhawanimandi are the largestmarkets in study area. During study years half to twothird of the state production was found to land in thesemarkets. Only 40 per cent of Baran district productionarrived in Atru and Baran markets; 13 per cent of Jhalawaddistrict production arrived in Bhawanimandi marketswhereas 270 per cent of Kota districts production arrivelin Itawa, Ramganjmandi and Kota markets. This indicatesinter-district movements from nearby districts. FromFigure 1 it can be seen that Kota and Ramganjmandi aremost preferred markets throughout the study period.
From table 2 it is quite visible that coriander arrivals inthe study markets especially in Kota is declining after2012 because of decreasing production in study area.Highest arrival of 31902 tonnes in a single month wasrecorded in Kota market during March, 2012 followed byRamgandmandi during May, 2010 (29226 tonnes). In lastthree years, Ramganjmandi is preferred over Kota as moreproduce is arriving in this market indicates increasingpreference for this market among coriander growers since2017 (Table 2). Ramganjmandi is also known as coriandercity because it has marked several records in corianderseed arrivals. It manifested with highest single day arrivalsof 4890 tonnes as well as highest average daily arrivalsof 1532 tonnes during May 2010. Many spices giant likeMDH and big exporters buys its raw material fromRamganjmandi, makes this market special Grade-Acoriander markets of the country. During study periodarrivals recorded highest growth in Kota followed by

International Journal of Seed Spices
29
Baran Jhalawar Kota Rajasthan Year Area Prod. Area Prod. Area Prod. Area Prod.
2008-09 90683 110647 96940 92187 49135 63055 250520 280310
2009-10 77423 100236 97940 107542 50589 67495 232140 281080
2010-11 59979 86179 85795 69683 45452 57307 187890 218900
2011-12 85432 115321 117368 123037 57744 83371 260000 311000
2012-13 45890 66071 72186 66872 36704 50367 250000 300000
2013-14 52713 30254 76130 50602 48524 32354 182730 117080
2014-15 64815 60824 106697 92010 67954 42023 249310 198760
2015-16 44953 63645 98356 89650 54890 58231 212730 227200
2016-17 39372 61678 91636 80099 39687 52281 181710 206960
CGR (%) -8.45 -9.12 -0.35 -2.37 0.03 -4.49 -2.20 -4.91
Source: Compiled from crop production statistics, Govt. Of Rajasthan
Table 1. Area (in ha) and production (in tonnes) of coriander in study area
Fig. 1. Market-wise monthly arrivals of coriander seeds (in tonnes)
Ramganjmandi market. On the other hand negative growthwas observed in Atru, Baran, Bhawanimandi and Itawamarkets indicates diversion of produce from abovemarkets to Kota and Ramganjmandi over the period oftime. Highest year to year variation as represented bycoefficient of variation was seen in Kota market.Comparatively lower degree of inter year variation wasmeasured in Ramganjmandi market.Seasonality in arrivals of coriander seedsIn Rajasthan, coriander for seed purpose is generally sownduring second fortnight of October and harvesting startsfrom late February with peak in months of March. Arrivalsfrom new season produce start from February. Figure 2
shows yearwise arrivals from 2008 to 2018. In most ofthe years maximum arrivals could be seen in month ofMarch followed by April, May and June except 2010 and2015.Figure 3 clearly depicts the seasonality in the arrivals ofcoriander seeds during the study period. In this graphhigh degree of arrival concentration in the months of March,April and May is quite visible. The average monthly arrivalsin studied markets during March, April, May and Junewere 5370.34, 4872.65, 3813.27 and 2313.51 tonnesrespectively. The lowest arrival 1125.79 tonnes wasrecorded in August followed by January 1263.69 tonnes.This pattern shows low holding capacity of the coriander

International Journal of Seed Spices
30
Year Atru Baran B’mandi R’mandi Itawa Kota 2008 5583.70 21972.40 7814.60 28464.60 1773.20 60891.00 2009 7104.40 26970.00 8984.00 33535.20 5486.90 78753.20 2010 6040.00 23651.20 9336.50 70783.60 6543.90 76157.50 2011 10403.20 17425.40 9882.40 34073.40 7867.70 101237.90 2012 5300.80 27754.00 18512.20 61959.90 9080.50 135898.60 2013 4446.10 27132.00 7349.00 55060.60 9422.60 116672.30 2014 5160.20 21004.00 15723.90 50755.50 14013.20 94119.20 2015 3292.10 13872.50 8243.40 34211.13 7538.40 66159.30 2016 2939.30 14165.60 7608.10 43039.60 4718.20 69541.60 2017 3076.40 19875.50 8164.10 56065.40 4467.70 51756.90 2018 8693.20 22218.20 6713.10 62056.50 3657.30 30569.30 2019 5398.90 9386.80 4353.80 36301.30 2145.80 13077.70 Average 5639.95 21458.25 9848.30 48182.31 6779.05 80159.71 CGR (%) -0.12 -0.18 -0.32 0.40 -0.50 0.43 C.V. (%) 98.68 58.22 101.41 88.46 84.95 110.49 Note: Year 2019 considered January to June arrival only. CGR and CV measure the growth and variation in annual total arrivals.
Table 2. Annual arrival of coriander seeds (in tonnes)
Fig. 2. Year wise monthly arrivals of coriander seeds (in tonnes)
Fig. 3. Average monthly arivals of coriander seeds (in tonnes)
500.001500.002500.003500.004500.005500.006500.007500.008500.009500.00 2008
2009
2010
2011
2012
2013
20142015
2016
2017
2018
2019
International Journal of Seed Spices
31
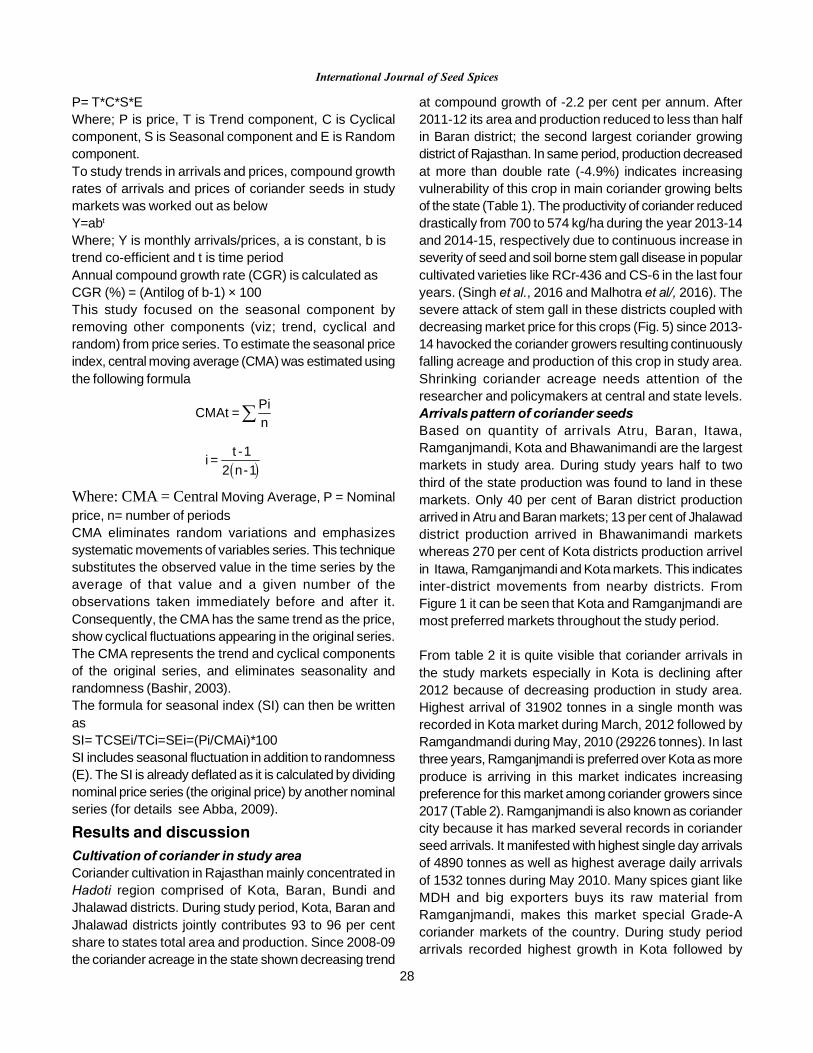
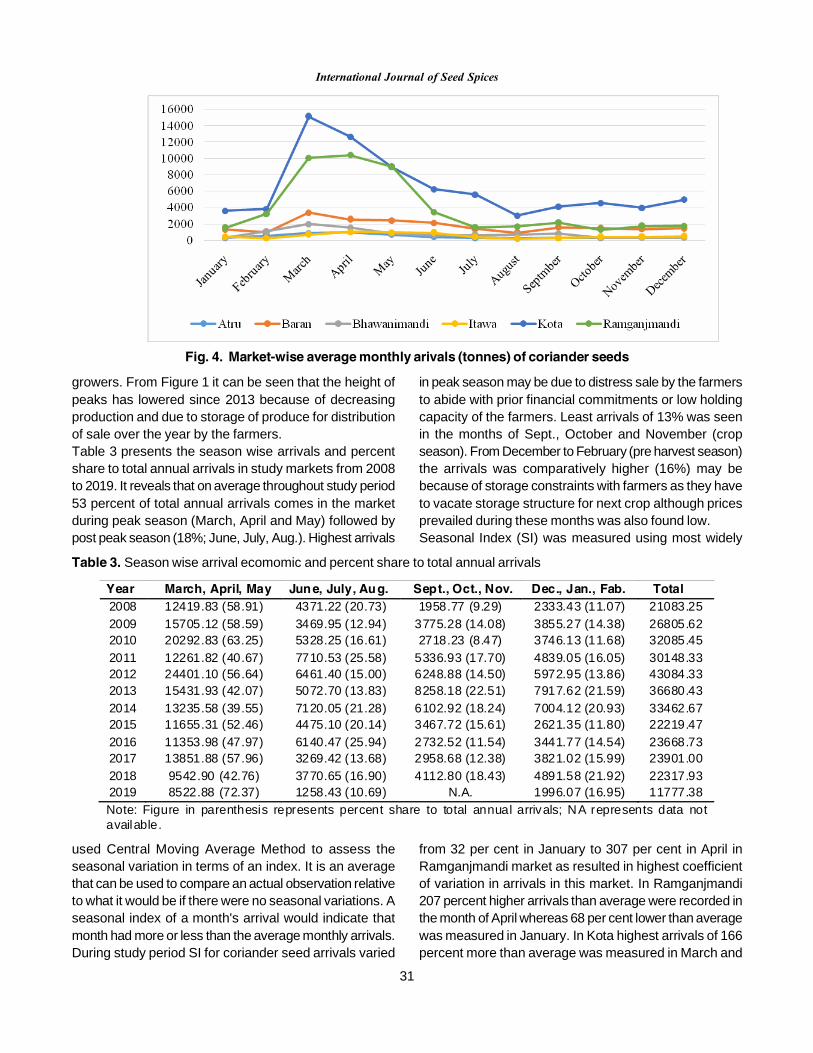
growers. From Figure 1 it can be seen that the height ofpeaks has lowered since 2013 because of decreasingproduction and due to storage of produce for distributionof sale over the year by the farmers.Table 3 presents the season wise arrivals and percentshare to total annual arrivals in study markets from 2008to 2019. It reveals that on average throughout study period53 percent of total annual arrivals comes in the marketduring peak season (March, April and May) followed bypost peak season (18%; June, July, Aug.). Highest arrivals
in peak season may be due to distress sale by the farmersto abide with prior financial commitments or low holdingcapacity of the farmers. Least arrivals of 13% was seenin the months of Sept., October and November (cropseason). From December to February (pre harvest season)the arrivals was comparatively higher (16%) may bebecause of storage constraints with farmers as they haveto vacate storage structure for next crop although pricesprevailed during these months was also found low.Seasonal Index (SI) was measured using most widely
Fig. 4. Market-wise average monthly arivals (tonnes) of coriander seeds
Year March, April, May June, July, Aug. Sept., Oct., Nov. Dec., Jan., Fab. Total 2008 12419.83 (58.91) 4371.22 (20.73) 1958.77 (9.29) 2333.43 (11.07) 21083.25 2009 15705.12 (58.59) 3469.95 (12.94) 3775.28 (14.08) 3855.27 (14.38) 26805.62 2010 20292.83 (63.25) 5328.25 (16.61) 2718.23 (8.47) 3746.13 (11.68) 32085.45 2011 12261.82 (40.67) 7710.53 (25.58) 5336.93 (17.70) 4839.05 (16.05) 30148.33 2012 24401.10 (56.64) 6461.40 (15.00) 6248.88 (14.50) 5972.95 (13.86) 43084.33 2013 15431.93 (42.07) 5072.70 (13.83) 8258.18 (22.51) 7917.62 (21.59) 36680.43 2014 13235.58 (39.55) 7120.05 (21.28) 6102.92 (18.24) 7004.12 (20.93) 33462.67 2015 11655.31 (52.46) 4475.10 (20.14) 3467.72 (15.61) 2621.35 (11.80) 22219.47 2016 11353.98 (47.97) 6140.47 (25.94) 2732.52 (11.54) 3441.77 (14.54) 23668.73 2017 13851.88 (57.96) 3269.42 (13.68) 2958.68 (12.38) 3821.02 (15.99) 23901.00 2018 9542.90 (42.76) 3770.65 (16.90) 4112.80 (18.43) 4891.58 (21.92) 22317.93 2019 8522.88 (72.37) 1258.43 (10.69) N.A. 1996.07 (16.95) 11777.38 Note: Figure in parenthesis represents percent share to total annual arrivals; NA represents data not available.
Table 3. Season wise arrival ecomomic and percent share to total annual arrivals
used Central Moving Average Method to assess theseasonal variation in terms of an index. It is an averagethat can be used to compare an actual observation relativeto what it would be if there were no seasonal variations. Aseasonal index of a month's arrival would indicate thatmonth had more or less than the average monthly arrivals.During study period SI for coriander seed arrivals varied
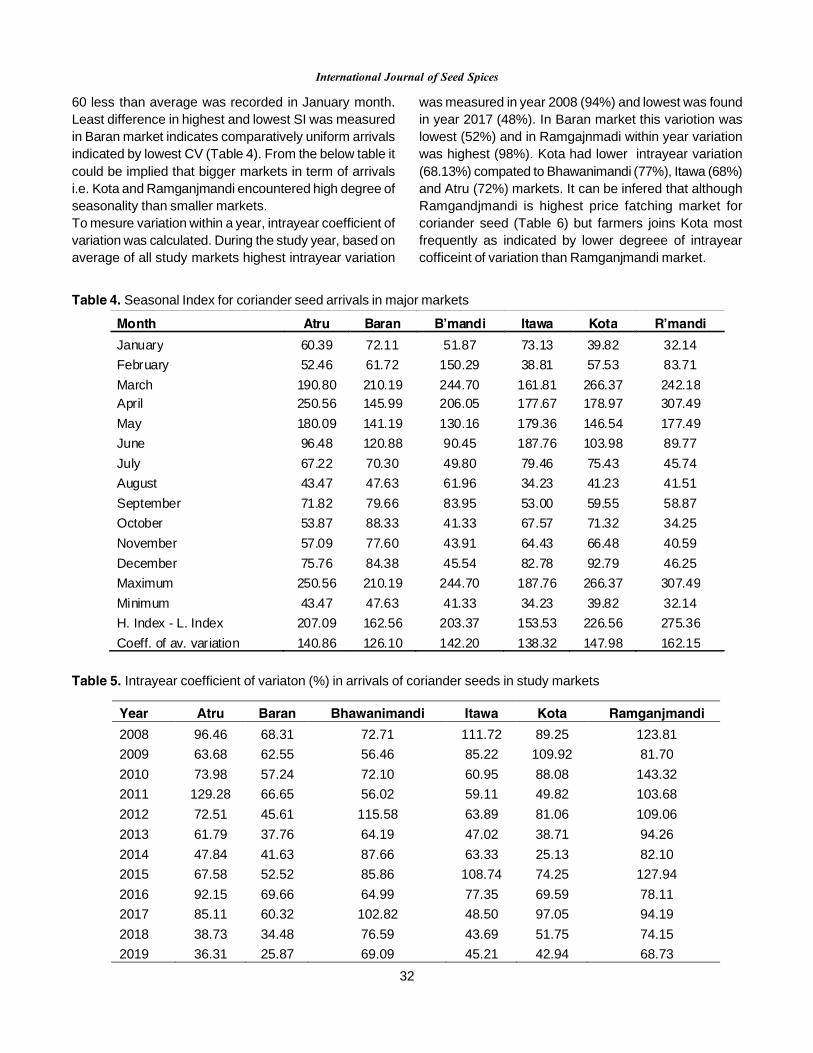
from 32 per cent in January to 307 per cent in April inRamganjmandi market as resulted in highest coefficientof variation in arrivals in this market. In Ramganjmandi207 percent higher arrivals than average were recorded inthe month of April whereas 68 per cent lower than averagewas measured in January. In Kota highest arrivals of 166percent more than average was measured in March and
International Journal of Seed Spices
32
60 less than average was recorded in January month.Least difference in highest and lowest SI was measuredin Baran market indicates comparatively uniform arrivalsindicated by lowest CV (Table 4). From the below table itcould be implied that bigger markets in term of arrivalsi.e. Kota and Ramganjmandi encountered high degree ofseasonality than smaller markets.To mesure variation within a year, intrayear coefficient ofvariation was calculated. During the study year, based onaverage of all study markets highest intrayear variation
Month Atru Baran B’mandi Itawa Kota R’mandi January 60.39 72.11 51.87 73.13 39.82 32.14 February 52.46 61.72 150.29 38.81 57.53 83.71 March 190.80 210.19 244.70 161.81 266.37 242.18 April 250.56 145.99 206.05 177.67 178.97 307.49 May 180.09 141.19 130.16 179.36 146.54 177.49 June 96.48 120.88 90.45 187.76 103.98 89.77 July 67.22 70.30 49.80 79.46 75.43 45.74 August 43.47 47.63 61.96 34.23 41.23 41.51 September 71.82 79.66 83.95 53.00 59.55 58.87 October 53.87 88.33 41.33 67.57 71.32 34.25 November 57.09 77.60 43.91 64.43 66.48 40.59 December 75.76 84.38 45.54 82.78 92.79 46.25 Maximum 250.56 210.19 244.70 187.76 266.37 307.49 Minimum 43.47 47.63 41.33 34.23 39.82 32.14 H. Index - L. Index 207.09 162.56 203.37 153.53 226.56 275.36 Coeff. of av. variation 140.86 126.10 142.20 138.32 147.98 162.15
Table 4. Seasonal Index for coriander seed arrivals in major markets
was measured in year 2008 (94%) and lowest was foundin year 2017 (48%). In Baran market this variotion waslowest (52%) and in Ramgajnmadi within year variationwas highest (98%). Kota had lower intrayear variation(68.13%) compated to Bhawanimandi (77%), Itawa (68%)and Atru (72%) markets. It can be infered that althoughRamgandjmandi is highest price fatching market forcoriander seed (Table 6) but farmers joins Kota mostfrequently as indicated by lower degreee of intrayearcofficeint of variation than Ramganjmandi market.
Year Atru Baran Bhawanimandi Itawa Kota Ramganjmandi 2008 96.46 68.31 72.71 111.72 89.25 123.81 2009 63.68 62.55 56.46 85.22 109.92 81.70 2010 73.98 57.24 72.10 60.95 88.08 143.32 2011 129.28 66.65 56.02 59.11 49.82 103.68 2012 72.51 45.61 115.58 63.89 81.06 109.06 2013 61.79 37.76 64.19 47.02 38.71 94.26 2014 47.84 41.63 87.66 63.33 25.13 82.10 2015 67.58 52.52 85.86 108.74 74.25 127.94 2016 92.15 69.66 64.99 77.35 69.59 78.11 2017 85.11 60.32 102.82 48.50 97.05 94.19 2018 38.73 34.48 76.59 43.69 51.75 74.15 2019 36.31 25.87 69.09 45.21 42.94 68.73
Table 5. Intrayear coefficient of variaton (%) in arrivals of coriander seeds in study markets

International Journal of Seed Spices
33
Price analysisAgricultural prices play a significant role in the overallfarm economy of the country and thus receiveconsiderable concern of policymakers. Understanding thetime-series properties of agricultural prices is a prerequisiteto analyzing risk management and forecasting problems(Tomek, 1994). During study period, coriander seed pricesvaried from ` 2203 to 9656 per quintal in studied markets.Highest average price was recorded in Ramganjmandifollowed by Kota whereas lowest prices prevailed inBhawanimandi (table 6). Figure 5 and 6 presents monthlyaverage and annual average price of coriander seed instudy period. It can be seen that prices starts fallingcontinuously since August, 08 till June, 2010 and prevailslow till end of 2010. From January, 2011 onwards, pricesshows recovery and attained its highest level throughoutstudy period to ` 9659 a quintal in November 2014 inItawa and ` 9494 per quintal in Ramganjmandi duringDecember, 2014 (Fig. 4). This tempo of higher prices couldnot sustain for longer period and started declining from2015 to 2017 continuously (Fig. 5). Between 2015 and2017 per quintal price of coriander seeds decreased bythree to four thousand. As result per quintal price decreasedto less than half to ` 4000 a quintal in March, 2017 andprevails low till November, 2018. Recovery in prices sinceOctober, 2018 was seen with a jump of ` 3000 per quintalas a results unit prices moved to more than seven
thousand a quintal by June, 2019. From figure below wecan observe that there is almost six year price cycle frompeak to peak in coriander seed prices in the studiedmarkets. It can be inferred that during study period priceshas almost doubled from ` 3500 to 7000 a quintal in twelveyears period showing decreasing trend from 2008 to 2010and increasing trend from 2010 to 2014 again decreasingtrend from 2015 to 2017 and upward trend from 2018 to2019 involving various upward and downward movementsin between.During the study period prices increased with a highestcompound growth of 0.39 per cent per annum inRamganjmandi market whereas least growth (0.28%) wasmeasured in Itawa market. The highest growth in pricesin Ramganjmandi market may be the main reason forincreasing arrivals in this market during recent years. Thecoefficient of variation in the monthly modal prices variedfrom 33 to 36 per cent. Variation in modal prices wasalmost one third to the monthly arrivals. Intra year variationin prices was measured to compare and measure withinyear fluctuation in prices during study years. The averagepercent variation in a year was measured from 11 to 12percent. It was highest in Ramganjmandi (12.04%) andlow in Kota (11.42%) only higher than Bhawanimandi. Itshows that although prices were higher in Ramganjmandibut within year variation was also high in this marketrepresents lower stability within a year (table 7).
Particulars Atru Baran B’mandi Itawa Kota R’mandi Mean 5089.82 5113.21 4866.10 4871.57 5128.10 5242.19 Minimum 2325.00 2202.63 2232.90 2244.52 2305.96 2360.17 Maximum 9399.17 9466.20 8408.84 9656.16 9486.96 9494.96 C.V. (%) 34.06 36.22 32.69 36.66 35.03 35.51
Table 6. Descriptive statistics of monthly prices of coriander seed ( ` Quintal-1) from January 2008 to June 2019
Fig. 5. Market-wise monthly average prices ( ` Quintal-1) of coriander seeds
2000400060008000
10000
JAN
-08
JUN
-08
NO
V-0
8
APR
-09
SEP
-09
FEB
-10
JUL
-10
DEC
-10
MAY
-11
OCT
-11
MAR
-12
AUG
-12
JAN
-13
JUN
-13
NO
V-1
3
APR
-14
SEP
-14
FEB
-15
JUL
-15
DEC
-15
MAY
-16
OCT
-16
MAR
-17
AUG
-17
JAN
-18
JUN
-18
NO
V-1
8
APR
-19
Atru Baran Bhawanimandi Itawa Kota Ramganjmandi

International Journal of Seed Spices
34
Table 7. Average annual price of coriander seeds ( ` Quintal-1) with intra-year coefficient of variation (%)
Fig. 6. Year wise monthly average prices ( ` Quintal-1) of coriander seeds
Year Atru Baran B’mandi Itawa Kota R’mandi
2008 5298.27 (22.75)
5661.22 (24.18)
5327.20 (18.97)
5659.50 (25.00)
5589.76 (22.79)
5533.09 (20.78)
2009 3846.78 (7.35)
3895.55 (9.12)
3841.10 (6.43)
3545.29 (8.37)
3602.72 (8.64)
3761.68 (5.04)
2010 2560.04 (8.97)
2471.28 (10.22)
2598.18 (8.83)
2491.44 (8.49)
2564.44 (9.21)
2686.73 (15.64)
2011 3879.31 (6.95)
3798.26 (6.78)
3401.82 (7.31)
3732.68 (7.91)
3933.15 (8.30)
3829.98 (8.28)
2012 3675.42 (16.83)
3389.59 (12.24)
3160.80 (11.82)
3316.32 (12.19)
3421.83 (8.79)
3475.01 (7.62)
2013 5355.12 (12.21)
5409.90 (8.59)
4931.42 (14.06)
5326.02 (9.44)
5519.21 (11.07)
5402.26 (8.35)
2014 8140.03 (11.39)
8172.06 (14.01)
6975.58 (11.70)
8330.29 (13.25)
8179.27 (12.49)
7832.27 (13.02)
2015 7564.39 (11.72)
7888.38 (15.16)
7460.60 (11.87)
7099.28 (14.66)
7783.25 (7.23)
8075.24 (12.60)
2016 6195.56 (6.35)
6170.62 (5.00)
6004.46 (7.84)
5615.81 (6.56)
6201.45 (7.45)
7274.80 (12.15)
2017 4607.78 (13.43)
4533.80 (14.21)
4411.13 (12.97)
4149.62 (13.74)
4663.39 (15.98)
5065.95 (20.24)
2018 4447.36 (9.75)
4421.44 (9.49)
4936.94 (9.50)
4083.24 (9.68)
4639.02 (12.38)
4566.25 (8.72)
2019 5925.64 (13.35)
5979.55 (12.74)
5821.83 (11.87)
5347.09 (10.52)
5751.36 (12.74)
5563.89 (12.02)
Avg. 5089.82 5113.21 4866.09 4871.57 5128.10 5242.19
CGR (%) 0.36 0.35 0.38 0.28 0.37 0.39
C.V. (%) 33.94 36.09 32.57 36.53 34.90 35.38
Note: CGR and CV measure the growth and variation in annual prices. Figure in parenthesis represents intra-yearcoefficient of variation (%)

International Journal of Seed Spices
35
Due to seasonality in production, consumption andexpensive storage, prices of agricultural commoditiesfollows a seasonal pattern. Agricultural commodity pricesare generally lower during the harvesting season due toadequate supply and high during the end of the marketingseason due to inadequate availability of the crop (Tiwari,et al., 2017). This pattern normally repeats itself year afteryear. Monthly price data of an agricultural commoditymeasure the seasonal pattern in its prices. Seasonalityis expressed as 12 indexes that represent the ratio of theeach month price to the average annual price. SeasonalIndex in coriander seed prices was measured to checkthe per cent change in particular month over annualaverage. Results in table 8 shows that during study yearsprice ranges from 111 to 88 percent i.e. at most 11 percentabove average and 12 percent below average. The highestprice index was almost 111 percent in April against a lowof 88 per cent in February in Bhawanimandi market. In
coriander seeds average high price index for the six studiedmarkets was 107 percent and average low price indexwas 91.23 percent. On average, the difference betweenhigh and low price index among the above markets was15 percent. In Kota where a high arrival lands, a high of104 percent in November and a low of 92 per cent inOctober observed wherein Ramganjmandi a high of 106percent in April and low of 95 percent in October wasseen. In month of March when maximum produce arrivedin markets the SI for price was measured less than 100percent in Atru, Baran and Itawa markets and above than100 in Bhawanimandi, Kota and Ramganjmandi markets.It concludes that if coriander farmers want to sale theirproduce in peak harvest season should move toBhawanimandi, Kota and Ramganjmandi markets andshould stay away from Baran and Itawa markets. Thevariation in coriander seeds prices was comparativelylower than paddy where it varied from 160 to 60 percent(Nasurudeen et al. 2007).
Month Atru Baran Bhawanimandi Itawa Kota Ramganjmandi January 99.35 103.42 96.41 102.89 103.36 100.58 February 88.81 93.03 87.73 93.18 92.51 100.88 March 95.79 94.62 106.78 90.51 103.92 101.18 April 104.39 99.67 110.61 100.00 103.99 105.67 May 100.33 95.59 101.71 96.51 99.51 101.14 June 99.79 96.35 96.40 97.16 96.18 98.88 July 106.12 101.61 102.39 107.68 102.80 98.51 August 100.38 106.12 103.26 104.01 103.15 102.94 September 99.32 101.65 93.85 100.19 97.25 98.79 October 96.29 100.17 93.55 95.92 91.86 95.46 November 106.09 104.53 104.22 106.96 104.04 99.80 December 103.36 103.24 103.10 104.99 101.42 96.20
Maximum 106.12 106.12 110.61 107.68 104.04 105.67 Minimum 88.81 93.03 87.73 90.51 91.86 95.46 C.V. (%) 17.76 13.14 23.08 17.32 12.43 10.15
Table 8. Seasonal Index (in %) for coriander seed prices in major markets
From the Figure 7 it can be seen that highest prices of` 5276 quintal-1 prevailed in the month of Novemberfollowed by April ( ` 5259 quintal-1) against lowest in themonth of February ( ` 4523 quintal-1). Prices in the sixmonths namely, February, March, May, June, Septemberand October was recorded lower than average annualprices wherein other six months i.e. January, April, July,August, November and December were higher thanaverage annual prices. The modal prices in Novemberwere found 15 per cent higher than February month. We
can observe that prices starts declining from Novemberand remains low till February, tends to increase from March.Trend and correlation in average annual arrivals andprices of coriander seedsFigure 8 & 9 presents the trend in annual arrivals andprices respectively in the studied markets. Trend is thegeneral tendency of a series to increase or decrease overa period. In order to understand the secular trend of arrivalsand prices of coriander seeds the linear equations fordifferent studied markets were estimated using OLS

International Journal of Seed Spices
36
Fig. 7. Average prices ( ` Quinatal-1) of coriander seed throughout study years
regression for the study years. At five percent level ofsignificance, there was significant increase in modal pricesin all the studied markets over the study years (Table 9).Keeping other things constant, highest yearly increase inquintal-1 price of ` 202 was estimated in Ramganjmandimarket, followed by Bhawanimandi ( ` 196 a quintal)and Kota ( ` 185 a quintal) markets. Wherein Atru leastincrease in unit prices was seen. In arrivals of corianderseed, there was increasing trend in Ramganjmandi marketthroughout study years. Highest increase in unit pricesper year may be the main reason for such increasingarrivals in Ramganjmandi over the period, surpassing theKota (the largest among studied market) since year 2017.Rest of the markets, other than Ramganjmandi observednegative trend in arrivals over the years. Significantdecrease in arrivals measuring 950 quintals per years inBaran and 5317 quintals in Kota markets was estimated.
This decrease in arrivals in spite of significant increase inannual prices was mainly due to decrease in corianderproduction in study area as result of shrinking area. Ageneral trend is that the arrival in a market adversely affectsthe prices to a large extent. Hence, correlation coefficientwas measured to examine the relationship between annualarrivals and annual prices during study period and theresults of the analysis are presented in last coulomb oftable 9. All other markets except Itawa showed negativecorrelation between arrivals and prices. Highest degree ofinverse relationship was found in Baran market followedby Atru. Means these two markets are highly manipulatedby commission agents and traders who refrains thefarmers in getting good prices for their produce. In Kotathere was least degree in negative correlation. Similarresults were also found by Makama et al. (2016) in riceand by Verma et al. (2013) in cumin.
Markets Price trend Arrivals trend Correlation between price and arrivals
Atru 3927.52 + 84.17 *(t) 6781.5 – 178.7 (t) -0.48
Baran 3994.93 + 177.60* (t) 26627.5 – 950*(t) -0.50
Bhawanimandi 3634.31 + 195.63* (t) 11674.9 – 315.5 (t) -0.20
Itawa 4055.45 + 128.61* (t) 7363.1 – 149.2 (t) 0.34
Kota 3952.19 + 184.90* (t) 109130.0 – 5317.0* (t) -0.17
Ramganjmandi 3944.48 + 201.71* (t) 42711.6 + 689.3 (t) -0.38
Table 9. Trend in annual price and arrivals of coriander seed and correlation between its price and arrivals

International Journal of Seed Spices
37
Fig. 8. Market-wise annual arrival of coriander seeds ( in tonnes)
Fig. 9. Market-wise annual prices of coriander seeds ( ` quintal–1)
ConclusionsFrom January, 2008 to June, 2019 prices of corianderseed shows various up and down movements. It increasedfrom 2008 to 2014 later on shown decreasing trend tillend of 2018 and again revived in 2019. The arrivals ofthis crop has increased from 126 thousand tonnes in 2008to 258 thousand tonnes in 2012 but reduced sharply to133 thousand tonnes in 2018. Decreasing prices coupledwith various biotic and abiotic stresses leads to in areashrunk under this crop significantly results in arrivals inthe study markets have decreased. There is high degreeof seasonality in arrivals indicates low holding capacityof the farmers. Seasonality in prices was measured lowerthan arrivals. There was negative correlation between
arrivals and prices of coriander seed points out marketinginefficiencies. The revival in price during 2019 shows goodsign for attracting more acreage under this crop in nearfuture.
ReferencesAbba, A. 2009. Framework for Agricultural Market Analysis:
Theories and Applications. ABU Press Ltd., Zaria,Kaduna State, Nigeria.
Bashir, N.M. 2003. Temporal and Spatial price analysisof Sesame Marketing in Gedarif Area. PhD Thesisof the Department of Agricultural Economics,University of Khartoum, Sudan.
Flaskerud, G. and Johnson, D. 1993. Seasonal PricePatterns for Crops (Bulletin 61). Fargo: North DakotaState University Extension Service.

International Journal of Seed Spices
38
Kumar, A., Kumar, P. and Sharma, A.N. 2012. Cropdiversification in eastern India: Status anddeterminants. Indian J. Agricultural Economics,67(4): 601- 616.
Makama, S.A., Amrutha, T.J., Lokesha, H. and Koppalkar,B.G. 2016. Analysis of Seasonal price Variation ofRice in India. Research J. Agriculture and ForestrySciences, 4(6): 1-6.
Malhotra, S.K., Kakani, R.K., Sharma, Y.K. and Singh,D.K. 2016. Ajmer coriander (NRCSS ACr-1)resistant to stem gall disease an innovative farmingtechnology. Indian J. Arecanut, Spices & MedicinalPlants, 18 (3): 3-7
Meena, M., Khunt, K.A. and Meena, H.N. 2018. Costsand returns in groundnut cultivation: A spatio-temporal analysis. Indian J. Economics andDevelopment, (14): 587-599.
Nasurudeen, P.K., Thimmappa, A.K., Kuruvila, A.,Chandrasekar, V. and Shendil, R. 2007. Thebehaviour of market arrivals and prices of paddy inKanniakovil regulated market.Technical report,Marketing Frocasting Centre, Pandit Jawahar LalNehru, Collage of Agri. & Res. Inst., Karaikal-609603, Puducherry. Available atwww.researchgate.net/publication/329799418_accessed on Mar 13 2020.
Singh, J., Kaur A.P. and Singh A. 2016. Empirical Analysisof Area Response in Crop Production of Punjab:Determinants of Crop Area Allocation. AgriculturalSituation in India November, 2016.
Singh, D.K., Kakani, R.K., Khan, M.A., Aswal, S. andSolanki, R.K. 2016. Expansion of coriander varietyACr-1 in Haroti region of Rajasthan. InternationalJ. Seed Spices, 6(1): 86-89.
Tiwari, A.K., Dutta, S. and Dash, A.K. 2017. Testing ofthe Seasonal Unit Root Hypothesis in the PriceIndices of Agricultural Commodities in India. AsianJ. Agriculture and Development, 14(2): 63-82.
Tomek, W.G. 1994. Dependence in commodity prices:comment. J. Futures Markets, 14: 103–109.
Verma, V.K., Kumar, P. and Verma, B.L. 2013. Marketarrival and price behavior of cumin in Mandormarket of Jodhpur distric of Rajasthan. InternationalJ. Commerce and Business Management, 6(2):352-356.
Welch M., Waller, M.L., Amosson, S.H. and Tierney,W.I.Jr. 2011. Seasonality and its effects on cropmarkets. E-313 RM2-5.0 11-11. Agrilife extension,Texas A&M University System.
Received : October 2019; Revised : November 2019; Accepted : December 2019.