Embed Size (px)
Citation preview
MARKET ANALYSIS OF DEMAND FOR SENIOR HOUSING AND RELATED SERVICES
IN THE HAWLEY, MINNESOTA HAWLEY MARKET AREA MARCH 2013
Purpose of the Study
The City of Hawley contracted with Health Planning & Management Resources, Inc. (HP&MR), Edina, Minnesota, to complete a market analysis of demand for senior housing and related services for the Hawley, Minnesota Market Area. Study Process
The information presented in this market analysis was compiled through the following processes:
• Defining a Market Area based on discussions with the City Treasurer, and the Eventide President and considering the proximity of other communities with senior housing options available
• Gathering and analyzing socio-demographic data for the defined Hawley
Market Area and Clay County
• Profiling general assisted living, memory loss assisted living, and independent congregate housing near the Hawley Market Area
• Projecting the demand for general and memory loss assisted living and
independent congregate housing for the Hawley Market Area
• Developing recommendations related to potential development
1
Definition of Senior Housing Types for Projecting Housing Demand
For the purposes of this study, two types of senior housing were considered in the analysis and defined as follows.
Independent congregate housing was identified for this study as apartment or town home style living for persons 65 years of age and older. Independent congregate housing facilities typically have a minimum age requirement of 55; however, demand projections reflect those individuals 65 years of age and older. An individual will rent or purchase a living unit, which may be either a one or two-bedroom apartment, with a full kitchen. In apartment-style congregate housing, the building is designed to accommodate a daily meal service, if desired, as well as social-recreational spaces. The building and apartments are designed to be accessible and accommodating to seniors aging in place. The buildings have secured entrances, and there is an emergency call system available for individuals within their apartments. Services, e.g., meals, housekeeping, personal care, etc., are generally optional services purchased if the occupant desires or needs them. Most older persons who move to these types of buildings do so because of convenience and concern about being able to maintain their single-family homes. Persons are also beginning to experience some health problems. In the demand analysis, independent congregate housing demand relates to the building that is designed to be accessible and accommodating to seniors as they age in place.
For the purposes of this study, assisted living is defined as follows. The reader should note that “assisted living” is not a precise term that clearly defines levels of care for persons who are in assisted living.
Assisted living is for very frail elderly persons with three or more limitations in activities of daily living. Persons who need assisted living are persons who need help in the daily management of their lives, as well as someone available 24 hours a day for oversight and assistance. Persons living in assisted living are more likely to have “unscheduled” needs that arise compared to more independent housing in which persons schedule their assistance. Gerontology research has substantiated that persons who have three or more limitations in activities of daily living are at a degree of frailty that it is difficult for them to maintain themselves in the independent setting.
2
If assisted living meets the above definition, e.g., 24-hour staffing, it has emerged as an alternative to the nursing home for many older persons. In the past, persons who needed this level of service had no option other than the nursing home. Persons coming to assisted living generally have at least two meals per day provided and frequently, all three meals, have planned social and recreational activities, housekeeping of their living units, and some assistance with laundry and have assistance with personal care. Living units in such buildings vary in size and have included one-room, two-room suites and apartments. Some include small cooking facilities, e.g., microwave, sink and small refrigerators. In most newly designed projects, and projects for the private pay market, there are generally private bathroom accommodations for each unit.
Older persons who have moderate to severe Alzheimer’s disease are increasingly being taken care of in the assisted living setting, particularly those who can afford to pay privately for this type of care. The assisted living setting provides ideal circumstances for persons with Alzheimer’s disease if it has specialty programming for this population. Many persons with Alzheimer’s disease do not have health and/or medical needs that necessitate living in a nursing facility with 24-hour availability of this type of care. However, these persons need to be in a sheltered and structured situation. Many general assisted living facilities have older persons who are in the earliest stages of the disease and do not present the risk of leaving the facility unattended and are not a problem for other residents, e.g., going into their rooms, etc. However, when persons progress to the moderate stage, they are difficult to manage in a general assisted living setting.
The reader should note the above definitions are based on general market definitions. These definitions are reflected in the demand section of the report. The reader should also note these definitions are used in determining whether facilities are classified as independent and congregate housing or assisted living. This sometimes differs from how the building administrator describes his/her facility and/or has it licensed. In Minnesota, Housing with Services is a registration for senior housing that provides some services to the persons living in the building. In addition, if a provider is providing home care services only to the residents of the building that he/she operates, a Class F home care license can be obtained, which is much less onerous than a licensed home health care agency that serves the general public. In Minnesota, payment is available for qualifying persons through Group Residential
3
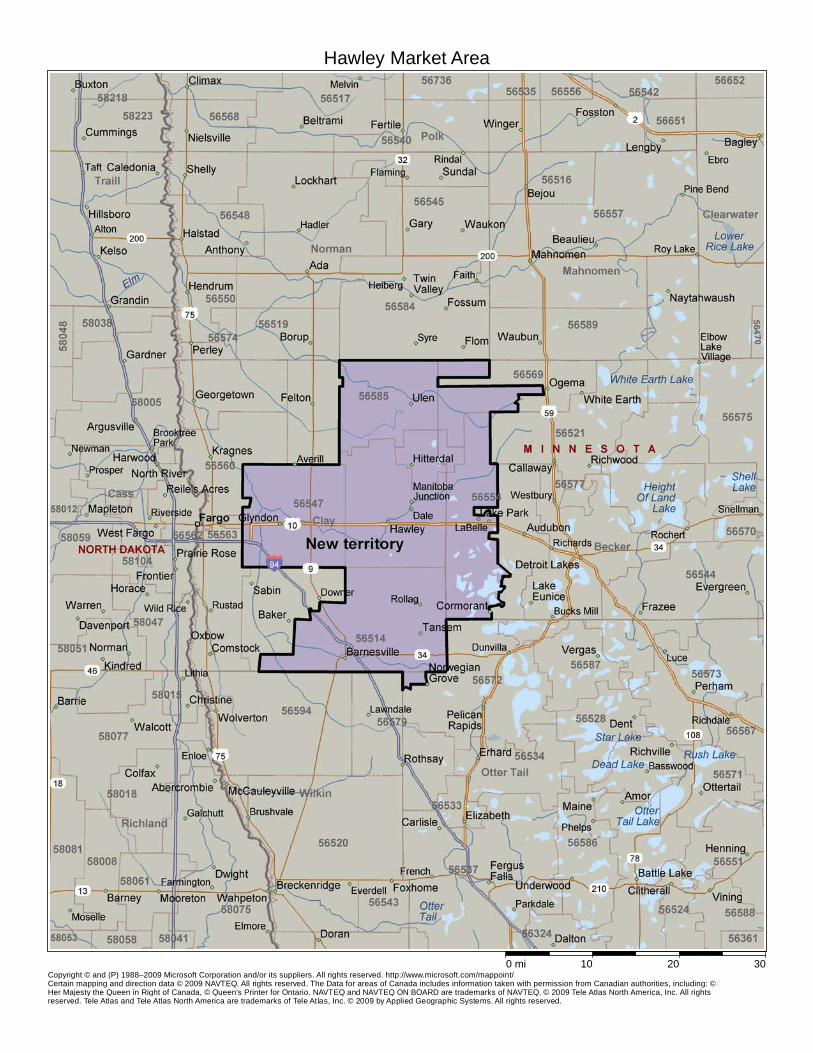
Housing for room and board and through the Elderly Waiver Program (Customized Living) for services that persons need. Definition of the Hawley Market Area The Hawley Market Area was defined as the following zip codes: 56514 – Barnesville 56547 – Glyndon 56549 – Hawley 56552 – Hitterdal 56554 – Lake Park 56585 – Ulen The researcher assumed that 70 percent of the units would be occupied by persons in the Hawley Market Area and the other 30 percent would be from places near the market and/or persons moving family members who need assistance to live closer to them.
Facilities in and near the Hawley Market Area were profiled to assist in determining what expectations may be in the area for senior housing, including prices. The map on page 16 identifies these areas. Socio-Demographic Analysis of the Hawley Market Area and Clay County
The following analysis presents selected socio-demographic information for the Hawley Market Area and Clay County. Clay County was used to compare with the dynamics of the Hawley Market Area. The information presents estimates for 2013 and projections for 2018. The population data available from the 2010 U.S. Census is incorporated into the estimates and projections. The source of this information is Claritas, Inc., Arlington, Virginia. Claritas, Inc. maintains an on-line database that provides detailed socio-demographic data about the defined Hawley Market Area, including current year population estimates and five-year population projections.
4
Long-term demographic information for Clay County through the year 2035 is also presented. The source of this information is Minnesota State Demographic Center. Minnesota State Demographic Center information is available on a statewide and countywide basis.
Information taken from Claritas, Inc. and Minnesota State Demographic Center will differ somewhat. In the researcher’s experience, Claritas, Inc. is a more sensitive database because it is updated annually. Also, because of methods used for estimating and projecting population, Claritas, Inc. is more likely to identify growth trends or decreases in population than the State database. For example, in 2013, Claritas, Inc. estimates the total senior population 65 years of age and older in Clay County to be 7,484 persons, while the Minnesota State Demographic Center estimates 6,940 in 2010, which is a difference of 544 persons.
General Population Trends and Senior Population Characteristics
Included in this analysis are charts reflecting trends and characteristics of the total population and the senior population 65 years of age and older in the Hawley Market Area and Clay County.
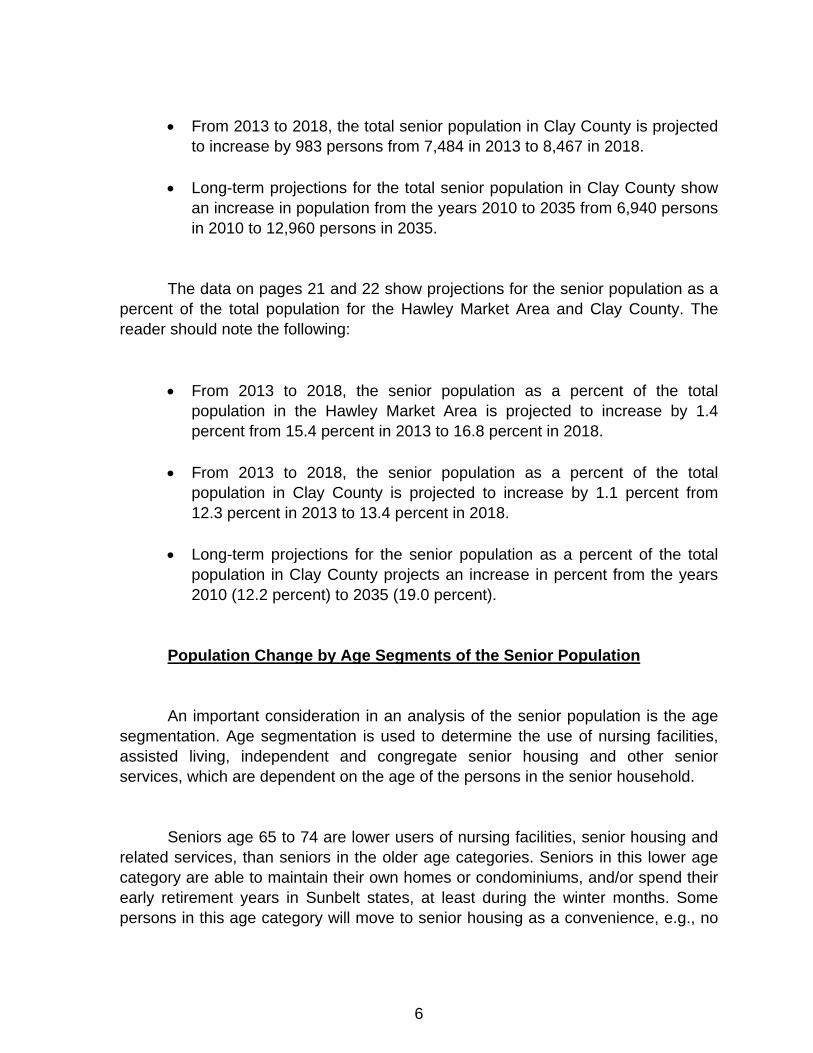
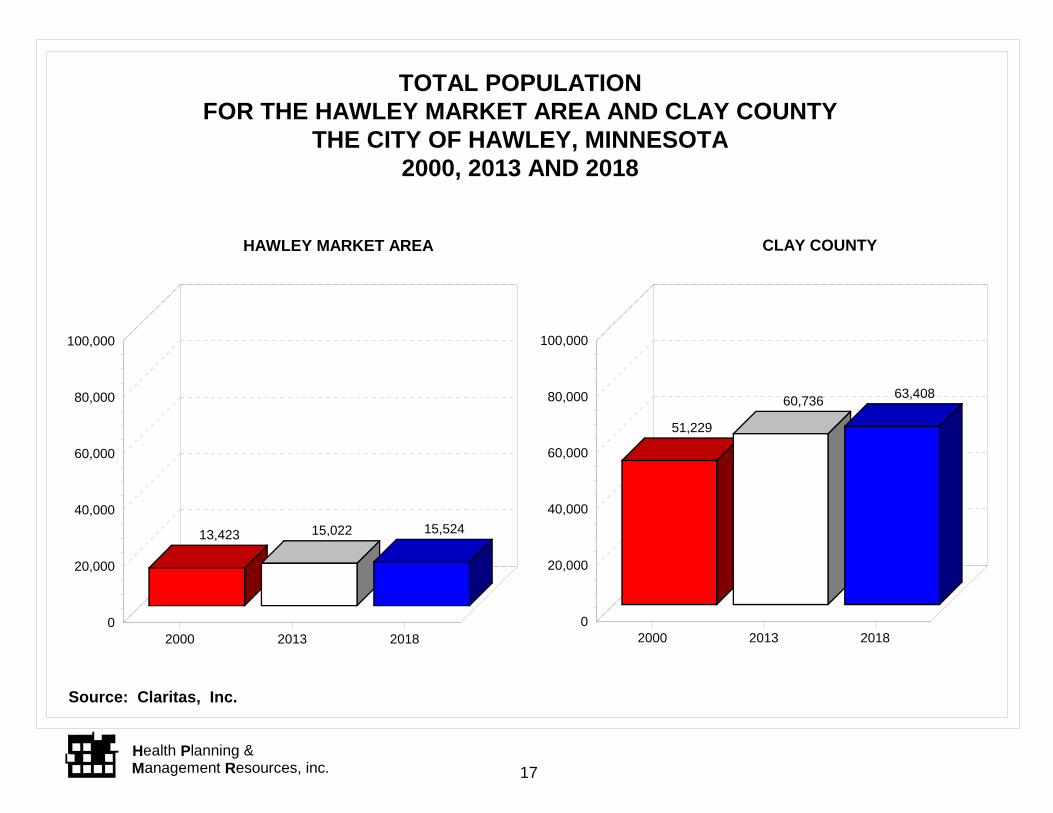
The data on pages 17 through 20, for the Hawley Market Area and Clay County, show projections for both the total population and the senior population.
• From 2013 to 2018, the total population in the Hawley Market Area is projected to increase by 502 persons from 15,022 in 2013 to 15,524 in 2018.
• From 2013 to 2018, the total population in Clay County is projected to
increase by 2,672 persons from 60,736 in 2013 to 63,408 in 2018.
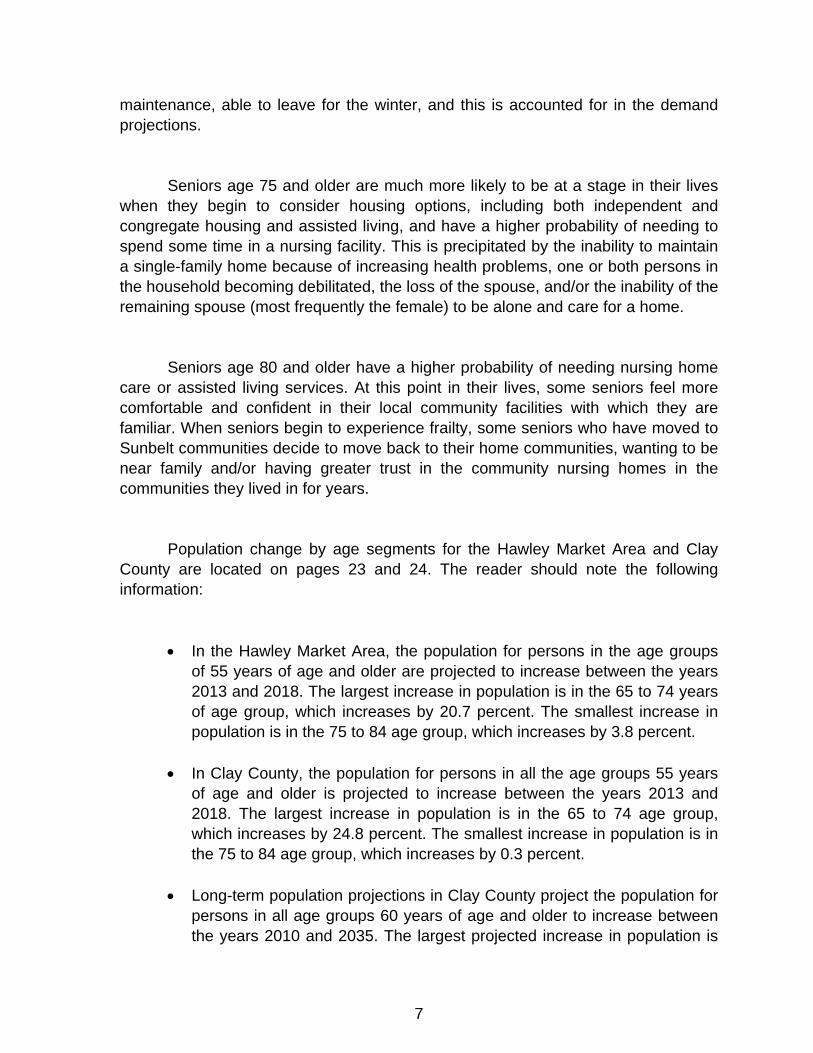
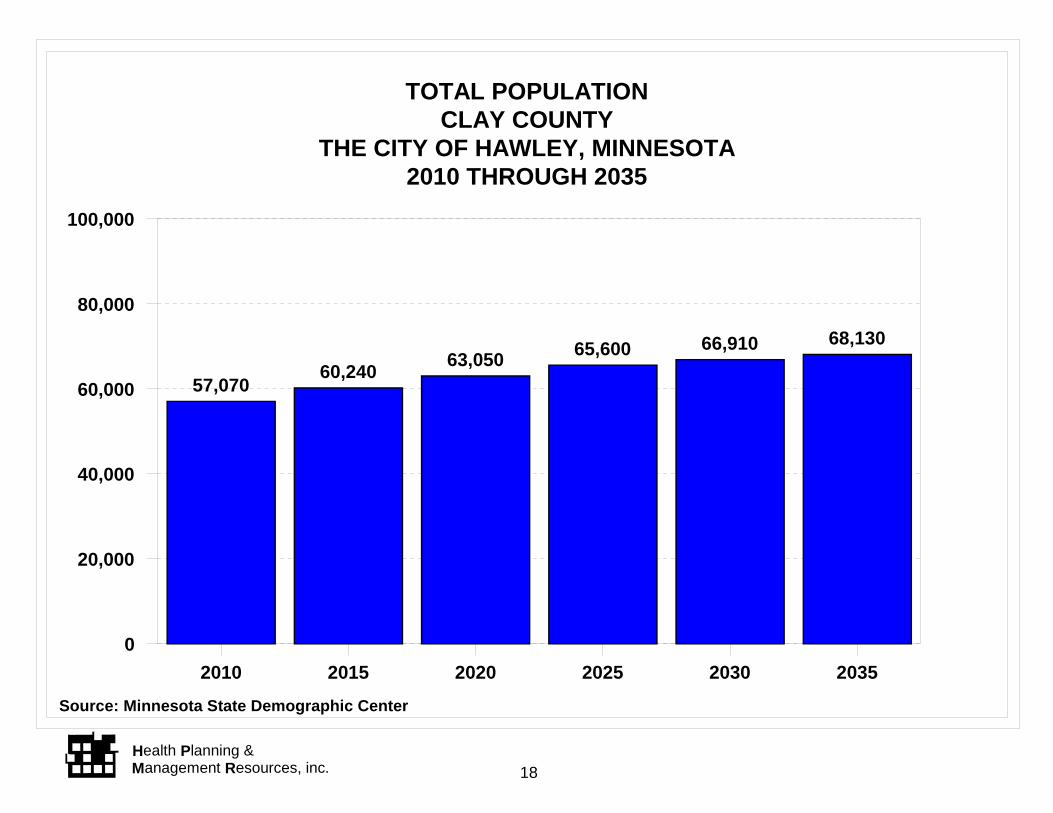
• Long-term projections for the total population in Clay County show an increase in population from the years 2010 to 2035 from 57,070 persons in 2010 to 68,130 persons in 2035.
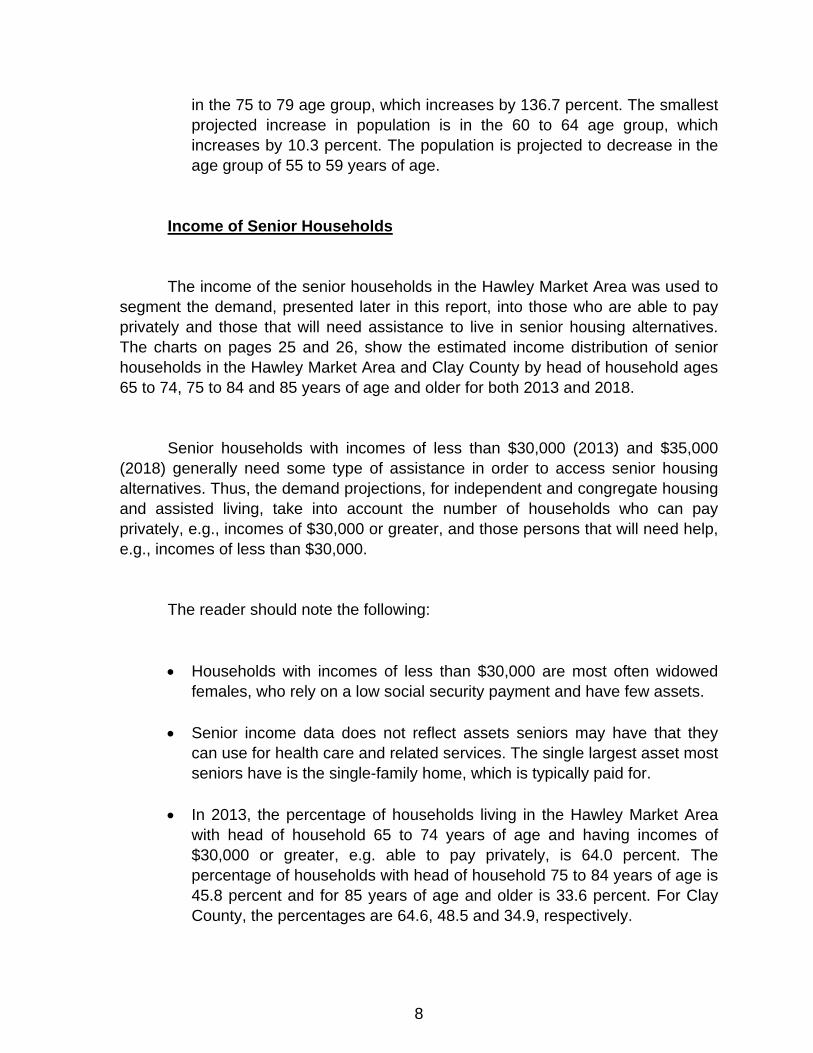
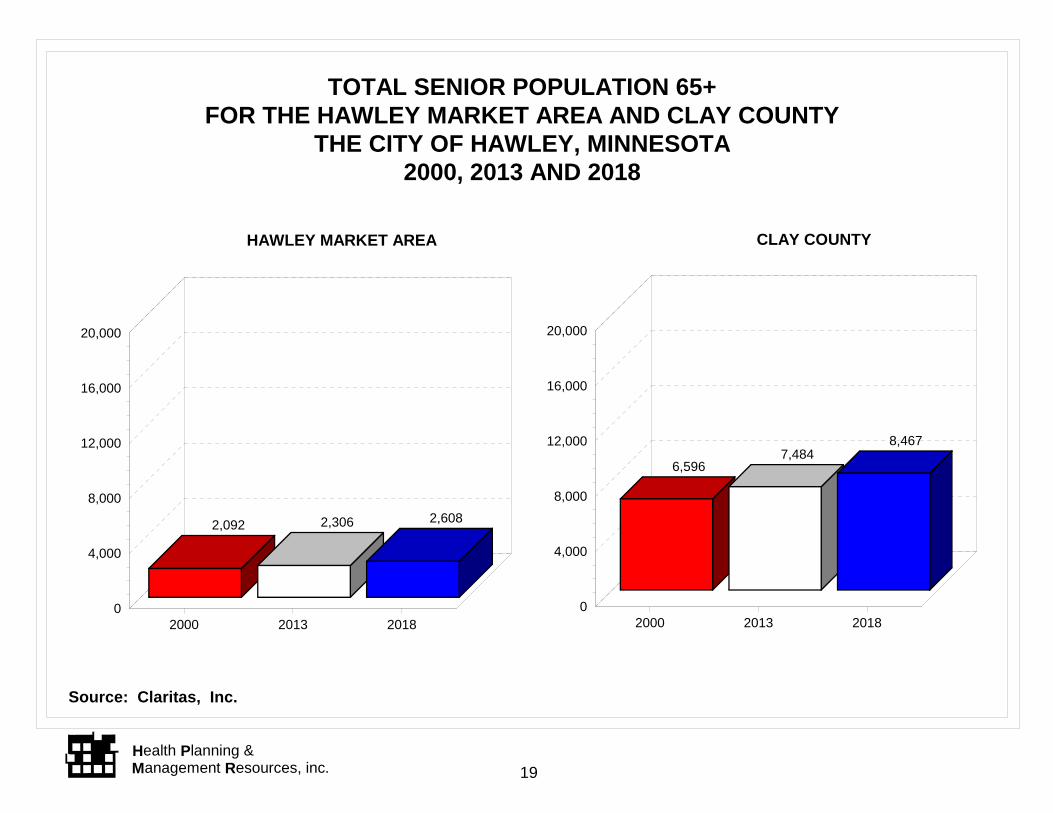
• From 2013 to 2018, the total senior population in the Hawley Market Area
is projected to increase by 302 persons from 2,306 in 2013 to 2,608 in 2018.
5
• From 2013 to 2018, the total senior population in Clay County is projected
to increase by 983 persons from 7,484 in 2013 to 8,467 in 2018.
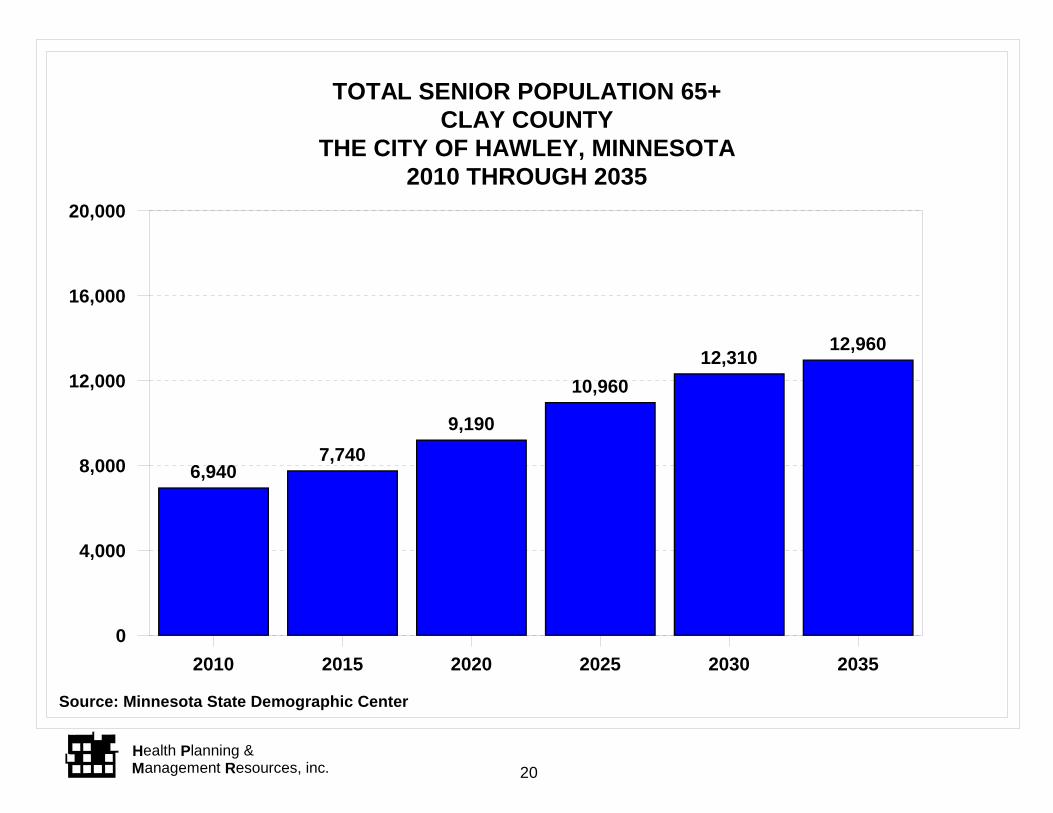
• Long-term projections for the total senior population in Clay County show an increase in population from the years 2010 to 2035 from 6,940 persons in 2010 to 12,960 persons in 2035.
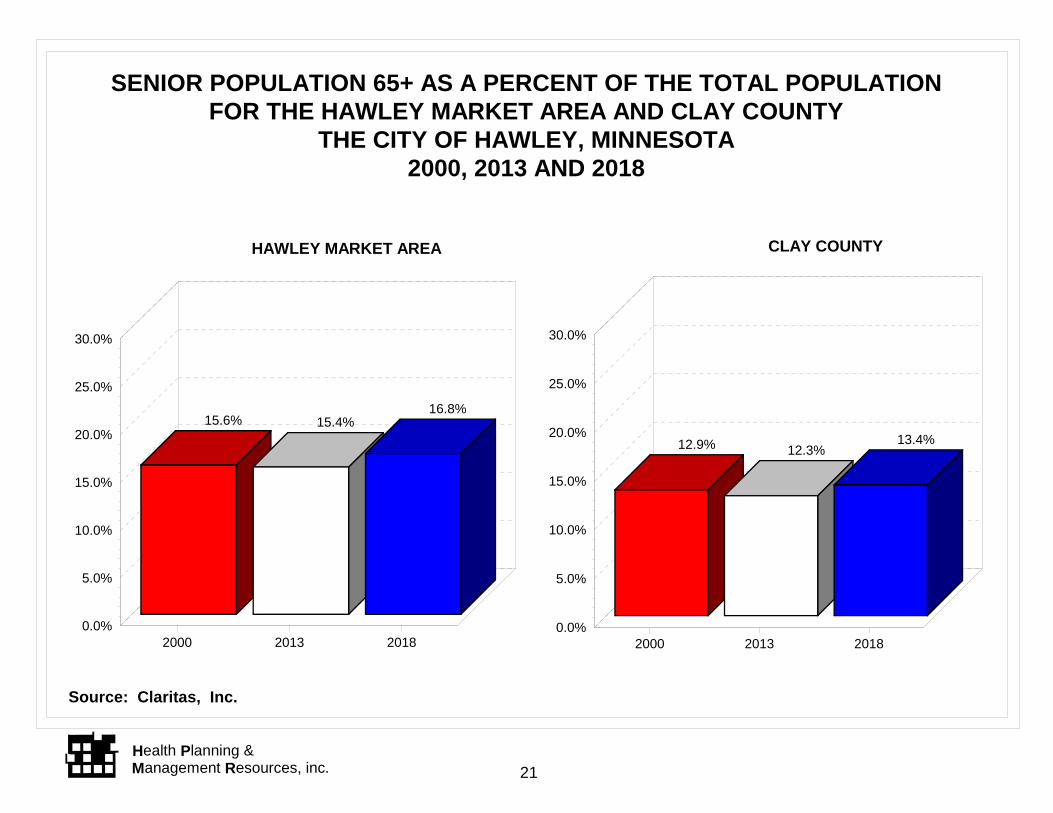
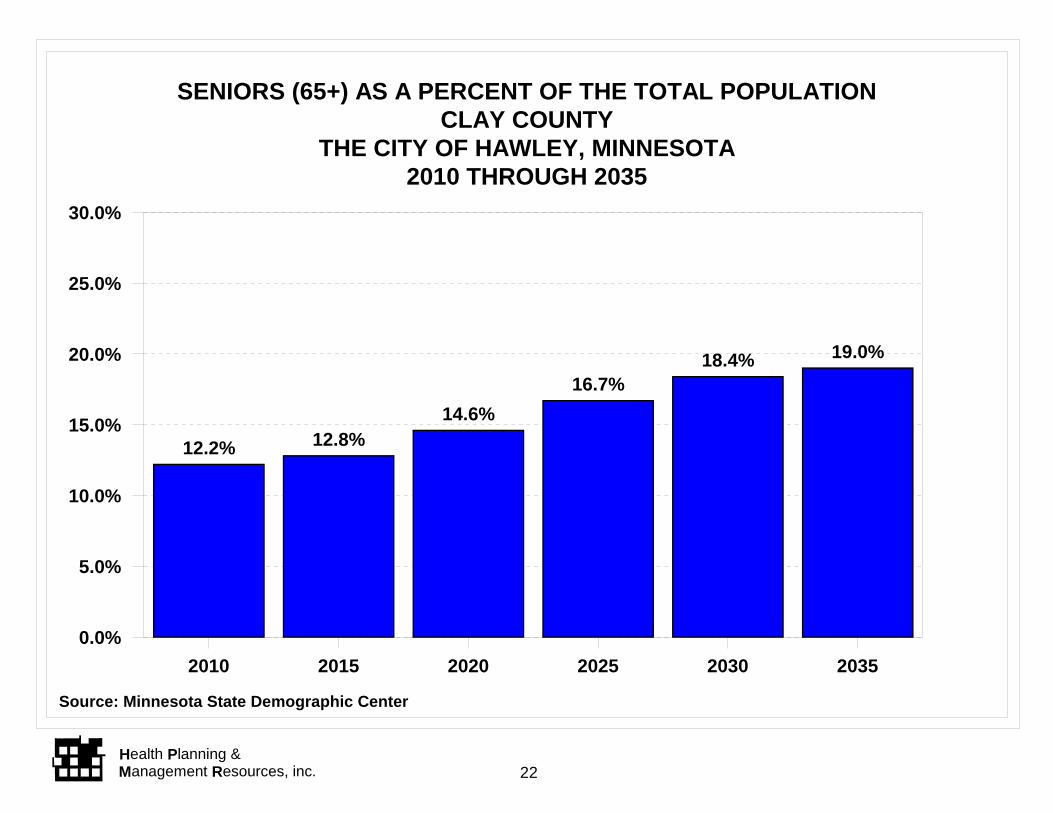
The data on pages 21 and 22 show projections for the senior population as a percent of the total population for the Hawley Market Area and Clay County. The reader should note the following:
• From 2013 to 2018, the senior population as a percent of the total population in the Hawley Market Area is projected to increase by 1.4 percent from 15.4 percent in 2013 to 16.8 percent in 2018.
• From 2013 to 2018, the senior population as a percent of the total
population in Clay County is projected to increase by 1.1 percent from 12.3 percent in 2013 to 13.4 percent in 2018.
• Long-term projections for the senior population as a percent of the total
population in Clay County projects an increase in percent from the years 2010 (12.2 percent) to 2035 (19.0 percent).
Population Change by Age Segments of the Senior Population
An important consideration in an analysis of the senior population is the age segmentation. Age segmentation is used to determine the use of nursing facilities, assisted living, independent and congregate senior housing and other senior services, which are dependent on the age of the persons in the senior household.
Seniors age 65 to 74 are lower users of nursing facilities, senior housing and related services, than seniors in the older age categories. Seniors in this lower age category are able to maintain their own homes or condominiums, and/or spend their early retirement years in Sunbelt states, at least during the winter months. Some persons in this age category will move to senior housing as a convenience, e.g., no
6
maintenance, able to leave for the winter, and this is accounted for in the demand projections.
Seniors age 75 and older are much more likely to be at a stage in their lives when they begin to consider housing options, including both independent and congregate housing and assisted living, and have a higher probability of needing to spend some time in a nursing facility. This is precipitated by the inability to maintain a single-family home because of increasing health problems, one or both persons in the household becoming debilitated, the loss of the spouse, and/or the inability of the remaining spouse (most frequently the female) to be alone and care for a home.
Seniors age 80 and older have a higher probability of needing nursing home care or assisted living services. At this point in their lives, some seniors feel more comfortable and confident in their local community facilities with which they are familiar. When seniors begin to experience frailty, some seniors who have moved to Sunbelt communities decide to move back to their home communities, wanting to be near family and/or having greater trust in the community nursing homes in the communities they lived in for years.
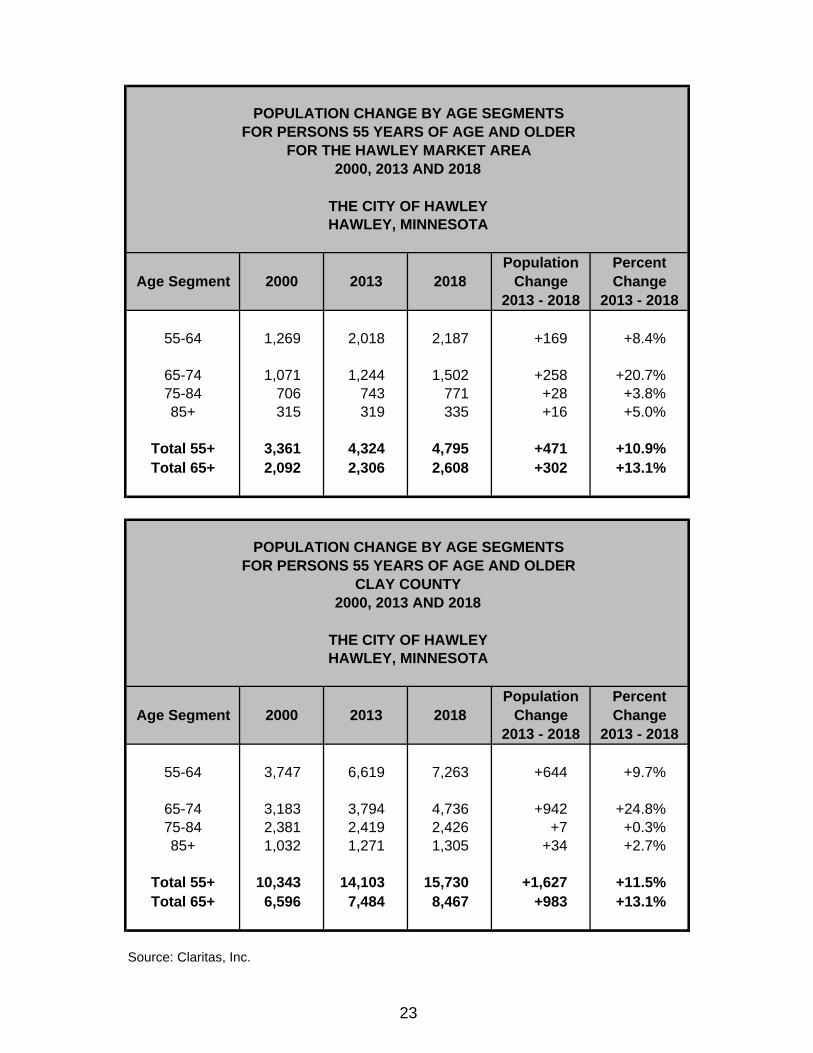
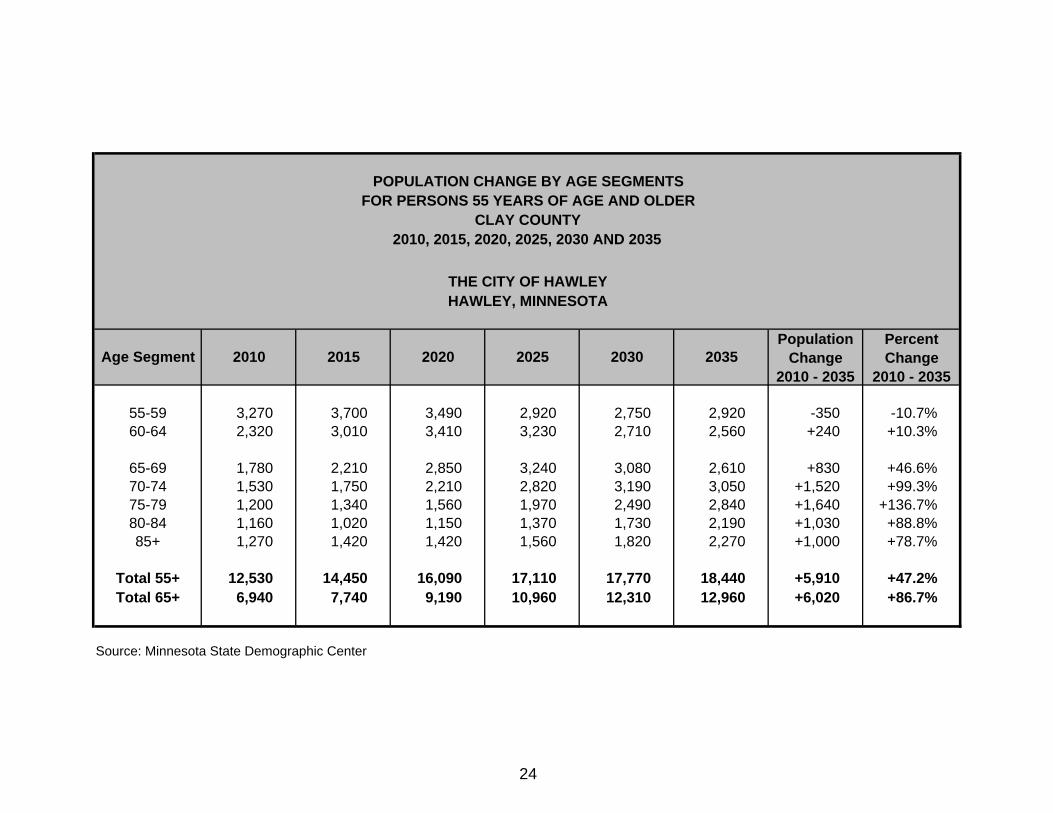
Population change by age segments for the Hawley Market Area and Clay County are located on pages 23 and 24. The reader should note the following information:
• In the Hawley Market Area, the population for persons in the age groups of 55 years of age and older are projected to increase between the years 2013 and 2018. The largest increase in population is in the 65 to 74 years of age group, which increases by 20.7 percent. The smallest increase in population is in the 75 to 84 age group, which increases by 3.8 percent.
• In Clay County, the population for persons in all the age groups 55 years of age and older is projected to increase between the years 2013 and 2018. The largest increase in population is in the 65 to 74 age group, which increases by 24.8 percent. The smallest increase in population is in the 75 to 84 age group, which increases by 0.3 percent.
• Long-term population projections in Clay County project the population for
persons in all age groups 60 years of age and older to increase between the years 2010 and 2035. The largest projected increase in population is
7
in the 75 to 79 age group, which increases by 136.7 percent. The smallest projected increase in population is in the 60 to 64 age group, which increases by 10.3 percent. The population is projected to decrease in the age group of 55 to 59 years of age.
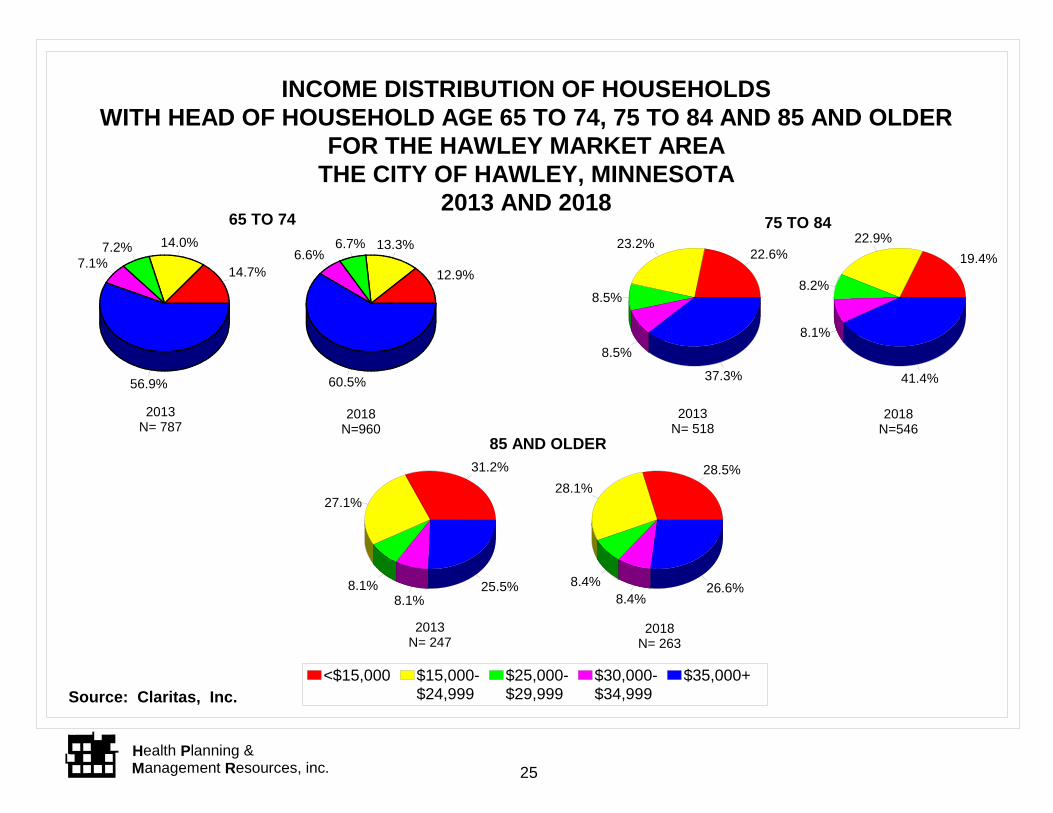
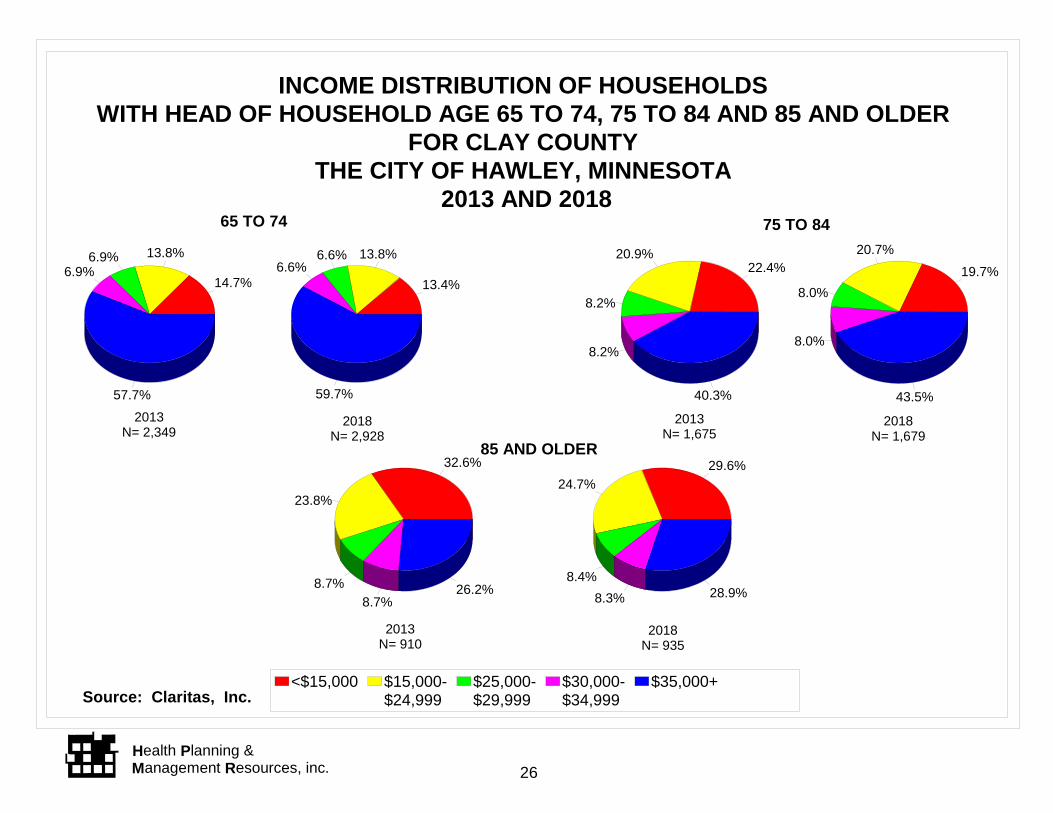
Income of Senior Households
The income of the senior households in the Hawley Market Area was used to segment the demand, presented later in this report, into those who are able to pay privately and those that will need assistance to live in senior housing alternatives. The charts on pages 25 and 26, show the estimated income distribution of senior households in the Hawley Market Area and Clay County by head of household ages 65 to 74, 75 to 84 and 85 years of age and older for both 2013 and 2018.
Senior households with incomes of less than $30,000 (2013) and $35,000 (2018) generally need some type of assistance in order to access senior housing alternatives. Thus, the demand projections, for independent and congregate housing and assisted living, take into account the number of households who can pay privately, e.g., incomes of $30,000 or greater, and those persons that will need help, e.g., incomes of less than $30,000.
The reader should note the following:
• Households with incomes of less than $30,000 are most often widowed females, who rely on a low social security payment and have few assets.
• Senior income data does not reflect assets seniors may have that they
can use for health care and related services. The single largest asset most seniors have is the single-family home, which is typically paid for.
• In 2013, the percentage of households living in the Hawley Market Area
with head of household 65 to 74 years of age and having incomes of $30,000 or greater, e.g. able to pay privately, is 64.0 percent. The percentage of households with head of household 75 to 84 years of age is 45.8 percent and for 85 years of age and older is 33.6 percent. For Clay County, the percentages are 64.6, 48.5 and 34.9, respectively.
8
• In 2018, the percentage of households living in the Hawley Market Area with head of household 65 to 74 years of age and having incomes of $35,000 or greater, e.g. able to pay privately, is 60.5 percent. The percentage of households with head of household 75 to 84 years of age is 41.4 percent and for 85 years of age and older is 26.6 percent. For Clay County, the percentages are 59.7, 43.5 and 28.9, respectively.
Profiles of General and Memory Loss Assisted Living and Independent Congregate Housing in and near the Hawley Market Area
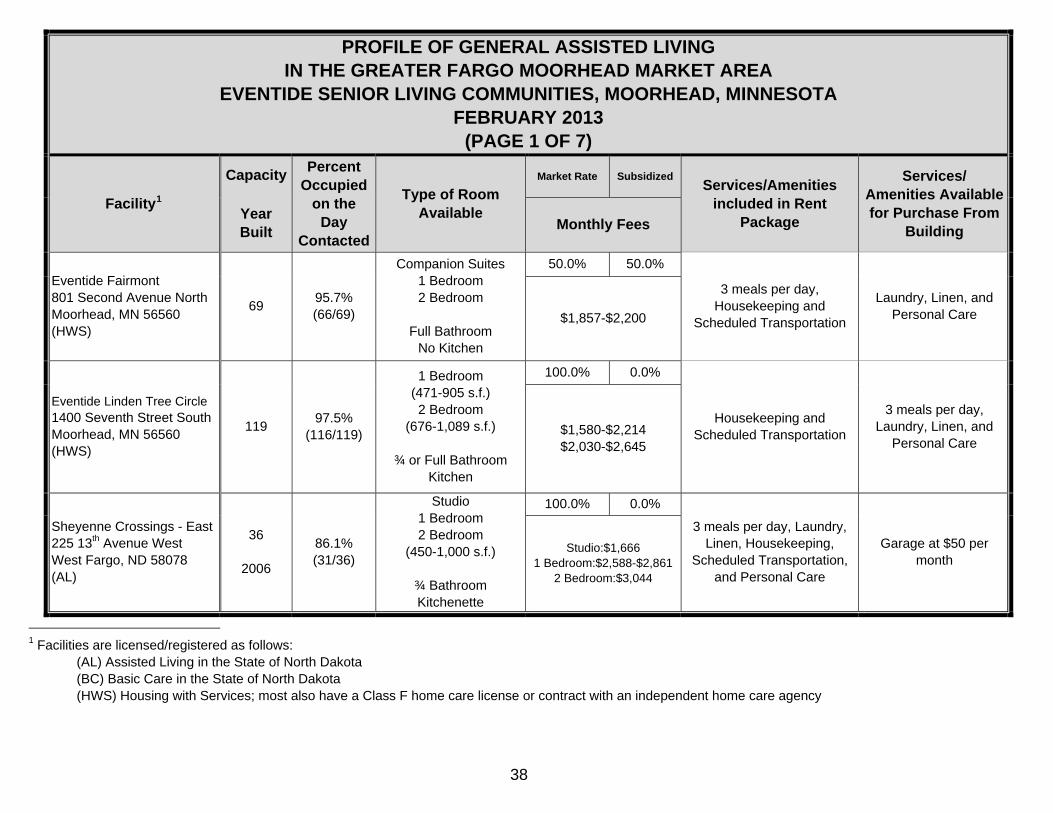
This analysis presents profiles of general and memory loss assisted living and independent and congregate housing facilities in and near the Hawley Market Area.
The inventories for the Fargo Moorhead market are included in a separate
Appendix for reference per Eventide Senior Living Communities. In the planning process, Hawley will need to develop a senior development that more closely reflects the quality of facilities in the Fargo Moorhead area.
There is a brief description of the facilities, the total number of units and the average occupancy of the facilities in and near the Hawley Market Area. The detailed data relies on information received in telephone calls to the facilities; thus, the researcher is conveying this information with the expectation that it is accurate.
The reader should note that in assisted living, 24 hour staffing, emergency
response system, utilities and activities are assumed and are available in all of the assisted living facilities. Only those items that were variable were identified as included in the rent.
Assisted Living Facilities
Detailed profiles of the general and memory loss assisted living facilities in and near the Hawley Market Area are available on pages 27 through 29.
9
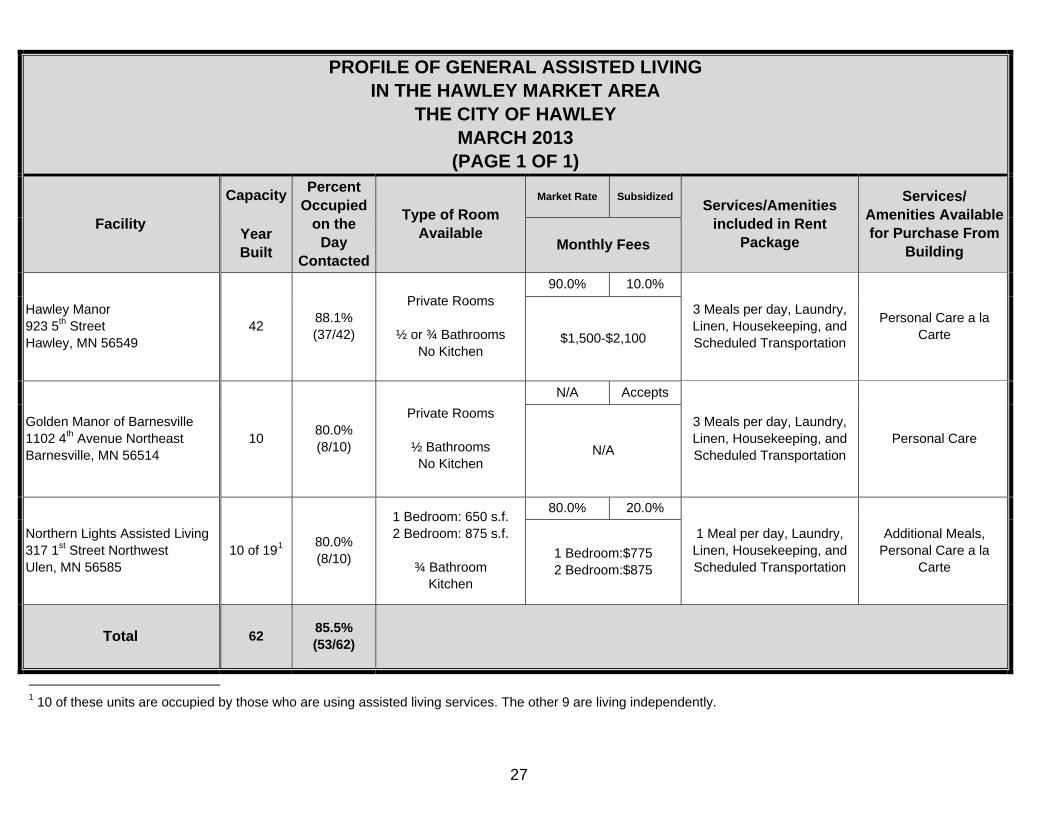
General Assisted Living
There are three general assisted living facilities located in the Hawley Market Area. These three facilities have a total of 62 beds and were 85.5 percent occupied at the time of contact.
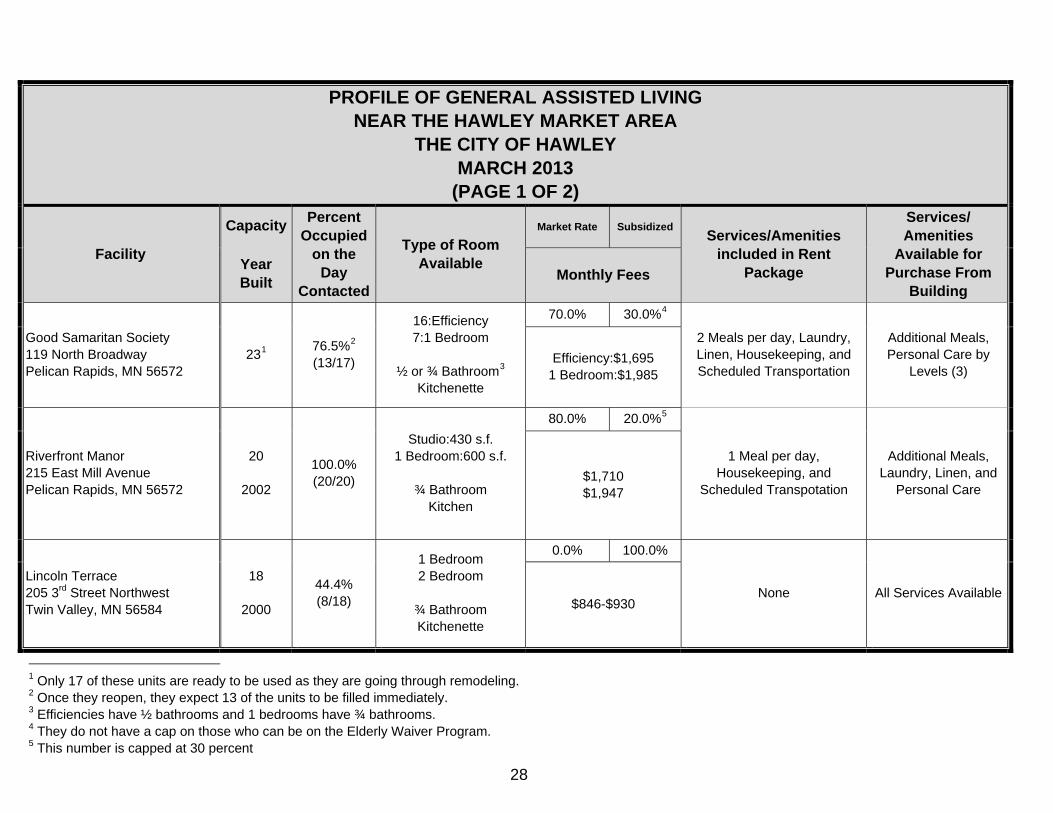
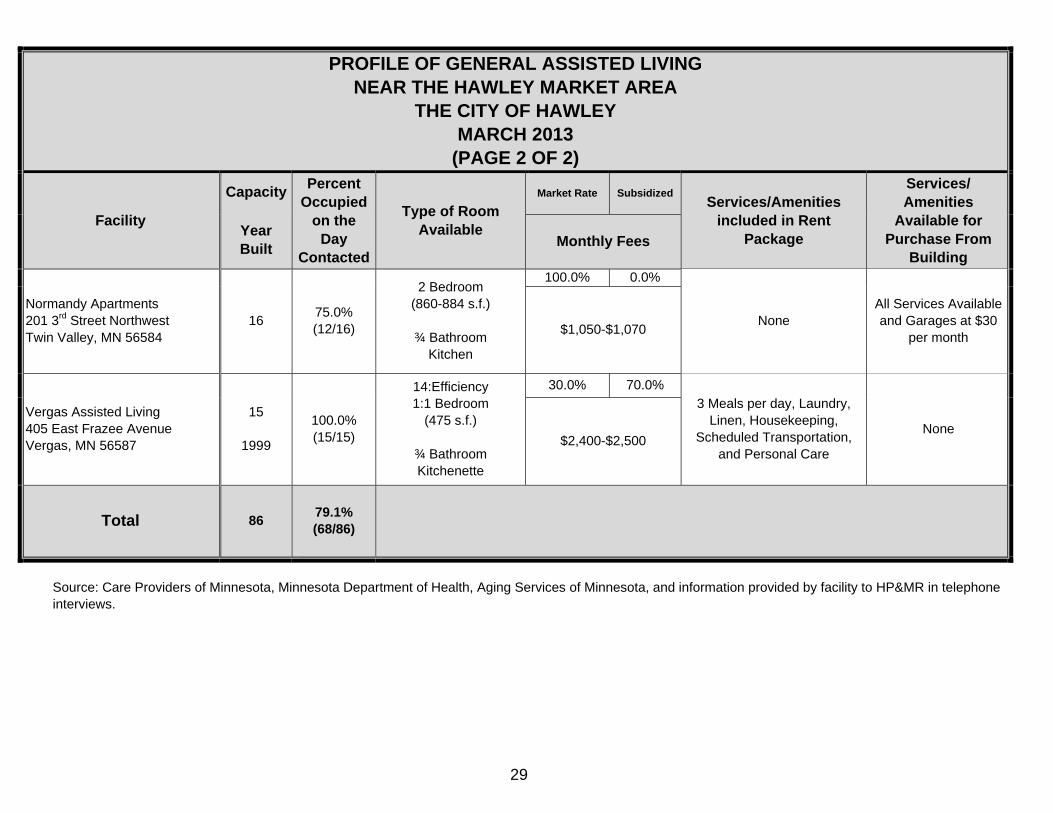
There are five general assisted living facilities located near the Hawley Market Area. These five facilities have a total of 86 units and 79.1 percent were occupied at the time of contact.
Memory Loss Assisted Living
There are no facilities that have special units for persons with memory loss needs located in the Hawley Market Area.
There are no facilities that have special units for persons with memory loss
needs located near the Hawley Market Area. Independent Congregate Housing
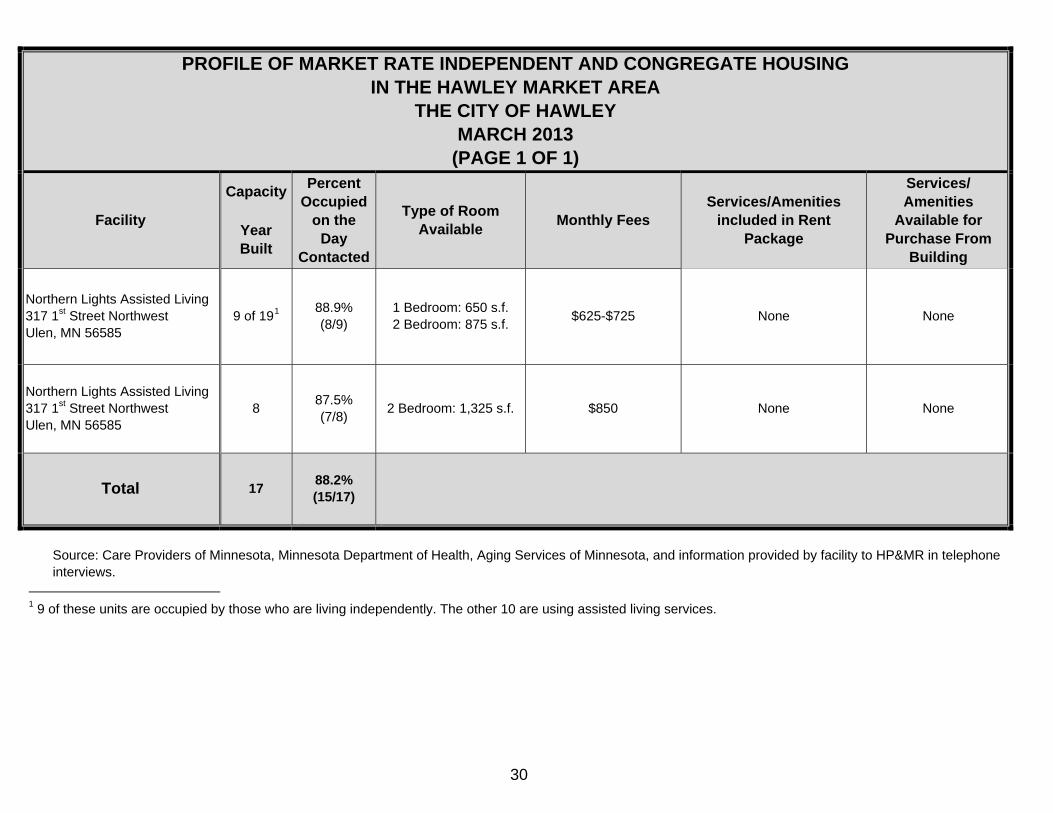
Detailed profiles of the market rate independent congregate housing near the Hawley Market Area are available on page 30.
There are two market rate independent congregate housing facilities located
in the Hawley Market Area. These two facilities have a total of 17 units and were 88.2 percent occupied at the time of contact. One facility has services available at the site and the other has no services available.
10
Demand Analysis for General and Memory Loss Assisted Living and Independent Congregate Housing in and near the Hawley Market Area
This section of the analysis presents the demand for general and memory
loss assisted living and independent congregate housing in the Hawley Market Area.
Using the defined Hawley Market Area based on discussions with The City of Hawley and analysis of the Hawley Market Area and the proximity of other communities with senior housing available, it has been determined that persons from the Hawley Market Area would fill approximately 70 percent of beds available in the Hawley Market Area. The balance is likely to be persons who move to be near adult children, return to the area from another location, or live near, but not in, the Hawley Market Area.
General Assisted Living Demand
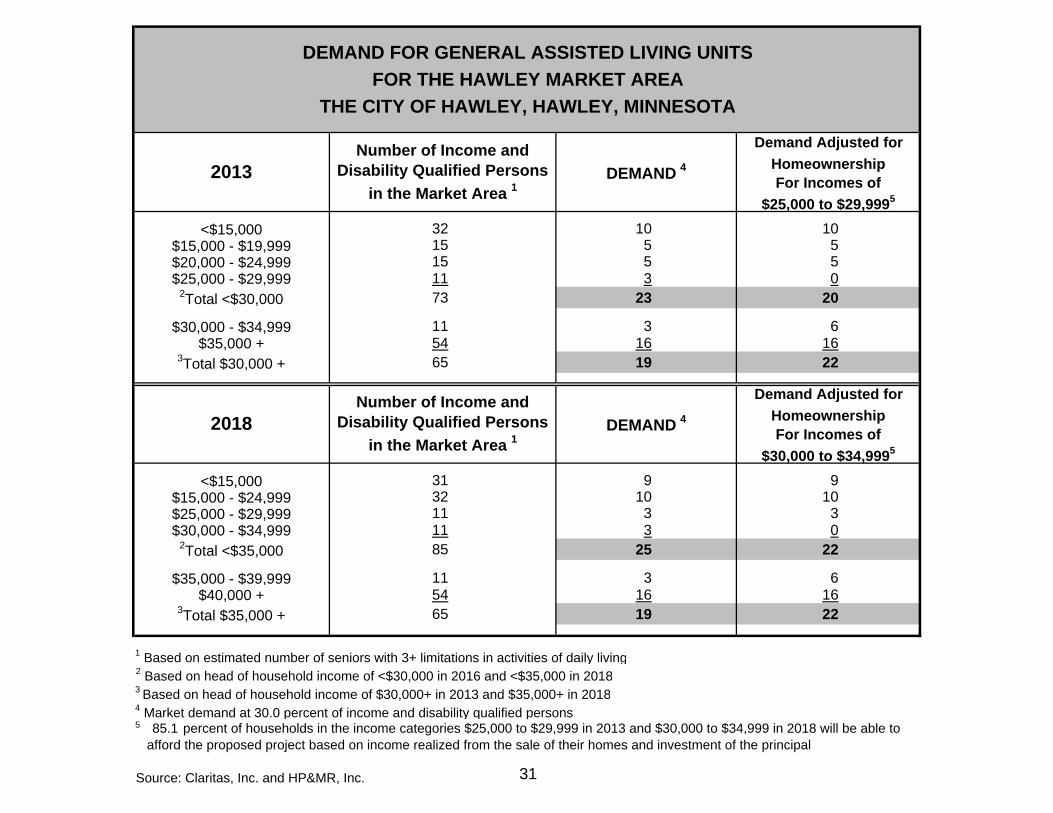
The table on page 31 presents the general assisted living demand projections for the Hawley Market Area, which is segmented by income.
• In 2013, using the analysis that adjusts for homeownership, the estimated demand for market rate general assisted living units is 22 units and the demand for subsidized general assisted living units is 20 units.
• In 2018, using the analysis that adjusts for homeownership, the estimated
demand for market rate general assisted living units is 22 units and the demand for subsidized general assisted living units is 22 units.
Demand for Alzheimer’s and Other Forms of Dementia
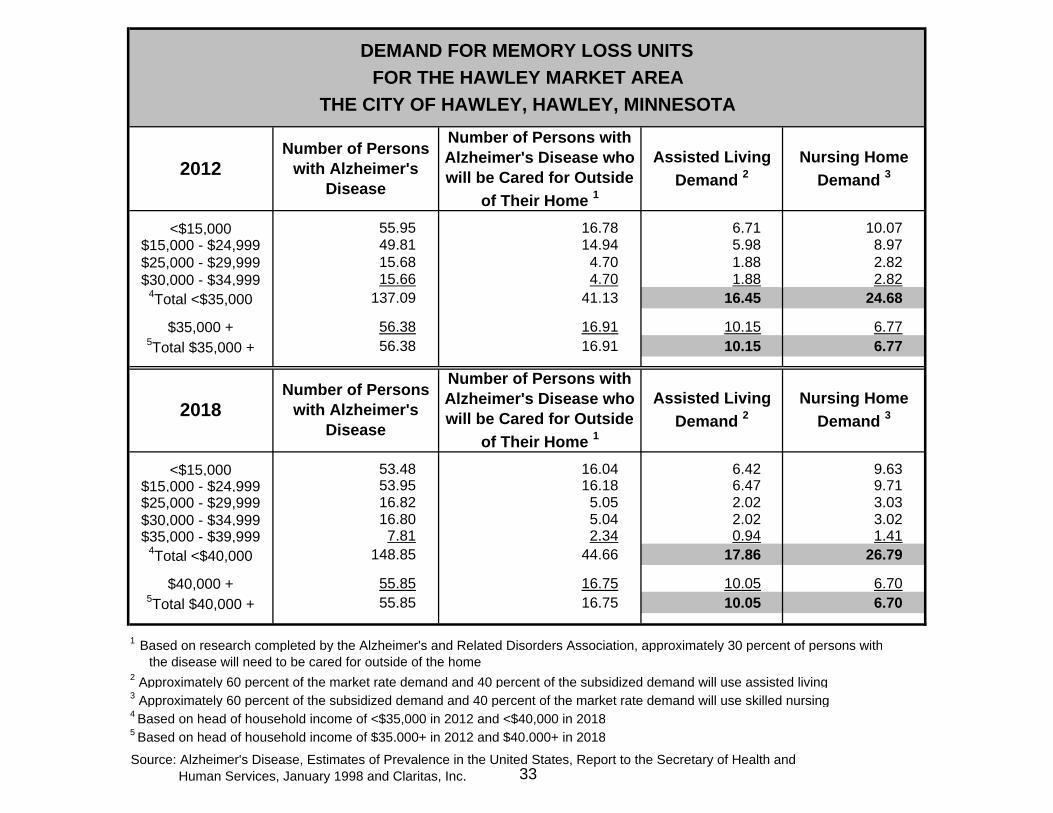
The table on page 32 presents the anticipated number of persons with moderate to severe Alzheimer’s disease in the Hawley Market Area in 2013 and 2018. The reader should note the following:
11
• The chart on page 33, assumes that assisted living will fill 60.0 percent of the market rate demand and 40.0 percent of the subsidized demand.
• In 2013, the demand for market rate memory loss assisted living is 10 and
the demand for subsidized memory loss assisted living is 16.
• In 2018, the demand for market rate memory loss assisted living is 10 and the demand for subsidized memory loss assisted living is 18.
The reader should note the demand for Alzheimer’s and related dementia is a partial, but not total, overlap with general assisted living. Many persons in general assisted living are at earlier stages of Alzheimer’s disease but are not yet a problem for managing or do not cause problems for other residents. In addition, the demand for assisted living assumed persons will have three or more limitations in activities of daily living, and some persons with Alzheimer’s disease who need to be taken care of outside of their homes do not have the defined limitations but need to be in a 24-hour supervised living environment.
Independent Congregate Housing Demand
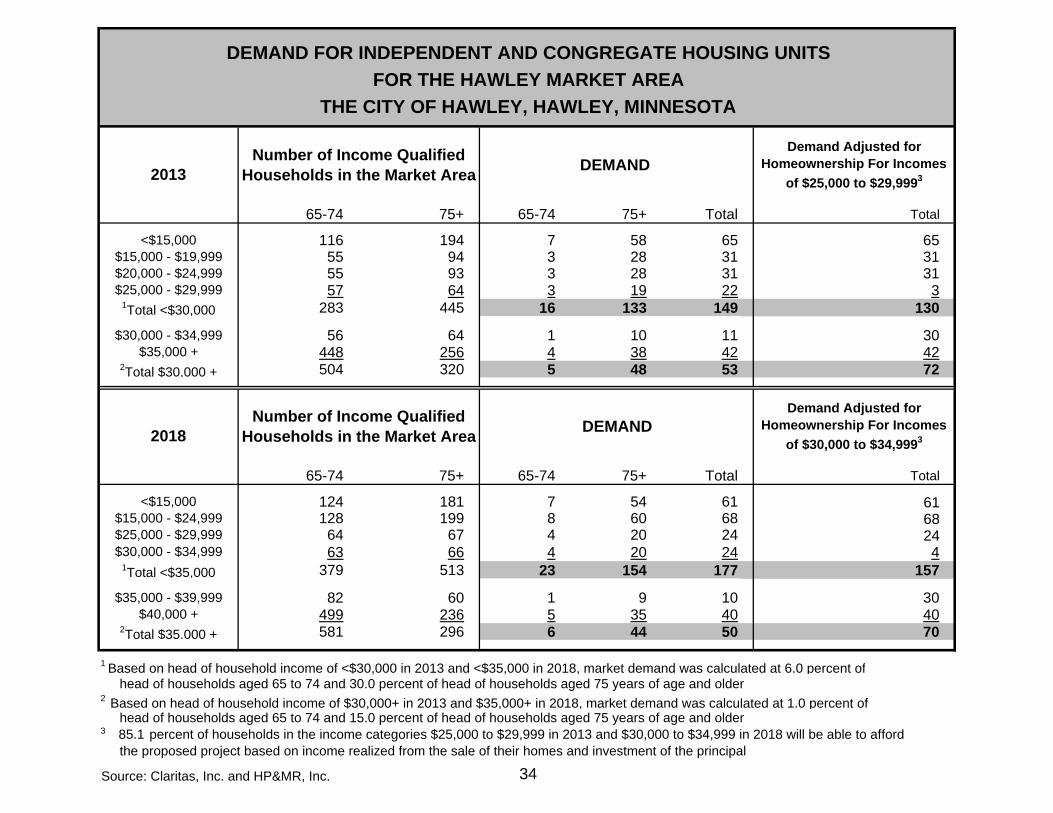
The table on page 34 presents the market rate independent congregate housing demand projections for the Hawley Market Area, which is segmented by income.
• In 2013, using the analysis that adjusts for homeownership, the estimated demand for market rate independent congregate housing units is 72 units.
• In 2018, using the analysis that adjusts for homeownership, the estimated
demand for market rate independent and congregate housing units is 70 units.
12
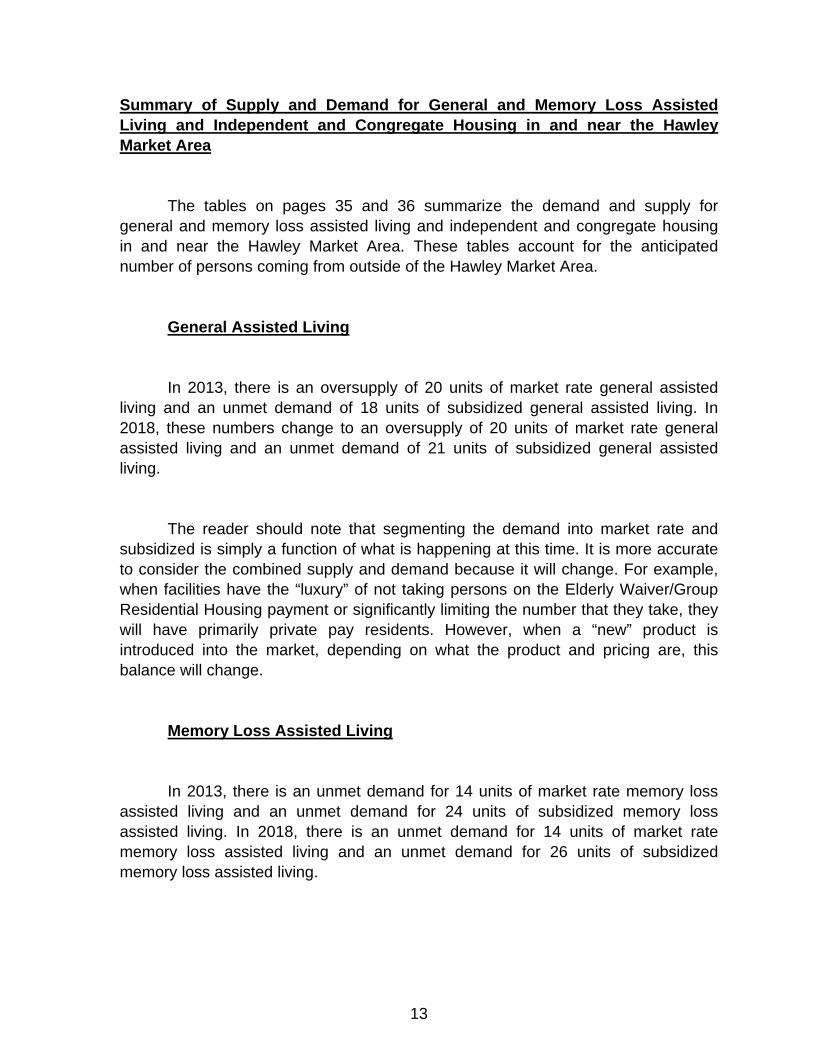
Summary of Supply and Demand for General and Memory Loss Assisted Living and Independent and Congregate Housing in and near the Hawley Market Area
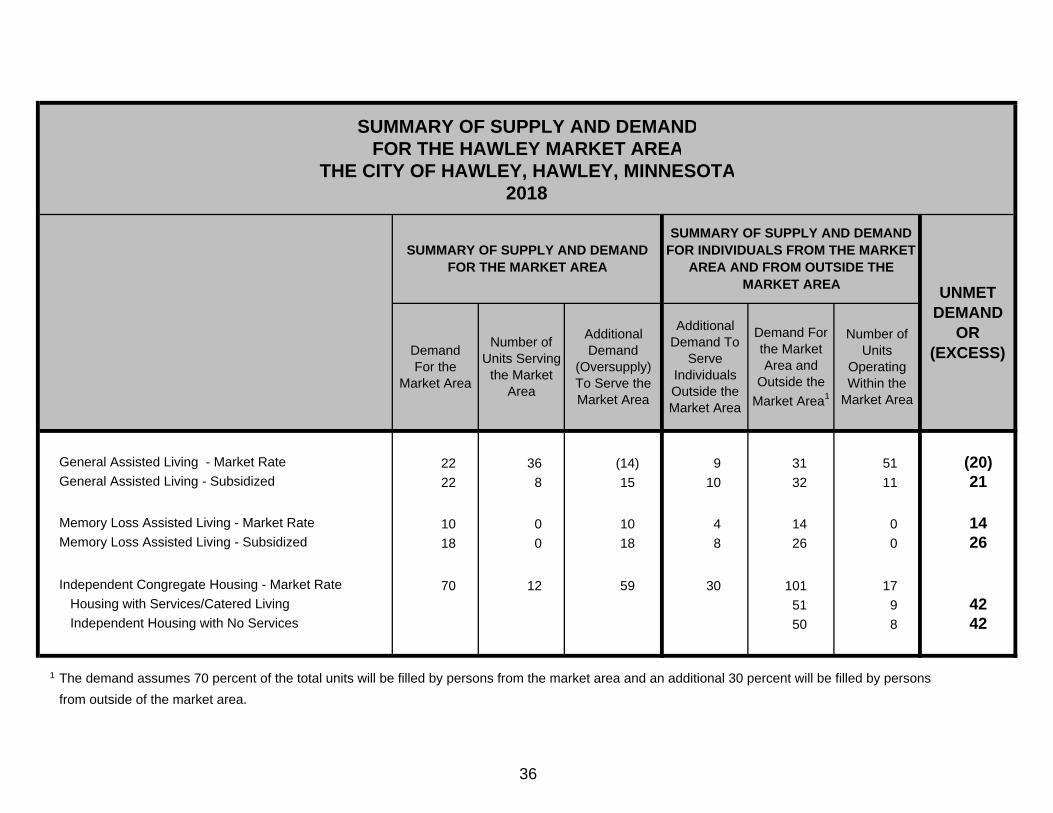
The tables on pages 35 and 36 summarize the demand and supply for general and memory loss assisted living and independent and congregate housing in and near the Hawley Market Area. These tables account for the anticipated number of persons coming from outside of the Hawley Market Area.
General Assisted Living In 2013, there is an oversupply of 20 units of market rate general assisted
living and an unmet demand of 18 units of subsidized general assisted living. In 2018, these numbers change to an oversupply of 20 units of market rate general assisted living and an unmet demand of 21 units of subsidized general assisted living.
The reader should note that segmenting the demand into market rate and
subsidized is simply a function of what is happening at this time. It is more accurate to consider the combined supply and demand because it will change. For example, when facilities have the “luxury” of not taking persons on the Elderly Waiver/Group Residential Housing payment or significantly limiting the number that they take, they will have primarily private pay residents. However, when a “new” product is introduced into the market, depending on what the product and pricing are, this balance will change.
Memory Loss Assisted Living In 2013, there is an unmet demand for 14 units of market rate memory loss
assisted living and an unmet demand for 24 units of subsidized memory loss assisted living. In 2018, there is an unmet demand for 14 units of market rate memory loss assisted living and an unmet demand for 26 units of subsidized memory loss assisted living.
13
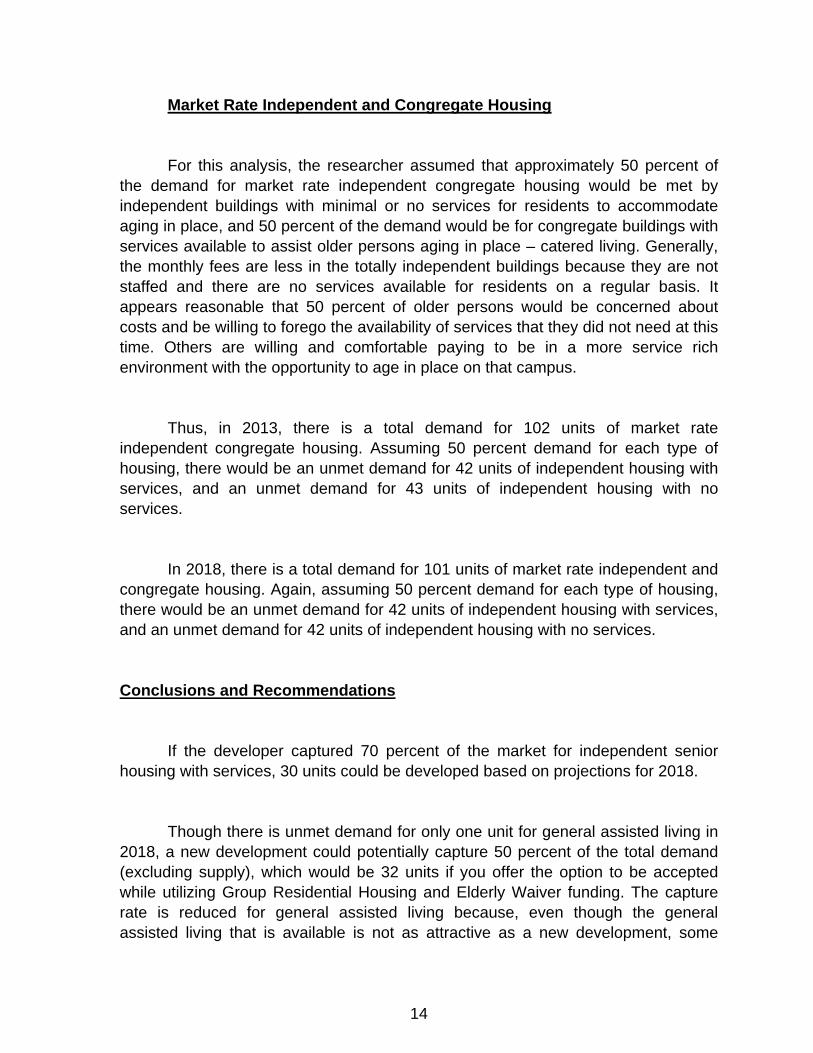
Market Rate Independent and Congregate Housing
For this analysis, the researcher assumed that approximately 50 percent of the demand for market rate independent congregate housing would be met by independent buildings with minimal or no services for residents to accommodate aging in place, and 50 percent of the demand would be for congregate buildings with services available to assist older persons aging in place – catered living. Generally, the monthly fees are less in the totally independent buildings because they are not staffed and there are no services available for residents on a regular basis. It appears reasonable that 50 percent of older persons would be concerned about costs and be willing to forego the availability of services that they did not need at this time. Others are willing and comfortable paying to be in a more service rich environment with the opportunity to age in place on that campus.
Thus, in 2013, there is a total demand for 102 units of market rate
independent congregate housing. Assuming 50 percent demand for each type of housing, there would be an unmet demand for 42 units of independent housing with services, and an unmet demand for 43 units of independent housing with no services.
In 2018, there is a total demand for 101 units of market rate independent and congregate housing. Again, assuming 50 percent demand for each type of housing, there would be an unmet demand for 42 units of independent housing with services, and an unmet demand for 42 units of independent housing with no services. Conclusions and Recommendations If the developer captured 70 percent of the market for independent senior housing with services, 30 units could be developed based on projections for 2018. Though there is unmet demand for only one unit for general assisted living in 2018, a new development could potentially capture 50 percent of the total demand (excluding supply), which would be 32 units if you offer the option to be accepted while utilizing Group Residential Housing and Elderly Waiver funding. The capture rate is reduced for general assisted living because, even though the general assisted living that is available is not as attractive as a new development, some
14
15
private pay persons will continue to choose Hawley Manor since it is likely to be priced lower than a new development. If the desire is to pursue only the private pay market, the demand would be approximately 15 units. An option to consider is developing an apartment style building, featuring catered living, with the capability of providing various levels of service the person needs. In addition, build cottage style independent living units. There is also demand for memory loss assisted living. Size depends on the number of persons who are accepted on the Elderly Waiver program and Group Residential Housing. Limitations of a Market Study
This market study presents an analysis of a given market based on experience in other markets and reasonable industry assumptions about demand. A market study cannot predict what the actual experience in the market will be. Market conditions at the time of the facility’s opening, unforeseen and/or unpredictable events occurring in the market, the quality of the product offered, the marketing and management staff and many other events influence the success of a project and are beyond the scope of a market study. The researcher also relies on other sources of data, i.e., Claritas, Inc., Minnesota State Demographic Center, the U.S. Census, and these resources are presumed to be reliable. HP&MR is not responsible for errors in these data sources.
Copyright © and (P) 1988–2009 Microsoft Corporation and/or its suppliers. All rights reserved. http://www.microsoft.com/mappoint/Certain mapping and direction data © 2009 NAVTEQ. All rights reserved. The Data for areas of Canada includes information taken with permission from Canadian authorities, including: ©Her Majesty the Queen in Right of Canada, © Queen's Printer for Ontario. NAVTEQ and NAVTEQ ON BOARD are trademarks of NAVTEQ. © 2009 Tele Atlas North America, Inc. All rights reserved. Tele Atlas and Tele Atlas North America are trademarks of Tele Atlas, Inc. © 2009 by Applied Geographic Systems. All rights reserved.
Hawley Market Area
0 mi 10 20 30
Health Planning &Management Resources, inc.
TOTAL POPULATIONFOR THE HAWLEY MARKET AREA AND CLAY COUNTY
THE CITY OF HAWLEY, MINNESOTA2000, 2013 AND 2018
13,423 15,022 15,524
2000 2013 20180
20,000
40,000
60,000
80,000
100,000
HAWLEY MARKET AREA
Source: Claritas, Inc.
51,229
60,736 63,408
2000 2013 20180
20,000
40,000
60,000
80,000
100,000
CLAY COUNTY
17
Health Planning &Management Resources, inc.
57,07060,240 63,050 65,600 66,910 68,130
2010 2015 2020 2025 2030 20350
20,000
40,000
60,000
80,000
100,000
TOTAL POPULATIONCLAY COUNTY
THE CITY OF HAWLEY, MINNESOTA2010 THROUGH 2035
Source: Minnesota State Demographic Center
18
Health Planning &Management Resources, inc.
TOTAL SENIOR POPULATION 65+FOR THE HAWLEY MARKET AREA AND CLAY COUNTY
THE CITY OF HAWLEY, MINNESOTA2000, 2013 AND 2018
2,092 2,306 2,608
2000 2013 20180
4,000
8,000
12,000
16,000
20,000
6,5967,484
8,467
2000 2013 20180
4,000
8,000
12,000
16,000
20,000
HAWLEY MARKET AREA
Source: Claritas, Inc.
CLAY COUNTY
19
Health Planning &Management Resources, inc.
6,9407,740
9,190
10,96012,310
12,960
2010 2015 2020 2025 2030 20350
4,000
8,000
12,000
16,000
20,000
TOTAL SENIOR POPULATION 65+CLAY COUNTY
THE CITY OF HAWLEY, MINNESOTA2010 THROUGH 2035
Source: Minnesota State Demographic Center
20
Health Planning &Management Resources, inc.
SENIOR POPULATION 65+ AS A PERCENT OF THE TOTAL POPULATIONFOR THE HAWLEY MARKET AREA AND CLAY COUNTY
THE CITY OF HAWLEY, MINNESOTA2000, 2013 AND 2018
15.6% 15.4%16.8%
2000 2013 20180.0%
5.0%
10.0%
15.0%
20.0%
25.0%
30.0%
12.9% 12.3%13.4%
2000 2013 20180.0%
5.0%
10.0%
15.0%
20.0%
25.0%
30.0%
HAWLEY MARKET AREA
Source: Claritas, Inc.
CLAY COUNTY
21
Health Planning &Management Resources, inc.
12.2% 12.8%14.6%
16.7%18.4% 19.0%
2010 2015 2020 2025 2030 20350.0%
5.0%
10.0%
15.0%
20.0%
25.0%
30.0%
SENIORS (65+) AS A PERCENT OF THE TOTAL POPULATIONCLAY COUNTY
THE CITY OF HAWLEY, MINNESOTA2010 THROUGH 2035
Source: Minnesota State Demographic Center
22
55-64 1,269 2,018 2,187 +169 +8.4%
65-74 1,071 1,244 1,502 +258 +20.7%75-84 706 743 771 +28 +3.8%85+ 315 319 335 +16 +5.0%
Total 55+ 3,361 4,324 4,795 +471 +10.9%Total 65+ 2,092 2,306 2,608 +302 +13.1%
55-64 3,747 6,619 7,263 +644 +9.7%
65-74 3,183 3,794 4,736 +942 +24.8%75-84 2,381 2,419 2,426 +7 +0.3%85+ 1,032 1,271 1,305 +34 +2.7%
Total 55+ 10,343 14,103 15,730 +1,627 +11.5%Total 65+ 6,596 7,484 8,467 +983 +13.1%
Source: Claritas, Inc.
POPULATION CHANGE BY AGE SEGMENTSFOR PERSONS 55 YEARS OF AGE AND OLDER
FOR THE HAWLEY MARKET AREA2000, 2013 AND 2018
THE CITY OF HAWLEYHAWLEY, MINNESOTA
Age Segment 2000 2013 2018Population
Change 2013 - 2018
Percent Change
2013 - 2018
POPULATION CHANGE BY AGE SEGMENTSFOR PERSONS 55 YEARS OF AGE AND OLDER
CLAY COUNTY2000, 2013 AND 2018
THE CITY OF HAWLEYHAWLEY, MINNESOTA
Age Segment 2000 2013 2018Population
Change 2013 - 2018
Percent Change
2013 - 2018
23
55-59 3,270 3,700 3,490 2,920 2,750 2,920 -350 -10.7%60-64 2,320 3,010 3,410 3,230 2,710 2,560 +240 +10.3%
65-69 1,780 2,210 2,850 3,240 3,080 2,610 +830 +46.6%70-74 1,530 1,750 2,210 2,820 3,190 3,050 +1,520 +99.3%75-79 1,200 1,340 1,560 1,970 2,490 2,840 +1,640 +136.7%80-84 1,160 1,020 1,150 1,370 1,730 2,190 +1,030 +88.8%85+ 1,270 1,420 1,420 1,560 1,820 2,270 +1,000 +78.7%
Total 55+ 12,530 14,450 16,090 17,110 17,770 18,440 +5,910 +47.2%Total 65+ 6,940 7,740 9,190 10,960 12,310 12,960 +6,020 +86.7%
Source: Minnesota State Demographic Center
2010, 2015, 2020, 2025, 2030 AND 2035
FOR PERSONS 55 YEARS OF AGE AND OLDERCLAY COUNTY
POPULATION CHANGE BY AGE SEGMENTS
THE CITY OF HAWLEYHAWLEY, MINNESOTA
2035Percent Change
2010 - 2035
Population Change
2010 - 2035Age Segment 2010 20252015 2020 2030
24
Health Planning &Management Resources, inc.
INCOME DISTRIBUTION OF HOUSEHOLDSWITH HEAD OF HOUSEHOLD AGE 65 TO 74, 75 TO 84 AND 85 AND OLDER
FOR THE HAWLEY MARKET AREATHE CITY OF HAWLEY, MINNESOTA
2013 AND 2018
14.7%
14.0%7.2%7.1%
56.9%
12.9%
13.3%6.7%6.6%
60.5%
65 TO 74
2018N=960
2013N= 787
Source: Claritas, Inc.
31.2%
27.1%
8.1%8.1%
25.5%
28.5%28.1%
8.4%8.4%
26.6%
<$15,000 $15,000-$24,999
$25,000-$29,999
$30,000-$34,999
$35,000+
85 AND OLDER
2018N= 263
2013N= 247
25
22.6%23.2%
8.5%
8.5%
37.3%
19.4%22.9%
8.2%
8.1%
41.4%
75 TO 84
2013N= 518
2018N=546
Health Planning &Management Resources, inc.
INCOME DISTRIBUTION OF HOUSEHOLDSWITH HEAD OF HOUSEHOLD AGE 65 TO 74, 75 TO 84 AND 85 AND OLDER
FOR CLAY COUNTYTHE CITY OF HAWLEY, MINNESOTA
2013 AND 2018
Source: Claritas, Inc.
14.7%
13.8%6.9%6.9%
57.7%
13.4%
13.8%6.6%6.6%
59.7%
32.6%
23.8%
8.7%8.7%
26.2%
29.6%24.7%
8.4%8.3% 28.9%
<$15,000 $15,000-$24,999
$25,000-$29,999
$30,000-$34,999
$35,000+
2018N= 935
2013N= 910
85 AND OLDER
2018N= 2,928
2013N= 2,349
65 TO 74
26
22.4%20.9%
8.2%
8.2%
40.3%
19.7%
20.7%
8.0%
8.0%
43.5%
75 TO 84
2013N= 1,675
2018N= 1,679
27
PROFILE OF GENERAL ASSISTED LIVING IN THE HAWLEY MARKET AREA
THE CITY OF HAWLEY MARCH 2013
(PAGE 1 OF 1)
Facility
Capacity
Year Built
Percent Occupied
on the Day
Contacted
Type of Room Available
Market Rate Subsidized Services/Amenities included in Rent
Package
Services/ Amenities Available for Purchase From
Building Monthly Fees
Hawley Manor 923 5th Street Hawley, MN 56549
42 88.1% (37/42)
Private Rooms
½ or ¾ Bathrooms No Kitchen
90.0% 10.0%
3 Meals per day, Laundry, Linen, Housekeeping, and Scheduled Transportation
Personal Care a la Carte $1,500-$2,100
Golden Manor of Barnesville 1102 4th Avenue Northeast Barnesville, MN 56514
10 80.0% (8/10)
Private Rooms
½ Bathrooms No Kitchen
N/A Accepts
3 Meals per day, Laundry, Linen, Housekeeping, and Scheduled Transportation
Personal Care N/A
Northern Lights Assisted Living 317 1st Street Northwest Ulen, MN 56585
10 of 191 80.0% (8/10)
1 Bedroom: 650 s.f. 2 Bedroom: 875 s.f.
¾ Bathroom
Kitchen
80.0% 20.0%
1 Meal per day, Laundry, Linen, Housekeeping, and Scheduled Transportation
Additional Meals, Personal Care a la
Carte 1 Bedroom:$775 2 Bedroom:$875
Total 62 85.5% (53/62)
1 10 of these units are occupied by those who are using assisted living services. The other 9 are living independently.
28
PROFILE OF GENERAL ASSISTED LIVING NEAR THE HAWLEY MARKET AREA
THE CITY OF HAWLEY MARCH 2013
(PAGE 1 OF 2)
Facility
Capacity
Year Built
Percent Occupied
on the Day
Contacted
Type of Room Available
Market Rate Subsidized Services/Amenities included in Rent
Package
Services/ Amenities
Available for Purchase From
Building Monthly Fees
Good Samaritan Society 119 North Broadway Pelican Rapids, MN 56572
231 76.5%2 (13/17)
16:Efficiency 7:1 Bedroom
½ or ¾ Bathroom3
Kitchenette
70.0% 30.0%4
2 Meals per day, Laundry, Linen, Housekeeping, and Scheduled Transportation
Additional Meals, Personal Care by
Levels (3) Efficiency:$1,695
1 Bedroom:$1,985
Riverfront Manor 215 East Mill Avenue Pelican Rapids, MN 56572
20
2002
100.0% (20/20)
Studio:430 s.f. 1 Bedroom:600 s.f.
¾ Bathroom
Kitchen
80.0% 20.0%5
1 Meal per day, Housekeeping, and
Scheduled Transpotation
Additional Meals, Laundry, Linen, and
Personal Care $1,710 $1,947
Lincoln Terrace 205 3rd Street Northwest Twin Valley, MN 56584
18
2000
44.4% (8/18)
1 Bedroom 2 Bedroom
¾ Bathroom Kitchenette
0.0% 100.0%
None All Services Available $846-$930
1 Only 17 of these units are ready to be used as they are going through remodeling. 2 Once they reopen, they expect 13 of the units to be filled immediately. 3 Efficiencies have ½ bathrooms and 1 bedrooms have ¾ bathrooms. 4 They do not have a cap on those who can be on the Elderly Waiver Program. 5 This number is capped at 30 percent
29
PROFILE OF GENERAL ASSISTED LIVING NEAR THE HAWLEY MARKET AREA
THE CITY OF HAWLEY MARCH 2013
(PAGE 2 OF 2)
Facility
Capacity
Year Built
Percent Occupied
on the Day
Contacted
Type of Room Available
Market Rate Subsidized Services/Amenities
included in Rent Package
Services/ Amenities
Available for Purchase From
Building Monthly Fees
Normandy Apartments 201 3rd Street Northwest Twin Valley, MN 56584
16 75.0% (12/16)
2 Bedroom (860-884 s.f.)
¾ Bathroom
Kitchen
100.0% 0.0%
None All Services Available and Garages at $30
per month $1,050-$1,070
Vergas Assisted Living 405 East Frazee Avenue Vergas, MN 56587
15
1999
100.0% (15/15)
14:Efficiency 1:1 Bedroom
(475 s.f.)
¾ Bathroom Kitchenette
30.0% 70.0% 3 Meals per day, Laundry,
Linen, Housekeeping, Scheduled Transportation,
and Personal Care
None $2,400-$2,500
Total 86 79.1% (68/86)
Source: Care Providers of Minnesota, Minnesota Department of Health, Aging Services of Minnesota, and information provided by facility to HP&MR in telephone interviews.
30
PROFILE OF MARKET RATE INDEPENDENT AND CONGREGATE HOUSING IN THE HAWLEY MARKET AREA
THE CITY OF HAWLEY MARCH 2013
(PAGE 1 OF 1)
Facility
Capacity
Year Built
Percent Occupied
on the Day
Contacted
Type of Room Available Monthly Fees
Services/Amenities included in Rent
Package
Services/ Amenities
Available for Purchase From
Building
Northern Lights Assisted Living 317 1st Street Northwest Ulen, MN 56585
9 of 191 88.9% (8/9)
1 Bedroom: 650 s.f. 2 Bedroom: 875 s.f. $625-$725 None None
Northern Lights Assisted Living 317 1st Street Northwest Ulen, MN 56585
8 87.5% (7/8) 2 Bedroom: 1,325 s.f. $850 None None
Total 17 88.2% (15/17)
Source: Care Providers of Minnesota, Minnesota Department of Health, Aging Services of Minnesota, and information provided by facility to HP&MR in telephone interviews.
1 9 of these units are occupied by those who are living independently. The other 10 are using assisted living services.
32 10 1015 5 515 5 511 3 073 23 20
11 3 654 16 1665 19 22
31 9 932 10 1011 3 311 3 085 25 22
11 3 654 16 1665 19 22
1 Based on estimated number of seniors with 3+ limitations in activities of daily living2 Based on head of household income of <$30,000 in 2016 and <$35,000 in 20183 Based on head of household income of $30,000+ in 2013 and $35,000+ in 20184 Market demand at 30.0 percent of income and disability qualified persons5 85.1 percent of households in the income categories $25,000 to $29,999 in 2013 and $30,000 to $34,999 in 2018 will be able to afford the proposed project based on income realized from the sale of their homes and investment of the principal
Source: Claritas, Inc. and HP&MR, Inc.
$30,000 - $34,9992Total <$35,000
Demand Adjusted for Homeownership For Incomes of
$30,000 to $34,9995
$20,000 - $24,999
$35,000 - $39,999$40,000 +
3Total $35,000 +
<$15,000$15,000 - $24,999
$35,000 +3Total $30,000 +
2018Number of Income and
Disability Qualified Persons in the Market Area 1
DEMAND 4
2Total <$30,000
$30,000 - $34,999
<$15,000$15,000 - $19,999
$25,000 - $29,999
$25,000 - $29,999
DEMAND FOR GENERAL ASSISTED LIVING UNITSFOR THE HAWLEY MARKET AREA
THE CITY OF HAWLEY, HAWLEY, MINNESOTA
2013Number of Income and
Disability Qualified Persons in the Market Area 1
DEMAND 4Demand Adjusted for
Homeownership For Incomes of
$25,000 to $29,9995
31
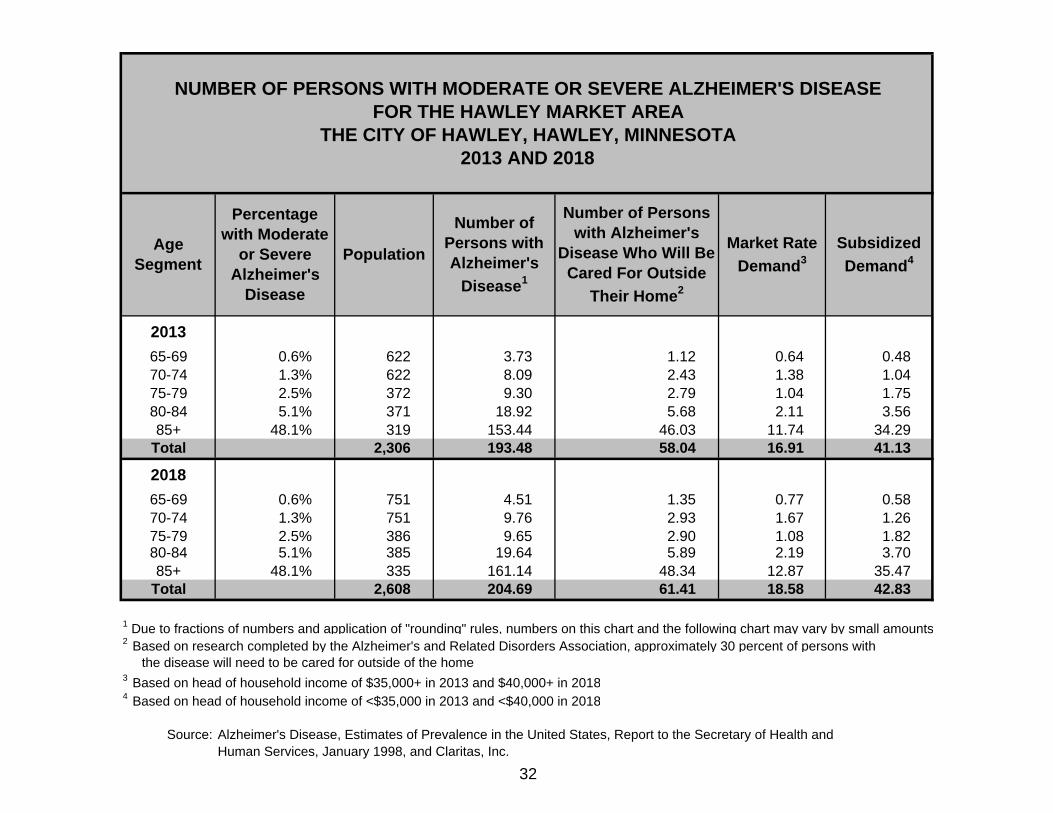
201365-69 0.6% 622 3.73 1.12 0.64 0.4870-74 1.3% 622 8.09 2.43 1.38 1.0475-79 2.5% 372 9.30 2.79 1.04 1.7580-84 5.1% 371 18.92 5.68 2.11 3.5685+ 48.1% 319 153.44 46.03 11.74 34.29
Total 2,306 193.48 58.04 16.91 41.13
201865-69 0.6% 751 4.51 1.35 0.77 0.5870-74 1.3% 751 9.76 2.93 1.67 1.2675-79 2.5% 386 9.65 2.90 1.08 1.8280-84 5.1% 385 19.64 5.89 2.19 3.7085+ 48.1% 335 161.14 48.34 12.87 35.47
Total 2,608 204.69 61.41 18.58 42.83
1 Due to fractions of numbers and application of "rounding" rules, numbers on this chart and the following chart may vary by small amounts2 Based on research completed by the Alzheimer's and Related Disorders Association, approximately 30 percent of persons with the disease will need to be cared for outside of the home3 Based on head of household income of $35,000+ in 2013 and $40,000+ in 20184 Based on head of household income of <$35,000 in 2013 and <$40,000 in 2018
Source: Alzheimer's Disease, Estimates of Prevalence in the United States, Report to the Secretary of Health and Human Services, January 1998, and Claritas, Inc.
Subsidized Demand4
Age Segment
Percentage with Moderate
or Severe Alzheimer's
Disease
Population
Number of Persons with Alzheimer's
Disease1
Number of Persons with Alzheimer's
Disease Who Will Be Cared For Outside
Their Home2
Market Rate Demand3
NUMBER OF PERSONS WITH MODERATE OR SEVERE ALZHEIMER'S DISEASEFOR THE HAWLEY MARKET AREA
THE CITY OF HAWLEY, HAWLEY, MINNESOTA2013 AND 2018
32
<$15,000 55.95 16.78 6.71 10.07$15,000 - $24,999 49.81 14.94 5.98 8.97$25,000 - $29,999 15.68 4.70 1.88 2.82$30,000 - $34,999 15.66 4.70 1.88 2.82
4Total <$35,000 137.09 41.13 16.45 24.68
$35,000 + 56.38 16.91 10.15 6.775Total $35,000 + 56.38 16.91 10.15 6.77
<$15,000 53.48 16.04 6.42 9.63$15,000 - $24,999 53.95 16.18 6.47 9.71$25,000 - $29,999 16.82 5.05 2.02 3.03$30,000 - $34,999 16.80 5.04 2.02 3.02$35,000 - $39,999 7.81 2.34 0.94 1.41
4Total <$40,000 148.85 44.66 17.86 26.79
$40,000 + 55.85 16.75 10.05 6.705Total $40,000 + 55.85 16.75 10.05 6.70
1 Based on research completed by the Alzheimer's and Related Disorders Association, approximately 30 percent of persons with the disease will need to be cared for outside of the home2 Approximately 60 percent of the market rate demand and 40 percent of the subsidized demand will use assisted living3 Approximately 60 percent of the subsidized demand and 40 percent of the market rate demand will use skilled nursing4 Based on head of household income of <$35,000 in 2012 and <$40,000 in 20185 Based on head of household income of $35,000+ in 2012 and $40,000+ in 2018
Source: Alzheimer's Disease, Estimates of Prevalence in the United States, Report to the Secretary of Health and Human Services, January 1998 and Claritas, Inc.
2012 Assisted Living Demand 2
Nursing Home Demand 3
Number of Persons with Alzheimer's
Disease
Number of Persons with Alzheimer's Disease who will be Cared for Outside
of Their Home 1
DEMAND FOR MEMORY LOSS UNITSFOR THE HAWLEY MARKET AREA
THE CITY OF HAWLEY, HAWLEY, MINNESOTA
Nursing Home Demand 3
Number of Persons with Alzheimer's
Disease
Number of Persons with Alzheimer's Disease who will be Cared for Outside
of Their Home 12018 Assisted Living
Demand 2
33
65-74 75+ 65-74 75+ Total Total
116 194 7 58 65 6555 94 3 28 31 3155 93 3 28 31 3157 64 3 19 22 3
283 445 16 133 149 130
56 64 1 10 11 30448 256 4 38 42 42504 320 5 48 53 72
65-74 75+ 65-74 75+ Total Total
124 181 7 54 61 61128 199 8 60 68 6864 67 4 20 24 2463 66 4 20 24 4
379 513 23 154 177 157
82 60 1 9 10 30499 236 5 35 40 40581 296 6 44 50 70
1 Based on head of household income of <$30,000 in 2013 and <$35,000 in 2018, market demand was calculated at 6.0 percent of head of households aged 65 to 74 and 30.0 percent of head of households aged 75 years of age and older
head of households aged 65 to 74 and 15.0 percent of head of households aged 75 years of age and older3 85.1 percent of households in the income categories $25,000 to $29,999 in 2013 and $30,000 to $34,999 in 2018 will be able to afford the proposed project based on income realized from the sale of their homes and investment of the principal
Source: Claritas, Inc. and HP&MR, Inc.
DEMAND FOR INDEPENDENT AND CONGREGATE HOUSING UNITSFOR THE HAWLEY MARKET AREA
THE CITY OF HAWLEY, HAWLEY, MINNESOTA
<$15,000$15,000 - $19,999
$25,000 - $29,999
2013Number of Income Qualified
Households in the Market Area DEMAND Demand Adjusted for
Homeownership For Incomes of $25,000 to $29,9993
$35,000 +2Total $30,000 +
2018
1Total <$30,000
$30,000 - $34,999
$30,000 - $34,9991Total <$35,000
Number of Income Qualified Households in the Market Area DEMAND
Demand Adjusted for Homeownership For Incomes
of $30,000 to $34,9993
2 Based on head of household income of $30,000+ in 2013 and $35,000+ in 2018, market demand was calculated at 1.0 percent of
$20,000 - $24,999
$25,000 - $29,999
$35,000 - $39,999$40,000 +
2Total $35,000 +
<$15,000$15,000 - $24,999
34

General Assisted Living - Market Rate 22 36 (14) 9 31 51 (20)General Assisted Living - Subsidized 20 8 13 9 29 11 18
Memory Loss Assisted Living - Market Rate 10 0 10 4 14 0 14Memory Loss Assisted Living - Subsidized 16 0 16 7 24 0 24
Independent Congregate Housing - Market Rate 72 12 60 31 102 17 Housing with Services/Catered Living 51 9 42 Independent Housing with No Services 51 8 43
1 The demand assumes 70 percent of the total units will be filled by persons from the market area and an additional 30 percent will be filled by personsfrom outside of the market area.
SUMMARY OF SUPPLY AND DEMANDFOR THE HAWLEY MARKET AREA
THE CITY OF HAWLEY, HAWLEY, MINNESOTA2013
Additional Demand
(Oversupply) To Serve the Market Area
Additional Demand To
Serve Individuals Outside the Market Area
Number of Units
Operating Within the
Market Area
SUMMARY OF SUPPLY AND DEMAND FOR THE MARKET AREA
SUMMARY OF SUPPLY AND DEMAND FOR INDIVIDUALS FROM THE MARKET
AREA AND FROM OUTSIDE THE MARKET AREA UNMET
DEMAND OR
(EXCESS)Demand For the Market Area and
Outside the Market Area1
Demand For the
Market Area
Number of Units Serving
the Market Area
35
General Assisted Living - Market Rate 22 36 (14) 9 31 51 (20)General Assisted Living - Subsidized 22 8 15 10 32 11 21
Memory Loss Assisted Living - Market Rate 10 0 10 4 14 0 14Memory Loss Assisted Living - Subsidized 18 0 18 8 26 0 26
Independent Congregate Housing - Market Rate 70 12 59 30 101 17 Housing with Services/Catered Living 51 9 42 Independent Housing with No Services 50 8 42
1 The demand assumes 70 percent of the total units will be filled by persons from the market area and an additional 30 percent will be filled by personsfrom outside of the market area.
SUMMARY OF SUPPLY AND DEMANDFOR THE HAWLEY MARKET AREA
THE CITY OF HAWLEY, HAWLEY, MINNESOTA2018
Additional Demand
(Oversupply) To Serve the Market Area
Additional Demand To
Serve Individuals Outside the Market Area
Number of Units
Operating Within the
Market Area
SUMMARY OF SUPPLY AND DEMAND FOR THE MARKET AREA
SUMMARY OF SUPPLY AND DEMAND FOR INDIVIDUALS FROM THE MARKET
AREA AND FROM OUTSIDE THE MARKET AREA UNMET
DEMAND OR
(EXCESS)Demand For the Market Area and
Outside the Market Area1
Demand For the
Market Area
Number of Units Serving
the Market Area
36

APPENDIX
37
38
PROFILE OF GENERAL ASSISTED LIVING IN THE GREATER FARGO MOORHEAD MARKET AREA
EVENTIDE SENIOR LIVING COMMUNITIES, MOORHEAD, MINNESOTA FEBRUARY 2013
(PAGE 1 OF 7)
Facility1
Capacity
Year Built
Percent Occupied
on the Day
Contacted
Type of Room Available
Market Rate Subsidized Services/Amenities included in Rent
Package
Services/ Amenities Available for Purchase From
Building Monthly Fees
Eventide Fairmont 801 Second Avenue North Moorhead, MN 56560 (HWS)
69 95.7% (66/69)
Companion Suites 1 Bedroom 2 Bedroom
Full Bathroom
No Kitchen
50.0% 50.0%
3 meals per day, Housekeeping and
Scheduled Transportation
Laundry, Linen, and Personal Care $1,857-$2,200
Eventide Linden Tree Circle 1400 Seventh Street South Moorhead, MN 56560 (HWS)
119 97.5% (116/119)
1 Bedroom (471-905 s.f.) 2 Bedroom
(676-1,089 s.f.)
¾ or Full Bathroom Kitchen
100.0% 0.0%
Housekeeping and Scheduled Transportation
3 meals per day, Laundry, Linen, and
Personal Care $1,580-$2,214 $2,030-$2,645
Sheyenne Crossings - East 225 13th Avenue West West Fargo, ND 58078 (AL)
36
2006
86.1% (31/36)
Studio 1 Bedroom 2 Bedroom
(450-1,000 s.f.)
¾ Bathroom Kitchenette
100.0% 0.0%
3 meals per day, Laundry, Linen, Housekeeping,
Scheduled Transportation, and Personal Care
Garage at $50 per month
Studio:$1,666 1 Bedroom:$2,588-$2,861
2 Bedroom:$3,044
1 Facilities are licensed/registered as follows:
(AL) Assisted Living in the State of North Dakota (BC) Basic Care in the State of North Dakota (HWS) Housing with Services; most also have a Class F home care license or contract with an independent home care agency
39
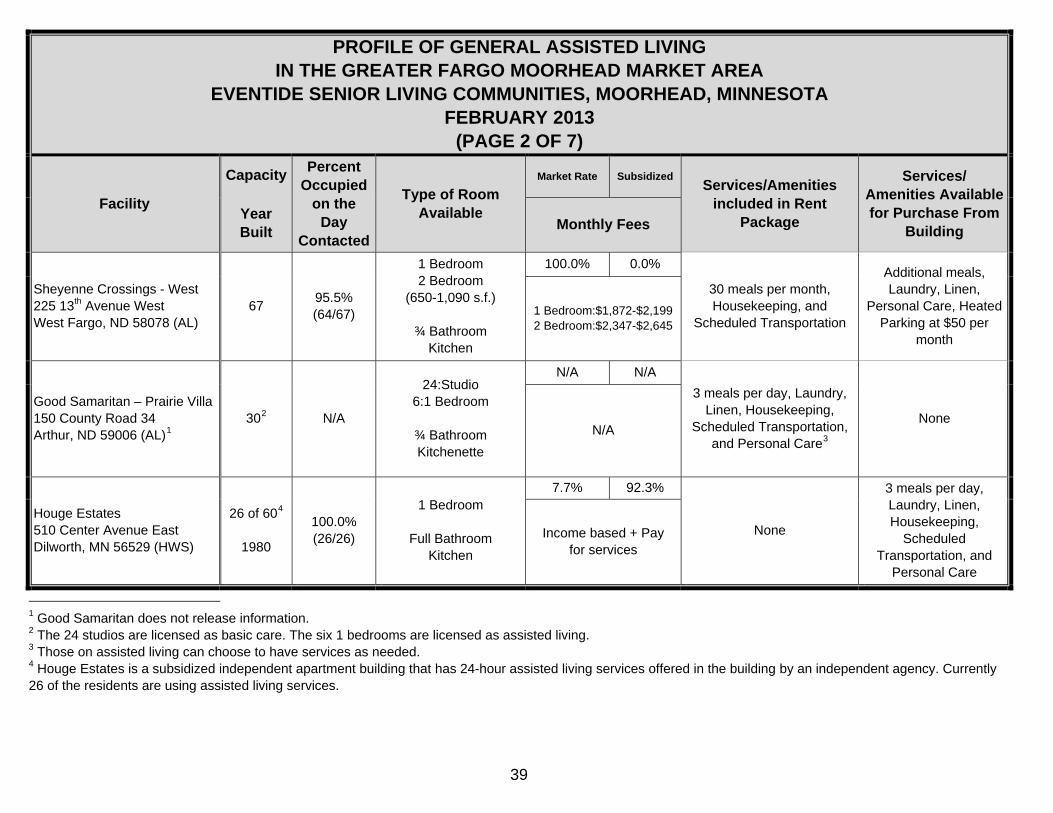
PROFILE OF GENERAL ASSISTED LIVING IN THE GREATER FARGO MOORHEAD MARKET AREA
EVENTIDE SENIOR LIVING COMMUNITIES, MOORHEAD, MINNESOTA FEBRUARY 2013
(PAGE 2 OF 7)
Facility
Capacity
Year Built
Percent Occupied
on the Day
Contacted
Type of Room Available
Market Rate Subsidized Services/Amenities included in Rent
Package
Services/ Amenities Available for Purchase From
Building Monthly Fees
Sheyenne Crossings - West 225 13th Avenue West West Fargo, ND 58078 (AL)
67 95.5% (64/67)
1 Bedroom 2 Bedroom
(650-1,090 s.f.)
¾ Bathroom Kitchen
100.0% 0.0%
30 meals per month, Housekeeping, and
Scheduled Transportation
Additional meals, Laundry, Linen,
Personal Care, Heated Parking at $50 per
month
1 Bedroom:$1,872-$2,199 2 Bedroom:$2,347-$2,645
Good Samaritan – Prairie Villa 150 County Road 34 Arthur, ND 59006 (AL)1
302 N/A
24:Studio 6:1 Bedroom
¾ Bathroom Kitchenette
N/A N/A 3 meals per day, Laundry,
Linen, Housekeeping, Scheduled Transportation,
and Personal Care3
None N/A
Houge Estates 510 Center Avenue East Dilworth, MN 56529 (HWS)
26 of 604
1980
100.0% (26/26)
1 Bedroom
Full Bathroom Kitchen
7.7% 92.3%
None
3 meals per day, Laundry, Linen, Housekeeping,
Scheduled Transportation, and
Personal Care
Income based + Pay for services
1 Good Samaritan does not release information. 2 The 24 studios are licensed as basic care. The six 1 bedrooms are licensed as assisted living. 3 Those on assisted living can choose to have services as needed. 4 Houge Estates is a subsidized independent apartment building that has 24-hour assisted living services offered in the building by an independent agency. Currently 26 of the residents are using assisted living services.
40
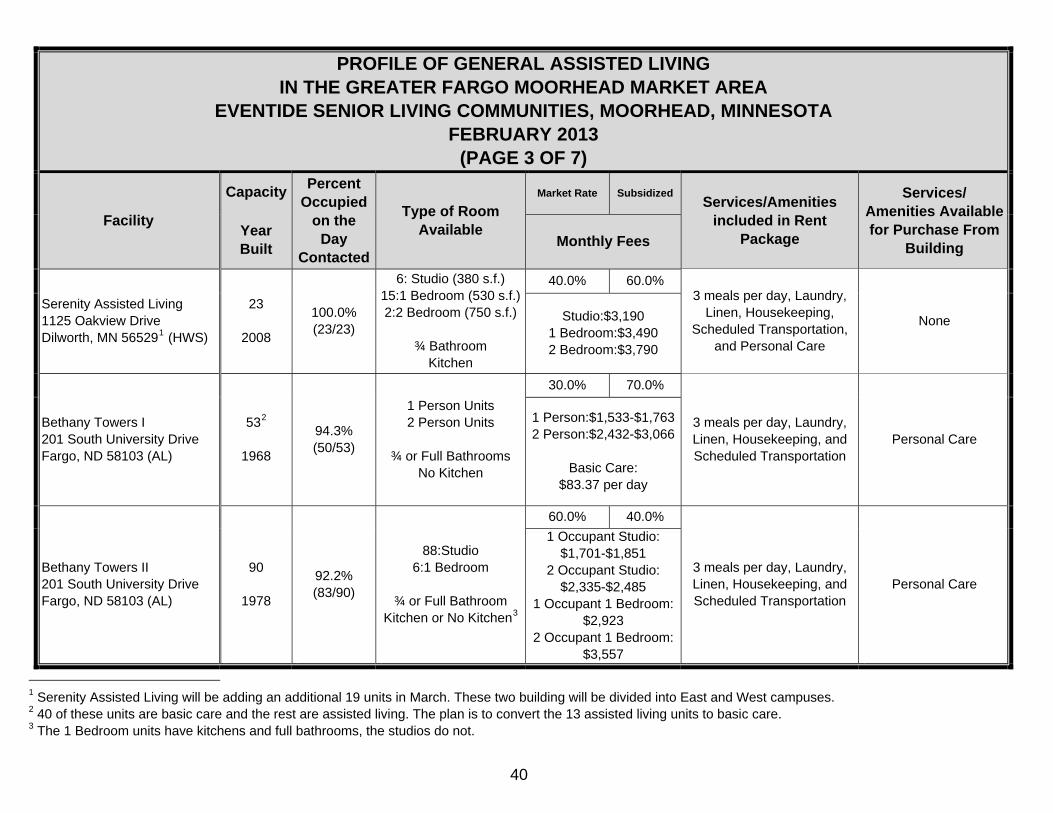
PROFILE OF GENERAL ASSISTED LIVING IN THE GREATER FARGO MOORHEAD MARKET AREA
EVENTIDE SENIOR LIVING COMMUNITIES, MOORHEAD, MINNESOTA FEBRUARY 2013
(PAGE 3 OF 7)
Facility
Capacity
Year Built
Percent Occupied
on the Day
Contacted
Type of Room Available
Market Rate Subsidized Services/Amenities
included in Rent Package
Services/ Amenities Available for Purchase From
Building Monthly Fees
Serenity Assisted Living 1125 Oakview Drive Dilworth, MN 565291 (HWS)
23
2008
100.0% (23/23)
6: Studio (380 s.f.) 15:1 Bedroom (530 s.f.)2:2 Bedroom (750 s.f.)
¾ Bathroom
Kitchen
40.0% 60.0% 3 meals per day, Laundry,
Linen, Housekeeping, Scheduled Transportation,
and Personal Care
None Studio:$3,190 1 Bedroom:$3,490 2 Bedroom:$3,790
Bethany Towers I 201 South University Drive Fargo, ND 58103 (AL)
532
1968
94.3% (50/53)
1 Person Units 2 Person Units
¾ or Full Bathrooms
No Kitchen
30.0% 70.0%
3 meals per day, Laundry, Linen, Housekeeping, and Scheduled Transportation
Personal Care 1 Person:$1,533-$1,7632 Person:$2,432-$3,066
Basic Care:
$83.37 per day
Bethany Towers II 201 South University Drive Fargo, ND 58103 (AL)
90
1978
92.2% (83/90)
88:Studio 6:1 Bedroom
¾ or Full Bathroom
Kitchen or No Kitchen3
60.0% 40.0%
3 meals per day, Laundry, Linen, Housekeeping, and Scheduled Transportation
Personal Care
1 Occupant Studio: $1,701-$1,851
2 Occupant Studio: $2,335-$2,485
1 Occupant 1 Bedroom: $2,923
2 Occupant 1 Bedroom: $3,557
1 Serenity Assisted Living will be adding an additional 19 units in March. These two building will be divided into East and West campuses. 2 40 of these units are basic care and the rest are assisted living. The plan is to convert the 13 assisted living units to basic care. 3 The 1 Bedroom units have kitchens and full bathrooms, the studios do not.
41
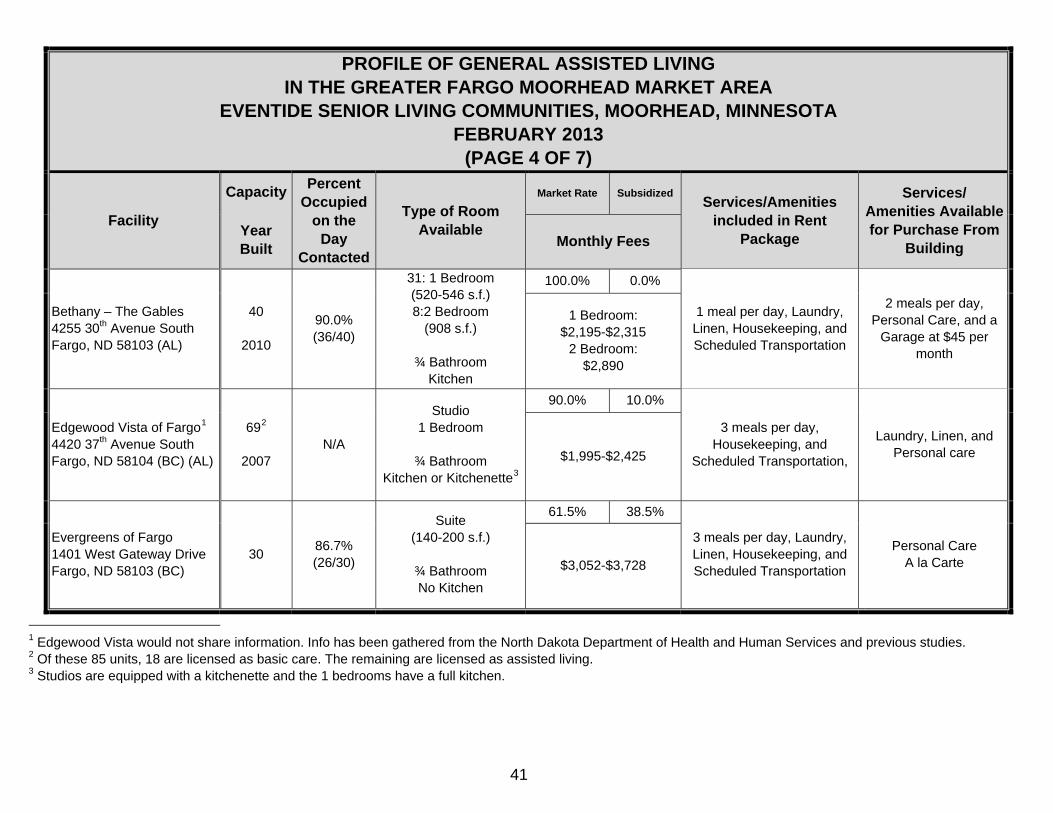
PROFILE OF GENERAL ASSISTED LIVING IN THE GREATER FARGO MOORHEAD MARKET AREA
EVENTIDE SENIOR LIVING COMMUNITIES, MOORHEAD, MINNESOTA FEBRUARY 2013
(PAGE 4 OF 7)
Facility
Capacity
Year Built
Percent Occupied
on the Day
Contacted
Type of Room Available
Market Rate Subsidized Services/Amenities
included in Rent Package
Services/ Amenities Available for Purchase From
Building Monthly Fees
Bethany – The Gables 4255 30th Avenue South Fargo, ND 58103 (AL)
40
2010
90.0% (36/40)
31: 1 Bedroom (520-546 s.f.) 8:2 Bedroom
(908 s.f.)
¾ Bathroom Kitchen
100.0% 0.0%
1 meal per day, Laundry, Linen, Housekeeping, and Scheduled Transportation
2 meals per day, Personal Care, and a
Garage at $45 per month
1 Bedroom: $2,195-$2,315
2 Bedroom: $2,890
Edgewood Vista of Fargo1 4420 37th Avenue South Fargo, ND 58104 (BC) (AL)
692
2007 N/A
Studio 1 Bedroom
¾ Bathroom
Kitchen or Kitchenette3
90.0% 10.0%
3 meals per day, Housekeeping, and
Scheduled Transportation,
Laundry, Linen, and Personal care $1,995-$2,425
Evergreens of Fargo 1401 West Gateway Drive Fargo, ND 58103 (BC)
30 86.7% (26/30)
Suite (140-200 s.f.)
¾ Bathroom No Kitchen
61.5% 38.5%
3 meals per day, Laundry, Linen, Housekeeping, and Scheduled Transportation
Personal Care A la Carte $3,052-$3,728
1 Edgewood Vista would not share information. Info has been gathered from the North Dakota Department of Health and Human Services and previous studies. 2 Of these 85 units, 18 are licensed as basic care. The remaining are licensed as assisted living. 3 Studios are equipped with a kitchenette and the 1 bedrooms have a full kitchen.
42
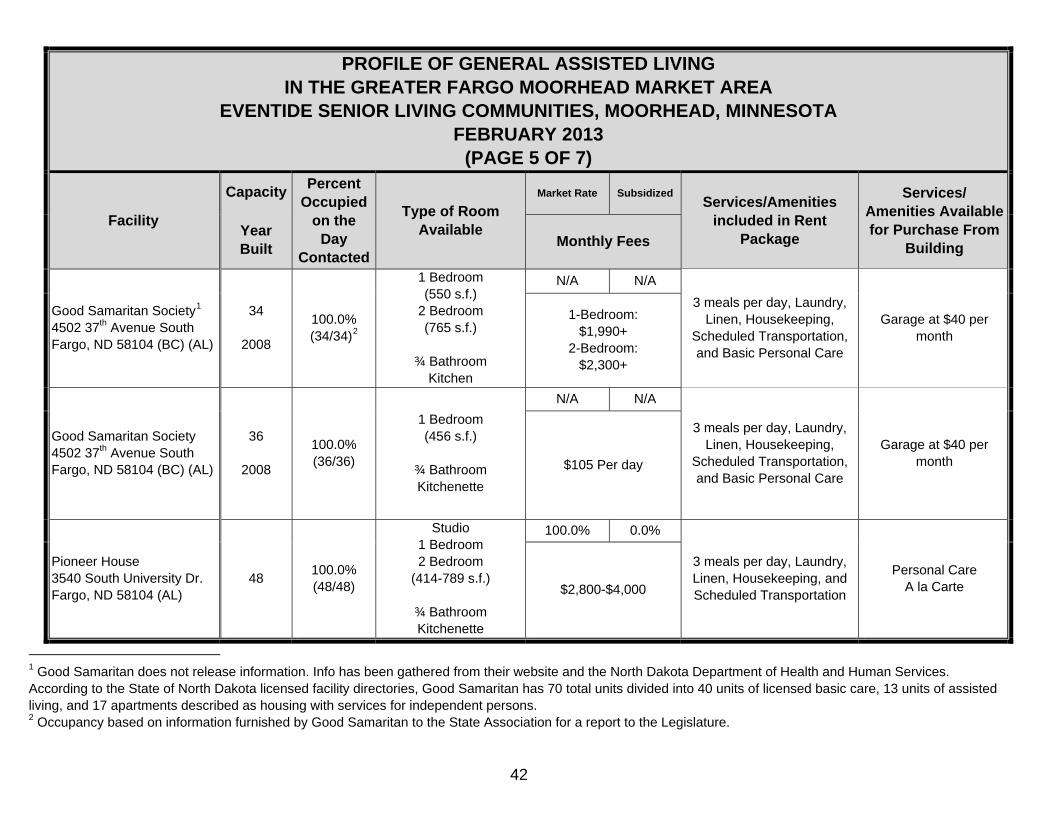
PROFILE OF GENERAL ASSISTED LIVING IN THE GREATER FARGO MOORHEAD MARKET AREA
EVENTIDE SENIOR LIVING COMMUNITIES, MOORHEAD, MINNESOTA FEBRUARY 2013
(PAGE 5 OF 7)
Facility
Capacity
Year Built
Percent Occupied
on the Day
Contacted
Type of Room Available
Market Rate Subsidized Services/Amenities
included in Rent Package
Services/ Amenities Available for Purchase From
Building Monthly Fees
Good Samaritan Society1 4502 37th Avenue South Fargo, ND 58104 (BC) (AL)
34
2008
100.0% (34/34)2
1 Bedroom (550 s.f.)
2 Bedroom (765 s.f.)
¾ Bathroom
Kitchen
N/A N/A 3 meals per day, Laundry,
Linen, Housekeeping, Scheduled Transportation, and Basic Personal Care
Garage at $40 per month
1-Bedroom: $1,990+
2-Bedroom: $2,300+
Good Samaritan Society 4502 37th Avenue South Fargo, ND 58104 (BC) (AL)
36
2008
100.0% (36/36)
1 Bedroom (456 s.f.)
¾ Bathroom Kitchenette
N/A N/A
3 meals per day, Laundry, Linen, Housekeeping,
Scheduled Transportation, and Basic Personal Care
Garage at $40 per month $105 Per day
Pioneer House 3540 South University Dr. Fargo, ND 58104 (AL)
48 100.0% (48/48)
Studio 1 Bedroom 2 Bedroom
(414-789 s.f.)
¾ Bathroom Kitchenette
100.0% 0.0%
3 meals per day, Laundry, Linen, Housekeeping, and Scheduled Transportation
Personal Care A la Carte $2,800-$4,000
1 Good Samaritan does not release information. Info has been gathered from their website and the North Dakota Department of Health and Human Services. According to the State of North Dakota licensed facility directories, Good Samaritan has 70 total units divided into 40 units of licensed basic care, 13 units of assisted living, and 17 apartments described as housing with services for independent persons. 2 Occupancy based on information furnished by Good Samaritan to the State Association for a report to the Legislature.
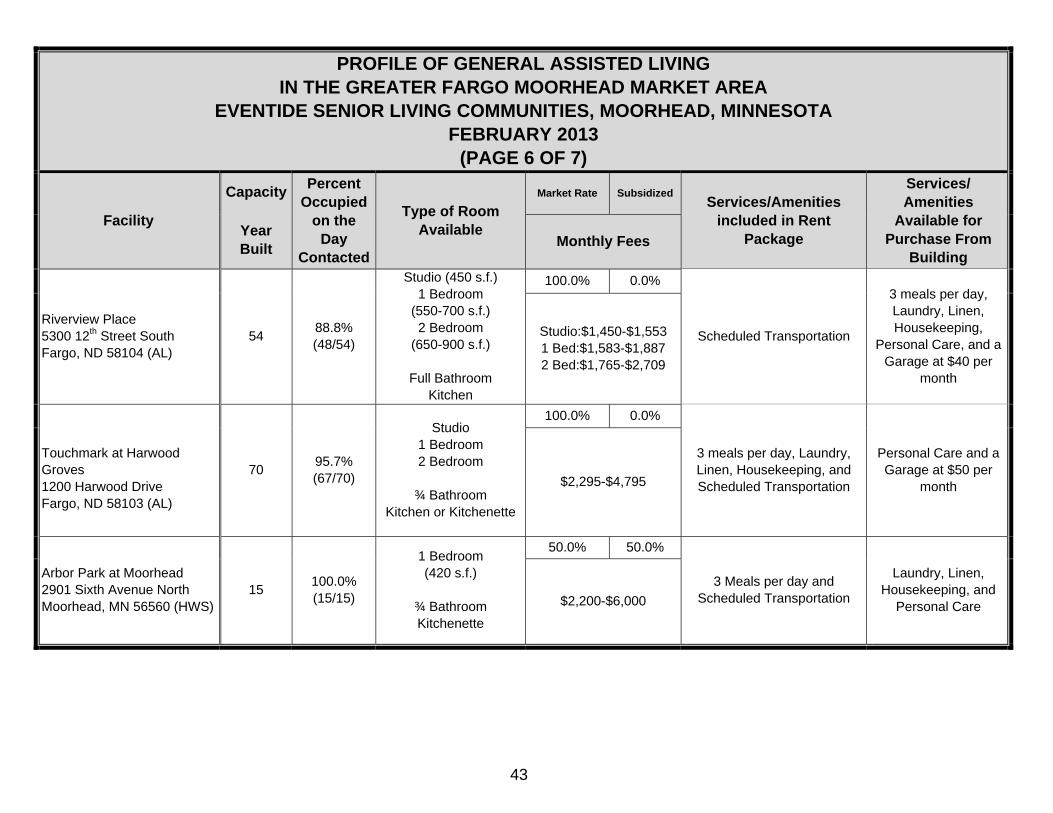
43
PROFILE OF GENERAL ASSISTED LIVING IN THE GREATER FARGO MOORHEAD MARKET AREA
EVENTIDE SENIOR LIVING COMMUNITIES, MOORHEAD, MINNESOTA FEBRUARY 2013
(PAGE 6 OF 7)
Facility
Capacity
Year Built
Percent Occupied
on the Day
Contacted
Type of Room Available
Market Rate Subsidized Services/Amenities
included in Rent Package
Services/ Amenities
Available for Purchase From
Building Monthly Fees
Riverview Place 5300 12th Street South Fargo, ND 58104 (AL)
54 88.8% (48/54)
Studio (450 s.f.) 1 Bedroom
(550-700 s.f.) 2 Bedroom
(650-900 s.f.)
Full Bathroom Kitchen
100.0% 0.0%
Scheduled Transportation
3 meals per day, Laundry, Linen, Housekeeping,
Personal Care, and a Garage at $40 per
month
Studio:$1,450-$1,553 1 Bed:$1,583-$1,887 2 Bed:$1,765-$2,709
Touchmark at Harwood Groves 1200 Harwood Drive Fargo, ND 58103 (AL)
70 95.7% (67/70)
Studio 1 Bedroom 2 Bedroom
¾ Bathroom
Kitchen or Kitchenette
100.0% 0.0%
3 meals per day, Laundry, Linen, Housekeeping, and Scheduled Transportation
Personal Care and a Garage at $50 per
month $2,295-$4,795
Arbor Park at Moorhead 2901 Sixth Avenue North Moorhead, MN 56560 (HWS)
15 100.0% (15/15)
1 Bedroom (420 s.f.)
¾ Bathroom Kitchenette
50.0% 50.0%
3 Meals per day and Scheduled Transportation
Laundry, Linen, Housekeeping, and
Personal Care $2,200-$6,000
44
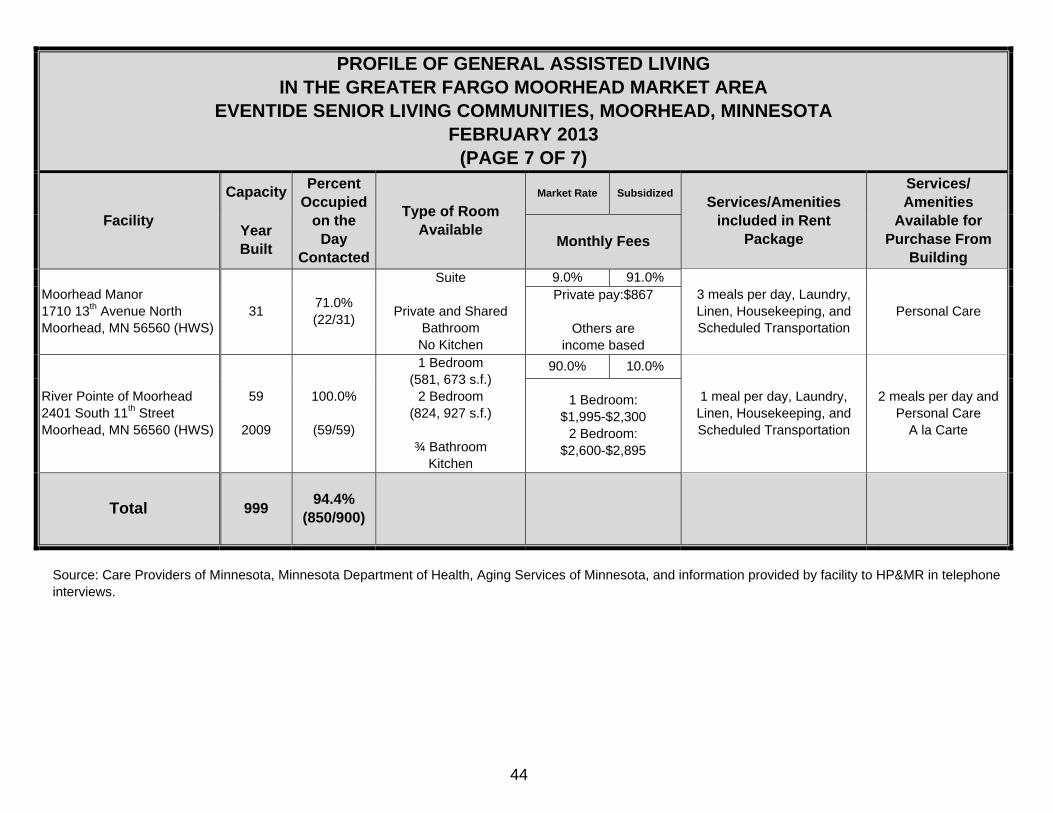
PROFILE OF GENERAL ASSISTED LIVING IN THE GREATER FARGO MOORHEAD MARKET AREA
EVENTIDE SENIOR LIVING COMMUNITIES, MOORHEAD, MINNESOTA FEBRUARY 2013
(PAGE 7 OF 7)
Facility
Capacity
Year Built
Percent Occupied
on the Day
Contacted
Type of Room Available
Market Rate Subsidized Services/Amenities
included in Rent Package
Services/ Amenities
Available for Purchase From
Building Monthly Fees
Moorhead Manor 1710 13th Avenue North Moorhead, MN 56560 (HWS)
31 71.0% (22/31)
Suite
Private and Shared Bathroom No Kitchen
9.0% 91.0% 3 meals per day, Laundry, Linen, Housekeeping, and Scheduled Transportation
Personal Care Private pay:$867
Others are
income based
River Pointe of Moorhead 2401 South 11th Street Moorhead, MN 56560 (HWS)
59
2009
100.0%
(59/59)
1 Bedroom (581, 673 s.f.)
2 Bedroom (824, 927 s.f.)
¾ Bathroom
Kitchen
90.0% 10.0%
1 meal per day, Laundry, Linen, Housekeeping, and Scheduled Transportation
2 meals per day and Personal Care
A la Carte
1 Bedroom: $1,995-$2,300
2 Bedroom: $2,600-$2,895
Total 999 94.4% (850/900)
Source: Care Providers of Minnesota, Minnesota Department of Health, Aging Services of Minnesota, and information provided by facility to HP&MR in telephone interviews.
45
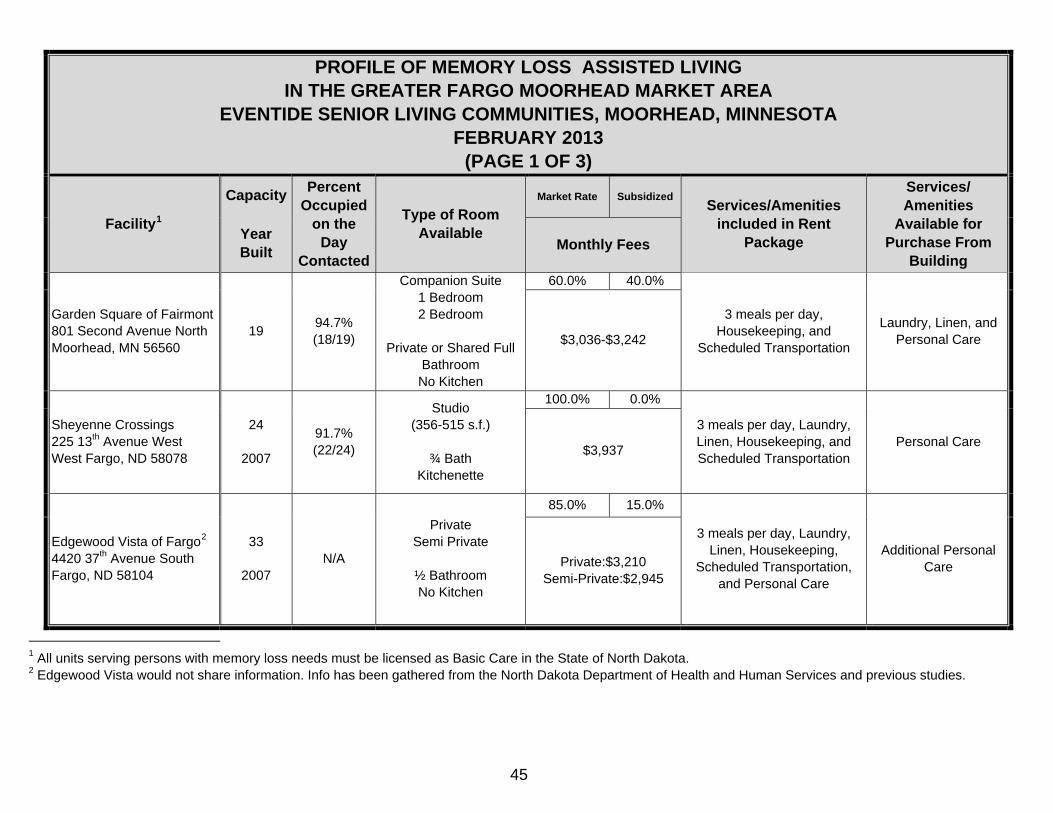
PROFILE OF MEMORY LOSS ASSISTED LIVING IN THE GREATER FARGO MOORHEAD MARKET AREA
EVENTIDE SENIOR LIVING COMMUNITIES, MOORHEAD, MINNESOTA FEBRUARY 2013
(PAGE 1 OF 3)
Facility1
Capacity
Year Built
Percent Occupied
on the Day
Contacted
Type of Room Available
Market Rate Subsidized Services/Amenities included in Rent
Package
Services/ Amenities
Available for Purchase From
Building Monthly Fees
Garden Square of Fairmont 801 Second Avenue North Moorhead, MN 56560
19 94.7% (18/19)
Companion Suite 1 Bedroom 2 Bedroom
Private or Shared Full
Bathroom No Kitchen
60.0% 40.0%
3 meals per day, Housekeeping, and
Scheduled Transportation
Laundry, Linen, and Personal Care $3,036-$3,242
Sheyenne Crossings 225 13th Avenue West West Fargo, ND 58078
24
2007
91.7% (22/24)
Studio (356-515 s.f.)
¾ Bath
Kitchenette
100.0% 0.0%
3 meals per day, Laundry, Linen, Housekeeping, and Scheduled Transportation
Personal Care $3,937
Edgewood Vista of Fargo2 4420 37th Avenue South Fargo, ND 58104
33
2007 N/A
Private Semi Private
½ Bathroom No Kitchen
85.0% 15.0%
3 meals per day, Laundry, Linen, Housekeeping,
Scheduled Transportation, and Personal Care
Additional Personal Care Private:$3,210
Semi-Private:$2,945
1 All units serving persons with memory loss needs must be licensed as Basic Care in the State of North Dakota. 2 Edgewood Vista would not share information. Info has been gathered from the North Dakota Department of Health and Human Services and previous studies.
46
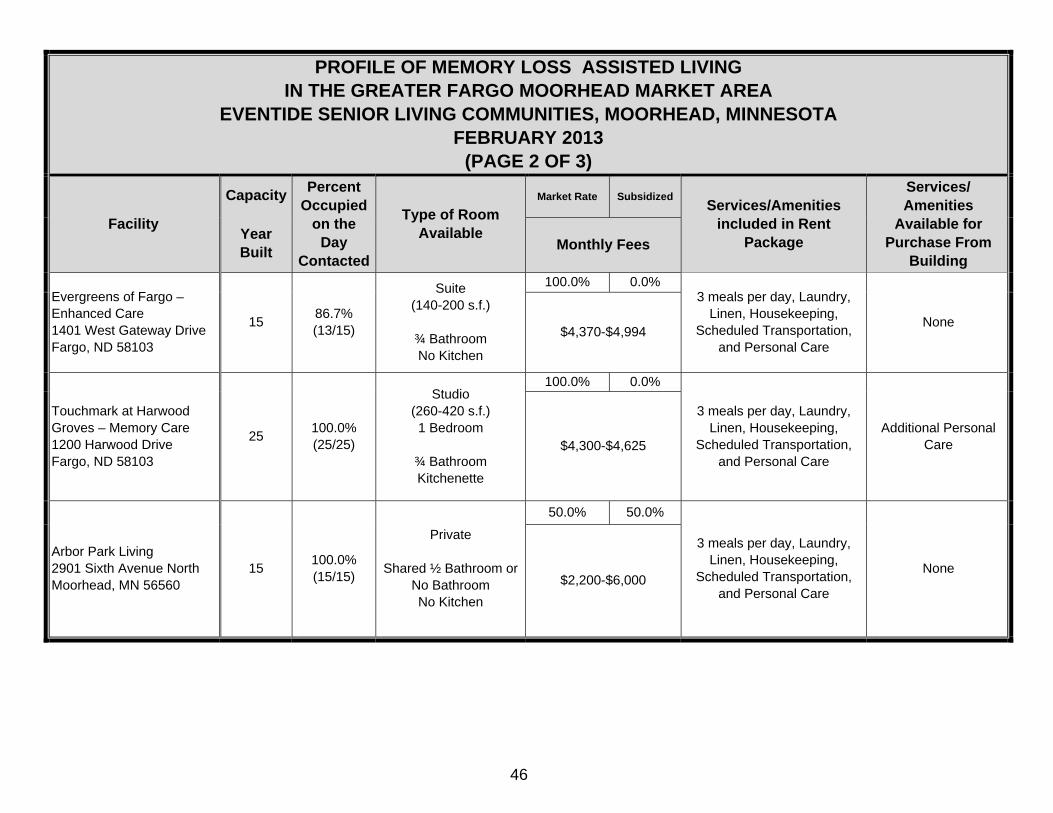
PROFILE OF MEMORY LOSS ASSISTED LIVING IN THE GREATER FARGO MOORHEAD MARKET AREA
EVENTIDE SENIOR LIVING COMMUNITIES, MOORHEAD, MINNESOTA FEBRUARY 2013
(PAGE 2 OF 3)
Facility
Capacity
Year Built
Percent Occupied
on the Day
Contacted
Type of Room Available
Market Rate Subsidized Services/Amenities included in Rent
Package
Services/ Amenities
Available for Purchase From
Building Monthly Fees
Evergreens of Fargo – Enhanced Care 1401 West Gateway Drive Fargo, ND 58103
15 86.7% (13/15)
Suite (140-200 s.f.)
¾ Bathroom No Kitchen
100.0% 0.0% 3 meals per day, Laundry,
Linen, Housekeeping, Scheduled Transportation,
and Personal Care
None $4,370-$4,994
Touchmark at Harwood Groves – Memory Care 1200 Harwood Drive Fargo, ND 58103
25 100.0% (25/25)
Studio (260-420 s.f.) 1 Bedroom
¾ Bathroom Kitchenette
100.0% 0.0%
3 meals per day, Laundry, Linen, Housekeeping,
Scheduled Transportation, and Personal Care
Additional Personal Care $4,300-$4,625
Arbor Park Living 2901 Sixth Avenue North Moorhead, MN 56560
15 100.0% (15/15)
Private
Shared ½ Bathroom or No Bathroom No Kitchen
50.0% 50.0%
3 meals per day, Laundry, Linen, Housekeeping,
Scheduled Transportation, and Personal Care
None $2,200-$6,000
47
PROFILE OF MEMORY LOSS ASSISTED LIVING IN THE GREATER FARGO MOORHEAD MARKET AREA
EVENTIDE SENIOR LIVING COMMUNITIES, MOORHEAD, MINNESOTA FEBRUARY 2013
(PAGE 3 OF 3)
Facility
Capacity
Year Built
Percent Occupied
on the Day
Contacted
Type of Room Available
Market Rate Subsidized Services/Amenities
included in Rent Package
Services/ Amenities
Available for Purchase From
Building Monthly Fees
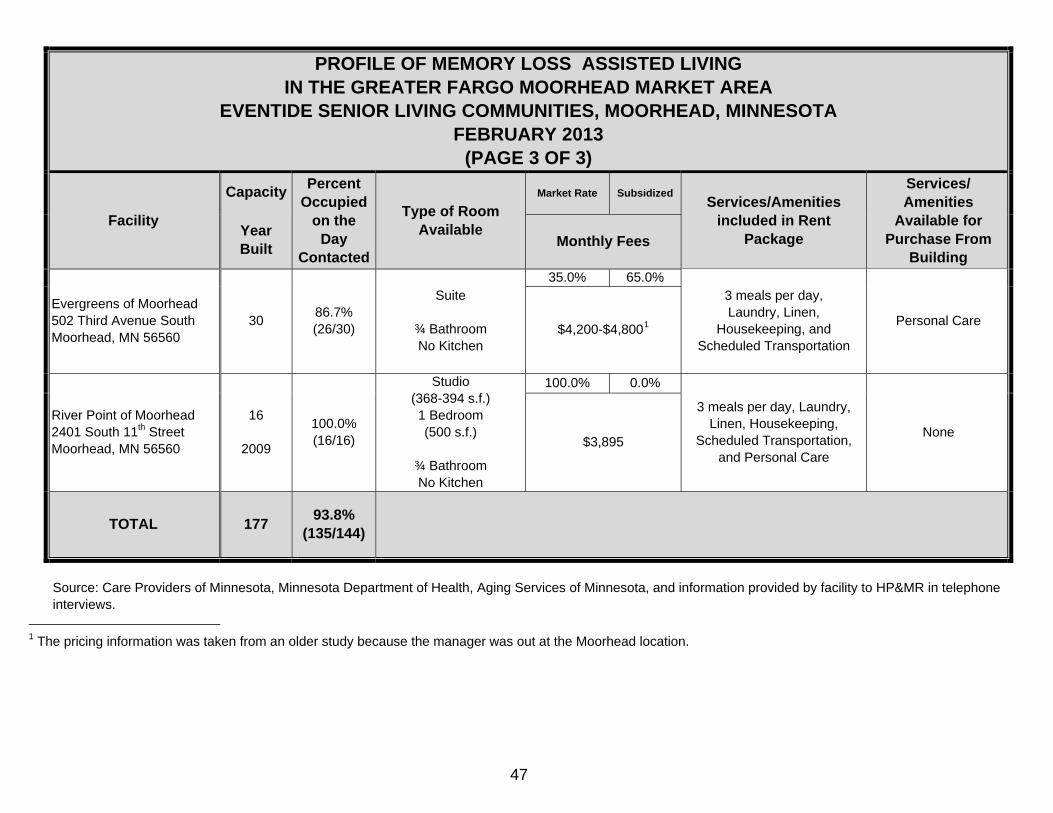
Evergreens of Moorhead 502 Third Avenue South Moorhead, MN 56560
30 86.7% (26/30)
Suite
¾ Bathroom No Kitchen
35.0% 65.0% 3 meals per day, Laundry, Linen,
Housekeeping, and Scheduled Transportation
Personal Care $4,200-$4,8001
River Point of Moorhead 2401 South 11th Street Moorhead, MN 56560
16
2009
100.0% (16/16)
Studio (368-394 s.f.) 1 Bedroom (500 s.f.)
¾ Bathroom No Kitchen
100.0% 0.0%
3 meals per day, Laundry, Linen, Housekeeping,
Scheduled Transportation, and Personal Care
None $3,895
TOTAL 177 93.8% (135/144)
Source: Care Providers of Minnesota, Minnesota Department of Health, Aging Services of Minnesota, and information provided by facility to HP&MR in telephone interviews.
1 The pricing information was taken from an older study because the manager was out at the Moorhead location.
48
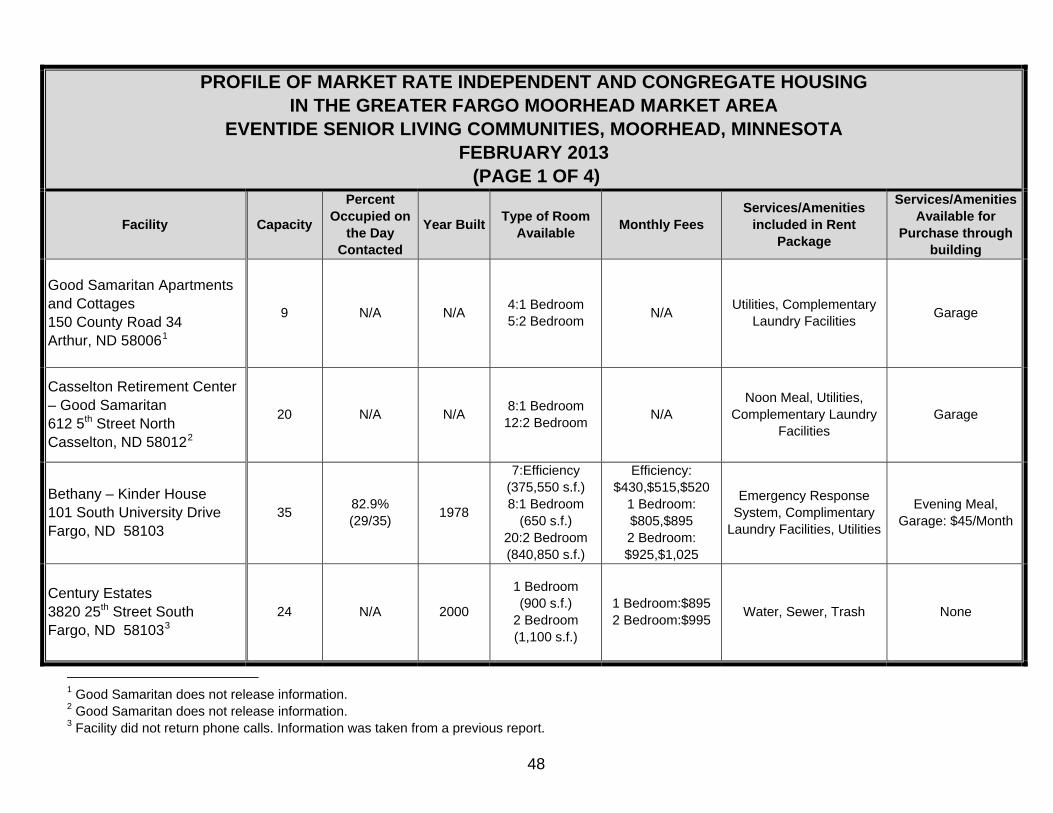
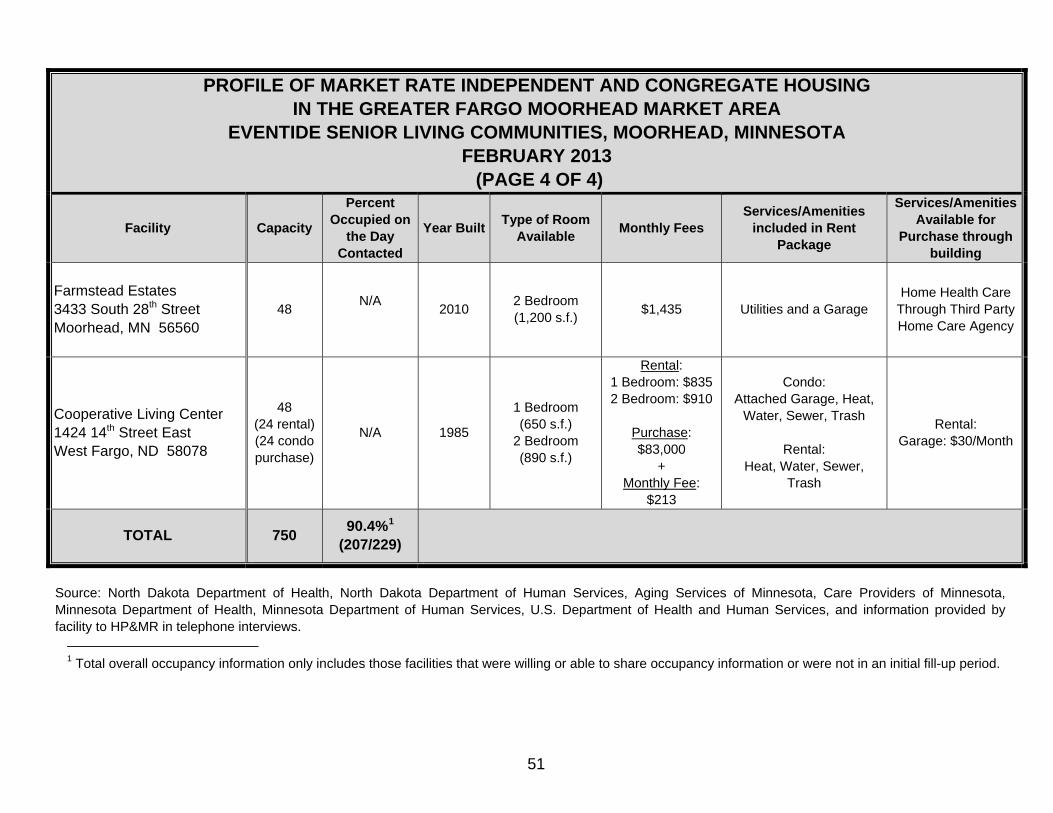
PROFILE OF MARKET RATE INDEPENDENT AND CONGREGATE HOUSING IN THE GREATER FARGO MOORHEAD MARKET AREA
EVENTIDE SENIOR LIVING COMMUNITIES, MOORHEAD, MINNESOTA FEBRUARY 2013 (PAGE 1 OF 4)
Facility Capacity
Percent Occupied on
the Day Contacted
Year Built Type of Room Available Monthly Fees
Services/Amenities included in Rent
Package
Services/Amenities Available for
Purchase through building
Good Samaritan Apartments and Cottages 150 County Road 34 Arthur, ND 580061
9 N/A N/A 4:1 Bedroom 5:2 Bedroom N/A Utilities, Complementary
Laundry Facilities Garage
Casselton Retirement Center – Good Samaritan 612 5th Street North Casselton, ND 580122
20 N/A N/A 8:1 Bedroom 12:2 Bedroom N/A
Noon Meal, Utilities, Complementary Laundry
Facilities Garage
Bethany – Kinder House 101 South University Drive Fargo, ND 58103
35 82.9% (29/35) 1978
7:Efficiency (375,550 s.f.) 8:1 Bedroom
(650 s.f.) 20:2 Bedroom (840,850 s.f.)
Efficiency: $430,$515,$520
1 Bedroom: $805,$895 2 Bedroom: $925,$1,025
Emergency Response System, Complimentary
Laundry Facilities, Utilities
Evening Meal, Garage: $45/Month
Century Estates 3820 25th Street South Fargo, ND 581033
24 N/A 2000
1 Bedroom (900 s.f.)
2 Bedroom (1,100 s.f.)
1 Bedroom:$895 2 Bedroom:$995 Water, Sewer, Trash None
1 Good Samaritan does not release information. 2 Good Samaritan does not release information. 3 Facility did not return phone calls. Information was taken from a previous report.
49
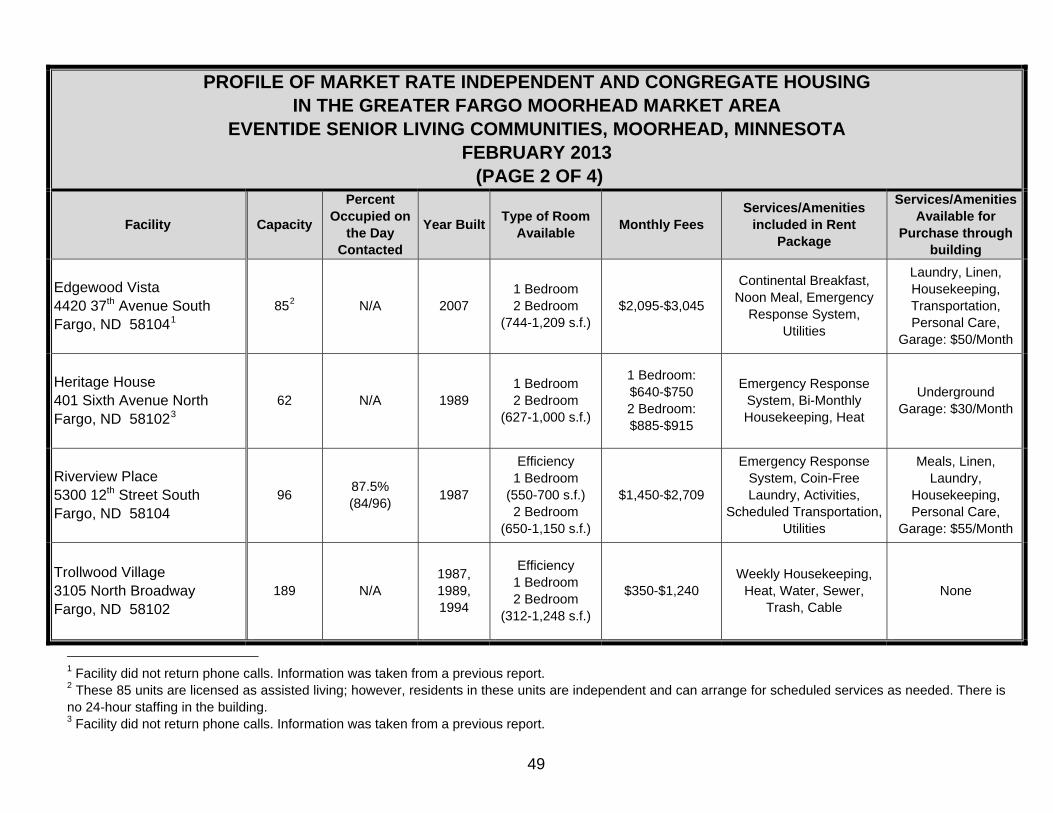
PROFILE OF MARKET RATE INDEPENDENT AND CONGREGATE HOUSING IN THE GREATER FARGO MOORHEAD MARKET AREA
EVENTIDE SENIOR LIVING COMMUNITIES, MOORHEAD, MINNESOTA FEBRUARY 2013 (PAGE 2 OF 4)
Facility Capacity
Percent Occupied on
the Day Contacted
Year Built Type of Room Available Monthly Fees
Services/Amenities included in Rent
Package
Services/Amenities Available for
Purchase through building
Edgewood Vista 4420 37th Avenue South Fargo, ND 581041
852 N/A 2007 1 Bedroom 2 Bedroom
(744-1,209 s.f.) $2,095-$3,045
Continental Breakfast, Noon Meal, Emergency
Response System, Utilities
Laundry, Linen, Housekeeping, Transportation, Personal Care,
Garage: $50/Month
Heritage House 401 Sixth Avenue North Fargo, ND 581023
62 N/A 1989 1 Bedroom 2 Bedroom
(627-1,000 s.f.)
1 Bedroom: $640-$750 2 Bedroom: $885-$915
Emergency Response System, Bi-Monthly Housekeeping, Heat
Underground Garage: $30/Month
Riverview Place 5300 12th Street South Fargo, ND 58104
96 87.5% (84/96) 1987
Efficiency 1 Bedroom
(550-700 s.f.) 2 Bedroom
(650-1,150 s.f.)
$1,450-$2,709
Emergency Response System, Coin-Free Laundry, Activities,
Scheduled Transportation, Utilities
Meals, Linen, Laundry,
Housekeeping, Personal Care,
Garage: $55/Month
Trollwood Village 3105 North Broadway Fargo, ND 58102
189 N/A 1987, 1989, 1994
Efficiency 1 Bedroom 2 Bedroom
(312-1,248 s.f.)
$350-$1,240 Weekly Housekeeping,
Heat, Water, Sewer, Trash, Cable
None
1 Facility did not return phone calls. Information was taken from a previous report. 2 These 85 units are licensed as assisted living; however, residents in these units are independent and can arrange for scheduled services as needed. There is no 24-hour staffing in the building. 3 Facility did not return phone calls. Information was taken from a previous report.
50
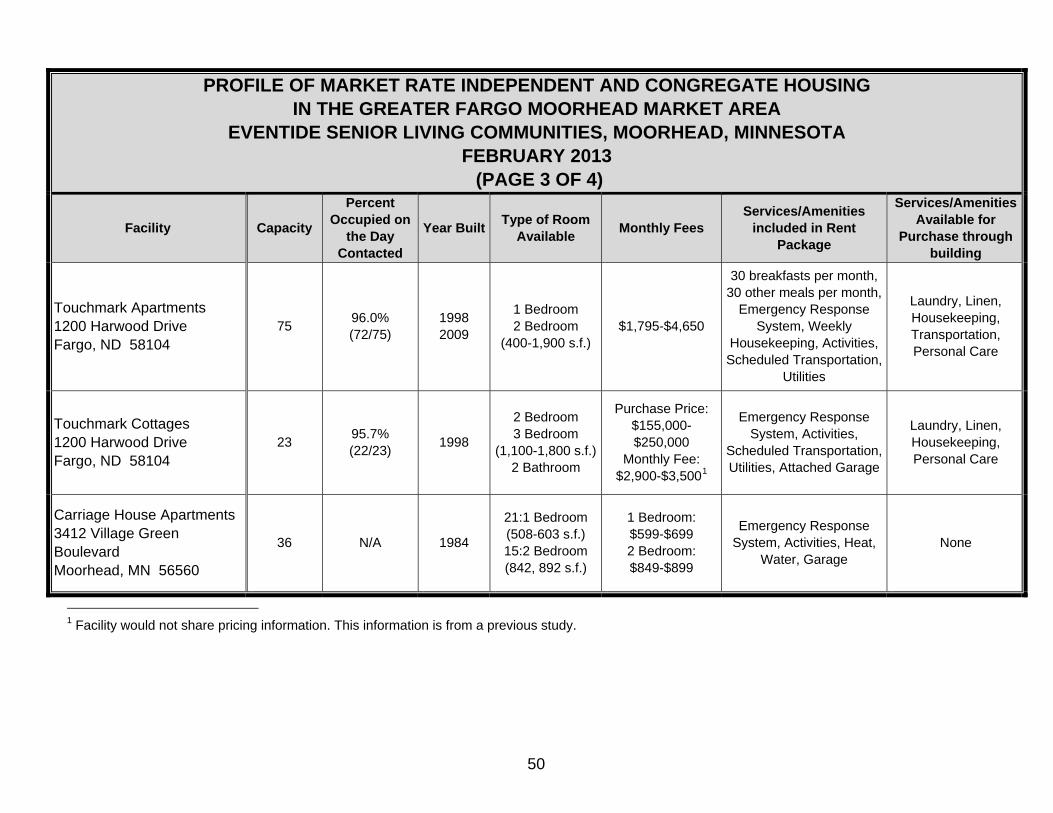
PROFILE OF MARKET RATE INDEPENDENT AND CONGREGATE HOUSING IN THE GREATER FARGO MOORHEAD MARKET AREA
EVENTIDE SENIOR LIVING COMMUNITIES, MOORHEAD, MINNESOTA FEBRUARY 2013 (PAGE 3 OF 4)
Facility Capacity
Percent Occupied on
the Day Contacted
Year Built Type of Room Available Monthly Fees
Services/Amenities included in Rent
Package
Services/Amenities Available for
Purchase through building
Touchmark Apartments 1200 Harwood Drive Fargo, ND 58104
75 96.0% (72/75)
1998 2009
1 Bedroom 2 Bedroom
(400-1,900 s.f.) $1,795-$4,650
30 breakfasts per month, 30 other meals per month,
Emergency Response System, Weekly
Housekeeping, Activities, Scheduled Transportation,
Utilities
Laundry, Linen, Housekeeping, Transportation, Personal Care
Touchmark Cottages 1200 Harwood Drive Fargo, ND 58104
23 95.7% (22/23) 1998
2 Bedroom 3 Bedroom
(1,100-1,800 s.f.)2 Bathroom
Purchase Price: $155,000-$250,000
Monthly Fee: $2,900-$3,5001
Emergency Response System, Activities,
Scheduled Transportation, Utilities, Attached Garage
Laundry, Linen, Housekeeping, Personal Care
Carriage House Apartments 3412 Village Green Boulevard Moorhead, MN 56560
36 N/A 1984
21:1 Bedroom (508-603 s.f.) 15:2 Bedroom (842, 892 s.f.)
1 Bedroom: $599-$699 2 Bedroom: $849-$899
Emergency Response System, Activities, Heat,
Water, Garage None
1 Facility would not share pricing information. This information is from a previous study.
51
PROFILE OF MARKET RATE INDEPENDENT AND CONGREGATE HOUSING IN THE GREATER FARGO MOORHEAD MARKET AREA
EVENTIDE SENIOR LIVING COMMUNITIES, MOORHEAD, MINNESOTA FEBRUARY 2013 (PAGE 4 OF 4)
Facility Capacity
Percent Occupied on
the Day Contacted
Year Built Type of Room Available Monthly Fees
Services/Amenities included in Rent
Package
Services/Amenities Available for
Purchase through building
Farmstead Estates 3433 South 28th Street Moorhead, MN 56560
48 N/A 2010 2 Bedroom
(1,200 s.f.) $1,435 Utilities and a Garage Home Health Care
Through Third Party Home Care Agency
Cooperative Living Center 1424 14th Street East West Fargo, ND 58078
48 (24 rental) (24 condo purchase)
N/A 1985
1 Bedroom (650 s.f.)
2 Bedroom (890 s.f.)
Rental: 1 Bedroom: $835 2 Bedroom: $910
Purchase: $83,000
+ Monthly Fee:
$213
Condo: Attached Garage, Heat,
Water, Sewer, Trash
Rental: Heat, Water, Sewer,
Trash
Rental: Garage: $30/Month
TOTAL 750 90.4%1 (207/229)
Source: North Dakota Department of Health, North Dakota Department of Human Services, Aging Services of Minnesota, Care Providers of Minnesota, Minnesota Department of Health, Minnesota Department of Human Services, U.S. Department of Health and Human Services, and information provided by facility to HP&MR in telephone interviews.
1 Total overall occupancy information only includes those facilities that were willing or able to share occupancy information or were not in an initial fill-up period.