Embed Size (px)
Citation preview
Annual Report and Financial Statementsfor the year ended 31 December 2013
MarkelSyndicate3000

Contents
Directors and administration 2
Report of the Directors of the Managing Agent 3
Statement of Managing Agent’s responsibilities 10
Independent Auditor’s report 11
Profit and Loss Account: Technical Account 12
Profit and Loss Account: Non-Technical Account 13
Statement of Total Recognised Gains and Losses 14
Balance Sheet: Assets 15
Balance Sheet: Liabilities 16
Statement of cash flows 17
Notes to the Financial Statements 19
Markel Syndicate 3000Annual Report and Financial Statements for the year ended 31 December 2013
2 Annual Report and Financial Statements for the year ended 31 December 2013 Syndicate 3000
Directors and administration
Managing AgentMarkel Syndicate Management Limited
Board of DirectorsIan Marshall (Chairman) Jeremy W Brazil Stephen M Carroll Andrew J Davies Paul H Jenks Nicholas J S Line Ralph C Snedden William D Stovin Anne Whitaker (Appointed 23 October 2013)
Company SecretaryAndrew J Bailey
Managing Agent’s registered officeThe Markel Building 49 Leadenhall Street London EC3A 2EA
Managing Agent’s registered number3114590
Syndicate3000
Active UnderwriterJeremy W Brazil
BankersBank of New York Barclays Bank Citibank N.A. Royal Bank of Canada Royal Trust
Investment ManagersMarkel Gayner Asset Management Corporation
Registered AuditorKPMG LLP, London
LawyersNorton Rose, London
2

3Syndicate 3000 Annual Report and Financial Statements for the year ended 31 December 2013
Report of the Directors of the Managing Agent
The Directors of the Managing Agent submit the Annual Report and Financial Statements of Syndicate 3000 for the year ended 31 December 2013. These are prepared using the annual basis of accounting as required by Statutory Instrument No 1950 of 2008, the Insurance Accounts Directive (Lloyd’s Syndicate and Aggregate Accounts) Regulations 2008 (“the 2008 Regulations”).
Review of the businessMarkel Syndicate 3000 (“the Syndicate”) is the Lloyd’s platform for Markel International. Markel International also writes business through Markel International Insurance Company Limited (“the Company”).
The principal activity of the Syndicate remains the transaction of general insurance and reinsurance business from its offices in London and its overseas operations in Canada, Sweden, Singapore, Labuan and Hong Kong.
In May 2013, Markel Corporation acquired Alterra Capital, the Bermuda headquartered global underwriter of specialty insurance and reinsurance, which has operating platforms in Bermuda, Ireland, Europe, United States, Lloyd’s and Latin America. From 2014, certain lines of the business currently transacted through it’s Lloyd’s Syndicate, Syndicate 1400, will be written by Markel Syndicate 3000.
Business profile and divisionsThe Syndicate operates five underwriting divisions, namely Marine and Energy, Professional Liability, Specialty, Equine and Trade Credit. In addition, Markel has a wholly-owned Canadian subsidiary, Elliott Special Risks (ESR), which underwrites on behalf of the Syndicate.
The Syndicate’s Singapore office operates as a regional hub, supporting the Labuan and Hong Kong offices and underwrites marine and energy, professional and financial and trade credit risks throughout the Asia Pacific region.
In 2014, the Syndicate will operate three new underwriting divisions following the Alterra at Lloyd’s Limited acquisition, namely Casualty Treaty, Zurich and Latin America.
Marine and EnergyThe Marine and Energy division underwrites a portfolio of coverages for cargo, energy, hull, liability, terrorism, war and specie risks through offices based in London, Singapore and Stockholm. The cargo account is an international transit-based book covering many types of cargo. The energy account includes all aspects of oil and gas activities. The hull account covers physical damage to ocean-going tonnage, yachts, building risks and mortgagee’s interest. The liability account provides coverage for a broad range of energy liabilities, as well as traditional marine exposures including charterers, terminal operators and ship repairers. The terrorism account covers full political violence (including war and civil war) for property and business interruption. The war account covers the hulls of ships and aircraft, and other related interests, against war and associated perils, including piracy. The specie account includes coverage for fine art on exhibit and in private collections, securities, bullion, precious metals, cash in transit and jewellery.
Professional LiabilityThe Professional Liability division underwrites professional indemnity, directors’ and officers’ liability and general liability coverages. The professional indemnity account offers unique solutions in four main professional classes, miscellaneous professionals and consultants, construction professionals, financial service professionals and professional practices. The miscellaneous professionals and consultants class includes coverages for a wide range of professionals including management consultants, publishers, broadcasters, pension trustees and public officials. The construction class includes coverages for surveyors, engineers, architects and estate agents. The financial services class includes coverages for insurance brokers, insurance agents, financial consultants, stockbrokers, fund managers, venture capitalists and bankers. The professional practices class includes coverages for accountants and solicitors. The Professional Liability division writes business on a worldwide basis, limiting exposure in the United States.

4 Annual Report and Financial Statements for the year ended 31 December 2013 Syndicate 3000
SpecialtyThe Specialty division provides property treaty reinsurance on an excess of loss and proportional basis for per risk and catastrophe exposures. A significant portion of the division’s excess of loss catastrophe and per risk treaty business comes from the United States with the remainder coming from international property treaties. The Specialty division also offers direct coverage for a number of specialist classes including contingency, property open market, accident and health and other special risks. The division also provides casualty treaty reinsurance business, mainly in respect of niche motor products in the UK.
EquineThe Equine division writes equine and livestock products on a worldwide basis. The equine account provides coverage for risks of mortality, theft, infertility and specified perils for insureds ranging in size from large stud farms to private horse owners. The livestock account provides coverage for farms, zoos and animals in transit.
Trade CreditThe Trade Credit division writes short-term trade credit coverage for commercial risks, including insolvency, protracted default and contract frustration. Political risks are covered in conjunction with commercial risks for currency inconvertibility, government action, import/export license cancellation, public buyer default and war. Products include coverages for captive reinsurance, trade receivables securitisation, vendor financing, pre-credit/work in progress, anticipatory credit, factoring and contract replacement. Policy structures are on an excess of loss basis or ground up for specific or named buyer risks.
ESRESR underwrites a diverse portfolio of property and casualty coverages for Canadian domiciled insureds. ESR provides primary general liability, products liability, excess and umbrella, environmental liability and property coverages. ESR also writes professional indemnity, directors’ and officers’ and equine products.
Results and performanceThe results for the year, as set out on pages 12 - 13 show a profit of £53.0m (2012, profit of £59.7m).
The underwriting profit of £35.2m in 2013 (2012, £23.6m profit) benefited from benign large loss and catastrophe activity during the year. In 2012, Hurricane Sandy contributed underwriting losses of £25.3m net of reinsurance, representing 7.8 points on the combined ratio. The result included a release from prior year reserves of £35.3m (2012, £43.2m release). This release is a result of the Markel strategy to reserve prudently together with the work of our claims department in dealing with claims in an expeditious manner.
The investment return was £17.8m (2012, £36.1m) generating a yield of 2.6% (2012, 5.3% on the investment portfolio).
The overall profit of £53.0m (2012, profit of £59.7m) reflects the excellent underwriting performance and very solid investment return.


6 Annual Report and Financial Statements for the year ended 31 December 2013 Syndicate 3000
Key Performance Indicators
Annual Accounting Data Profit and Loss Account
2009 £’m
2010 £’m
2011 £’m
2012 £’m
2013 £’m
Gross written premiums 274.9 315.8 352.4 386.1 369.2
Net written premiums 237.6 268.6 303.8 326.2 314.6
Retention rate 86.4% 85.1% 86.2% 84.5% 85.2%
Net earned premiums 233.6 243.5 292.6 325.8 312.5
Net underwriting result 20.5 (8.4) (53.8) 23.6 35.2
Loss & LAE ratio 52.8% 66.5% 79.3% 51.6% 49.8%
Expense ratio 38.4% 37.0% 39.1% 41.2% 38.9%
Combined ratio 91.2% 103.5% 118.4% 92.8% 88.7%
Investment return 48.6 36.4 43.1 36.1 17.8
Investment yield 7.9% 5.8% 6.5% 5.3% 2.6%
Profit/(loss) 69.1 28.0 (10.6) 59.7 53.0
Balance Sheet2009
£’m2010
£’m2011
£’m 2012
£’m2013
£’m
Financial investments and cash 622.2 657.6 680.2 674.5 643.4
Gross claims outstanding 744.9 764.7 840.7 797.0 719.9
Reinsurers’ share of claims outstanding 178.0 159.8 181.3 161.4 120.8
Net claims outstanding 566.9 604.9 659.4 635.6 599.1
Three Year Accounting Data2009
£’m2010
£’m2011
£’m 2012
£’m2013
£’m
Syndicate Capacity 170.0 300.0 340.0 340.0 340.0
Underwriting result 15.7 (13.6) (3.2)
Investment result 37.6 38.5 24.8
Result on closure 53.3 24.9 21.6
Forecast return at 12 months 20.0% 7.5% (5.0%) 2.5% 10.0%
Forecast return at 24 months 10.0% (7.5%) 2.5% 12.5%
Return on capacity at closure 31.4% 8.3% 6.4%
7Syndicate 3000 Annual Report and Financial Statements for the year ended 31 December 2013
The key highlights of the afore-mentioned performance indicators are as follows:
• Underwriting Profits of £17.1m over the period 2009 – 2013, generating an average combined ratio of 98.8%. The 2010, 2011 and 2012 years experienced natural catastrophe losses of £76.9m. Excluding these natural catastrophe losses there was an underwriting profit of £94.0m, generating an average combined ratio of 93.3%.
• Profit of £199.2m over the period 2009 – 2013 through excellent investment returns which in turn offset the natural catastrophe losses.
• A decrease in financial investments during 2013 reflects the distribution of the 2010 year of account profit, expense payments and foreign exchange losses; partially offset by strong underwriting cashflows and investment value appreciation.
• The reduction in reinsurers’ share of claims outstanding during 2013 was primarily due to the settlement of claims and proactive collection of resinsurance recoveries.
• An average return on capacity of 20.1% for the 2002-2011 closed years of account.
Business environment and future prospects With disciplined underwriting and a strong balance sheet the Syndicate is in an excellent position to capitalise on opportunities as they arise. The Syndicate will continue to apply Markel’s underwriting discipline of underwriting for profit rather than volume and, accordingly, will decline business where the rates are not acceptable.
The Syndicate will continue to look to develop new lines of business and markets, within the parameters of the overall underwriting strategy.
The Syndicate invests in high-quality corporate, government and municipal bonds as well as a diverse equity portfolio and plans to continue this investment strategy in 2014.
Following the acquisition of Alterra at Lloyd’s Limited, the Syndicate’s capacity was increased to £500m for the 2014 year of account. For the 2014 year of account, the Syndicate will operate three new underwriting divisions: Casualty Treaty, Zurich and Latin America.
Principal risks and uncertaintiesMarkel International Limited has a risk register detailing the risks to which it is exposed, which includes all business underwritten by Syndicate 3000. Risks are grouped under the following categories:
• Underwriting
• Reserving risk
• Market risk
• Credit risk
• Operational risk
There are currently 24 risks in the risk register. A formal review by the Risk Committee and the Board occurs at least annually to ensure that the risk register identifies all the risks to which Markel International is exposed. Key controls are identified to mitigate each risk and quarterly confirmation is sought from the owners of these controls that they are in place and are operating effectively.
Our Risk Committee meets quarterly to consider Key Risk Indicators and any Risk issues that have arisen. These are summarised in the Director of Risk Management’s quarterly report to the Board.
At least annually an Own Risk and Solvency assessment report is produced being a forward looking assessment of the risk profile and adequacy of the syndicate’s capital to meet solvency needs over the business planning time horizon.
Under Solvency II Lloyd’s is seeking internal model approval for the market and Markel Syndicate Management already meets the principles of Solvency II.
8 Annual Report and Financial Statements for the year ended 31 December 2013 Syndicate 3000
DirectorsThe Directors of the Managing Agent who served during 2013 and up to the date of this report were as follows:
Ian Marshall (Chairman) Jeremy W Brazil Stephen M Carroll Andrew J Davies Paul H Jenks Nicholas J S Line Ralph C Snedden William D Stovin Anne Whitaker (Appointed 23 October 2013)
Markel maintains liability insurance cover on behalf of the Directors and named officers of the Managing Agent.
Syndicate 3000 is supported 100% by Markel Capital Limited and therefore no Director has any participation.
Corporate governanceMarkel Syndicate Management Limited (“MSM”), the Lloyd’s Managing Agent of Syndicate 3000, is authorised by the Prudential Regulation Authority (“PRA”). The Board includes three non-executive Directors and meets at least quarterly. Sub-committees of the board include the Audit Committee, Risk Committee, Internal Audit Committee and the Delegated Underwriting Committee.
Financial instruments and risk managementInformation on the use of financial instruments by the Group and its management of financial risk is disclosed in note 3 of these financial statements. In particular the Syndicate’s exposures to price risk, credit risk and liquidity risk are separately disclosed in that note. The Syndicate’s exposure to cash flow risk is addressed under the headings of ‘Market risk’, ‘Credit risk’ and ‘Liquidity risk’.
Carbon policyAs set out in the “Markel Style”, the Syndicate has a commitment to its communities, which we recognise includes environmental responsibilities. Our goal is to minimise our environmental impact whilst still adhering to our other principles as expressed in the Markel Style and our company profile.
Through the development of best practices in our business, we aim to use no more consumables than are necessary and recycle the maximum of those we do use. We also believe that embedding environmental awareness throughout the organisation will be best achieved through a continuous program of employee education.

9Syndicate 3000 Annual Report and Financial Statements for the year ended 31 December 2013
Disclosure of information to the AuditorThe Directors of the Managing Agent who held office at the date of approval of this Managing Agent’s report confirm that, so far as they are each aware, there is no relevant audit information of which the Syndicate’s Auditor is unaware; and each Director has taken all the steps that they ought to have taken as a Director to make themselves aware of any relevant audit information and to establish that the Syndicate’s Auditor is aware of that information.
AuditorDuring the year, KPMG Audit Plc resigned as auditors and were reappointed as KPMG LLP, pursuant to Section 487 of the Companies Act 2006.
Annual general meetingAs permitted under the Syndicate Meetings (Amendment No 1) Byelaw (No 18 of 2000) the sole corporate member has agreed that we will not hold an annual general meeting for the Syndicate.
By order of the Board,
Andrew J Davies Director London,
05 March 2014

10 Annual Report and Financial Statements for the year ended 31 December 2013 Syndicate 300010 Annual Report and Financial Statements for the year ended 31 December 2013 Syndicate 3000
Statement of Managing Agent’s responsibilities
The Managing Agent is responsible for preparing the Syndicate annual Financial Statements in accordance with applicable law and regulations.
The Insurance Accounts Directive (Lloyd’s Syndicate and Aggregate Accounts) Regulations 2008 require the Managing Agent to prepare Syndicate annual Financial Statements at 31 December each year in accordance with UK accounting standards and applicable law (UK Generally Accepted Accounting Practice). The annual Financial Statements are required by law to give a true and fair view of the state of aff airs of the Syndicate as at that date and of its profi t or loss for that year.
In preparing those Syndicate annual Financial Statements, the Managing Agent is required to:
• select suitable accounting policies which are applied consistently, subject to changes arising on the adoption of new accounting standards in the year;
• make judgements and estimates that are reasonable and prudent;
• state whether applicable accounting standards have been followed, subject to any material departures disclosed and explained in the annual Financial Statements; and
• prepare the annual Financial Statements on the basis that the Syndicate will continue to write future business unless it is inappropriate to presume the Syndicate will do so.
The Managing Agent is responsible for keeping proper accounting records, which disclose with reasonable accuracy at any time the fi nancial position of the Syndicate and enable it to ensure that the Syndicate annual Financial Statements comply with the 2008 Regulations. It is also responsible for safeguarding the assets of the Syndicate and hence for taking reasonable steps for prevention and detection of fraud and other irregularities.
The Managing Agent is responsible for the maintenance and integrity of the corporate and fi nancial information included on the Company’s website. Legislation in the UK governing the preparation and dissemination of Financial Statements may diff er from legislation in other jurisdictions.
The Managing Agents confi rm that they have complied with the above requirements in preparing the annual Financial Statements of Syndicate 3000.
By order of the Board,
Andrew J BaileySecretaryLondon,
05 March 2014

11Syndicate 3000 Annual Report and Financial Statements for the year ended 31 December 2013
Independent Auditor’s report to the Member of Syndicate 3000
We have audited the Syndicate 3000 annual accounts for the year ended 31 December 2013, as set out on pages 12 to 28.
The financial reporting framework that has been applied in their preparation is applicable law and UK Accounting Standards (UK Generally Accepted Accounting Practice).
This report is made solely to the member of the Syndicate, as a body, in accordance with the Insurance Accounts Directive (Lloyd’s Syndicate and Aggregate Accounts) Regulations 2008. Our audit work has been undertaken so that we might state to the Syndicate’s Member those matters we are required to state to them in an Auditor’s report and for no other purpose. To the fullest extent permitted by law, we do not accept or assume responsibility to anyone other than the Syndicate’s Member as a body for our audit work, for this report, or for the opinions we have formed.
Respective responsibilities of Managing Agent and the Auditor As explained more fully in the Statement of Managing Agent’s Responsibilities set out on page 10, the Managing Agent is responsible for the preparation of the Syndicate annual accounts which give a true and fair view. Our responsibility is to audit, and express an opinion on, the Syndicate annual accounts in accordance with applicable law and International Standards on Auditing (UK and Ireland). Those standards require us to comply with the Auditing Practices Board’s Ethical Standards for Auditors.
Scope of the audit of the Syndicate Annual Accounts A description of the scope of an audit of accounts is provided on the Financial Reporting Council’s website at www.frc.org.uk/auditscopeukprivate.
Opinion on Syndicate Annual Accounts In our opinion the Annual Accounts:
• give a true and fair view of the Syndicate’s affairs as at 31 December 2013 and of its profit for the year then ended;
• have been properly prepared in accordance with UK Generally Accepted Accounting Practice; and
• have been prepared in accordance with the requirements of the Insurance Accounts Directive (Lloyd’s Syndicate and Aggregate Accounts) Regulations 2008.
Opinion on other matters prescribed by the Insurance Accounts Directive (Lloyd’s Syndicate and Aggregate Accounts) Regulations 2008 In our opinion the information given in the Managing Agent’s Report for the financial year in which the annual accounts are prepared is consistent with the annual accounts.
Matters on which we are required to report by exception We have nothing to report in respect of the following matters where the Insurance Accounts Directive (Lloyd’s Syndicate and Aggregate Accounts) Regulations 2008 require us to report to you if, in our opinion:
• the Managing Agent in respect of the Syndicate has not kept adequate accounting records; or
• the Syndicate annual accounts are not in agreement with the accounting records; or
• we have not received all the information and explanations we require for our audit.
Ben Priestley (Senior Statutory Auditor) for and on behalf of KPMG LLP, Statutory Auditor Chartered Accountants 15 Canada Square Canary Wharf London E14 5GL
05 March 2014

12 Annual Report and Financial Statements for the year ended 31 December 2013 Syndicate 3000
Profit and Loss Account: Technical Account
2013 2012Notes £’000 £’000 £’000 £’000
Earned premiums, net of reinsurance
Gross written premiums 4 369,241 386,072
Outward reinsurance premiums (54,658) (59,900)
Net written premiums 314,583 326,172
Change in the gross provision for unearned premiums 18 (3,193) (835)
Change in the provision for unearned premiums, reinsurers’ share 18 1,137 453
Change in the provision for net unearned premiums (2,056) (382)
Net earned premiums 312,527 325,790
Allocated investment return transferred from the non-technical account 9 17,803 36,141
Claims incurred, net of reinsurance
Claims paid
Gross amount (224,122) (220,220)
Reinsurers’ share 43,039 49,039
Net paid claims (180,141) (171,181)
Change in the provision for claims
Gross amount 18 63,282 17,587
Reinsurers’ share 18 (38,891) (14,272)
Net change in provision 24,391 (3,315)
Net claims incurred (155,750) (167,866)
Net operating expenses 6 (121,619) (134,362)
Balance on the technical account 52,961 59,703
All operations relate to continuing business.
The notes on pages 19 to 28 form part of these Financial Statements.

13Syndicate 3000 Annual Report and Financial Statements for the year ended 31 December 2013
Profit and Loss Account: Non-Technical Account
Notes2013
£’0002012
£’000
Balance on the technical account 52,961 59,703
Investment income 7 31,858 35,107
Unrealised gains on investments 11,840 19,156
Investment expenses and charges 8 (2,820) (5,099)
Unrealised losses on investments (23,075) (13,023)
Allocated investment return transferred to technical account 9 (17,803) (36,141)
Profit for the financial year 52,961 59,703
All operations relate to continuing business.
In accordance with the amendment to FRS3 published in June 1999, no note of historical cost profits and losses has been prepared as the Syndicate’s only material gains and losses on assets relate to the holding and disposal of investments.
The notes on pages 19 to 28 form part of these Financial Statements.

14 Annual Report and Financial Statements for the year ended 31 December 2013 Syndicate 3000
Statement of Total Recognised Gains and Losses
2013 £’000
2012 £’000
Profit for the financial year 52,961 59,703
Net foreign exchange revaluation (losses)/gains (4,524) 2,527
Total recognised gains 48,437 62,230
The notes on pages 19 to 28 form part of these Financial Statements.

15Syndicate 3000 Annual Report and Financial Statements for the year ended 31 December 2013
Balance Sheet: Assets as at 31 December 2013
2013 2012Notes £’000 £’000 £’000 £’000
Investments
Financial investments 14 600,105 637,168
Reinsurers’ share of technical provisions
Provisions for unearned premiums 18 12,350 11,664
Claims outstanding 18 120,849 161,389
133,199 173,053
Debtors
Debtors arising out of direct insurance operations 15 21,637 22,806
Debtors arising out of reinsurance operations 15 30,269 20,318
Other debtors 16 4,376 4,242
56,282 47,366
Cash at bank 43,333 37,307
Prepayments and accrued income
Accrued interest 4,983 5,548
Deferred acquisition costs 26,509 27,394
31,492 32,942
Total Assets 864,411 927,836
The notes on pages 19 to 28 form part of these annual Financial Statements.
16 Annual Report and Financial Statements for the year ended 31 December 2013 Syndicate 3000
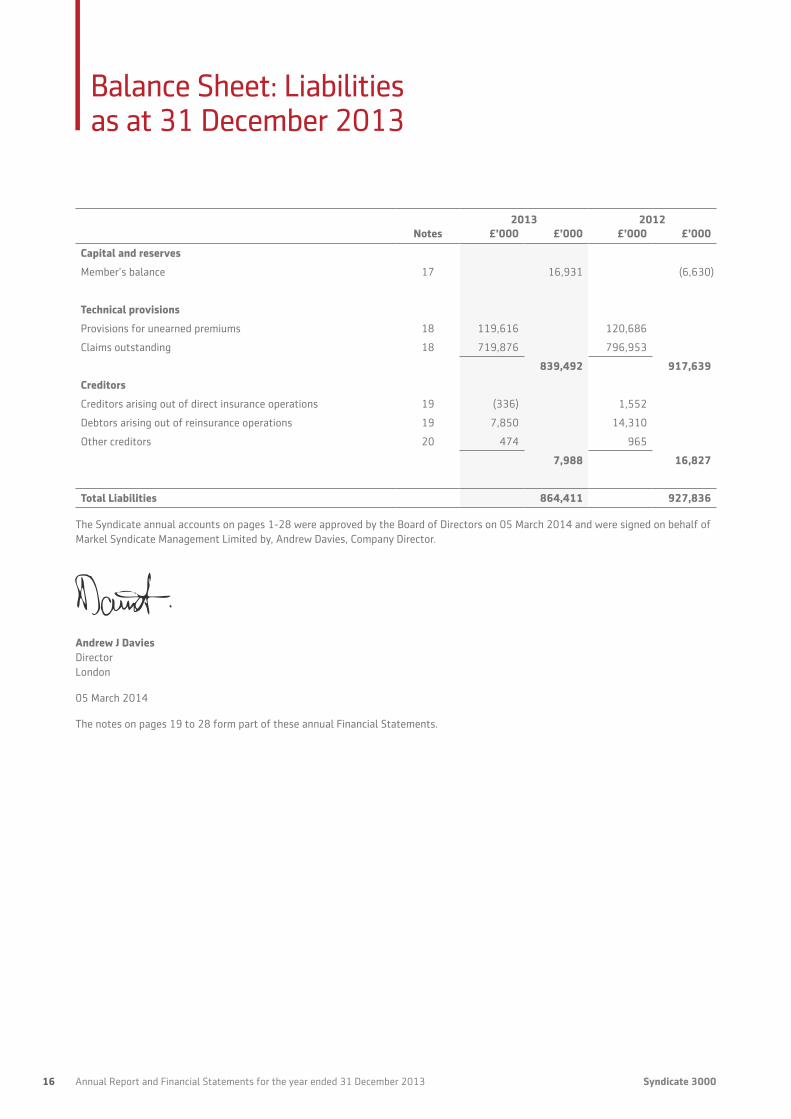
Balance Sheet: Liabilities as at 31 December 2013
2013 2012Notes £’000 £’000 £’000 £’000
Capital and reserves
Member’s balance 17 16,931 (6,630)
Technical provisions
Provisions for unearned premiums 18 119,616 120,686
Claims outstanding 18 719,876 796,953
839,492 917,639
Creditors
Creditors arising out of direct insurance operations 19 (336) 1,552
Debtors arising out of reinsurance operations 19 7,850 14,310
Other creditors 20 474 965
7,988 16,827
Total Liabilities 864,411 927,836
The Syndicate annual accounts on pages 1-28 were approved by the Board of Directors on 05 March 2014 and were signed on behalf of Markel Syndicate Management Limited by, Andrew Davies, Company Director.
Andrew J Davies Director London
05 March 2014
The notes on pages 19 to 28 form part of these annual Financial Statements.

17Syndicate 3000 Annual Report and Financial Statements for the year ended 31 December 2013
Statement of cash flows
Notes2013
£’0002012
£’000
Reconciliation of operating profit/(loss) to net cash inflow from operating activities
Operating profit on ordinary activities 52,961 59,703
Net unrealised investment gains including foreign exchange 28,687 13,734
Decrease in net technical provisions (38,293) (27,153)
Foreign exchange movement on balance due to Member (4,524) 2,526
(Increase)/decrease in debtors, prepayments and accrued income (7,466) 11,842
(Decrease)/increase in creditors, accruals and deferred income (8.839) 679
Net cash inflow from operating activities 22,526 61,331
Transfer to the Member in respect of underwriting participation (24,876) (53,300)
Net investment of cash flows (2,350) 8,031
Cash flows were invested as follows:
Increase in cash holdings 6,310 17,066
Decrease in portfolio investments (8,660) (9,035)
Net investment of cash flows 21 (2,350) 8,031
The notes on pages 19 to 28 form part of these annual Financial Statements.

19Syndicate 3000 Annual Report and Financial Statements for the year ended 31 December 2013
Notes to the Financial Statements
1 Basis of preparationThese Financial Statements have been prepared in accordance with the Insurance Accounts Directive (Lloyd’s Syndicate and Aggregate Accounts) Regulations 2008 and applicable Accounting Standards in the United Kingdom, and comply with the Statement of Recommended Practice on Accounting for Insurance Business issued by the Association of British Insurers in December 2006.
2 Accounting policiesThe following principal accounting policies have been applied consistently in dealing with items which are considered material in relation to the Syndicate’s annual accounts.
a) Underwriting result
The underwriting result is determined using an annual basis of accounting, whereby the incurred cost of claims, commission and expenses are charged against the earned proportion of premiums, net of reinsurance, as follows:
i) Written premiums relate to business incepted during the year, together with any difference between booked premiums for prior years and those previously accrued, and include estimates of premiums not yet due or notified (pipeline premium). Premiums are shown gross of brokerage payable and exclude taxes and duties levied on them.
ii) Unearned premiums represent the proportion of premiums written in the year that relates to unexpired terms of policies in force at the balance sheet date, calculated on the basis of established earnings patterns or time apportionment as appropriate. In the opinion of the Directors, the resulting provision is not materially different from one based on the pattern of incidence of risk.
iii) Outwards reinsurance premiums are accounted for in the same accounting period as the premiums for the related direct or inwards business being reinsured.
iv) Acquisition costs, which represent commission and other expenses related to the production of business, are deferred and amortised over the period in which the related premiums are earned.
v) A provision for unexpired risks is made where claims, related expenses and deferred acquisition costs likely to arise after the end of the financial year in respect of contracts concluded before that date were expected to exceed the unearned premiums receivable under these contracts. Provision for unexpired risks is calculated separately by class and excludes any allowance for investment income. Unexpired risk surplus and deficits are offset where, in the opinion of the Directors, the business classes concerned are managed together. In such cases a provision for unexpired risks is made only where there is an aggregate deficit.
vi) Claims incurred comprise claims and claims handling expenses paid in the year and the change in provisions for outstanding claims, including provisions for claims incurred but not reported and claims handling expenses. The adequacy of the outstanding claims provisions is assessed by reference to projections of the ultimate development of claims in respect of each underwriting year. Management continually attempts to improve its loss estimation process by refining its ability to analyse loss development patterns, claims payments and other information, but many reasons remain for potential adverse development of estimated ultimate liabilities. The process of estimating loss reserves is a difficult and complex exercise involving many variables and subjective judgements. As part of the reserving process, historical data is reviewed and the impact of various factors such as trends in claim frequency and severity, changes in operations, emerging economic and social trends, inflation and changes in regulatory and litigation environments is considered. Significant delays occur in notifying certain claims and a large measure of experience and judgement is involved in assessing outstanding liabilities, the ultimate cost of which cannot be known with certainty at the balance sheet date. The reserve for unpaid losses and loss adjustment expenses is determined on the basis of information currently available. However, it is inherent in the nature of the business written that the ultimate liabilities may vary as a result of subsequent development.

20 Annual Report and Financial Statements for the year ended 31 December 2013 Syndicate 3000
The two most critical assumptions as regards these claims provisions are that the past is a reasonable predictor of the likely level of claims development and that the models used for current business are fair reflections of the likely level of ultimate claims to be incurred. However, the Directors believe the process of evaluating past experience, adjusted for the effects of current developments and anticipated trends, is an appropriate basis for predicting future events. Management currently believes the Syndicate’s gross and net reserves, are adequate. There is no precise method, however, for evaluating the impact of any significant factor on the adequacy of reserves, and actual results are likely to differ from original estimates.
vii) Underwriting acquisition costs, general overheads and other expenses are charged as incurred to the technical profit and loss account, net of the change in deferred acquisition costs. Deferred acquisition costs represent the proportion of acquisition costs incurred, which corresponds to the unearned premiums provision.
b) Investment return
Investment income comprises interest and dividends receivable for the year before investment expenses. Dividends receivable are stated after adding back any withholding taxation deducted at source. Investment expenses are charged to the profit and loss account on an incurred basis.
Realised gains or losses represent the difference between net sales proceeds and purchase price. Unrealised gains and losses on investments represent the difference between the current value of investments at the balance sheet date and their purchase price. The movement in unrealised investment gains/losses includes an adjustment for previously recognised unrealised gains/losses on investments disposed of in the accounting period.
The investment return is initially recorded in the non-technical account. A transfer is made from the non-technical account to the general business technical account to reflect the investment return on funds supporting underwriting business.
c) Investments
Listed investments are stated at market value, based on bid price and deposits with credit institutions are stated at cost.
d) Foreign currencies translation
Transactions in US dollars, Canadian dollars, Australian dollars and Euros are translated at the average rates of exchange for the period. Underwriting transactions denominated in other foreign currencies are included at the rate of exchange ruling at the date the transaction is processed.
Monetary and non-monetary assets and liabilities denominated in foreign currencies are translated at the rate of exchange at the balance sheet date or if appropriate at the forward contract rate.
US dollars, Canadian dollars, Australian dollars and Euros are treated as “branches” under SSAP 20 and the exchange differences arising on the retranslation of the opening balance sheet and the profit and loss account to the closing rate of exchange are included in the statement of total recognised gains and losses. All other exchange differences are reported in the profit and loss account.
e) Taxation
Under Schedule 19 of the Finance Act 1993 Managing Agent’s are not required to deduct basic rate income tax from trading income. In addition, all UK basic rate income tax deducted from Syndicate investment income is recoverable by Managing Agents and consequently the distribution made to the Member. Capital appreciation falls within trading income and is also distributed gross of tax.
No provision has been made for any United States or Canadian Federal Income Tax payable on underwriting results or investment earnings. Any payments on account made by the Syndicate during the year are included in the balance sheet under the heading ‘other debtors’.
No provision has been made for any overseas tax payable by the Member on underwriting results.
f) Pension costs
Markel Syndicate Management Limited participates in the Group’s defined benefit and defined contribution schemes. Pension contributions relating to Syndicate staff are charged to the Syndicate and included in net operating expenses.
21Syndicate 3000 Annual Report and Financial Statements for the year ended 31 December 2013
3 Management of financial risk Financial risk management objectives
The Syndicate is exposed to financial risks primarily through its financial assets, reinsurance assets and policyholder liabilities. The Syndicate’s risk management process is controlled using a risk register. Solvency II principles are used to manage the Syndicate’s capital requirements and to ensure that it has the financial strength to support the growth of the business and meet the requirements of policyholders, regulators and rating agencies. The key financial risks assessed are market risk, credit risk and liquidity risk.
a) Market risk
Market risk is the risk that the Syndicate suffers loss from volatility or over concentration in its investment portfolio or due to currency mismatch between assets and liabilities. The Syndicate’s investment manager, Markel Gayner Asset Management Corporation (MGAM) produces a quarterly Investment Report and in conjunction with the Syndicate, produces a Board report to explain movements in the investment mix, performance against benchmark indices and any changes in investment strategy. The principal market risks and how exposure to these risks is managed are as follows:
• Interest rate risk: The Syndicate works to manage the impact of interest rate fluctuations on the fixed maturity portfolio. The effective duration of the fixed maturity profile is managed with consideration given to the estimated duration of policyholder liabilities.
• Foreign Exchange risk: Foreign Exchange Risk is managed primarily by matching assets and liabilities in each foreign currency as closely as possible. To assist in the matching of assets and liabilities in foreign currencies the Syndicate may purchase foreign exchange forward contracts or buy and sell foreign currencies in the open market. No foreign exchange forward contracts have been entered into during the year.
• Equity Price risk: The Syndicate sets limits on the amount of equities that can be held with any one issuer. The overall equity portfolio is also monitored to ensure that equity risk does not exceed the Syndicate’s risk appetite.
b) Credit risk
Credit risk is the risk that a counterparty will be unable to pay amounts in full when they fall due. Key areas where the Syndicate is exposed to credit risk are:
• Reinsurance recoverable’s
• Amounts due from insurance intermediaries
• Amounts due from insurance contract holders
• Amounts due from corporate bond issuers
The Syndicate’s fixed maturity portfolio is monitored to ensure credit risk does not exceed the Syndicate’s risk appetite. In addition, the Syndicate places limits on exposures to a single counterparty or concentrations of exposures to a specific counterparty. At least 95% of the Syndicate’s fixed maturity portfolio is rated ‘A’ or better. The Syndicate takes a proactive approach to the collection of reinsurance recoveries, including the pursuit of commutations. New reinsurers may be required to post collateral depending on their size, rating and potential debt to the Syndicate. If a reinsurer is not willing to post collateral then their line size is reduced to an acceptable level in accordance with their applicable rating and capital level.
c) Liquidity risk
Liquidity risk is the risk that cash may not be available to pay obligations when due at a reasonable cost, primarily claims to policyholders. The Syndicate monitors the projected settlement of liabilities and, in conjunction with MGAM, sets guidelines on the composition of the portfolio in order to manage this risk.
22 Annual Report and Financial Statements for the year ended 31 December 2013 Syndicate 3000
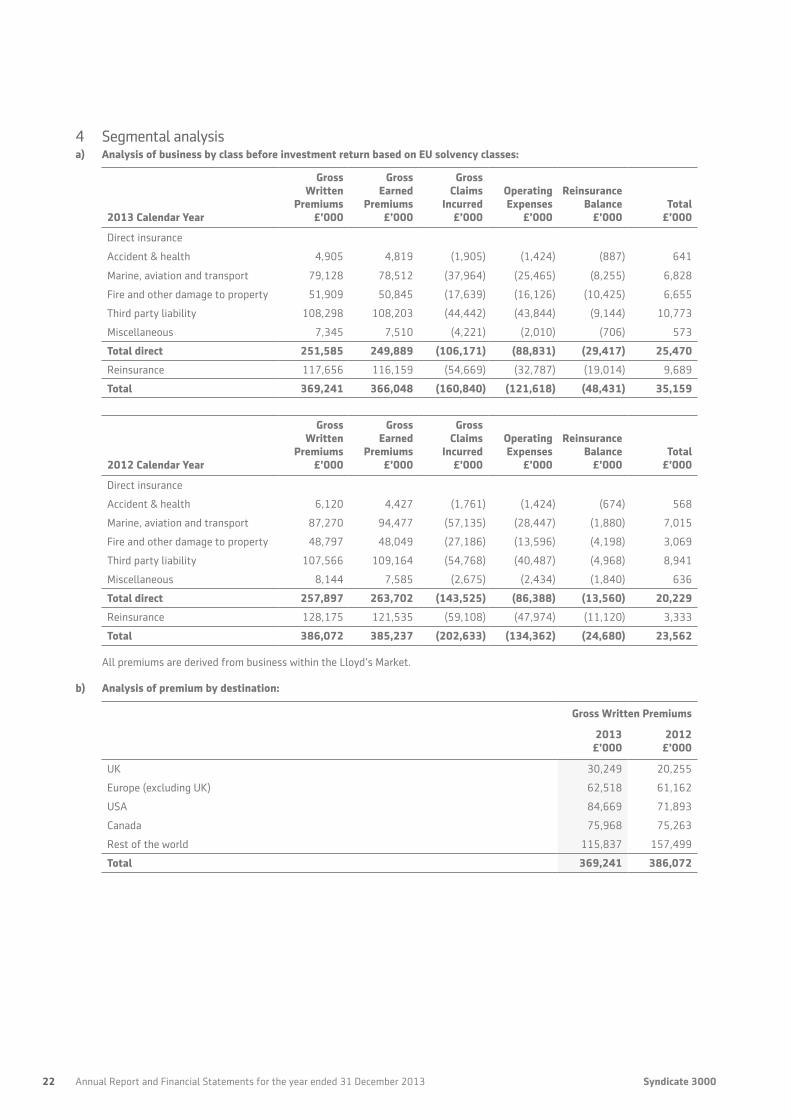
4 Segmental analysisa) Analysis of business by class before investment return based on EU solvency classes:
2013 Calendar Year
Gross Written
Premiums £’000
Gross Earned
Premiums £’000
Gross Claims
Incurred £’000
Operating Expenses
£’000
Reinsurance Balance
£’000Total
£’000
Direct insurance
Accident & health 4,905 4,819 (1,905) (1,424) (887) 641
Marine, aviation and transport 79,128 78,512 (37,964) (25,465) (8,255) 6,828
Fire and other damage to property 51,909 50,845 (17,639) (16,126) (10,425) 6,655
Third party liability 108,298 108,203 (44,442) (43,844) (9,144) 10,773
Miscellaneous 7,345 7,510 (4,221) (2,010) (706) 573
Total direct 251,585 249,889 (106,171) (88,831) (29,417) 25,470
Reinsurance 117,656 116,159 (54,669) (32,787) (19,014) 9,689
Total 369,241 366,048 (160,840) (121,618) (48,431) 35,159
2012 Calendar Year
Gross Written
Premiums £’000
Gross Earned
Premiums £’000
Gross Claims
Incurred £’000
Operating Expenses
£’000
Reinsurance Balance
£’000Total
£’000
Direct insurance
Accident & health 6,120 4,427 (1,761) (1,424) (674) 568
Marine, aviation and transport 87,270 94,477 (57,135) (28,447) (1,880) 7,015
Fire and other damage to property 48,797 48,049 (27,186) (13,596) (4,198) 3,069
Third party liability 107,566 109,164 (54,768) (40,487) (4,968) 8,941
Miscellaneous 8,144 7,585 (2,675) (2,434) (1,840) 636
Total direct 257,897 263,702 (143,525) (86,388) (13,560) 20,229
Reinsurance 128,175 121,535 (59,108) (47,974) (11,120) 3,333
Total 386,072 385,237 (202,633) (134,362) (24,680) 23,562
All premiums are derived from business within the Lloyd’s Market.
b) Analysis of premium by destination:
Gross Written Premiums
2013 £’000
2012 £’000
UK 30,249 20,255
Europe (excluding UK) 62,518 61,162
USA 84,669 71,893
Canada 75,968 75,263
Rest of the world 115,837 157,499
Total 369,241 386,072
23Syndicate 3000 Annual Report and Financial Statements for the year ended 31 December 2013
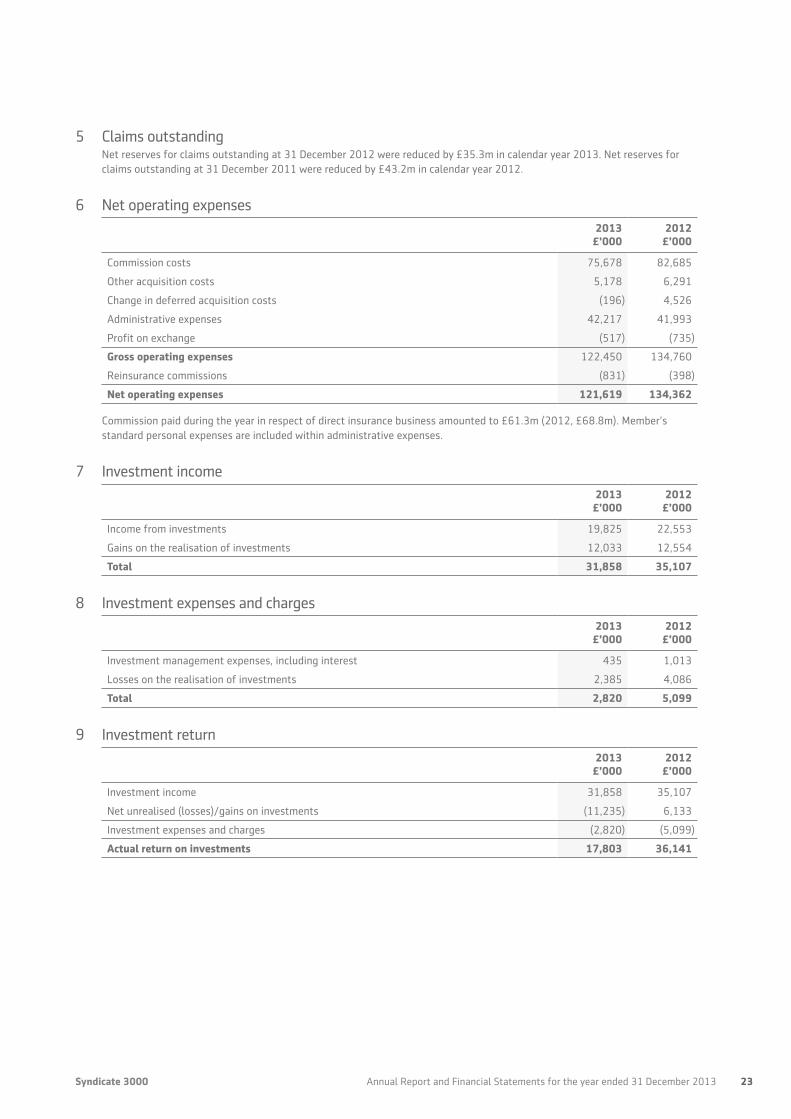
5 Claims outstandingNet reserves for claims outstanding at 31 December 2012 were reduced by £35.3m in calendar year 2013. Net reserves for claims outstanding at 31 December 2011 were reduced by £43.2m in calendar year 2012.
6 Net operating expenses2013
£’0002012
£’000
Commission costs 75,678 82,685
Other acquisition costs 5,178 6,291
Change in deferred acquisition costs (196) 4,526
Administrative expenses 42,217 41,993
Profit on exchange (517) (735)
Gross operating expenses 122,450 134,760
Reinsurance commissions (831) (398)
Net operating expenses 121,619 134,362
Commission paid during the year in respect of direct insurance business amounted to £61.3m (2012, £68.8m). Member’s standard personal expenses are included within administrative expenses.
7 Investment income2013
£’0002012
£’000
Income from investments 19,825 22,553
Gains on the realisation of investments 12,033 12,554
Total 31,858 35,107
8 Investment expenses and charges2013
£’0002012
£’000
Investment management expenses, including interest 435 1,013
Losses on the realisation of investments 2,385 4,086
Total 2,820 5,099
9 Investment return2013
£’0002012
£’000
Investment income 31,858 35,107
Net unrealised (losses)/gains on investments (11,235) 6,133
Investment expenses and charges (2,820) (5,099)
Actual return on investments 17,803 36,141

24 Annual Report and Financial Statements for the year ended 31 December 2013 Syndicate 3000
10 Rates of exchangeThe rates of exchange used for the principal foreign currency translations are as follows::
Year-End Rate 2013
Average Rate 2013
Year-End Rate 2012
Average Rate 2012
US Dollar 1.65 1.57 1.62 1.59
Canadian Dollar 1.76 1.62 1.62 1.59
Euro 1.19 1.18 1.23 1.23
Australian Dollar 1.85 1.63 1.56 1.53
11 Staff numbers and costsStaff are employed by Markel International Services Limited (“MISL”). For a full breakdown of employment costs, please refer to the MISL Annual Report and Financial Statements.
The Directors’ emoluments in the year were paid by Markel International Services Limited (“MISL”). A full disclosure of the Directors’ emoluments in the year are disclosed in the accounts of Markel International Insurance Company Ltd.
12 Auditor’s remuneration2013
£’0002012
£’000
Audit of these Financial Statements 149 124
Other services pursuant to legislation 56 56
Total Auditor’s remuneration 205 180
13 Emoluments of the active underwriterThe active underwriter received the following remuneration charged as a Syndicate expense:
2013 £’000
2012 £’000
Emoluments 464 348
14 Investments
Market Value Cost
2013 £’000
2012 £’000
2013 £’000
2012 £’000
Shares and other variable yield securities and units in unit trusts 45,520 58,412 31,793 53,116
Holdings in collective investment schemes 77,703 56,253 77,703 56,253
Debt securities and other fixed income securities 402,113 439,596 388,242 405,841
Overseas deposits 61,563 60,879 61,563 60,879
Deposits with credit institutions 13,206 22,028 13,206 22,028
Total 600,105 637,168 572,507 598,117

25Syndicate 3000 Annual Report and Financial Statements for the year ended 31 December 2013
15 Debtors arising out of direct insurance operations and reinsurance operations
Direct insurance operations Reinsurance operations
2013 £’000
2012 £’000
2012 £’000
2012 £’000
Amounts owed by intermediaries within one year 21,554 22,745 30,207 20,178
Amounts owed by intermediaries after more than one year 83 61 62 140
Total 21,637 22,806 30,269 20,318
16 Other debtors2013
£’0002012
£’000
Amounts due from group undertakings 2,148 1,404
Other debtors 2,228 2,838
Amounts due within one year 4,376 4,242
17 Reconciliation of Member’s balance2013
£’0002012
£’000
Member’s balance brought forward at 1 January (6,630) (15,560)
Profit/(loss) for the financial year 52,961 59,703
Net foreign exchange revaluation (losses)/gains (4,524) 2,527
Payments of profit to the Member’s personal reserve fund (24,876) (53,300)
Member’s balance carried forward at 31 December 16,931 (6,630)
The Member participates on the Syndicate by reference to years of account and their ultimate result. Assets and liabilities are assessed with reference to policies incepting in that year of account.
Year of Account development
Year of Account
2007 £’000
2008 £’000
2009 £’000
2010 £’000
2011 £’000
2012 £’000
2013 £’000
Profit to Member at 36 months
£’000
2006 & prior 39,009 36,678
2007 4,941 (1,022) 43,498 47,417
2008 (25,459) 25,858 34,563 34,962
2009 3,981 716 48,603 53,300
2010 (7,140) (27,154) 59,170 24,876
2011 (34,566) 28,275 27,935 21,644
2012 (25,215) 38,138
2013 (17,636)
Calendar Year Result
44,040 10,197 73,337 28,139 (13,117) 62,230 48,437
A distribution of £21.6m to the corporate member will be proposed in relation to the 2011 year of account (2012: £24.9m in relation to the 2010 year of account).

26 Annual Report and Financial Statements for the year ended 31 December 2013 Syndicate 3000
18 Technical provisions
2013 2012
Provision for claims outstandingGross £’000
Reinsurance £’000
Net £’000
Gross £’000
Reinsurance £’000
Net £’000
At 1 January 796,953 161,389 635,564 840,737 181,274 659,463
Movement in provision (63,282) (38,891) (24,391) (17,587) (14,272) (3,315)
Movement due to foreign exchange (13,795) (1,649) (12,146) (26,197) (5,613) (20,584)
Total movement in reserves (77,077) (40,540) (36,537) (43,784) (19,885) (23,899)
At 31 December 719,876 120,849 599,027 796,953 161,389 635,564
2013 2012
Provision for unearned premiumsGross £’000
Reinsurance £’000
Net £’000
Gross £’000
Reinsurance £’000
Net £’000
At 1 January 120,686 11,664 109,022 123,873 11,597 112,276
Movement in provision 3,193 1,137 2,056 835 453 382
Movement due to foreign exchange (4,263) (451) (3,812) (4,022) (386) (3,636)
Total movement in reserves (1,070) 686 (1,756) (3,187) 67 (3,254)
At 31 December 119,616 12,350 107,266 120,686 11,664 109,022
19 Creditors arising out of direct insurance operations and reinsurance operationsDirect insurance
operations Reinsurance operations
2013 £’000
2012 £’000
2013 £’000
2012 £’000
Amounts owed to intermediaries within one year (336) 1,551 7,839 14,272
Amounts owed to intermediaries after more than one year - 1 11 38
Total (336) 1,552 7,850 14,310
The debit balance within amounts owed to intermediaries within one year for 2013 results from cash paid after the closure of our underwriting system, which occurs prior to year end. This cash represents paid claims which, when the Underwriting Signing Messages (USMs) are recognised in the following period, will reduce insurance reserves and hence reduce the liabilities on the balance sheet.

27Syndicate 3000 Annual Report and Financial Statements for the year ended 31 December 2013
20 Other creditors2013
£’0002012
£’000
Amounts due to other group undertakings 474 965
21 Movement in opening and closing portfolio investments net of financing2013
£’0002012
£’000
Net cash inflow for the year 6,310 17,066
Cash flows:
Increase in overseas deposits 4,724 11,916
Net portfolio investments (13,384) (20,951)
Movement arising from cash flows (2,350) 8,031
Changes in market value and exchange rates (28,687) (13,734)
Total movement in portfolio investments (31,037) (5,703)
Portfolio at 1 January 674,475 680,178
Portfolio at 31 December 643,438 674,475
22 Movement in cash, portfolio investments and financing
At 1 January
2013 £’000
Cash flow £’000
Changes to market
values and currencies
£’000
At 31 December
2013 £’000
Cash at bank 37,307 6,310 (284) 43,333
Overseas deposits 60,879 4,724 (4,040) 61,563
Portfolio investments:
Shares and other fixed income securities and units in unit trusts 60,212 (20,367) 5,675 45,520
Holdings in collective investment schemes 54,452 23,251 - 77,703
Debt securities and other fixed income securities 439,597 (7,472) (30,012) 402,113
Deposits with credit institutions 22,028 (8,796) (26) 13,206
Total cash, portfolio investments and financing 674,475 2,350 (28,687) 643,438

28 Annual Report and Financial Statements for the year ended 31 December 2013 Syndicate 3000
23 Net cash outflow on portfolio investments2013
£’0002012
£’000
Purchase of shares and other variable yield securities and units in unit trusts (3,513) (57,866)
Purchase of debt securities and other fixed income securities (120,941) (145,952)
Movement of holdings in collective investment schemes (23,251) (23,402)
Movement of holdings in deposits with credit institutions 8,796 (22,028)
Sale of shares and other variable yield securities and units in unit trusts 23,880 35,793
Sale of debt securities and other fixed income securities 128,413 234,405
Net cash inflow on portfolio investments 13,384 20,950
24 Related partiesThe Syndicate has availed itself of an exemption under Financial Reporting Standard 8 (Related Party Disclosures) in respect of transactions with entities that are part of the Group, 90% or more of whose voting rights are controlled within the Group.
During 2013 the Syndicate wrote gross written premiums of £10.7 and paid commissions of £0.4m in respect of business written through RK Harrison, a third-party broker of which director Ralph Snedden is also a diretor.
25 Funds at Lloyd’sEvery member is required to hold capital at Lloyd’s, which is held in trust and known as Funds at Lloyd’s (FAL). These funds are intended primarily to cover circumstances where syndicate assets prove insufficient to meet participating members’ underwriting liabilities.
The level of FAL that Lloyd’s requires a member to maintain is determined by Lloyd’s based on PRA requirements and resource criteria. FAL has regard to a number of factors including the nature and amount of risk to be underwritten by the member and the assessment of the reserving risk in respect of business that has been underwritten. Since FAL is not under the management of the Managing Agent, no amount has been shown in these Financial Statements by way of such capital resources. However, the Managing Agent is able to make a call on the members’ FAL to meet liquidity requirements or to settle losses.