Embed Size (px)
Citation preview
Mark Neubauer RPM Seminar at LBNL / April 13, 2006
Mark NeubauerUniversity of California, San Diego
for the CDF Collaboration
Lb Lifetime in Fully Reconstructed
Decay at CDF
Mark Neubauer RPM Seminar at LBNL / April 13, 2006
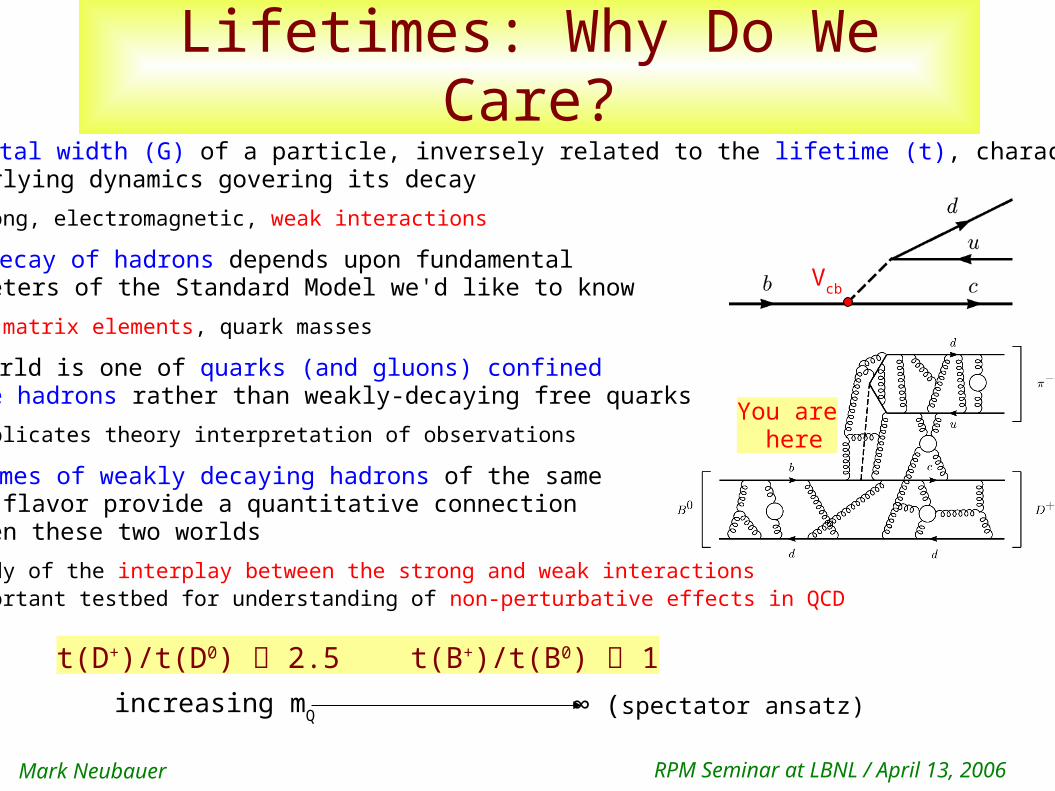
Lifetimes: Why Do We Care? The total width (G) of a particle, inversely related to the lifetime (t), characterizes underlying dynamics govering its decay
strong, electromagnetic, weak interactions
Weak decay of hadrons depends upon fundamental parameters of the Standard Model we'd like to know
CKM matrix elements, quark masses
Our world is one of quarks (and gluons) confined inside hadrons rather than weakly-decaying free quarks
Complicates theory interpretation of observations
Lifetimes of weakly decaying hadrons of the same heavy flavor provide a quantitative connection between these two worlds
study of the interplay between the strong and weak interactions important testbed for understanding of non-perturbative effects in QCD
increasing mQ ∞ (spectator ansatz)
t(D+)/t(D0) 2.5 t(B+)/t(B0) 1
Vcb
You are here
Mark Neubauer RPM Seminar at LBNL / April 13, 2006
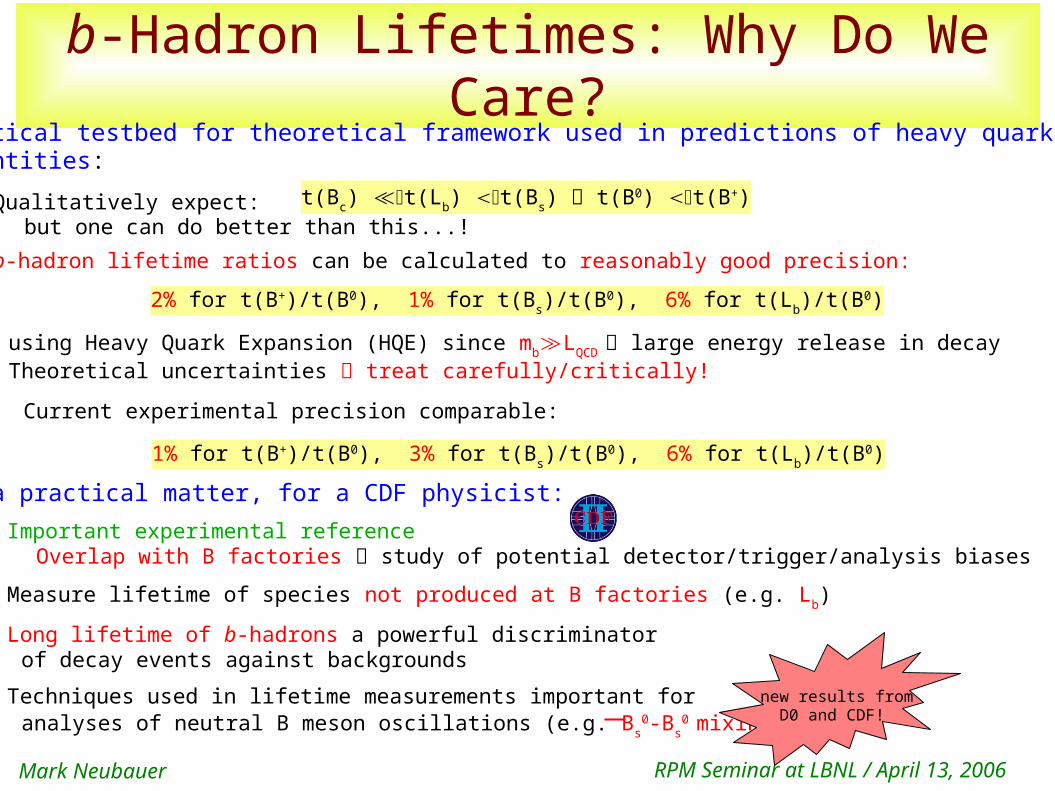
b-Hadron Lifetimes: Why Do We Care?Critical testbed for theoretical framework used in predictions of heavy quark quantities:
Qualitatively expect: but one can do better than this...!
b-hadron lifetime ratios can be calculated to reasonably good precision:
using Heavy Quark Expansion (HQE) since mb≫LQCD large energy release in decay Theoretical uncertainties treat carefully/critically!
Current experimental precision comparable:
As a practical matter, for a CDF physicist: Important experimental reference
Overlap with B factories study of potential detector/trigger/analysis biases
Measure lifetime of species not produced at B factories (e.g. Lb)
Long lifetime of b-hadrons a powerful discriminator of decay events against backgrounds Techniques used in lifetime measurements important for analyses of neutral B meson oscillations (e.g. Bs
0-Bs0 mixing)
t(Bc) ≪t(Lb) t(Bs) t(B0) t(B+)
1% for t(B+)/t(B0), 3% for t(Bs)/t(B0), 6% for t(Lb)/t(B
0)
2% for t(B+)/t(B0), 1% for t(Bs)/t(B0), 6% for t(Lb)/t(B
0)
new results from D0 and CDF!
Mark Neubauer RPM Seminar at LBNL / April 13, 2006
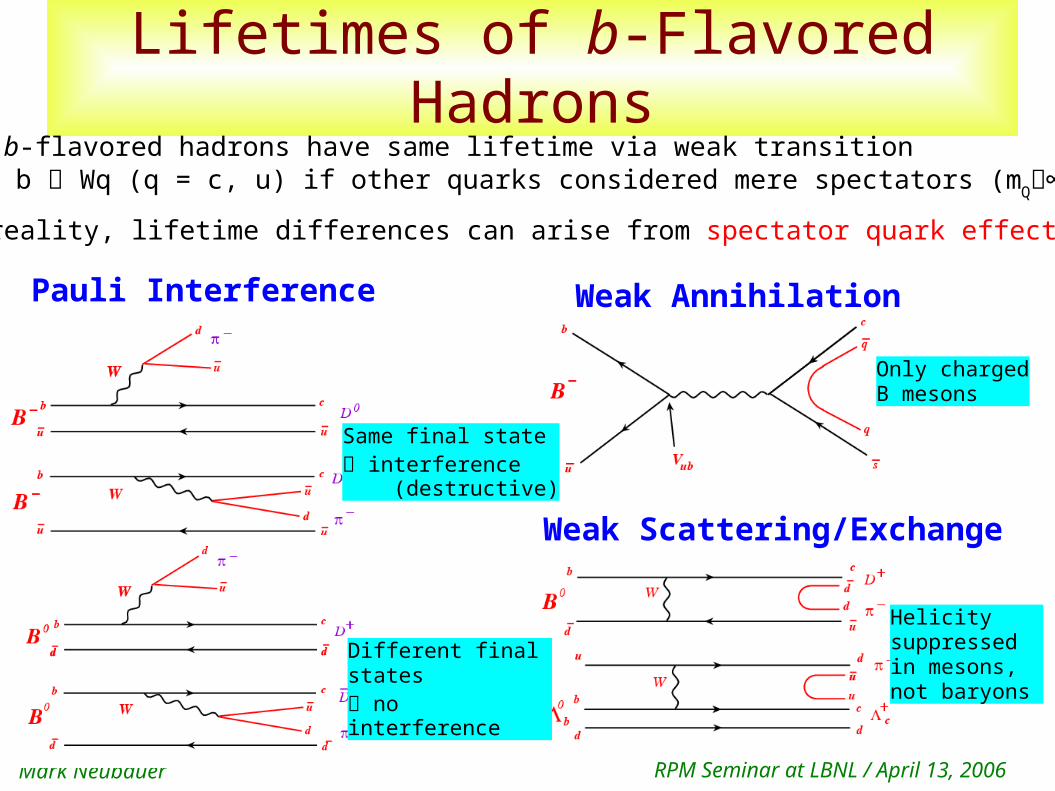
Lifetimes of b-Flavored Hadrons
Pauli Interference Weak Annihilation
Weak Scattering/Exchange
Same final state interference (destructive)
Different final states no interference
Only chargedB mesons
Helicitysuppressedin mesons, not baryons
All b-flavored hadrons have same lifetime via weak transitionb Wq (q = c, u) if other quarks considered mere spectators (mQ∞)
In reality, lifetime differences can arise from spectator quark effects:
Mark Neubauer RPM Seminar at LBNL / April 13, 2006
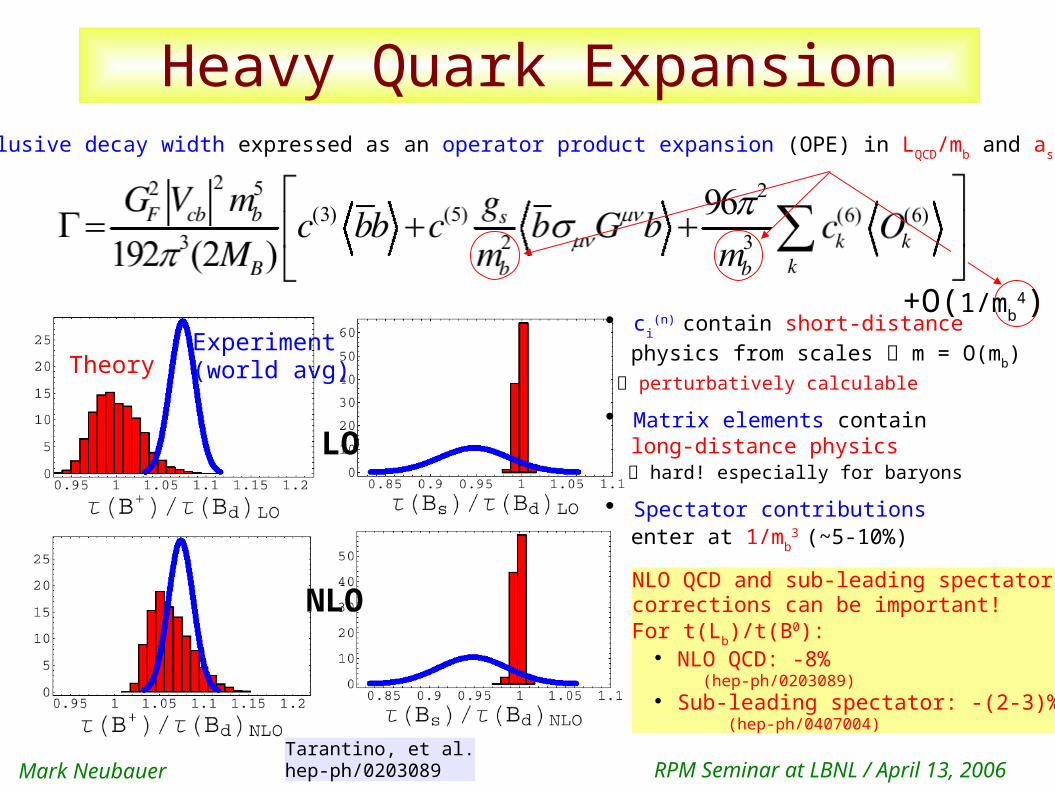
Heavy Quark Expansion
ci(n)
contain short-distance physics from scales m = O(mb) perturbatively calculable
Matrix elements contain long-distance physics hard! especially for baryons
Spectator contributions enter at 1/mb
3 (~5-10%)
Inclusive decay width expressed as an operator product expansion (OPE) in LQCD/mb and as(mb)
Tarantino, et al.hep-ph/0203089
Experiment(world avg)Theory
NLO QCD and sub-leading spectatorcorrections can be important!For t(Lb)/t(B
0): NLO QCD: -8% (hep-ph/0203089) Sub-leading spectator: -(2-3)%
(hep-ph/0407004)
LO
NLO
+O(1/mb4)
Mark Neubauer RPM Seminar at LBNL / April 13, 2006
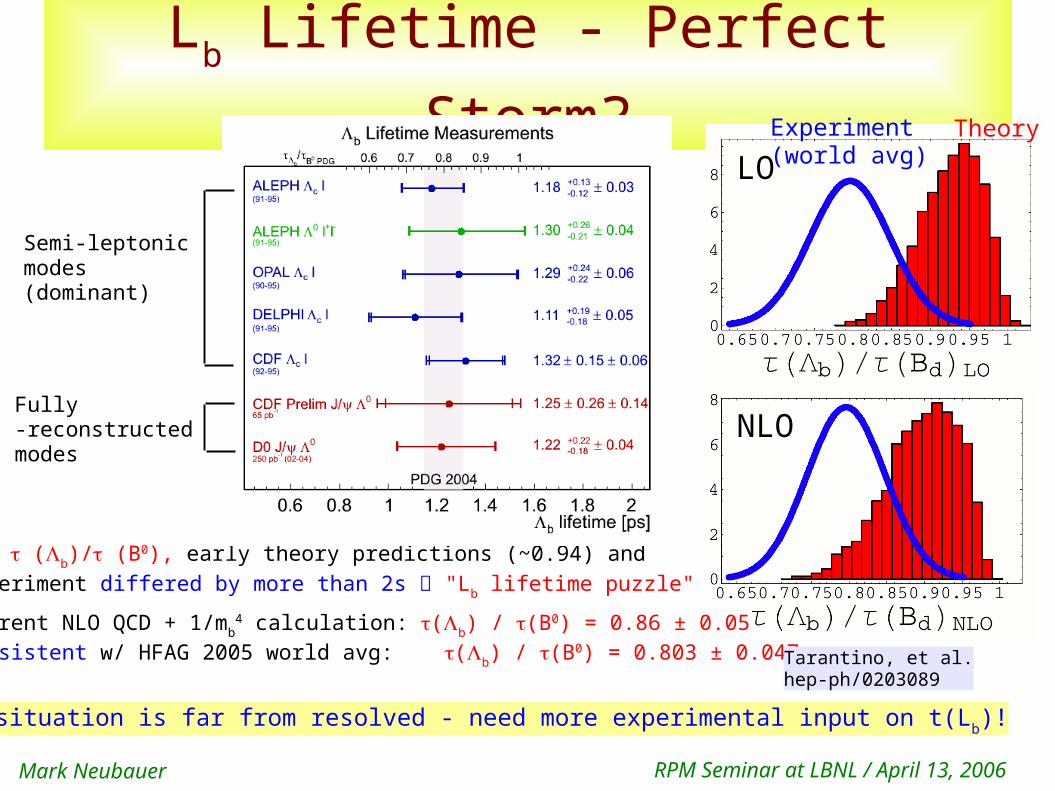
Lb Lifetime - Perfect Storm?
For (b)/ (B0), early theory predictions (~0.94) and
experiment differed by more than 2s "Lb lifetime puzzle"
Current NLO QCD + 1/mb4 calculation: (b) / (B
0) = 0.86 ± 0.05consistent w/ HFAG 2005 world avg: (b) / (B
0) = 0.803 ± 0.047 Tarantino, et al.hep-ph/0203089
LO
NLO
Experiment(world avg)
Theory
The situation is far from resolved - need more experimental input on t(Lb)!
Semi-leptonicmodes(dominant)
Fully-reconstructedmodes
Mark Neubauer RPM Seminar at LBNL / April 13, 2006
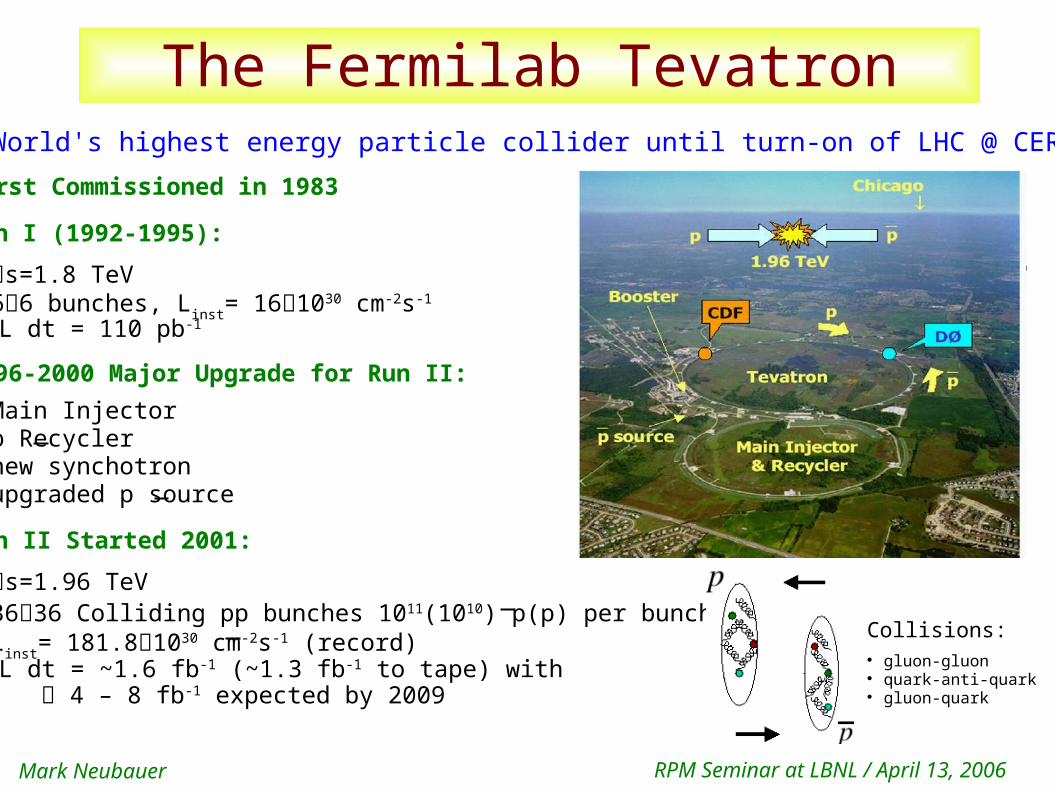
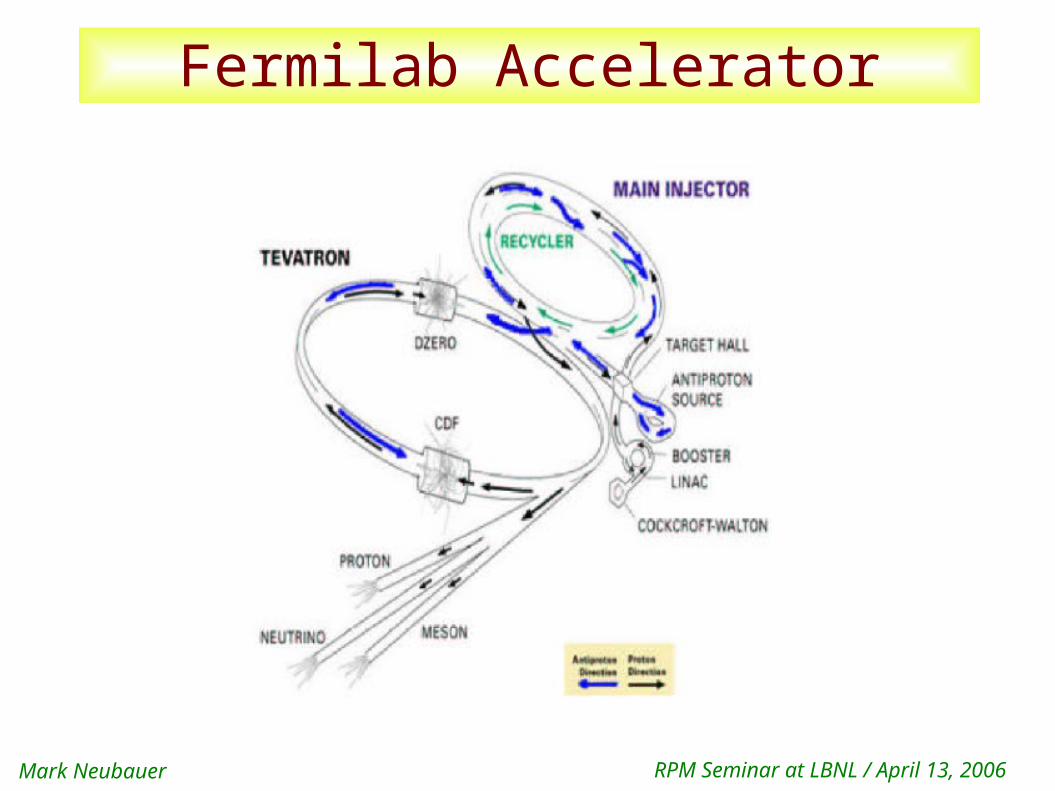
The Fermilab TevatronWorld's highest energy particle collider until turn-on of LHC @ CERN
First Commissioned in 1983
Run I (1992-1995): s=1.8 TeV 66 bunches, Linst= 161030 cm-2s-1
∫L dt = 110 pb-1
1996-2000 Major Upgrade for Run II: Main Injector p Recycler new synchotron upgraded p source
Run II Started 2001: s=1.96 TeV 3636 Colliding pp bunches 1011(1010) p(p) per bunch Linst= 181.81030 cm-2s-1 (record)
∫L dt = ~1.6 fb-1 (~1.3 fb-1 to tape) with 4 – 8 fb-1 expected by 2009
Collisions: gluon-gluon quark-anti-quark gluon-quark
Mark Neubauer RPM Seminar at LBNL / April 13, 2006
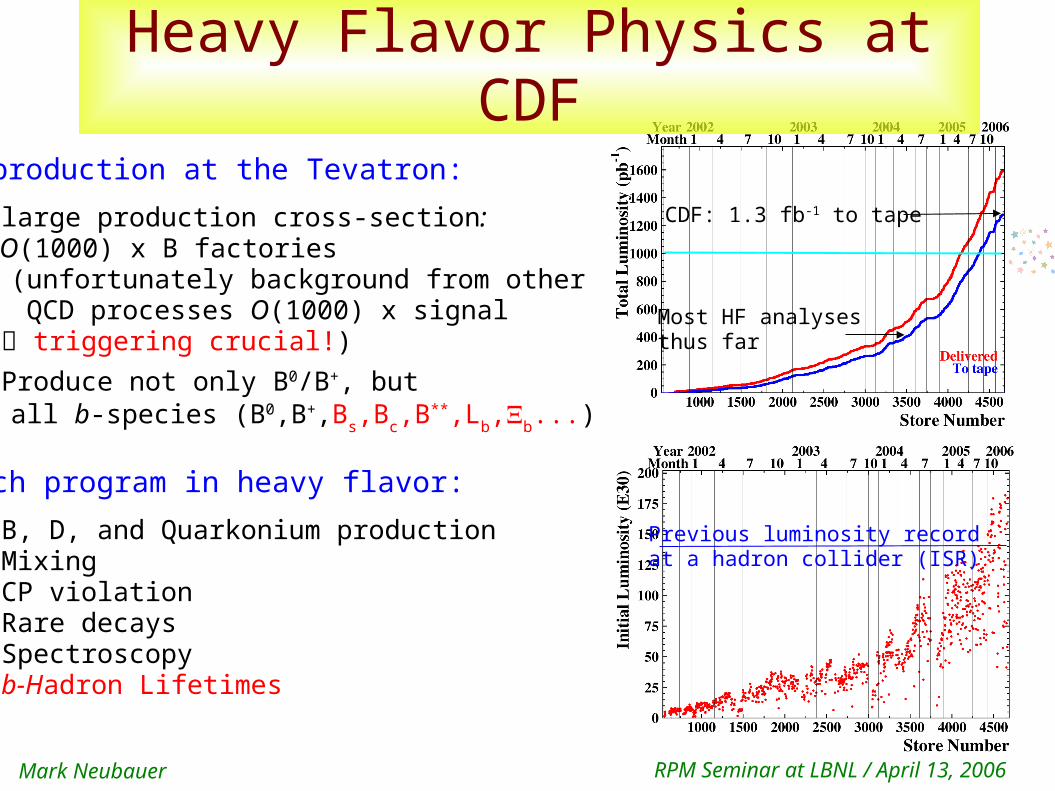
Heavy Flavor Physics at CDF
b production at the Tevatron: large production cross-section: O(1000) x B factories (unfortunately background from other QCD processes O(1000) x signal
triggering crucial!) Produce not only B0/B+, but all b-species (B0,B+,Bs,Bc,B
**,Lb,b...)
Rich program in heavy flavor: B, D, and Quarkonium production Mixing CP violation Rare decays Spectroscopy b-Hadron Lifetimes
CDF: 1.3 fb-1 to tape
Most HF analysesthus far
Previous luminosity recordat a hadron collider (ISR)
Mark Neubauer RPM Seminar at LBNL / April 13, 2006
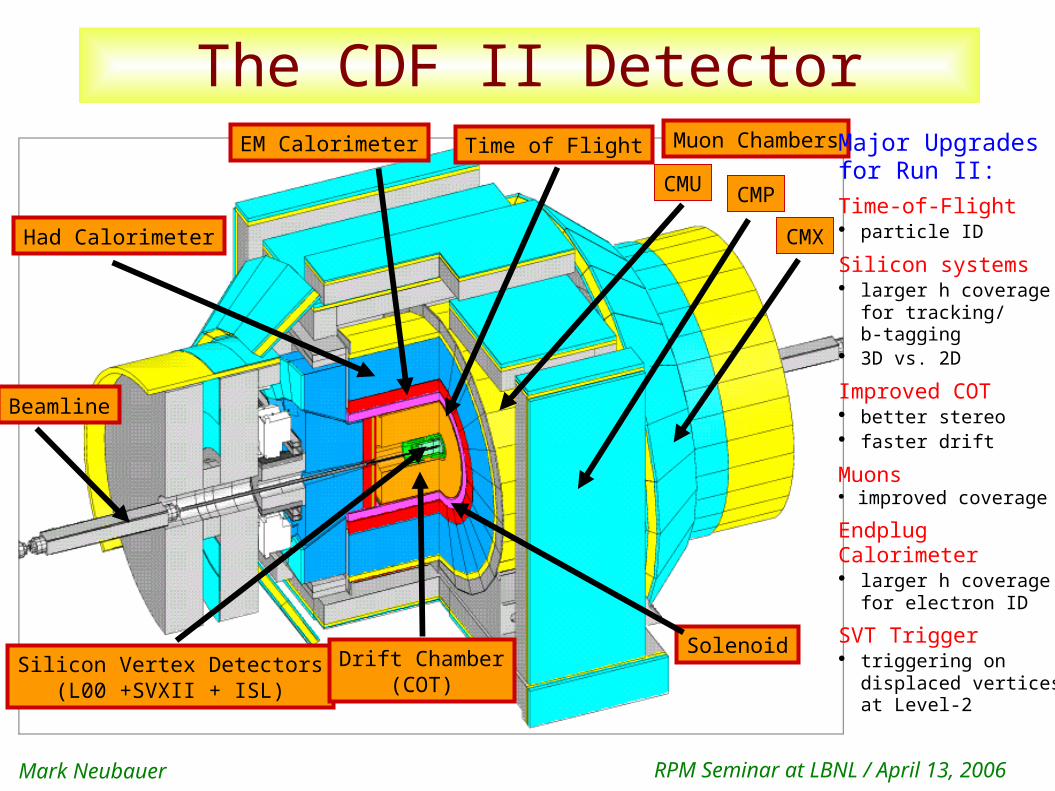
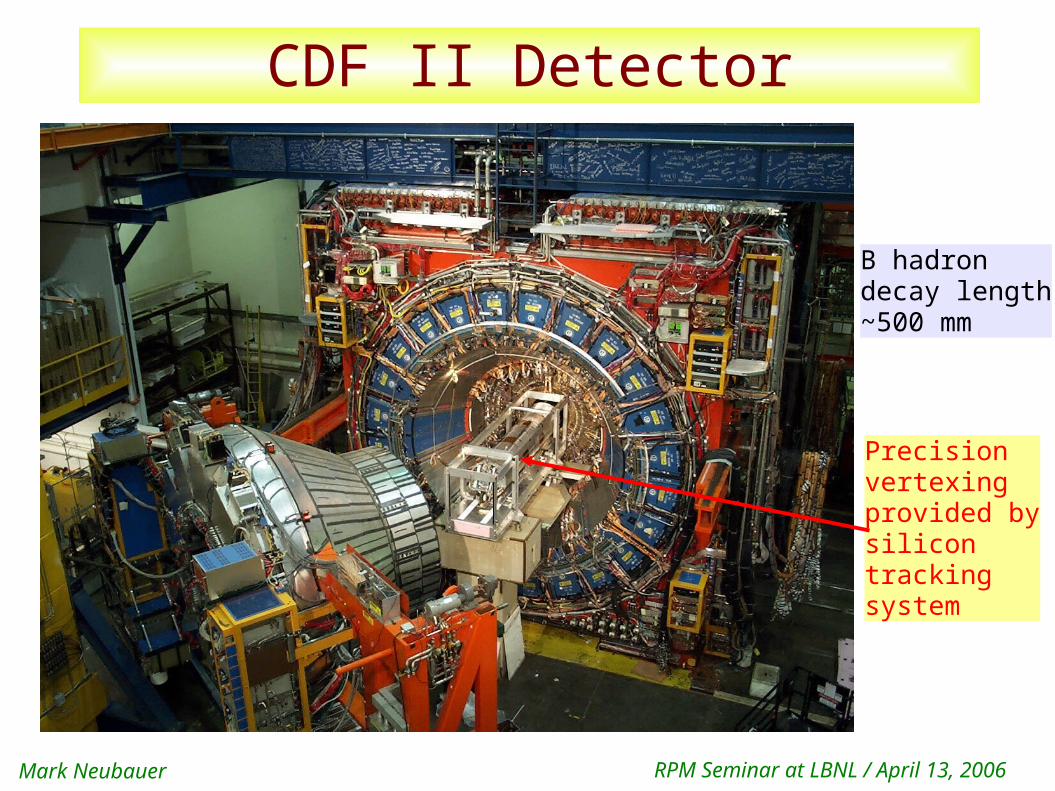
The CDF II Detector
Beamline
Silicon Vertex Detectors(L00 +SVXII + ISL)
Drift Chamber(COT)
Solenoid
Muon Chambers
CMU CMP
CMX
Time of Flight
Had Calorimeter
EM Calorimeter Major Upgradesfor Run II:Time-of-Flight particle ID
Silicon systems larger h coverage for tracking/ b-tagging 3D vs. 2D
Improved COT better stereo faster drift
Muons improved coverage
Endplug Calorimeter larger h coverage for electron ID
SVT Trigger triggering on displaced vertices at Level-2
Mark Neubauer RPM Seminar at LBNL / April 13, 2006
CDF II Detector
Precisionvertexingprovided bysilicon tracking system
B hadrondecay length~500 mm
Mark Neubauer RPM Seminar at LBNL / April 13, 2006
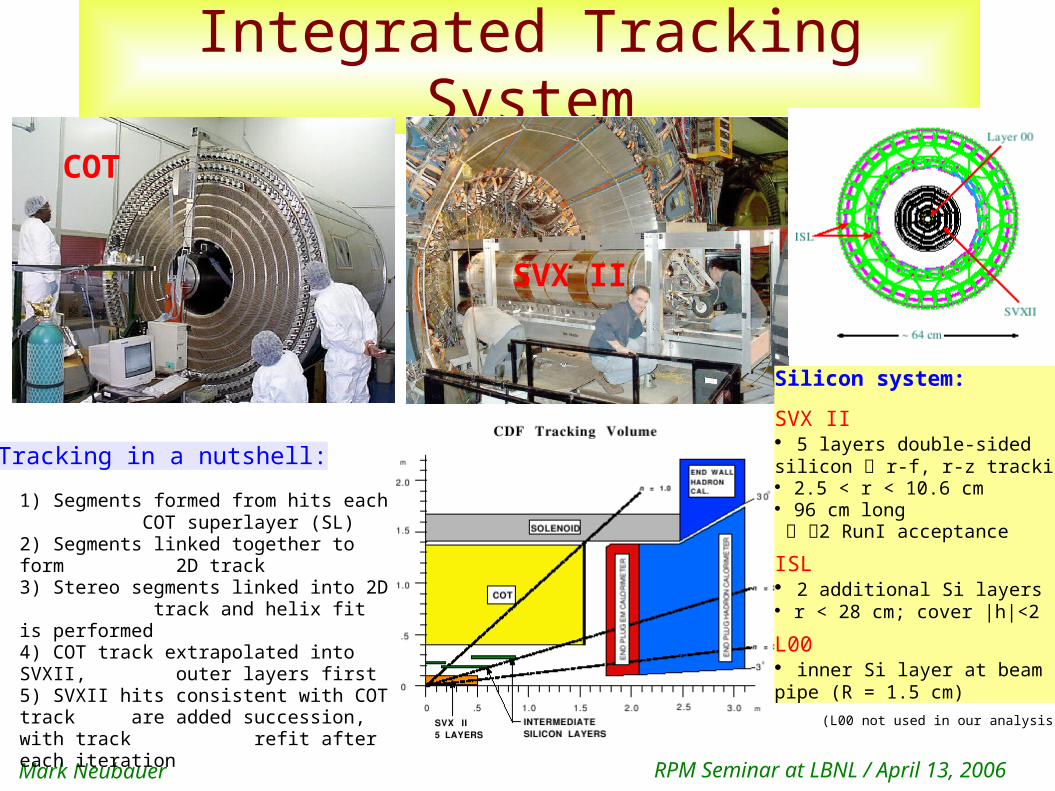
Integrated Tracking System
Silicon system:
SVX II 5 layers double-sidedsilicon r-f, r-z tracking 2.5 < r < 10.6 cm 96 cm long 2 RunI acceptance
ISL 2 additional Si layers r < 28 cm; cover |h|<2
L00 inner Si layer at beampipe (R = 1.5 cm)
(L00 not used in our analysis)
COT
SVX II
1) Segments formed from hits each COT superlayer (SL)2) Segments linked together to form 2D track3) Stereo segments linked into 2D track and helix fit is performed4) COT track extrapolated into SVXII, outer layers first5) SVXII hits consistent with COT track are added succession, with track refit after each iteration
Tracking in a nutshell:
Mark Neubauer RPM Seminar at LBNL / April 13, 2006
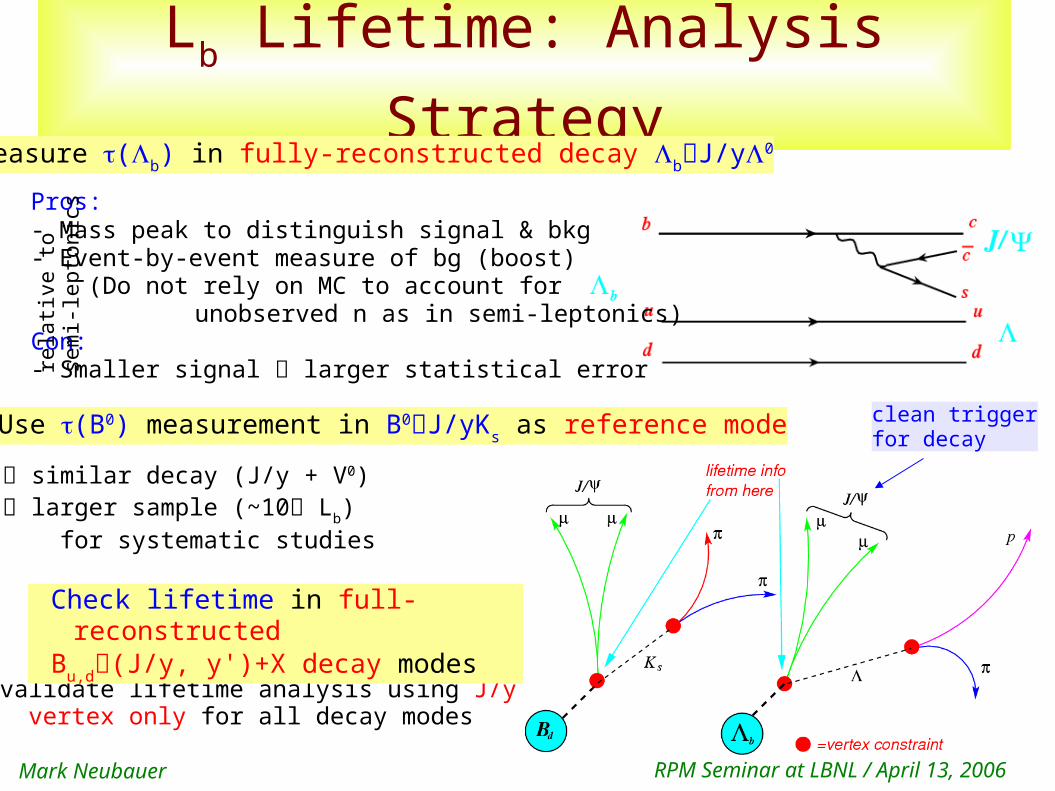
Lb Lifetime: Analysis Strategy
Pros:- Mass peak to distinguish signal & bkg- Event-by-event measure of bg (boost) (Do not rely on MC to account for
unobserved n as in semi-leptonics)Con:- Smaller signal larger statistical error
similar decay (J/y + V0) larger sample (~10 Lb) for systematic studies
rela
tive
to
sem
i-le
pto
nic
s
validate lifetime analysis using J/y vertex only for all decay modes
Measure (b) in fully-reconstructed decay bJ/y0
Use (B0) measurement in B0J/yKs as reference mode
Check lifetime in full-reconstructed
Bu,d(J/y, y')+X decay modes
clean triggerfor decay
Mark Neubauer RPM Seminar at LBNL / April 13, 2006
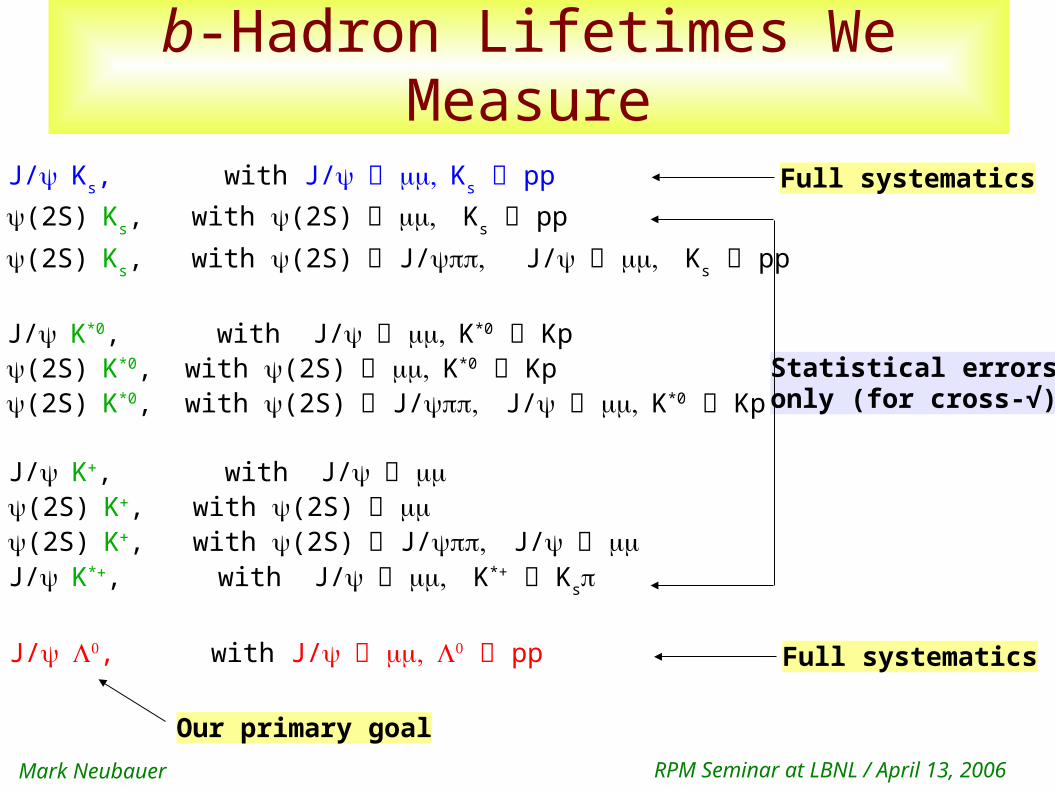
b-Hadron Lifetimes We Measure
B0 J/Ks, with J/ Ks pp
(2S)Ks, with (2S) Ks pp
(2S)Ks, with (2S) J/J/ Ks pp
J/K*0, with J/ K*0 Kp (2S)K*0, with (2S) K*0 Kp (2S)K*0, with (2S) J/J/ K*0 Kp
J/K, with J/ (2S)K, with (2S) (2S)K, with (2S) J/J/ J/K*, with J/ K*+ Ks
b J/, with J/ pp
Our primary goal
Full systematics
Full systematics
Statistical errorsonly (for cross-√)
Mark Neubauer RPM Seminar at LBNL / April 13, 2006
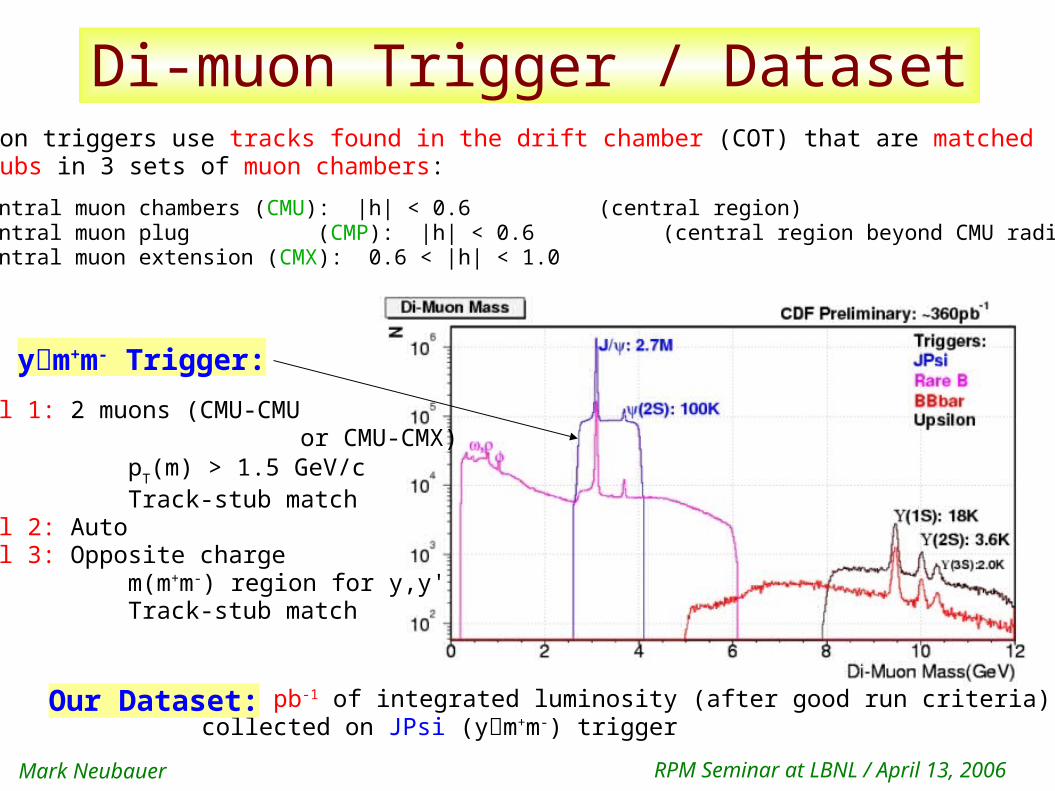
Di-muon Trigger / Dataset
Level 1: 2 muons (CMU-CMU or CMU-CMX) pT(m) > 1.5 GeV/c Track-stub matchLevel 2: AutoLevel 3: Opposite charge m(m+m-) region for y,y' Track-stub match
~370 pb-1 of integrated luminosity (after good run criteria)collected on JPsi (ym+m-) trigger
Di-muon triggers use tracks found in the drift chamber (COT) that are matched to stubs in 3 sets of muon chambers:
Central muon chambers (CMU): |h| < 0.6 (central region) Central muon plug (CMP): |h| < 0.6 (central region beyond CMU radius) Central muon extension (CMX): 0.6 < |h| < 1.0
ym+m- Trigger:
Our Dataset:
Mark Neubauer RPM Seminar at LBNL / April 13, 2006
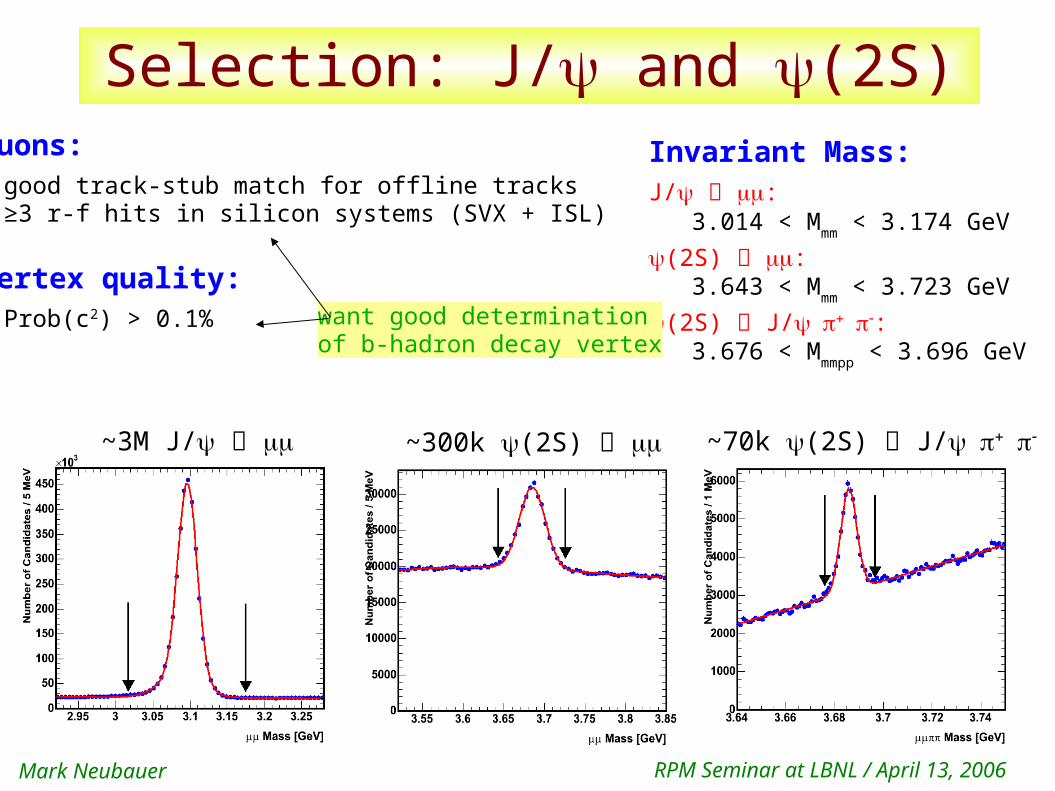
Selection: J/ and (2S)Muons: good track-stub match for offline tracks ≥3 r-f hits in silicon systems (SVX + ISL)
Vertex quality: Prob(c2) > 0.1%
Invariant Mass:J/ : 3.014 < Mmm < 3.174 GeV
(2S) : 3.643 < Mmm < 3.723 GeV
(2S) J/: 3.676 < Mmmpp < 3.696 GeV
~3M J/ ~300k (2S) ~70k (2S) J/
want good determinationof b-hadron decay vertex
Mark Neubauer RPM Seminar at LBNL / April 13, 2006
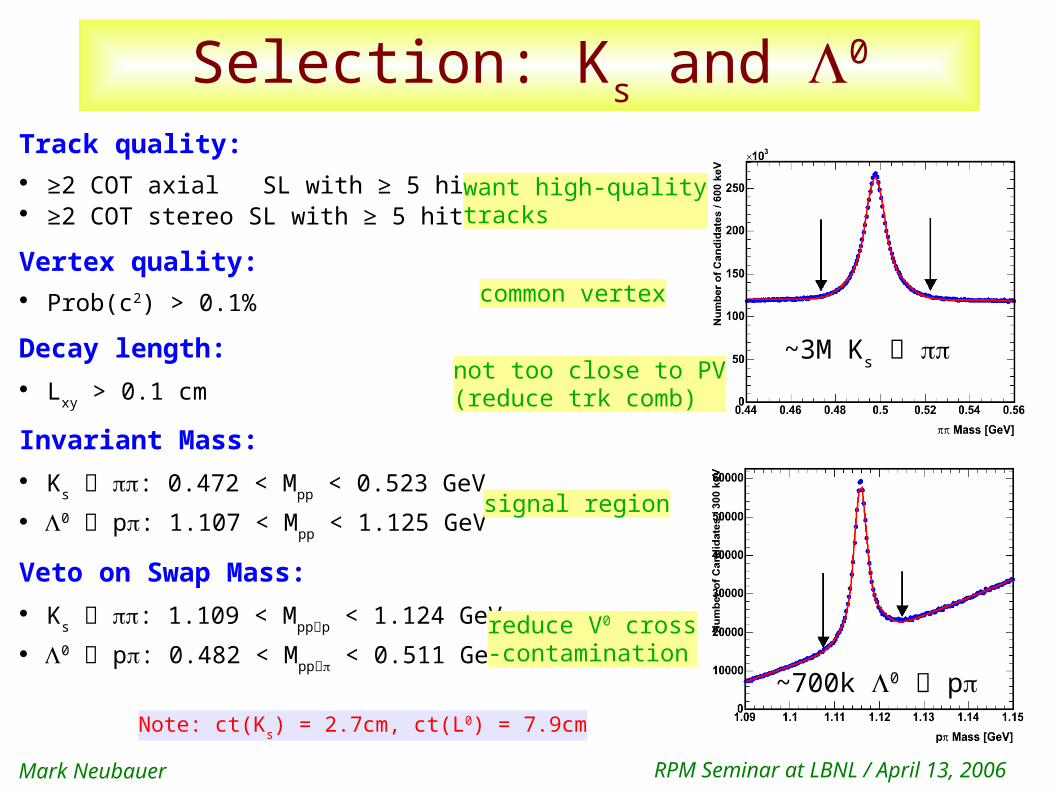
Selection: Ks and 0
Track quality: ≥2 COT axial SL with ≥ 5 hits ≥2 COT stereo SL with ≥ 5 hits
Vertex quality: Prob(c2) > 0.1%
Decay length: Lxy > 0.1 cm
Invariant Mass: Ks : 0.472 < Mpp < 0.523 GeV0 p: 1.107 < Mpp < 1.125 GeV
Veto on Swap Mass: Ks : 1.109 < Mppp < 1.124 GeV0 p: 0.482 < Mpp < 0.511 GeV
~700k 0 p
~3M Ks
want high-qualitytracks
common vertex
not too close to PV(reduce trk comb)
signal region
reduce V0 cross-contamination
Note: ct(Ks) = 2.7cm, ct(L0) = 7.9cm
Mark Neubauer RPM Seminar at LBNL / April 13, 2006
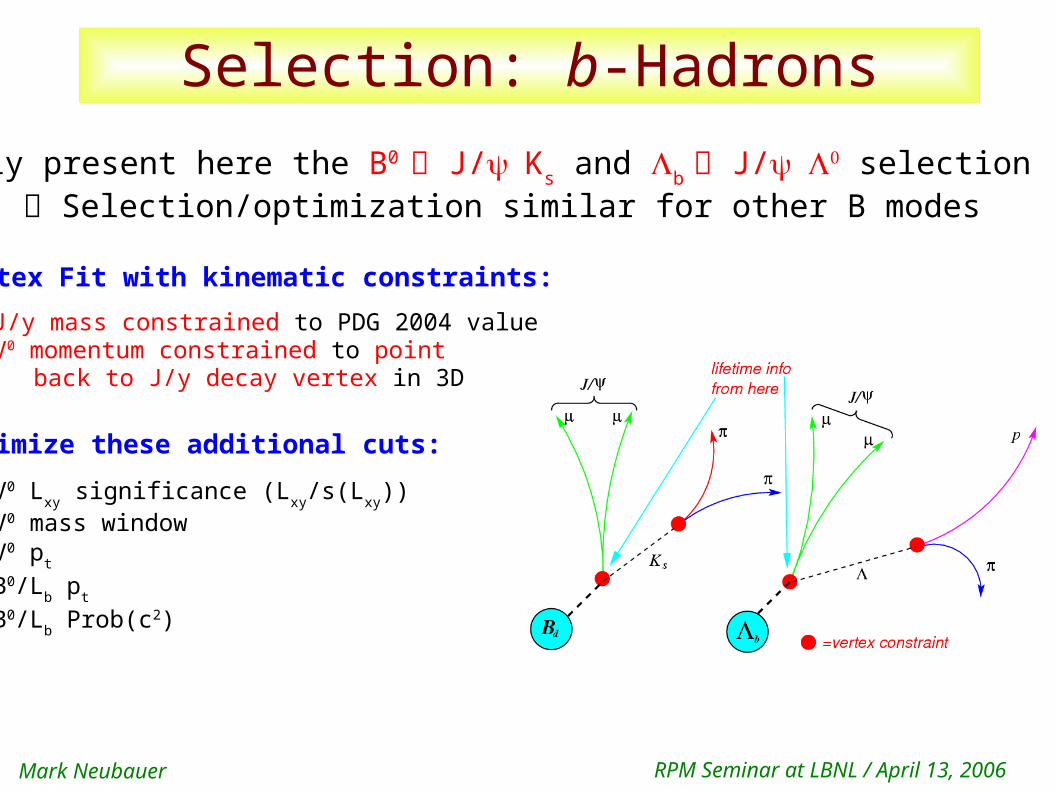
Selection: b-Hadrons
Only present here the B0 J/Ks and b J/ selection
Selection/optimization similar for other B modes
Vertex Fit with kinematic constraints: J/y mass constrained to PDG 2004 value V0 momentum constrained to point
back to J/y decay vertex in 3D
Optimize these additional cuts:
V0 Lxy significance (Lxy/s(Lxy)) V0 mass window V0 pt
B0/Lb pt
B0/Lb Prob(c2)
Mark Neubauer RPM Seminar at LBNL / April 13, 2006
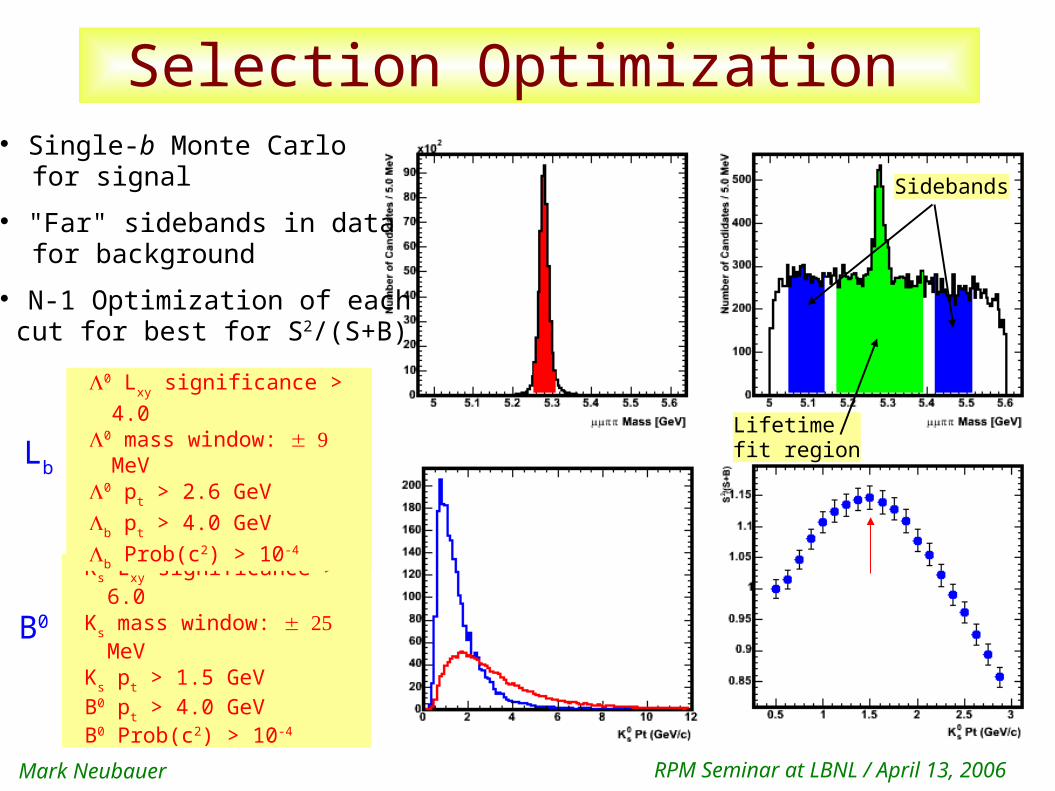
Selection Optimization Single-b Monte Carlo for signal
"Far" sidebands in data for background
N-1 Optimization of each cut for best for S2/(S+B)
Ks Lxy significance > 6.0Ks mass window:
MeVKs pt > 1.5 GeVB0 pt > 4.0 GeVB0 Prob(c2) > 10-4
0 Lxy significance > 4.0
0 mass window: MeV0 pt > 2.6 GeV
b pt > 4.0 GeV
b Prob(c2) > 10-4
Lifetimefit region
Sidebands
Lb
B0
Mark Neubauer RPM Seminar at LBNL / April 13, 2006
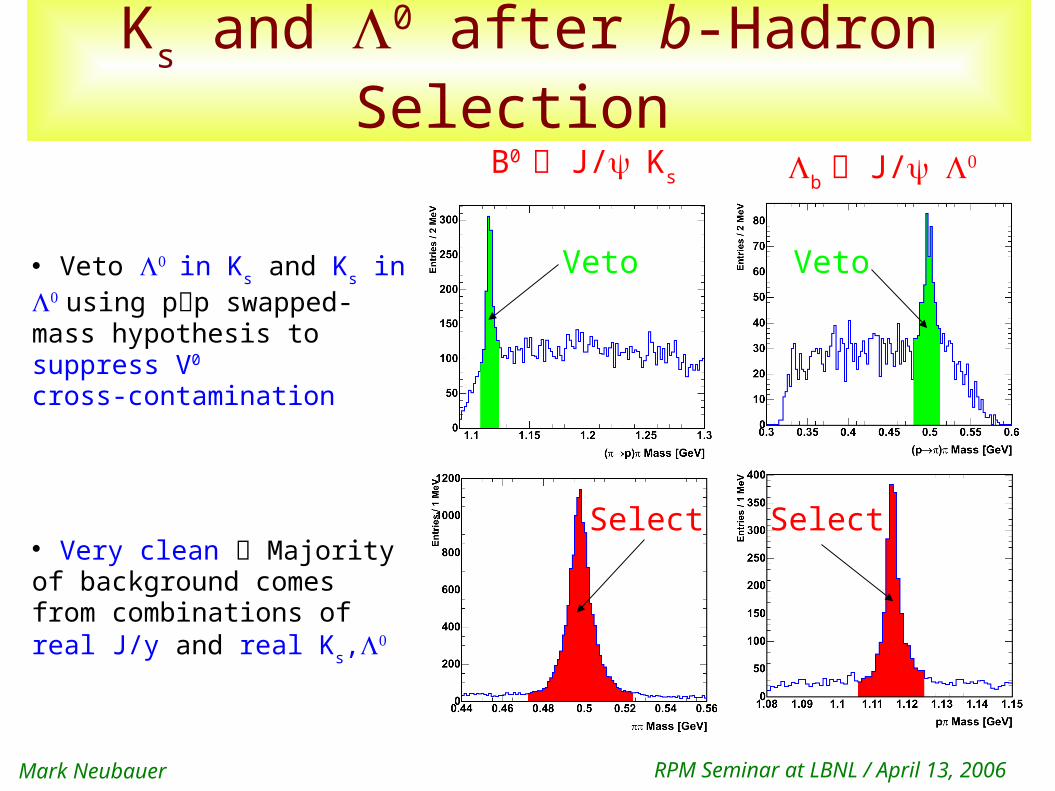
Ks and 0 after b-Hadron Selection
Veto in Ks and Ks in using pp swapped-mass hypothesis to suppress V0
cross-contamination
Very clean Majority of background comes from combinations of real J/y and real Ks,
B0 J/Ks b J/
Veto Veto
Select Select
Mark Neubauer RPM Seminar at LBNL / April 13, 2006
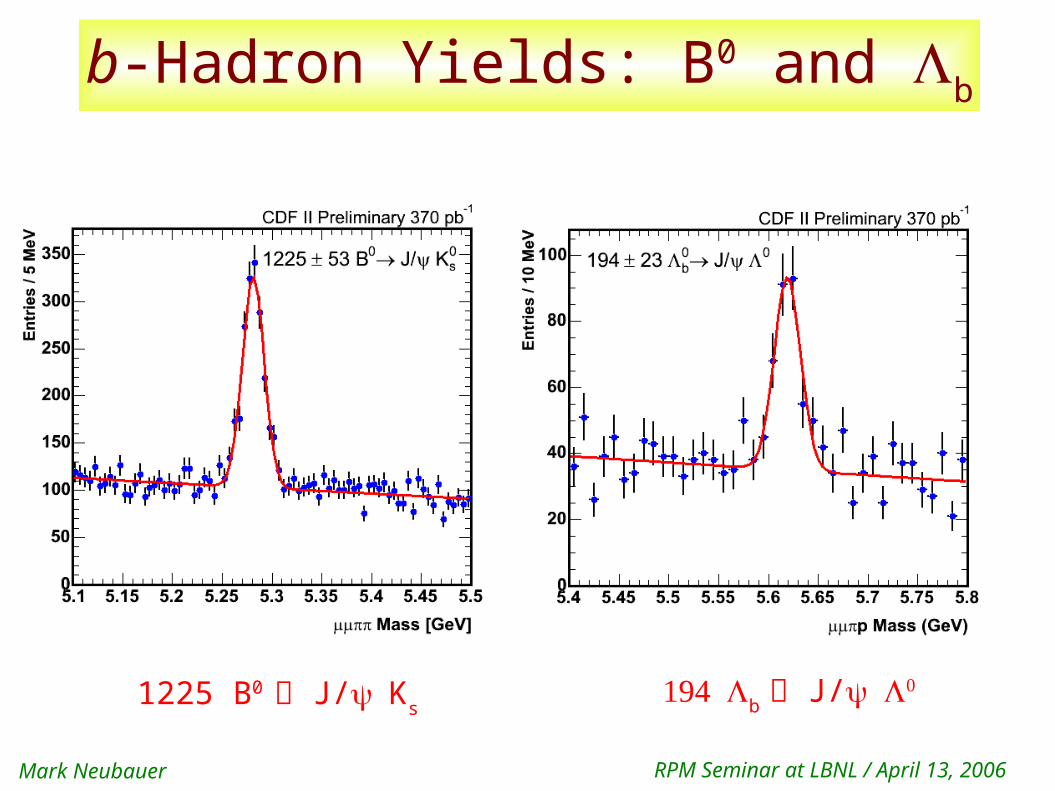
b-Hadron Yields: B0 and b
1225 B0 J/Ksb
J/
Mark Neubauer RPM Seminar at LBNL / April 13, 2006
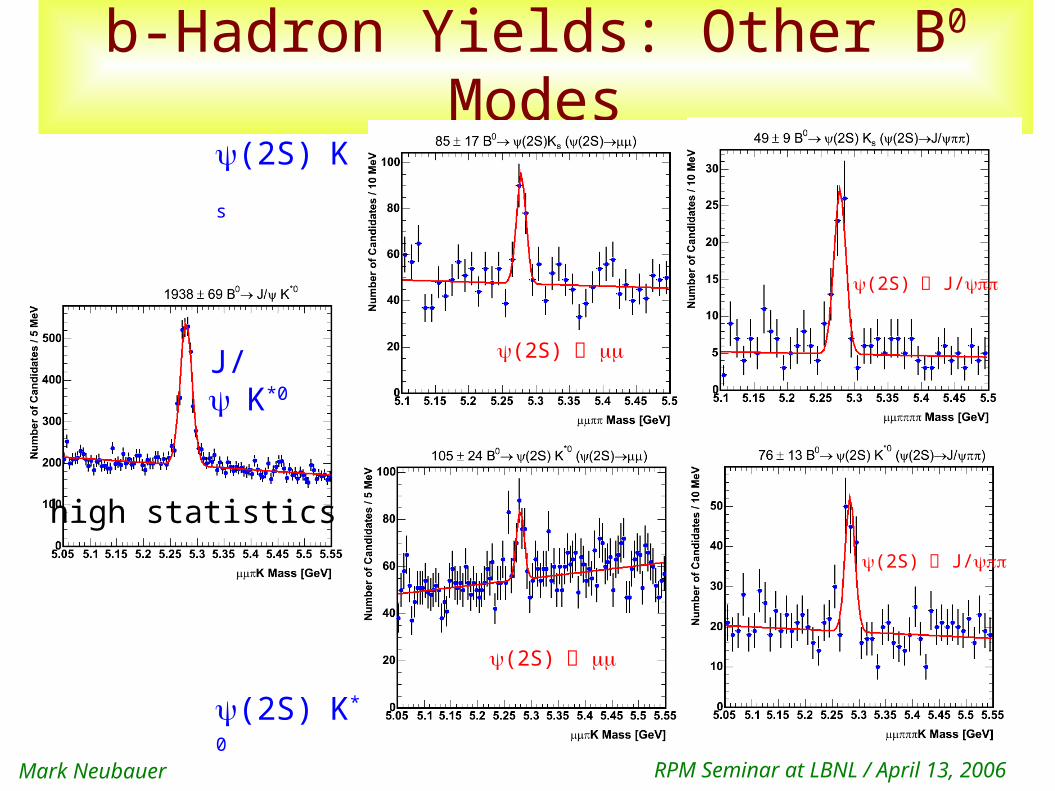
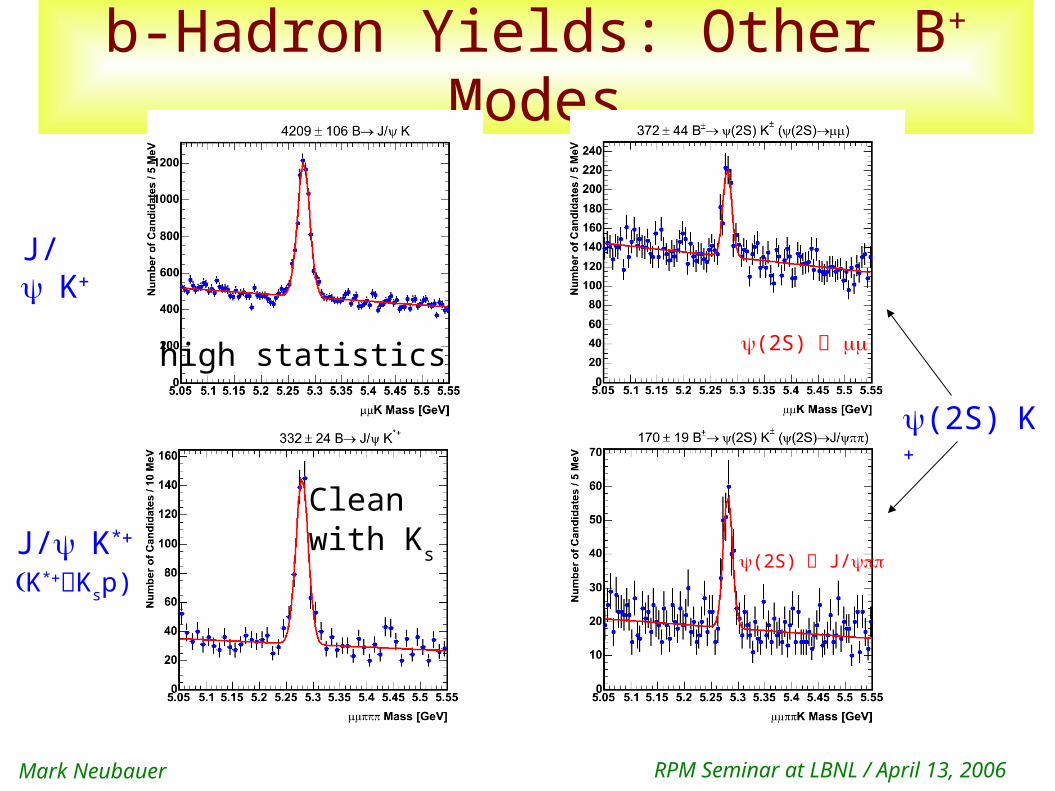
b-Hadron Yields: Other B0 Modes
high statistics
(2S)Ks
J/K*0
(2S)K*
0
(2S)
(2S)
(2S) J/
(2S) J/
Mark Neubauer RPM Seminar at LBNL / April 13, 2006
b-Hadron Yields: Other B+ Modes
Clean with Ks
high statistics
J/K*
K*Ksp)
J/K
(2S)K
(2S) J/
(2S)
Mark Neubauer RPM Seminar at LBNL / April 13, 2006
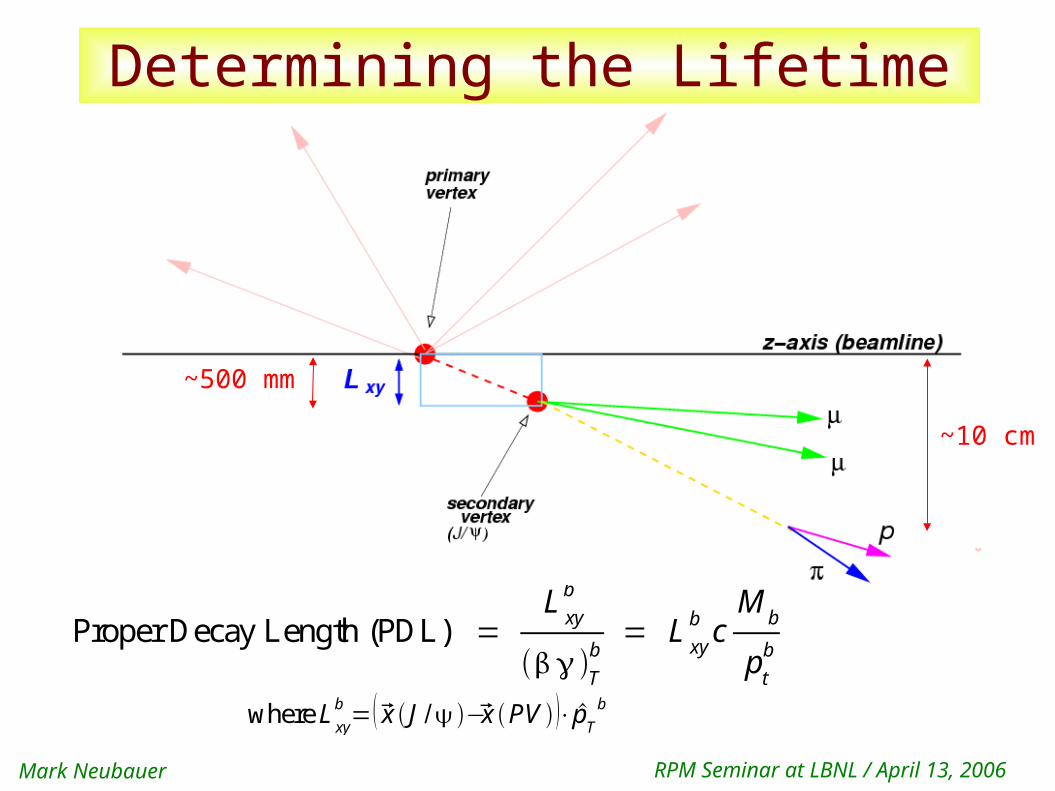
Determining the Lifetime
Proper Decay Length (PDL) =Lxy
b
T
b= L
xy
b cM
b
pt
b
where Lxy
b = x J / −x PV ⋅ pT
b
~500 mm
~10 cm
Mark Neubauer RPM Seminar at LBNL / April 13, 2006
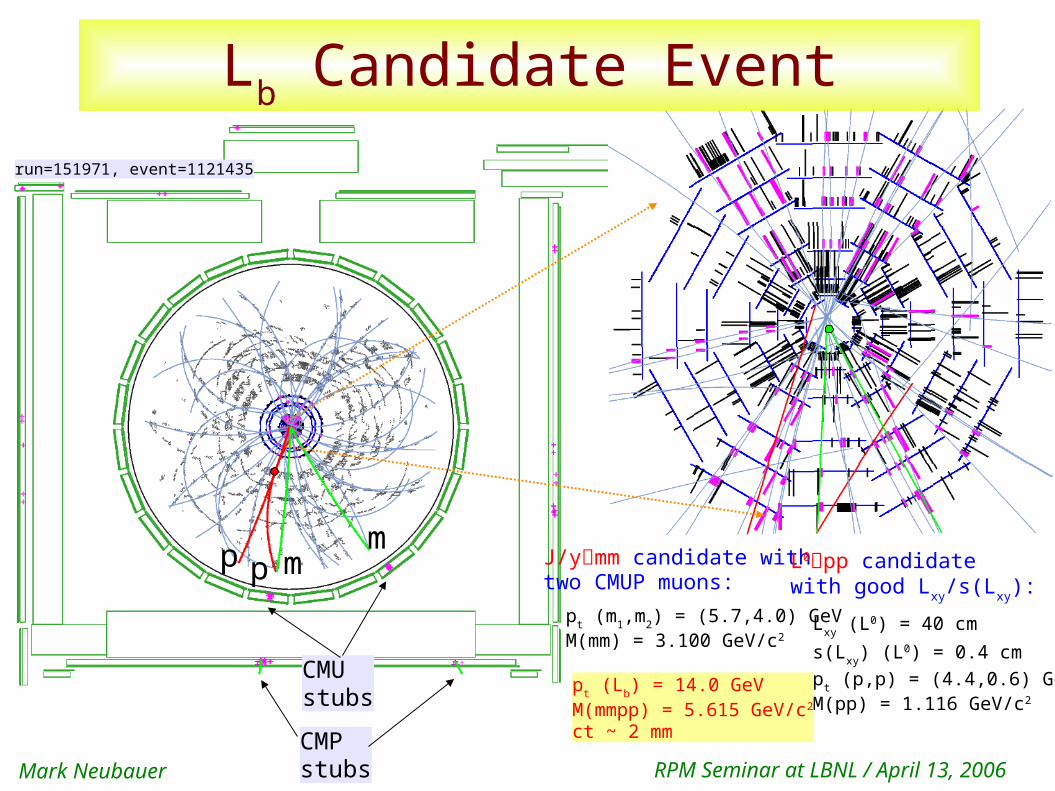
Lb Candidate Event
mmp p
CMUstubs
CMPstubs
run=151971, event=1121435
J/ymm candidate withtwo CMUP muons:
pt (m1,m2) = (5.7,4.0) GeV M(mm) = 3.100 GeV/c2
L0pp candidatewith good Lxy/s(Lxy):
Lxy (L0) = 40 cm
s(Lxy) (L0) = 0.4 cm
pt (p,p) = (4.4,0.6) GeV M(pp) = 1.116 GeV/c2
pt (Lb) = 14.0 GeVM(mmpp) = 5.615 GeV/c2
ct ~ 2 mm
Mark Neubauer RPM Seminar at LBNL / April 13, 2006
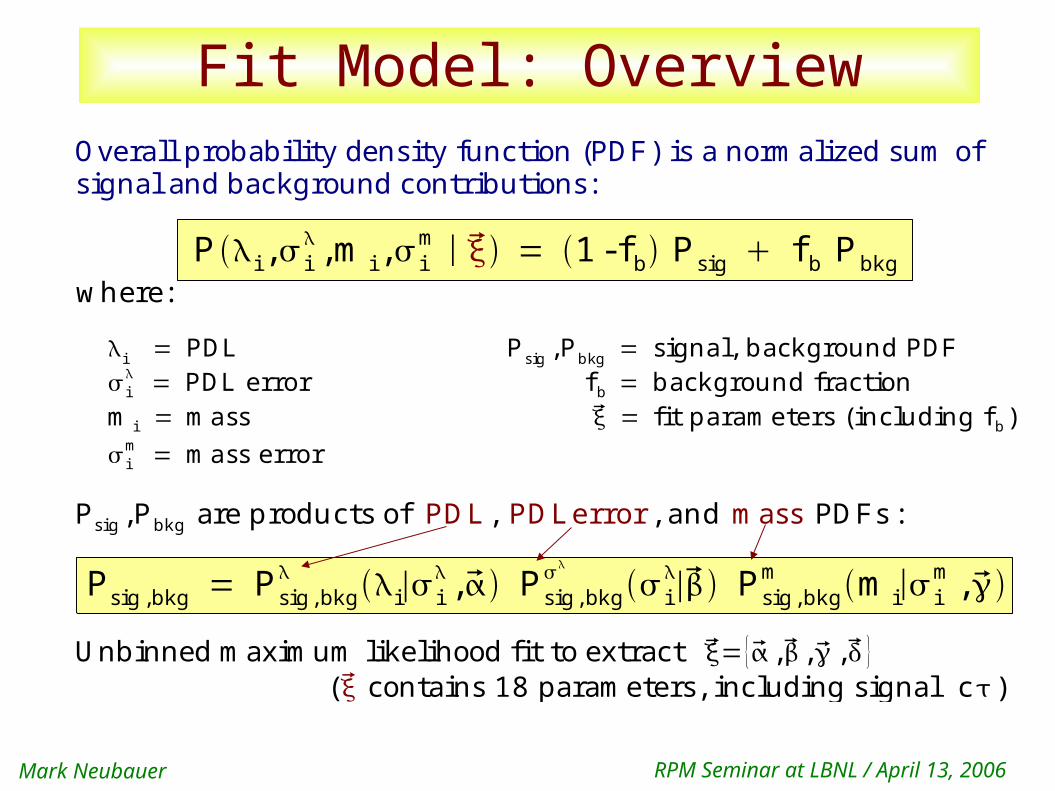
Fit Model: OverviewOverall probability density function (PDF) is a normalized sum ofsignal and background contributions:
P i , i ,mi , i
m ∣ = 1-fb Psig f b Pbkg
where:
i = PDL Psig ,Pbkg = signal, background PDF i
= PDL error f b = background fractionm i = mass = fit parameters (including f b)
im = mass error
Psig ,Pbkg are products of PDL, PDLerror , and mass PDFs :
Psig,bkg = Psig,bkg i∣ i
, Psig,bkg
i∣ Psig,bkg
m mi∣ im,
Unbinned maximum likelihood fit to extract = { , , , }( contains 18 parameters, including signal c )
Mark Neubauer RPM Seminar at LBNL / April 13, 2006
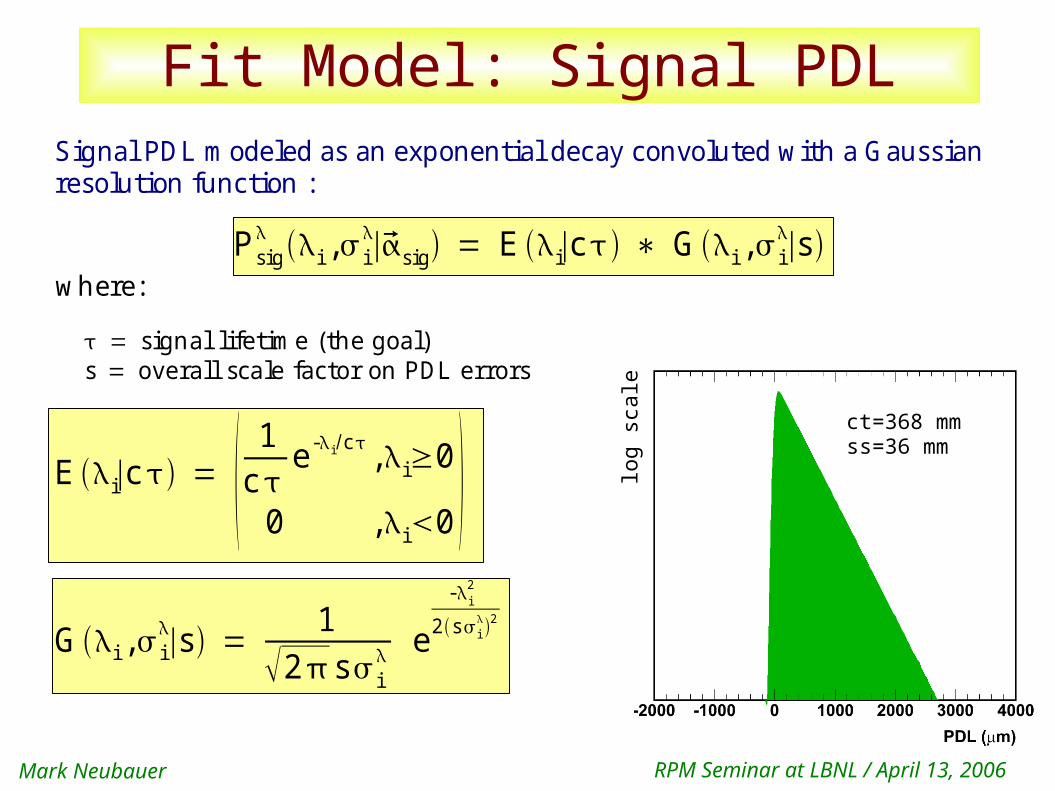
Fit Model: Signal PDLSignal PDL modeled as an exponential decay convoluted with a Gaussianresolution function :
Psig i , i
∣sig = Ei∣c ∗ Gi , i∣s
where:
= signal lifetime (the goal)s = overall scale factor on PDL errors
Ei∣c = 1c
e- i /c ,i≥0
0 ,i0 Gi , i
∣s = 1
2 s i e
- i2
2s i2
ct=368 mmss=36 mm
log
sca
le
Mark Neubauer RPM Seminar at LBNL / April 13, 2006
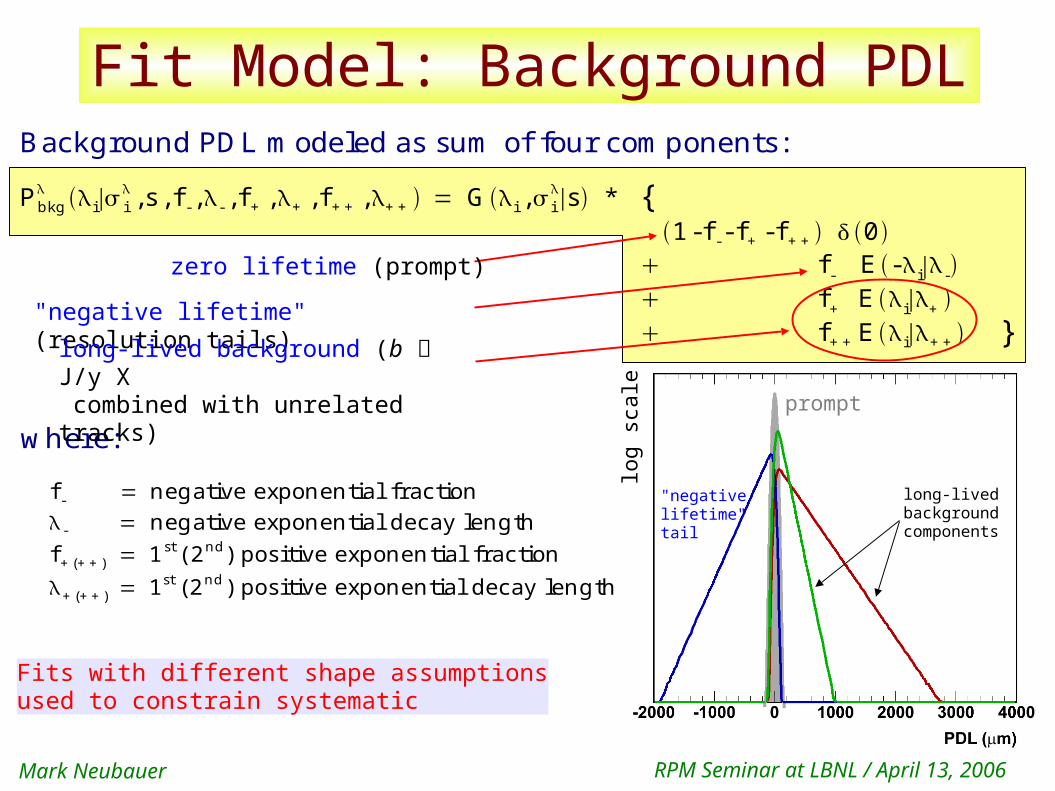
Fit Model: Background PDLBackground PDL modeled as sum of four components:
Pbkg i∣ i
,s , f - ,- ,f + ,+ ,f ++ ,++ = Gi , i∣s *
1-f -- f+ - f ++ 0 f - E-i∣- f+ Ei∣+ f++ Ei∣++
where:
f - = negative exponential fraction - = negative exponential decay length
f+(++) = 1st (2nd) positive exponential fraction
+(++) = 1st (2nd) positive exponential decay length
{
}
zero lifetime (prompt)
"negative lifetime" (resolution tails)
long-lived background (b J/y X combined with unrelated tracks)
Fits with different shape assumptionsused to constrain systematic
log
sca
le prompt
"negativelifetime"tail
long-livedbackgroundcomponents
Mark Neubauer RPM Seminar at LBNL / April 13, 2006
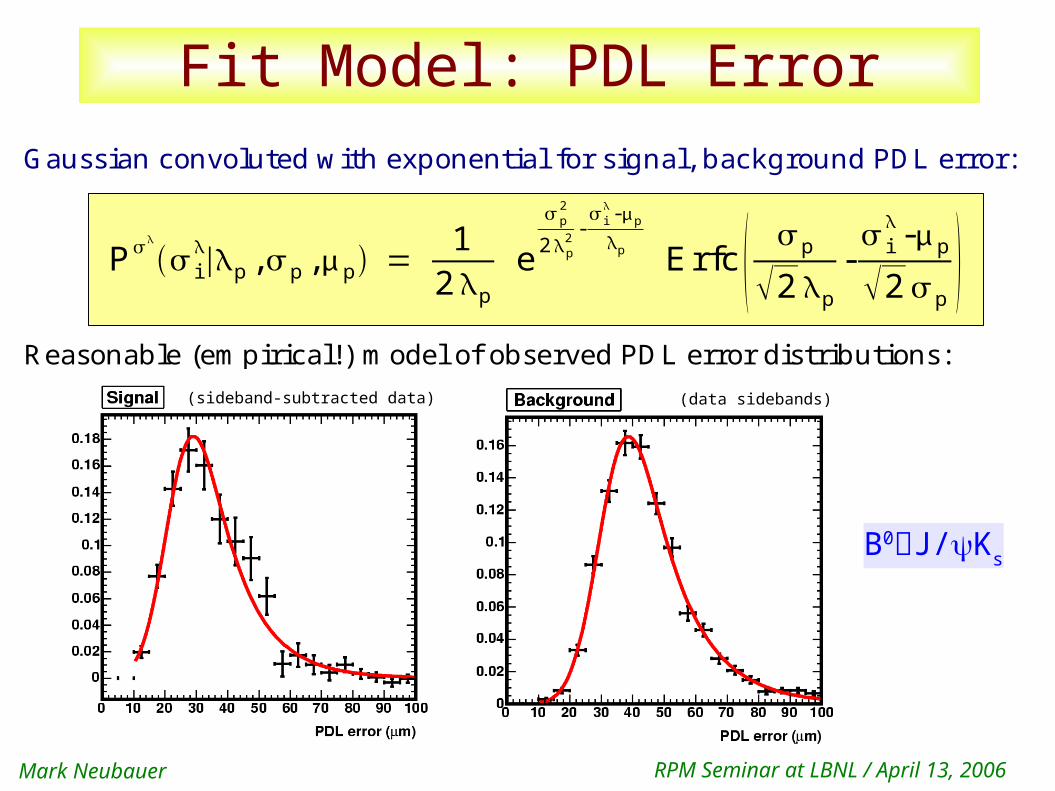
Fit Model: PDL ErrorGaussian convoluted with exponential for signal, background PDL error:
P
i∣p ,p ,p = 1
2p
e
p2
2p2- i
-p
p Erfc p
2p
- i
-p
2p
Reasonable (empirical!) model of observed PDL error distributions:
B0J/Ks
(sideband-subtracted data) (data sidebands)
Mark Neubauer RPM Seminar at LBNL / April 13, 2006
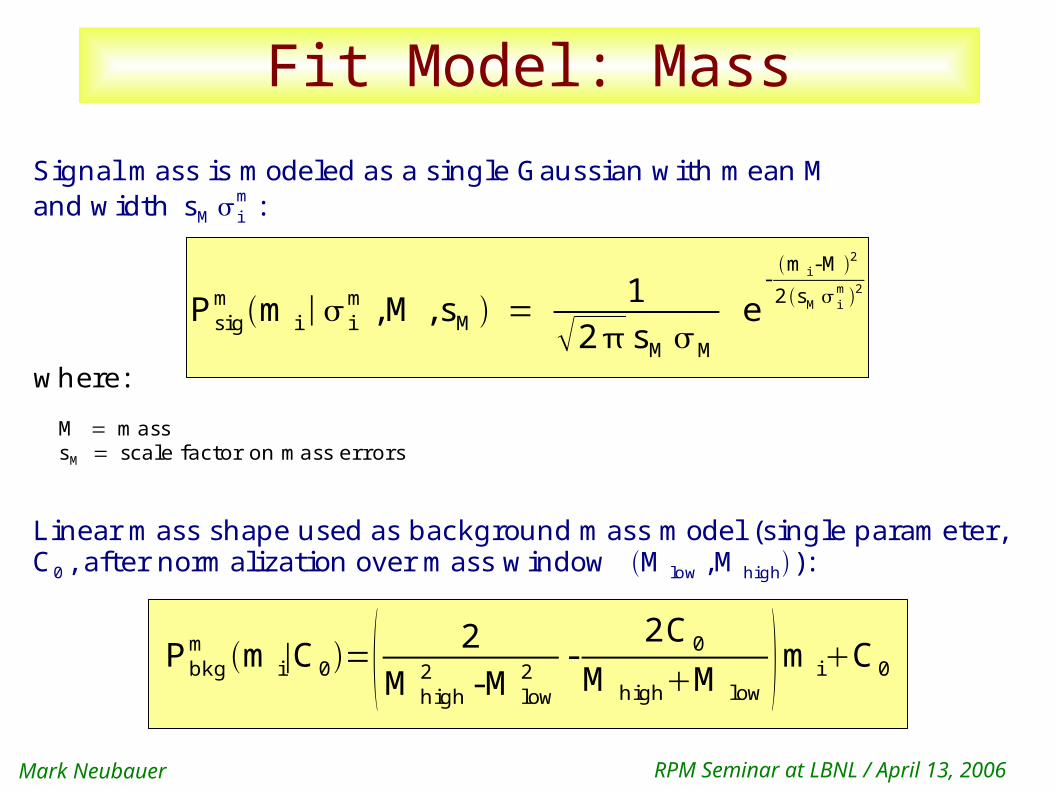
Fit Model: Mass
Signal mass is modeled as a single Gaussian with mean Mand width sM i
m :
Psigm m i ∣ i
m ,M,sM = 1
2 sMM
e-
mi -M2
2sM im2
where:
M = masssM = scale factor on mass errors
Linear mass shape used as background mass model (single parameter,C0 , after normalization over mass window Mlow ,Mhigh):
Pbkgm m i∣C0= 2
Mhigh2 -Mlow
2-
2C0
MhighMlow miC0
Mark Neubauer RPM Seminar at LBNL / April 13, 2006
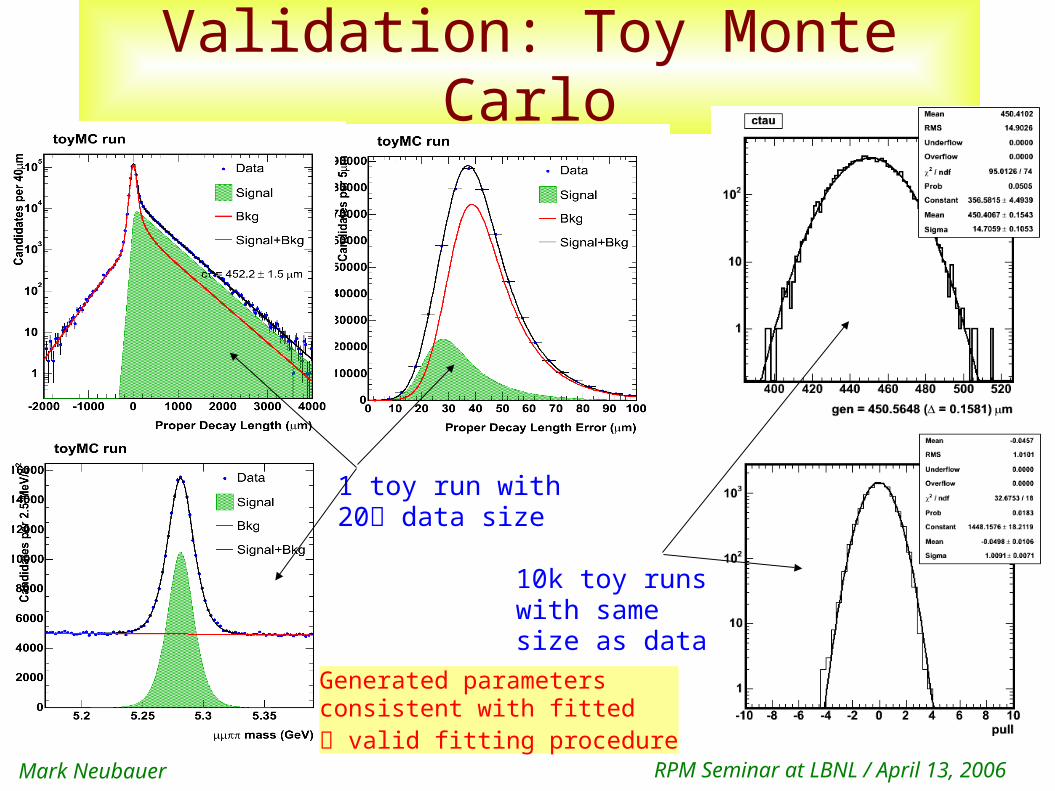
Validation: Toy Monte Carlo
10k toy runswith samesize as data
1 toy run with20 data size
Generated parameters consistent with fitted valid fitting procedure
Mark Neubauer RPM Seminar at LBNL / April 13, 2006
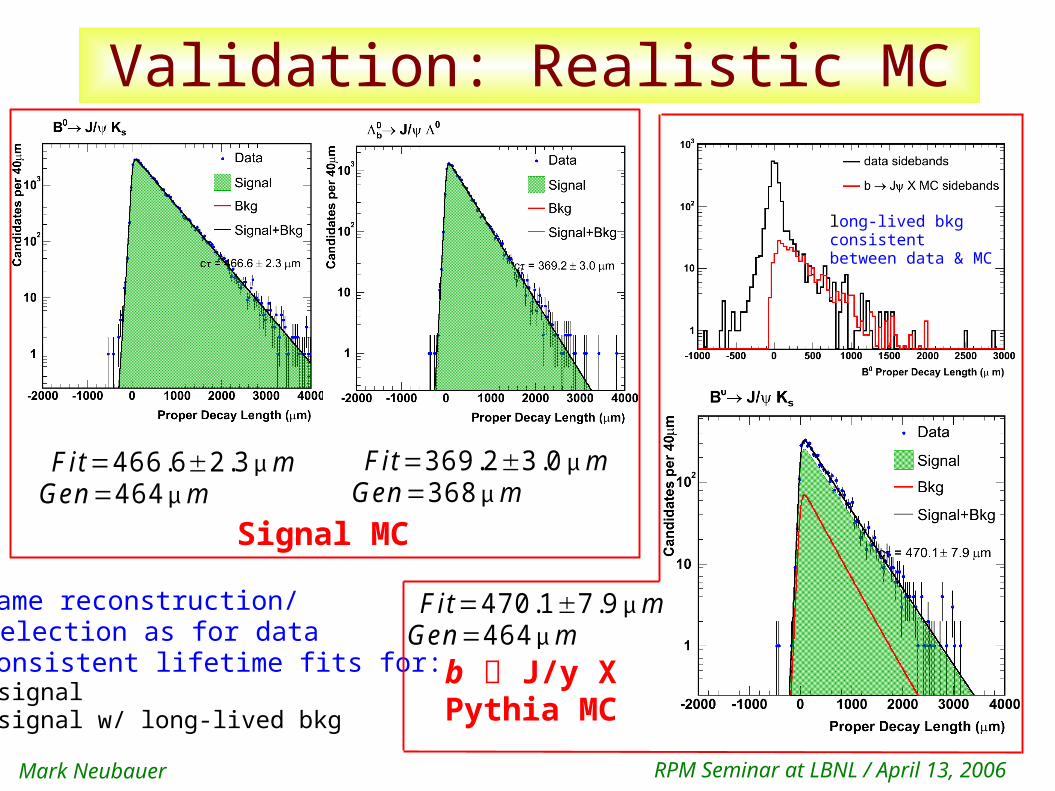
Validation: Realistic MC
Fit=466.6±2.3 mGen=464 m
Fit=369.2±3.0 mGen=368 m
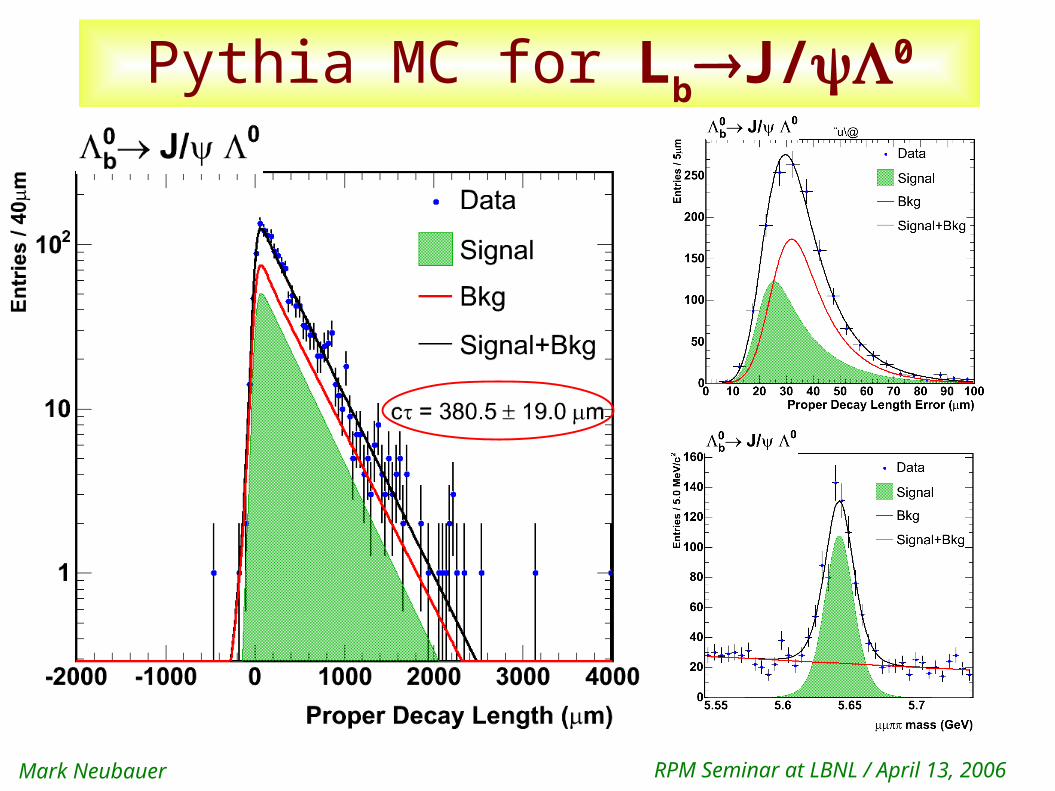
Fit=470.1±7.9 mGen=464 m
b J/y X Pythia MC
Signal MC
Same reconstruction/ selection as for data Consistent lifetime fits for:
signal signal w/ long-lived bkg
long-lived bkgconsistent between data & MC
Mark Neubauer RPM Seminar at LBNL / April 13, 2006
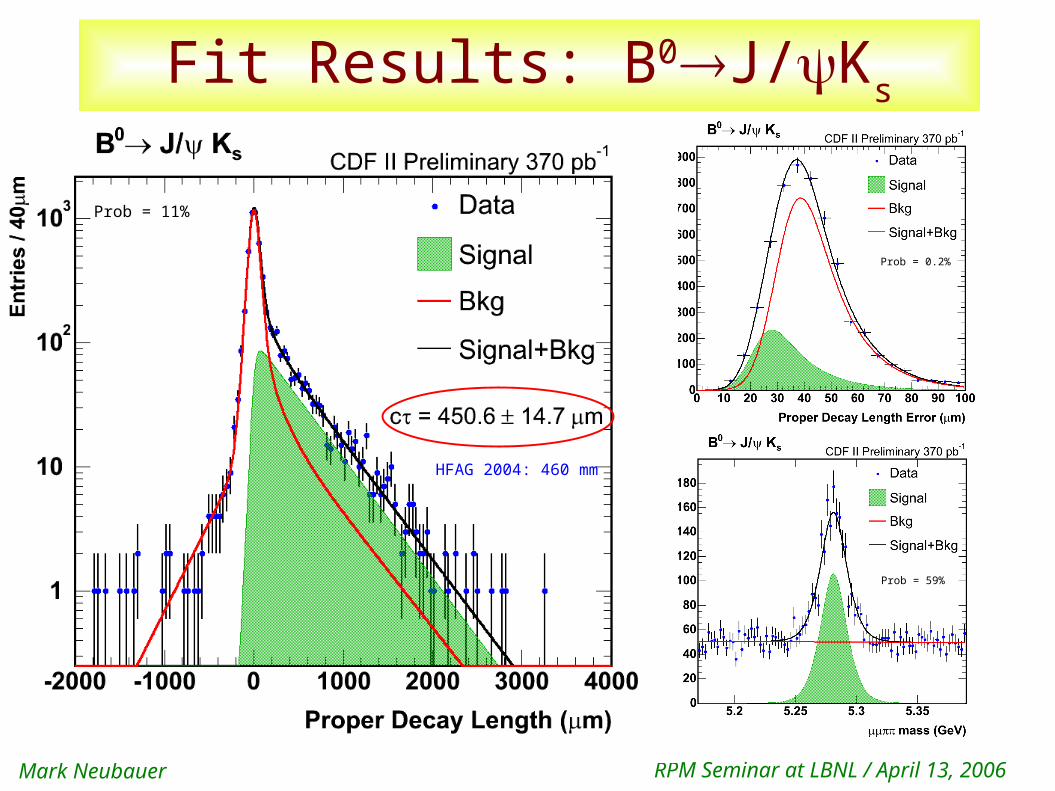
Fit Results: B0J/Ks
Prob = 11%
Prob = 0.2%
Prob = 59%
HFAG 2004: 460 mm
Mark Neubauer RPM Seminar at LBNL / April 13, 2006
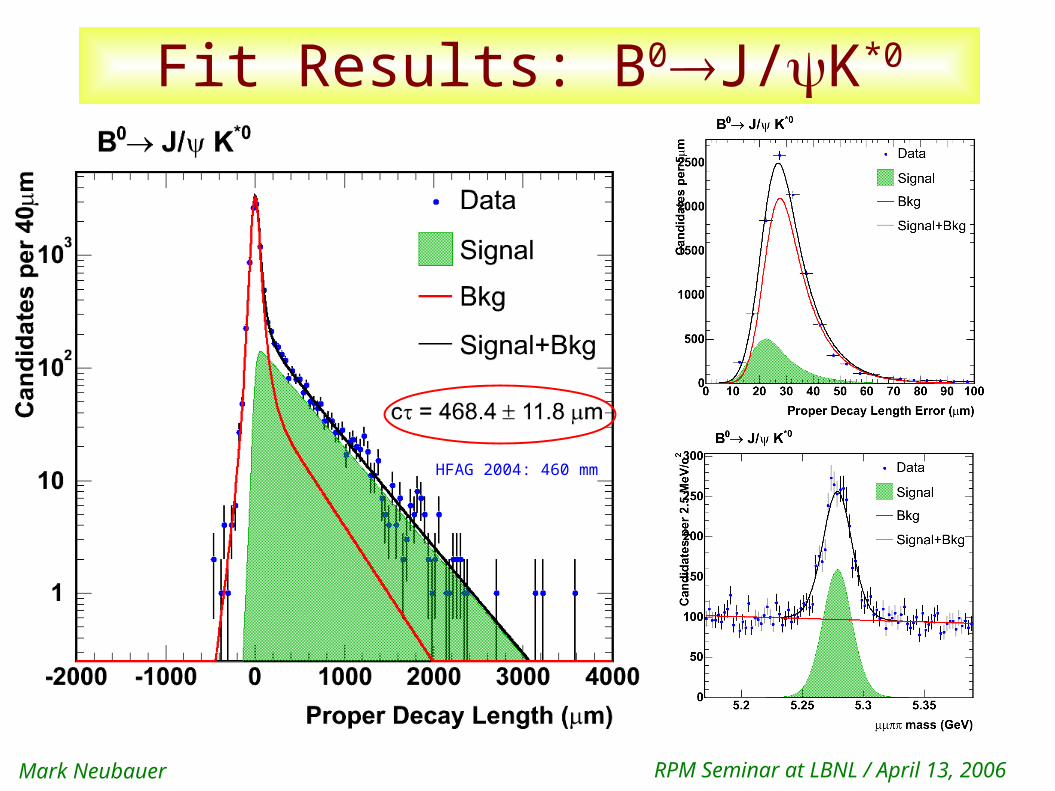
Fit Results: B0J/K*0
HFAG 2004: 460 mm
Mark Neubauer RPM Seminar at LBNL / April 13, 2006
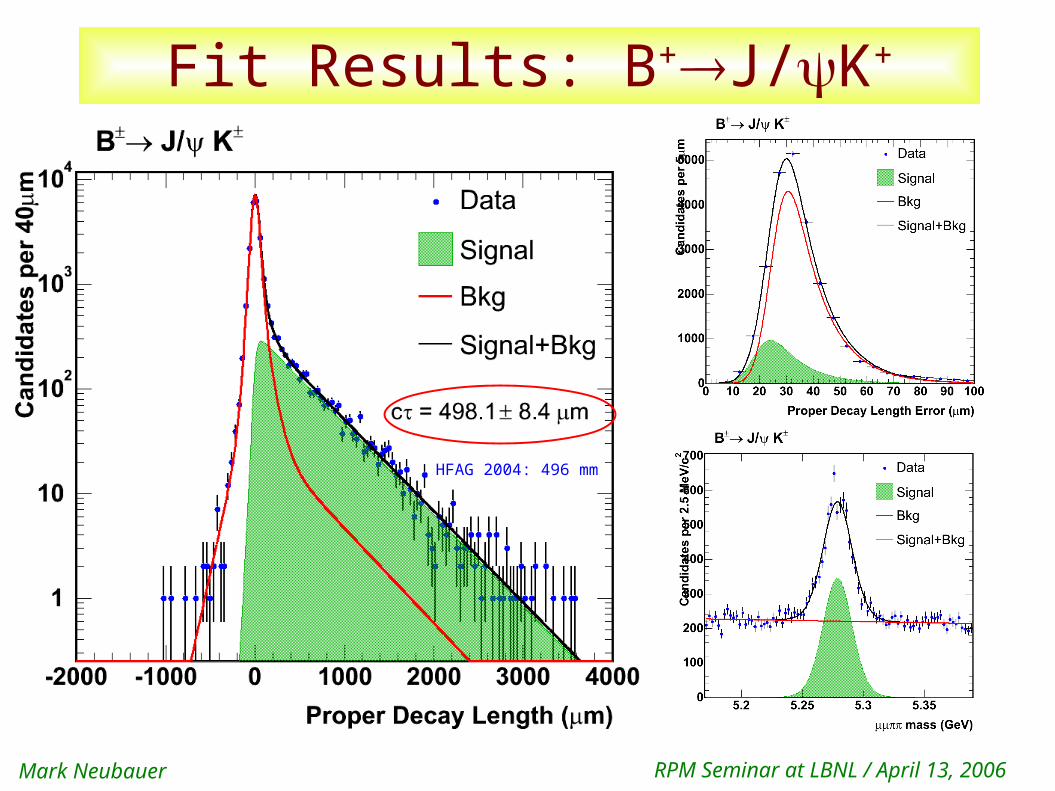
Fit Results: B+J/K+
HFAG 2004: 496 mm
Mark Neubauer RPM Seminar at LBNL / April 13, 2006
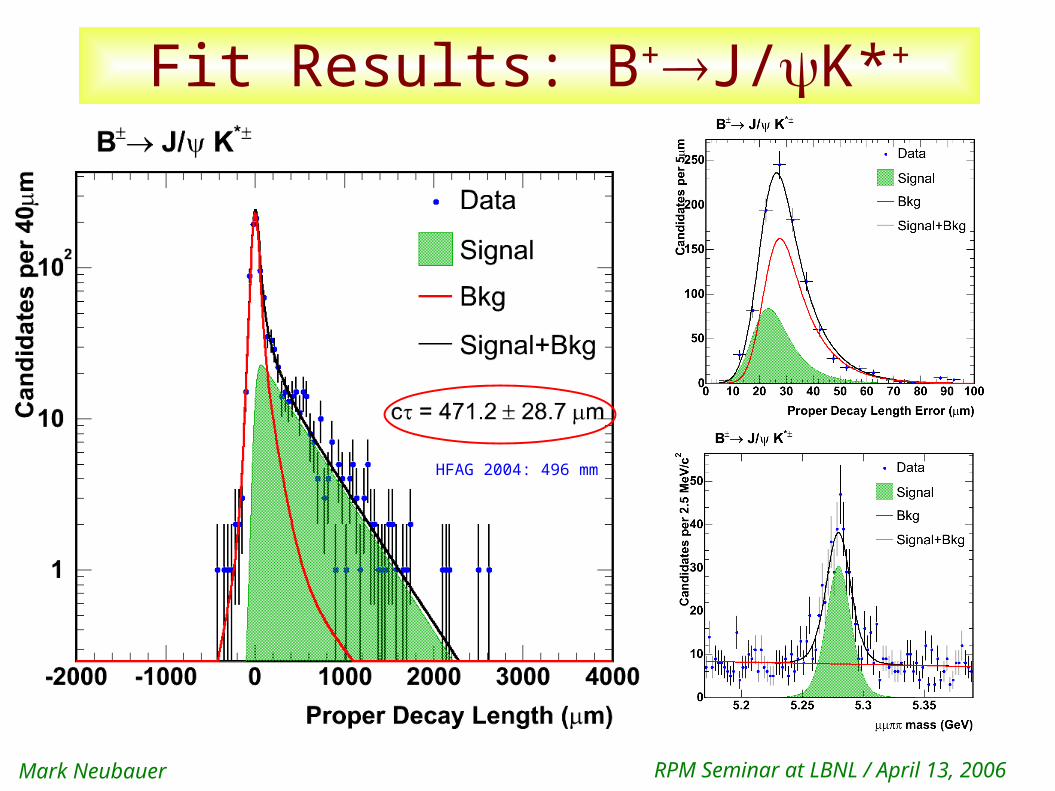
Fit Results: B+J/K*+
HFAG 2004: 496 mm
Mark Neubauer RPM Seminar at LBNL / April 13, 2006
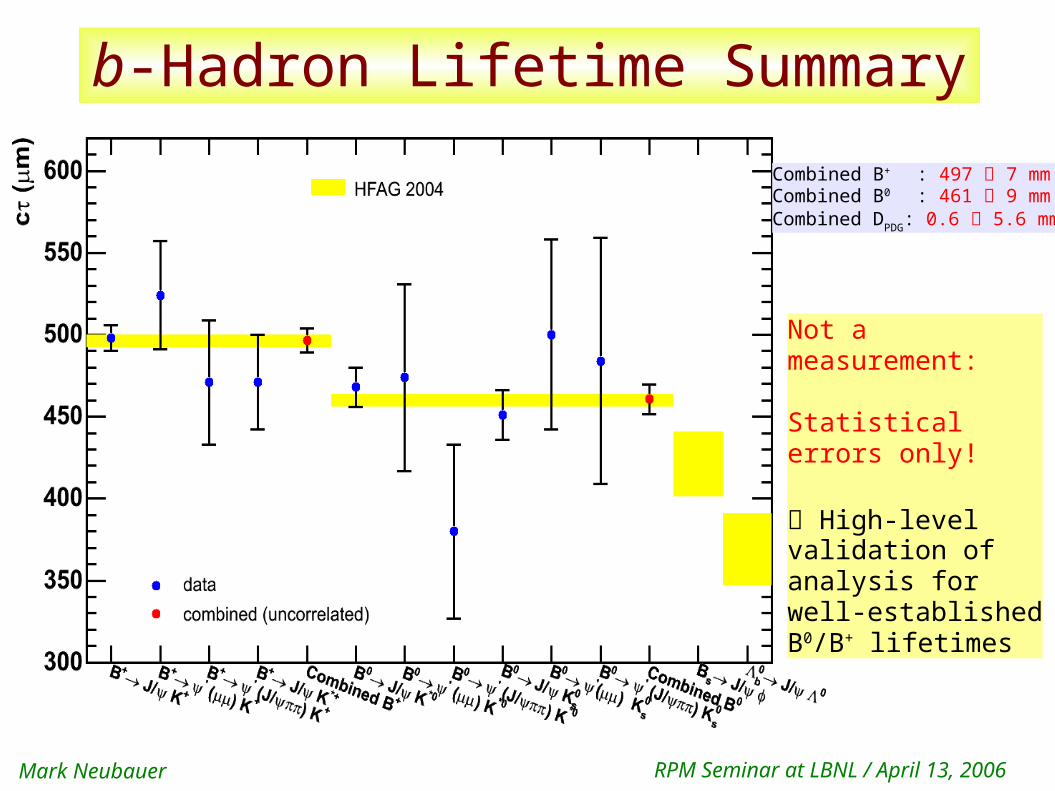
b-Hadron Lifetime Summary
Not a measurement:
Statistical errors only!
High-levelvalidation ofanalysis forwell-establishedB0/B+ lifetimes
Combined B+ : 497 7 mmCombined B0 : 461 9 mmCombined DPDG: 0.6 5.6 mm
Mark Neubauer RPM Seminar at LBNL / April 13, 2006
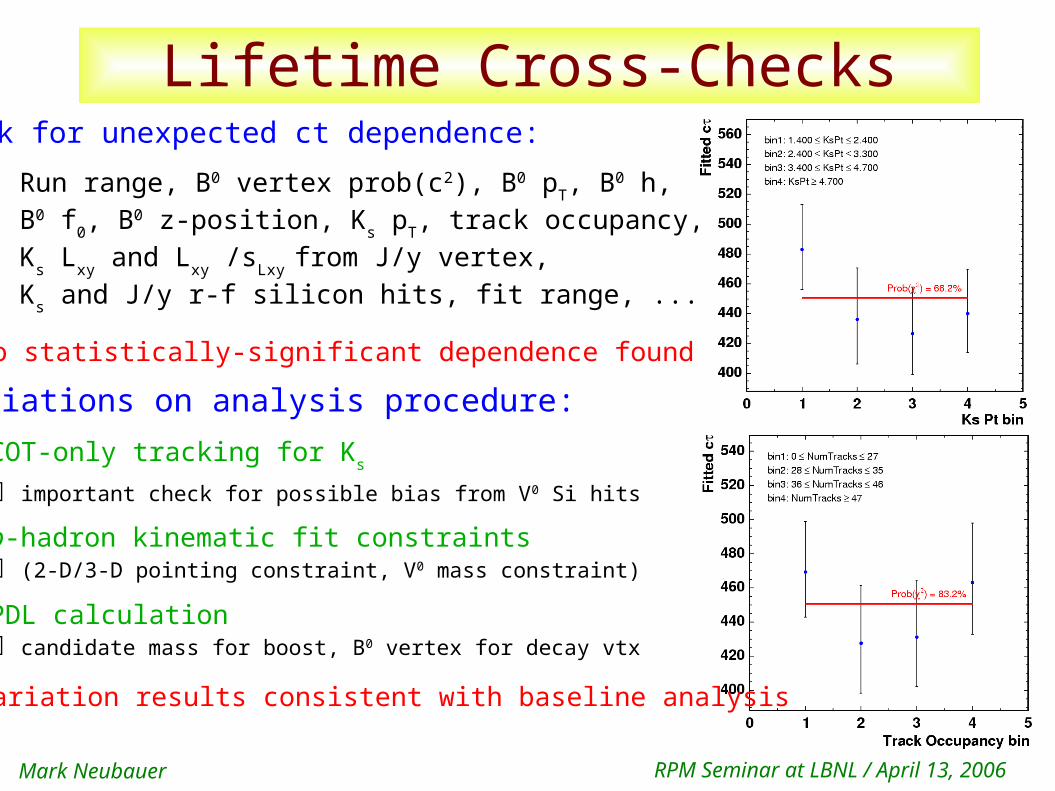
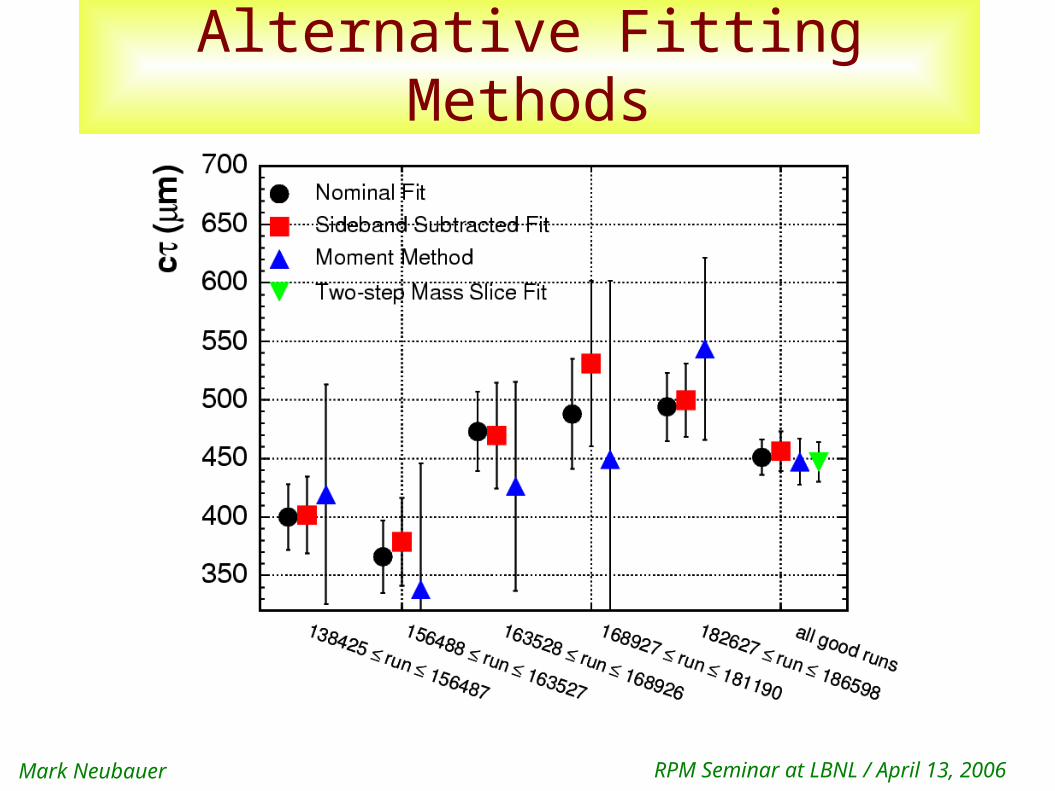
Lifetime Cross-ChecksLook for unexpected ct dependence:
Run range, B0 vertex prob(c2), B0 pT, B0 h,
B0 f0, B0 z-position, Ks pT, track occupancy,
Ks Lxy and Lxy /sLxy from J/y vertex, Ks and J/y r-f silicon hits, fit range, ...
No statistically-significant dependence found
Variations on analysis procedure: COT-only tracking for Ks
important check for possible bias from V0 Si hits
b-hadron kinematic fit constraints (2-D/3-D pointing constraint, V0 mass constraint)
PDL calculation candidate mass for boost, B0 vertex for decay vtx
Variation results consistent with baseline analysis
Mark Neubauer RPM Seminar at LBNL / April 13, 2006
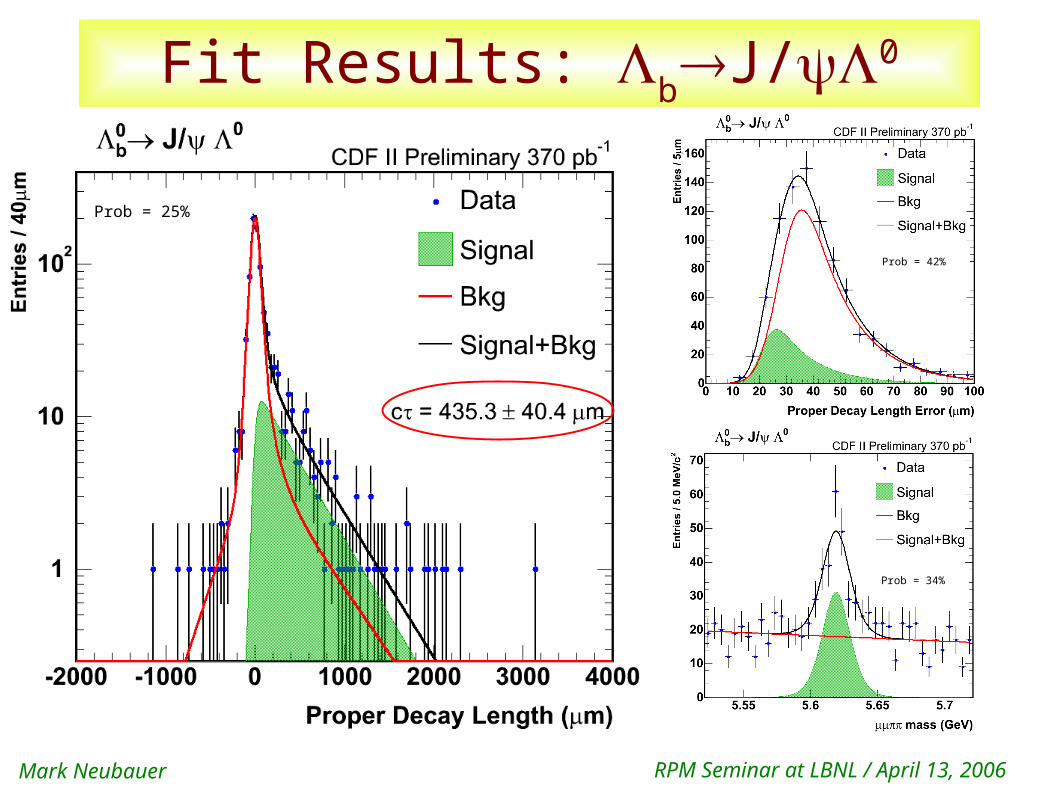
Fit Results: bJ/0
Prob = 25%
Prob = 42%
Prob = 34%
Mark Neubauer RPM Seminar at LBNL / April 13, 2006
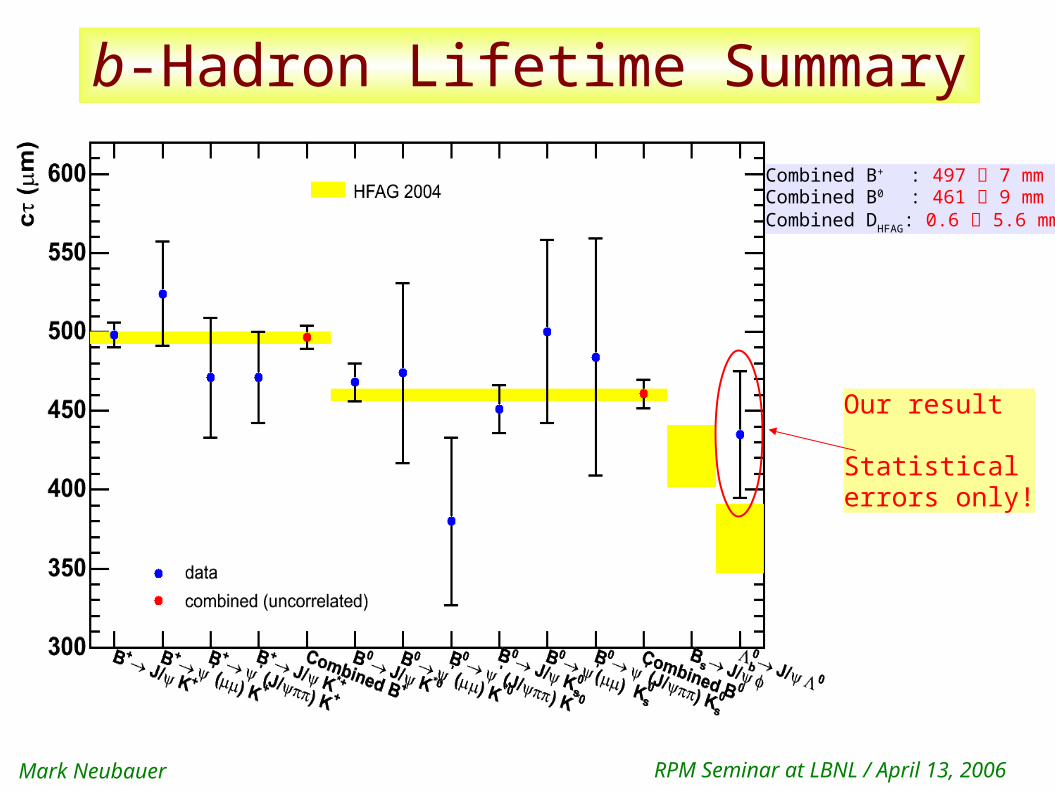
b-Hadron Lifetime Summary
Our result
Statistical errors only!
Combined B+ : 497 7 mmCombined B0 : 461 9 mmCombined DHFAG: 0.6 5.6 mm
Mark Neubauer RPM Seminar at LBNL / April 13, 2006
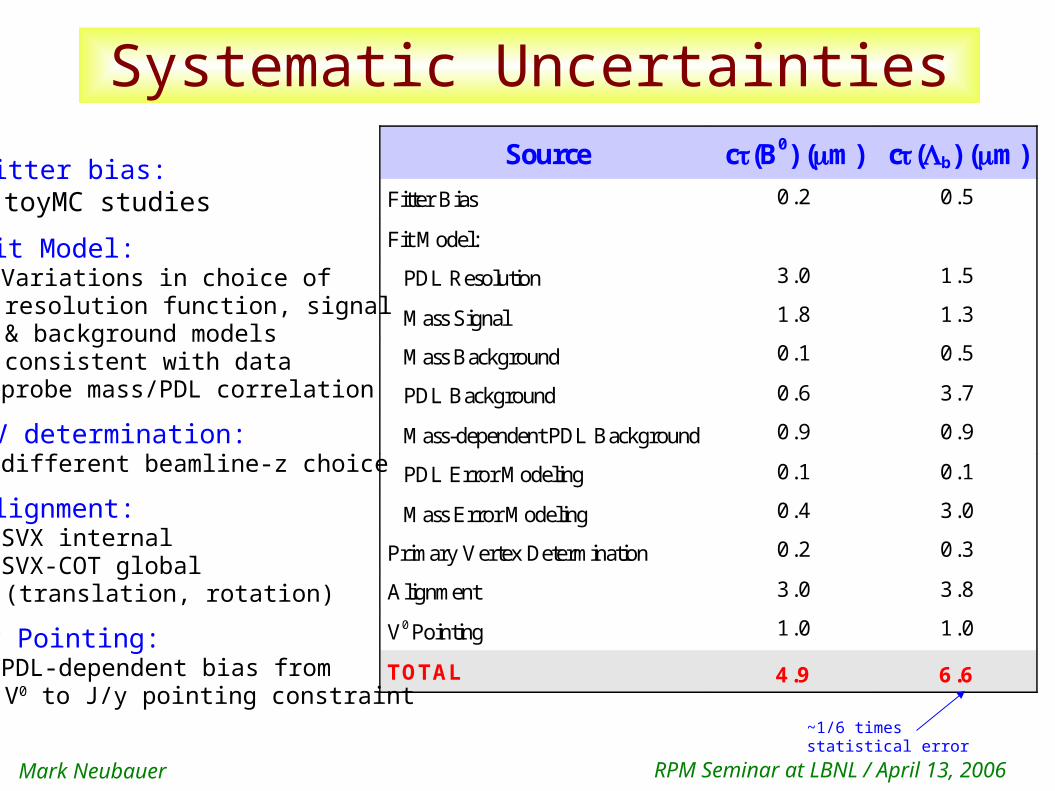
Systematic UncertaintiesSource c(B0) (m) c(b) (m)
Fitter Bias 0.2 0.5
Fit Model:
PDL Resolution 3.0 1.5
Mass Signal 1.8 1.3
Mass Background 0.1 0.5
PDL Background 0.6 3.7
Mass-dependent PDL Background 0.9 0.9
PDL Error Modeling 0.1 0.1
Mass Error Modeling 0.4 3.0
Primary Vertex Determination 0.2 0.3
Alignment 3.0 3.8
V0 Pointing 1.0 1.0
TOTAL 4.9 6.6
Fitter bias: toyMC studies
Fit Model: Variations in choice of resolution function, signal & background models consistent with data probe mass/PDL correlation
PV determination: different beamline-z choice
Alignment: SVX internal SVX-COT global (translation, rotation)
V0 Pointing: PDL-dependent bias from V0 to J/y pointing constraint
~1/6 timesstatistical error
Mark Neubauer RPM Seminar at LBNL / April 13, 2006
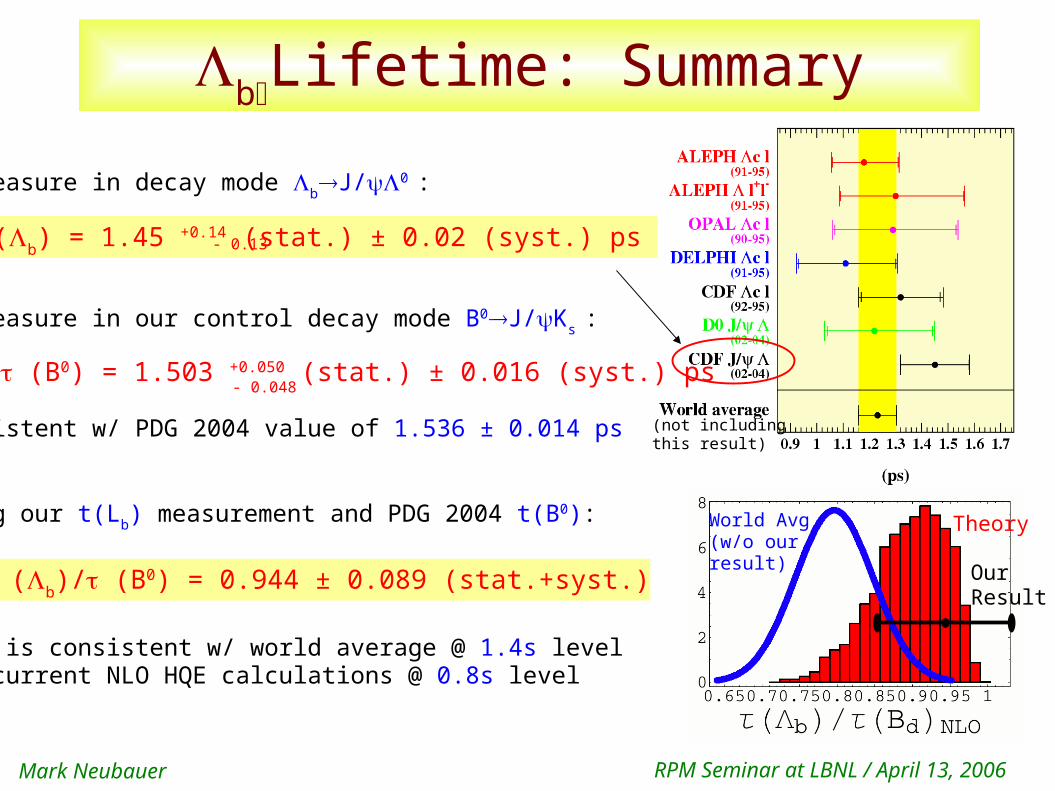
bLifetime: Summary
We measure in decay mode bJ/0 :
We measure in our control decay mode B0J/Ks :
(B0) = 1.503 +0.050 (stat.) ± 0.016 (syst.) ps
consistent w/ PDG 2004 value of 1.536 ± 0.014 ps
Using our t(Lb) measurement and PDG 2004 t(B0):
This is consistent w/ world average @ 1.4s leveland current NLO HQE calculations @ 0.8s level
- 0.048
(b) = 1.45 +0.14 (stat.) ± 0.02 (syst.) ps
(b)/ (B0) = 0.944 ± 0.089 (stat.+syst.)
(not including this result)
World Avg (w/o our result) Our
Result
Theory
- 0.13
Mark Neubauer RPM Seminar at LBNL / April 13, 2006
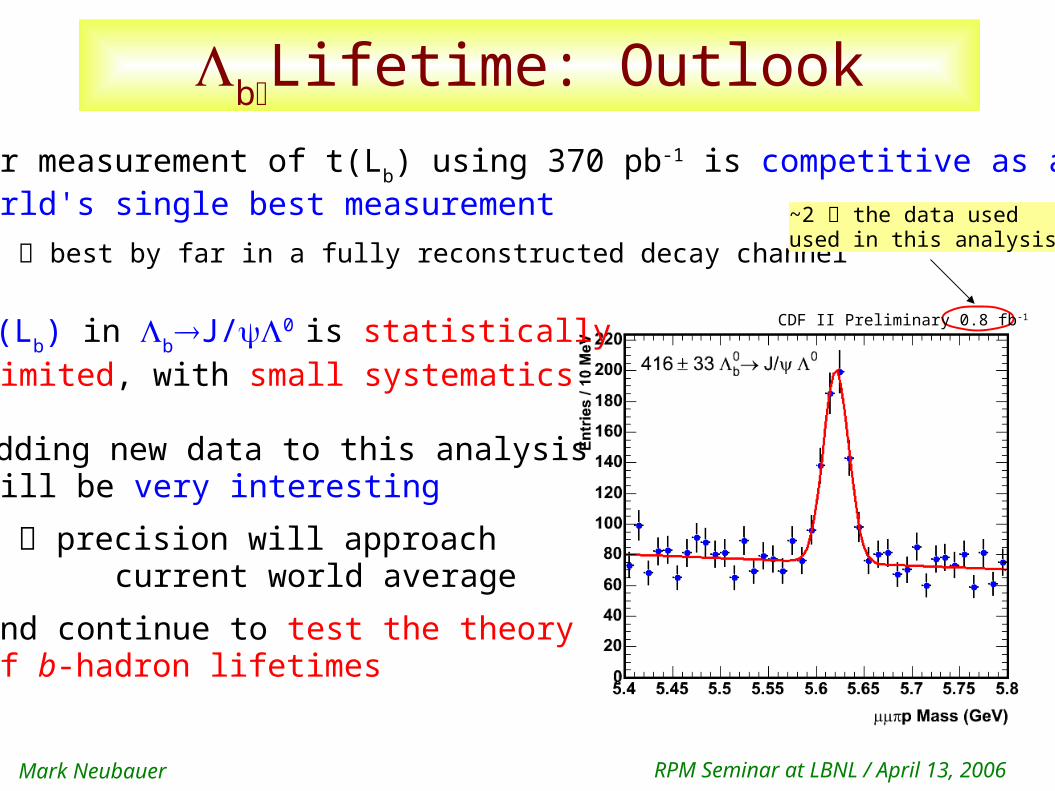
bLifetime: Outlook
Our measurement of t(Lb) using 370 pb-1 is competitive as a world's single best measurement
best by far in a fully reconstructed decay channel
t(Lb) in bJ/0 is statistically limited, with small systematics
Adding new data to this analysis will be very interesting
precision will approach current world average
and continue to test the theory of b-hadron lifetimes
~2 the data used used in this analysis
CDF II Preliminary 0.8 fb-1
Mark Neubauer RPM Seminar at LBNL / April 13, 2006
Extras
Mark Neubauer RPM Seminar at LBNL / April 13, 2006
Fermilab Accelerator
Mark Neubauer RPM Seminar at LBNL / April 13, 2006
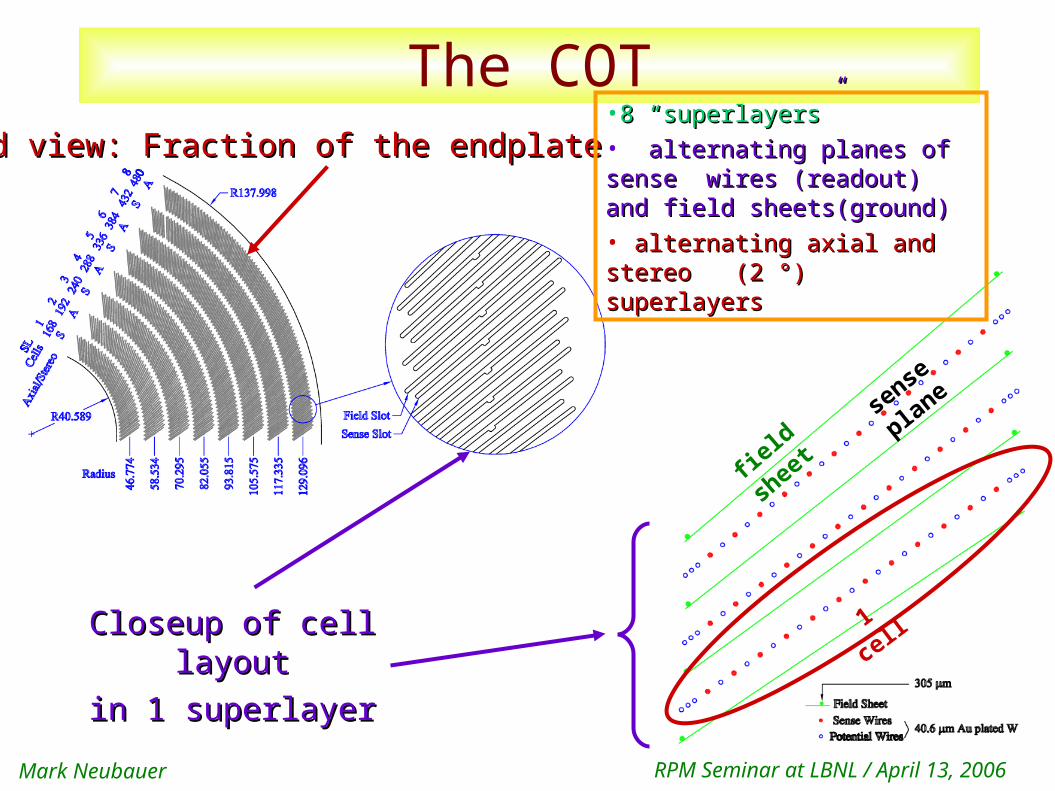
The COT•End view: Fraction of the endplateEnd view: Fraction of the endplate
Closeup of cell Closeup of cell layoutlayout
in 1 superlayerin 1 superlayer
1
cell
sense
plane
field
shee
t
•8 “superlayers8 “superlayers” ” • alternating planes of sense alternating planes of sense wires (readout) and field wires (readout) and field sheets(ground)sheets(ground)• alternating axial and stereo alternating axial and stereo (2 °) superlayers(2 °) superlayers
Mark Neubauer RPM Seminar at LBNL / April 13, 2006
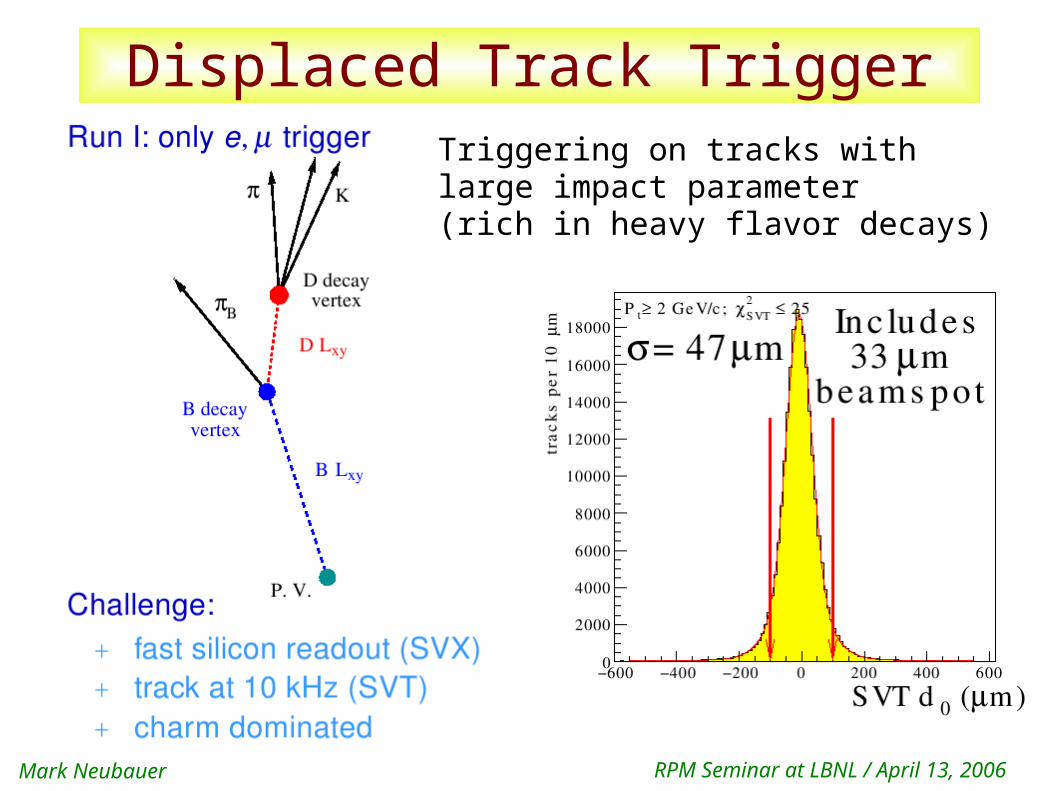
Displaced Track TriggerTriggering on tracks withlarge impact parameter(rich in heavy flavor decays)
Mark Neubauer RPM Seminar at LBNL / April 13, 2006
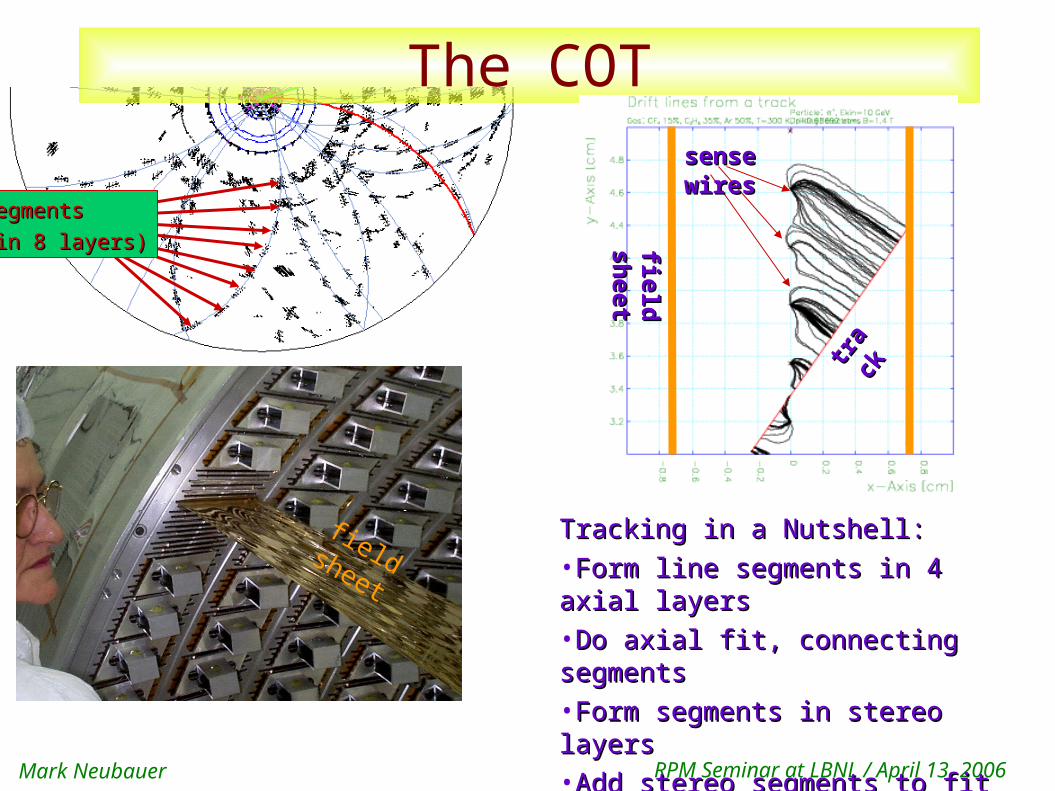
SegmentsSegments
(in 8 layers)(in 8 layers)
The COT
field
fi
eld
sh
eet
sh
eet
trac
trac
kk
field sheet
Tracking in a Nutshell:Tracking in a Nutshell:•Form line segments in 4 axial Form line segments in 4 axial layerslayers•Do axial fit, connecting Do axial fit, connecting segmentssegments•Form segments in stereo Form segments in stereo layerslayers•Add stereo segments to fitAdd stereo segments to fitFinal fitFinal fit
sense sense wireswires
Mark Neubauer RPM Seminar at LBNL / April 13, 2006
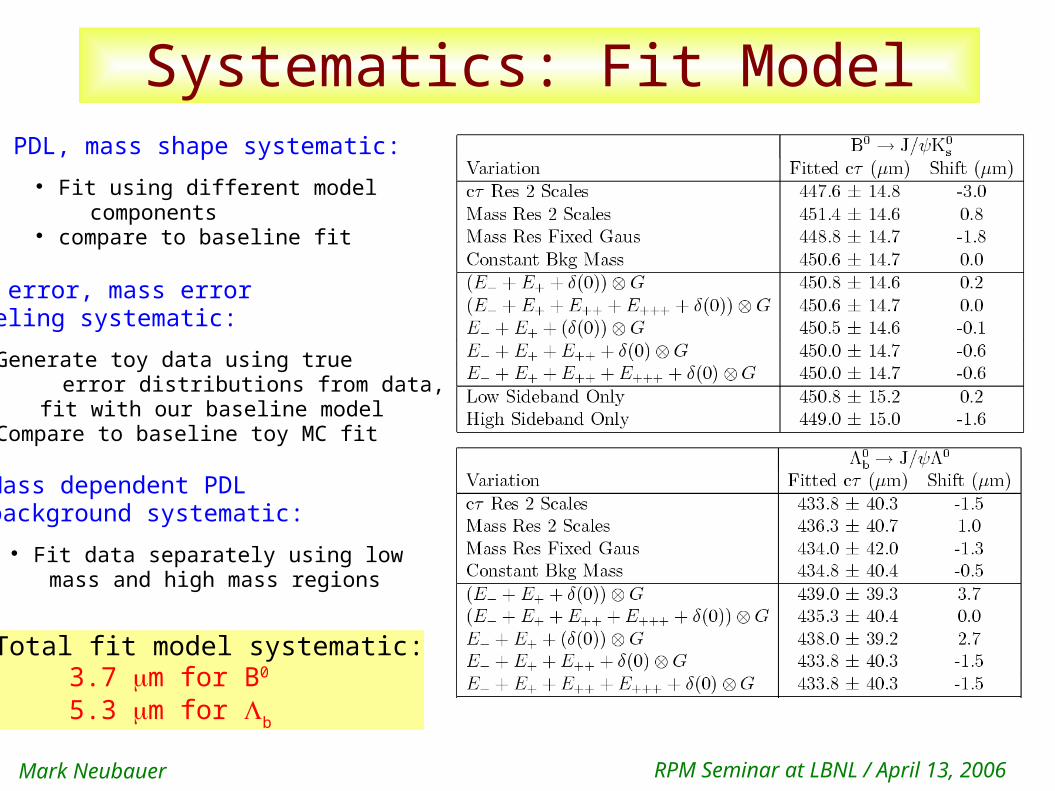
Systematics: Fit ModelPDL, mass shape systematic:
Fit using different model components
compare to baseline fit
PDL error, mass error modeling systematic:
Generate toy data using true error distributions from data,
fit with our baseline model Compare to baseline toy MC fit
Total fit model systematic:3.7 m for B0
5.3 m for b
Mass dependent PDLbackground systematic:
Fit data separately using low mass and high mass regions
Mark Neubauer RPM Seminar at LBNL / April 13, 2006
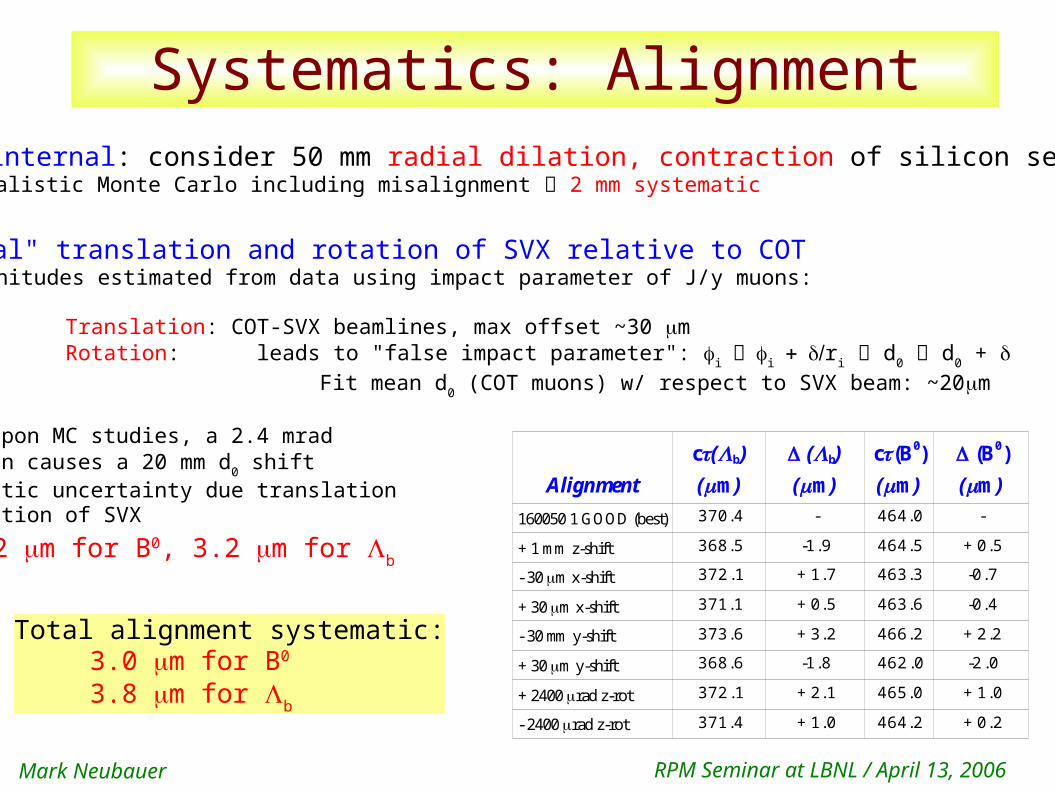
Systematics: AlignmentSVX internal: consider 50 mm radial dilation, contraction of silicon sensors
Realistic Monte Carlo including misalignment 2 mm systematic
"Global" translation and rotation of SVX relative to COT Magnitudes estimated from data using impact parameter of J/y muons:
Translation: COT-SVX beamlines, max offset ~30 m Rotation: leads to "false impact parameter": iiri d0 d0 +
Fit mean d0 (COT muons) w/ respect to SVX beam: ~20m
Based upon MC studies, a 2.4 mradrotation causes a 20 mm d0 shiftSystematic uncertainty due translationor rotation of SVX
2.2 m for B0, 3.2 m for b
Total alignment systematic:3.0 m for B0
3.8 m for b
Alignment
c(b)
(m)
D(b)
(m)
c(B0)
(m)
D(B0)
(m)
160050 1 GOOD (best) 370.4 - 464.0 -
+ 1 mm z-shift 368.5 -1.9 464.5 +0.5
- 30 m x-shift 372.1 +1.7 463.3 -0.7
+ 30 m x-shift 371.1 +0.5 463.6 -0.4
- 30 mm y-shift 373.6 +3.2 466.2 +2.2
+ 30 m y-shift 368.6 -1.8 462.0 -2.0
+ 2400 rad z-rot 372.1 +2.1 465.0 +1.0
- 2400 rad z-rot 371.4 +1.0 464.2 +0.2
Mark Neubauer RPM Seminar at LBNL / April 13, 2006
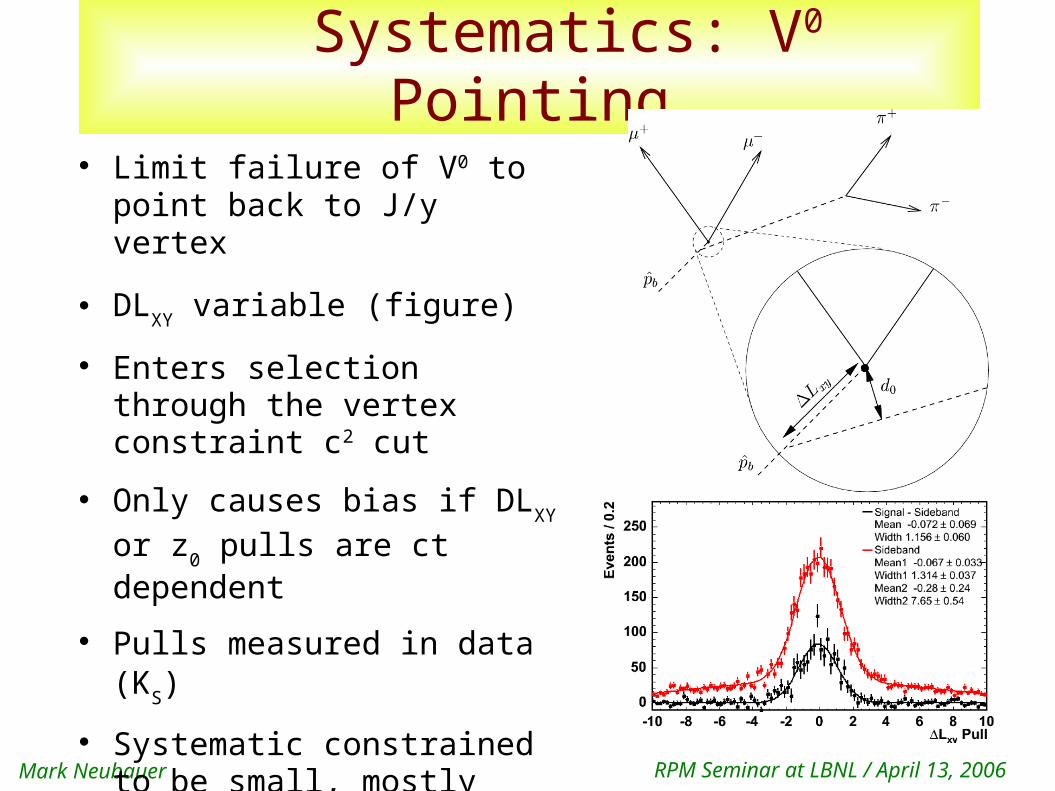
Systematics: V0 Pointing Limit failure of V0 to point
back to J/y vertex
DLXY variable (figure)
Enters selection through the vertex constraint c2 cut
Only causes bias if DLXY or z0 pulls are ct dependent
Pulls measured in data (KS)
Systematic constrained to be small, mostly because probability cut 10-4 is loose
Mark Neubauer RPM Seminar at LBNL / April 13, 2006
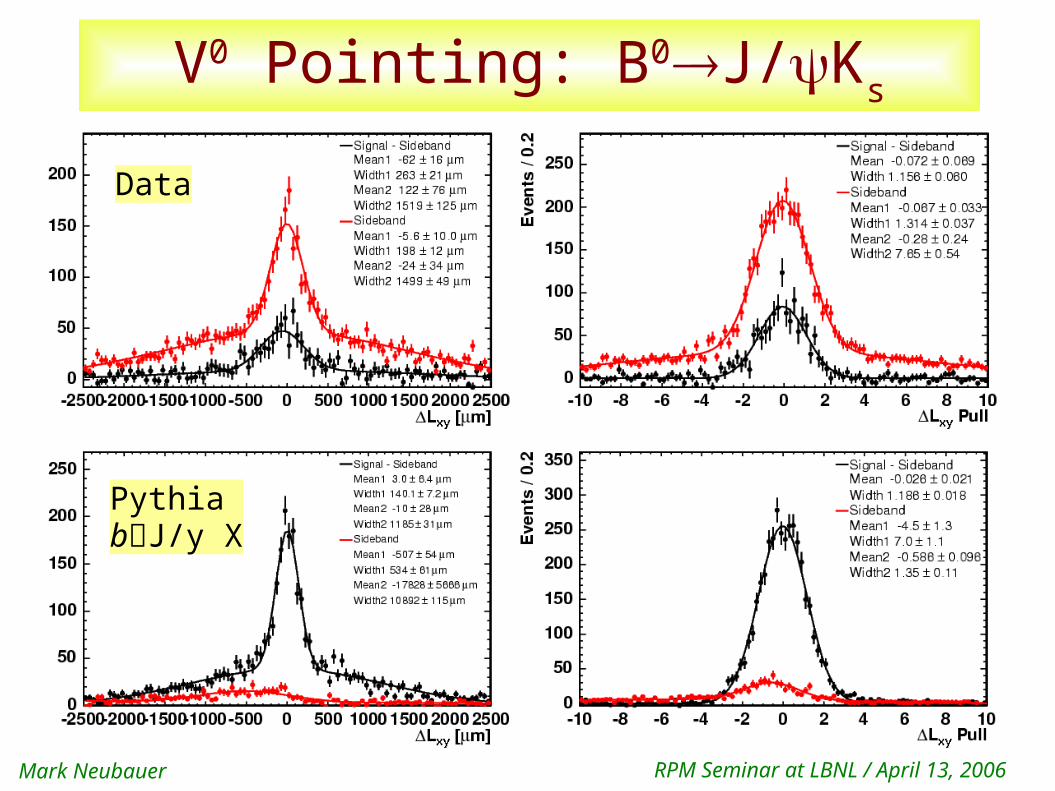
V0 Pointing: B0J/Ks
PythiabJ/y X
Data
Mark Neubauer RPM Seminar at LBNL / April 13, 2006
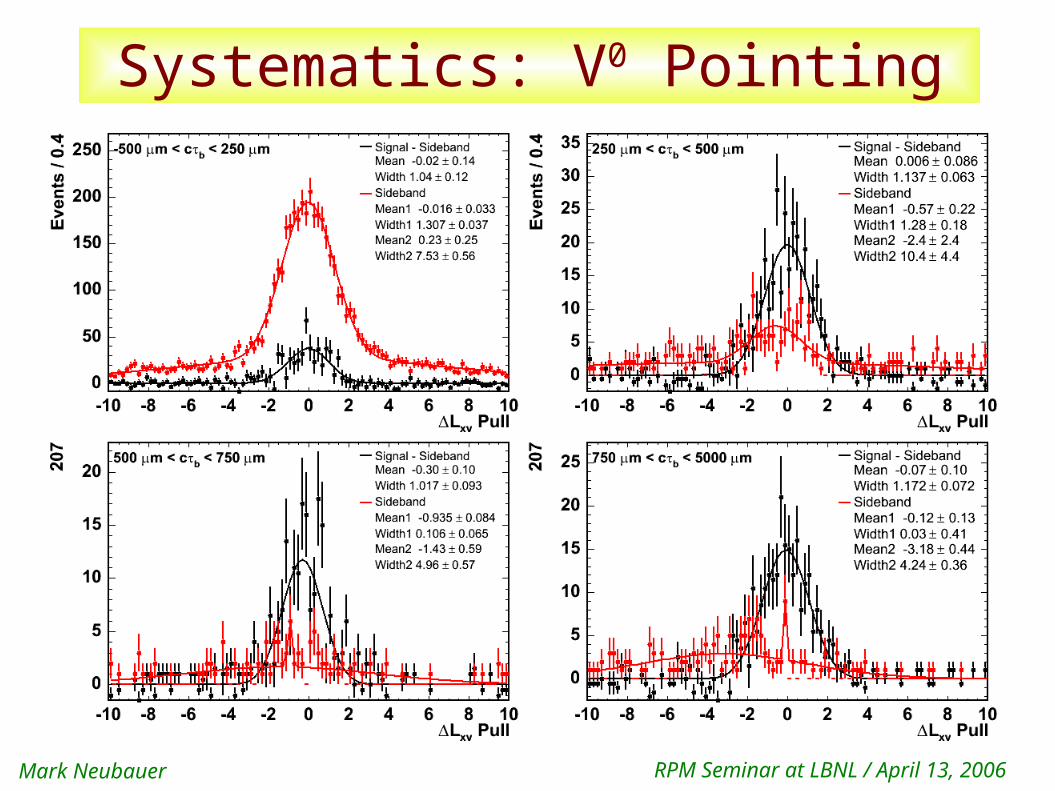
Systematics: V0 Pointing
Mark Neubauer RPM Seminar at LBNL / April 13, 2006
Systematics: V0 Pointing
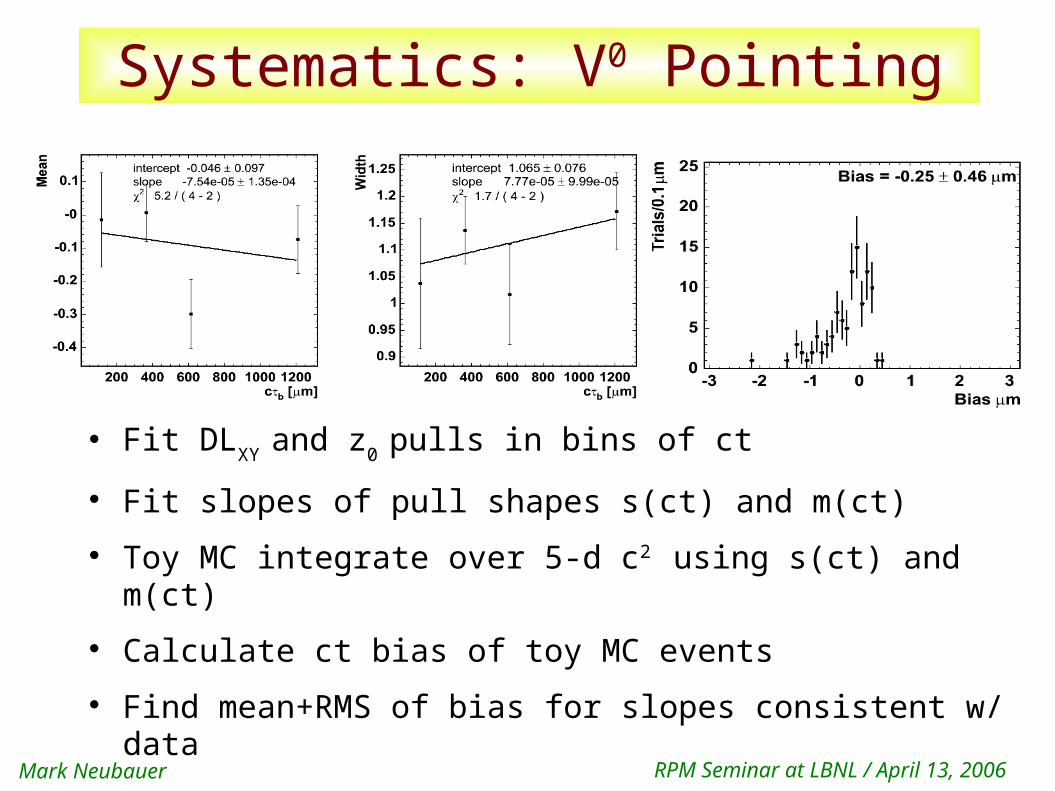
Fit DLXY and z0 pulls in bins of ct
Fit slopes of pull shapes s(ct) and m(ct)
Toy MC integrate over 5-d c2 using s(ct) and m(ct)
Calculate ct bias of toy MC events
Find mean+RMS of bias for slopes consistent w/ data
Mark Neubauer RPM Seminar at LBNL / April 13, 2006
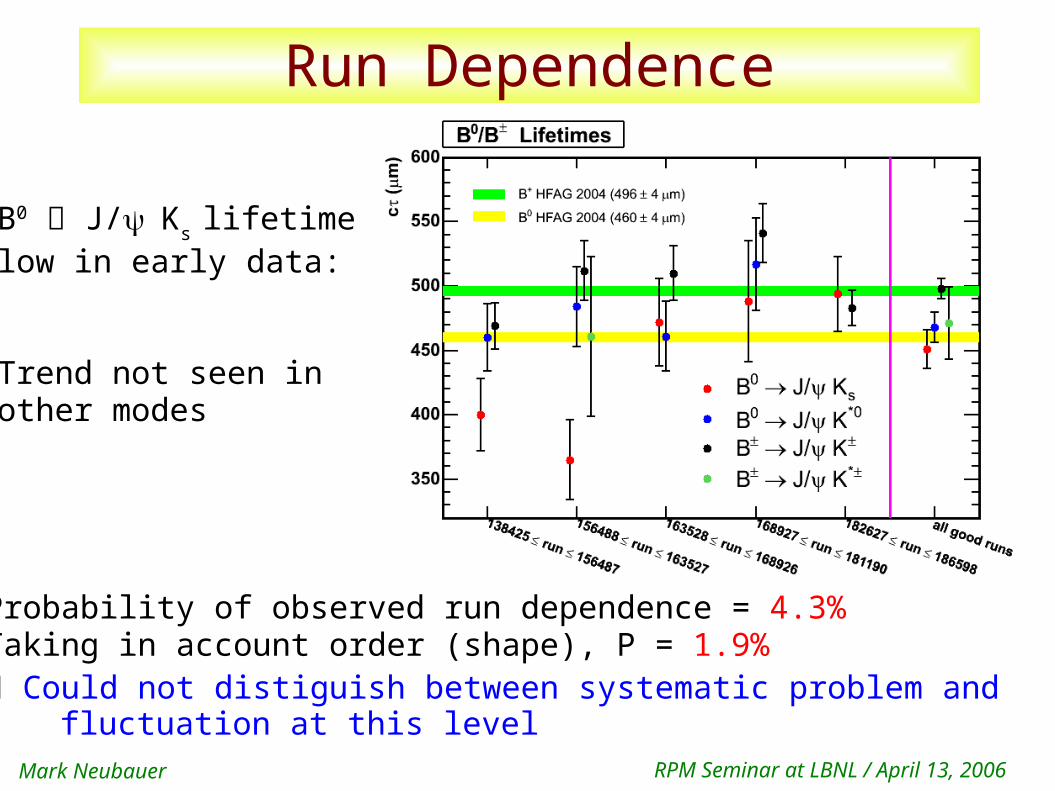
Run Dependence
B0 J/Ks lifetime low in early data:
Trend not seen in other modes
Probability of observed run dependence = 4.3%Taking in account order (shape), P = 1.9% Could not distiguish between systematic problem and
fluctuation at this level
Mark Neubauer RPM Seminar at LBNL / April 13, 2006
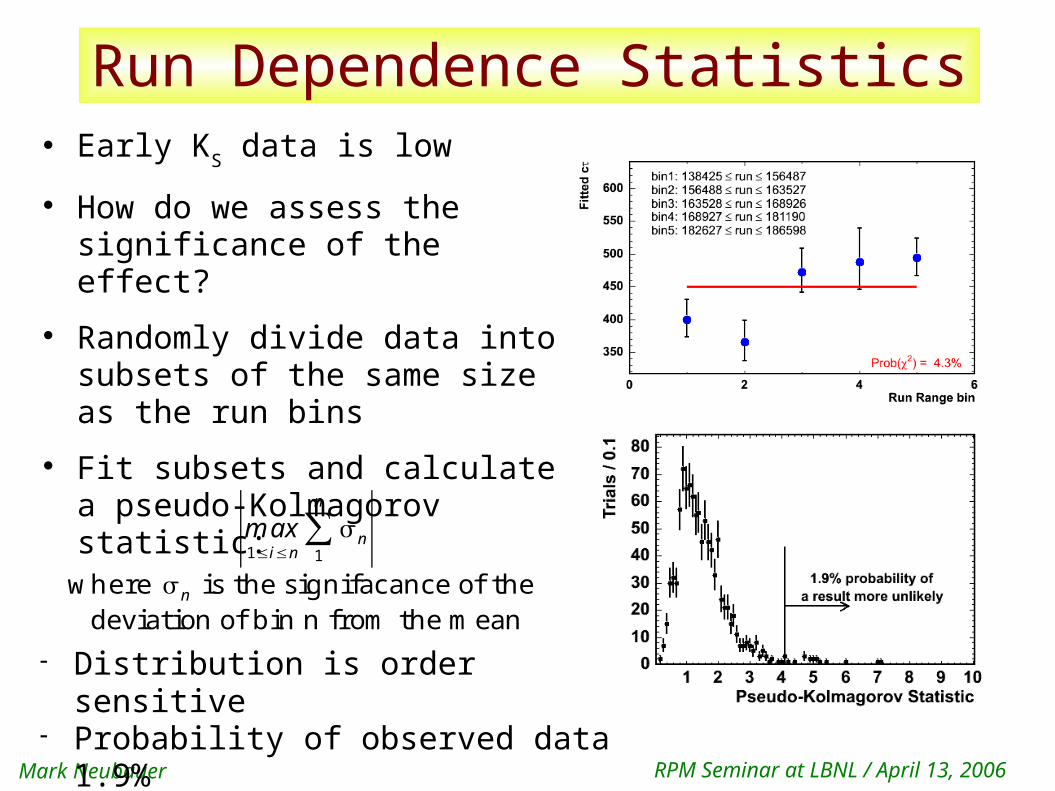
Run Dependence Statistics Early KS data is low
How do we assess the significance of the effect?
Randomly divide data into subsets of the same size as the run bins
Fit subsets and calculate a pseudo-Kolmagorov statistic:
∣max1≤i≤n
∑1
n
n∣where n is the signifacance of the deviation of bin n from the mean
Distribution is order sensitive Probability of observed data 1.9%
Mark Neubauer RPM Seminar at LBNL / April 13, 2006
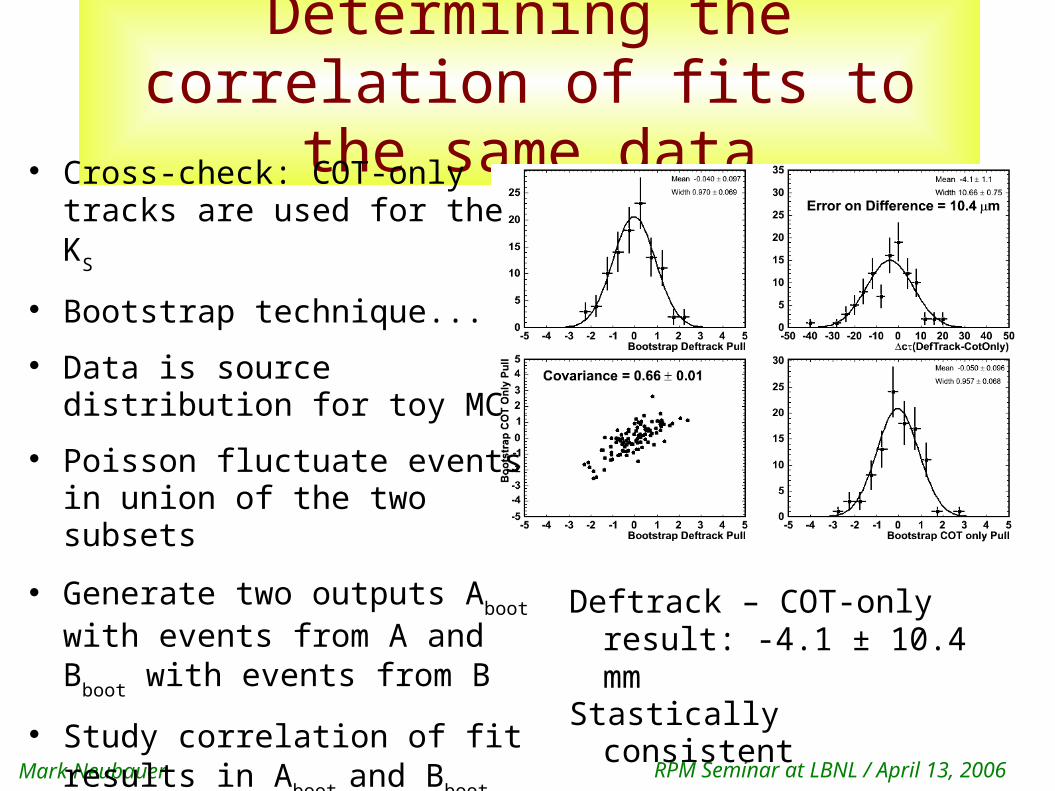
Determining the correlation of fits to the same data
Cross-check: COT-only tracks are used for the KS
Bootstrap technique...
Data is source distribution for toy MC
Poisson fluctuate events in union of the two subsets
Generate two outputs Aboot with events from A and Bboot with events from B
Study correlation of fit results in Aboot and Bboot
Deftrack – COT-only result: -4.1 ± 10.4 mm
Stastically consistent
Mark Neubauer RPM Seminar at LBNL / April 13, 2006
Fit Model: "Punzi Effect"Psig,bkg=Psig,bkg
i∣i , Psig,bkg
i∣Psig,bkg
m mi∣im ,Psig,bkg
m im∣
Previous analyses ignore Psig ,bkg
i∣ and Psig ,bkg
m im∣ terms in the PDF
If signal and background differ in i or i
m (which they do), you just biased in f b and c !
° Pointed out in e-print physics/0401045 and extensively studied within our group
Used toy Monte Carlo generated with true error distributions (but fit w/o)to measure biases
° c biases in the range of 4 - 7 m depending upon decay mode
Right thing to do is keep Psig,bkg
i∣ in the likelihood fit
° Psig ,bkgm i
m∣ can essentially be ignored for our analysis
Final form of the overall PDF used in our c fits:
Psig,bkg=Psig,bkg i∣ i
,Psig,bkg
i∣Psig,bkg
m mi∣ im ,
Observed shifts using this in LH function compared to wrong PDF consistentwith toy MC results
Mark Neubauer RPM Seminar at LBNL / April 13, 2006
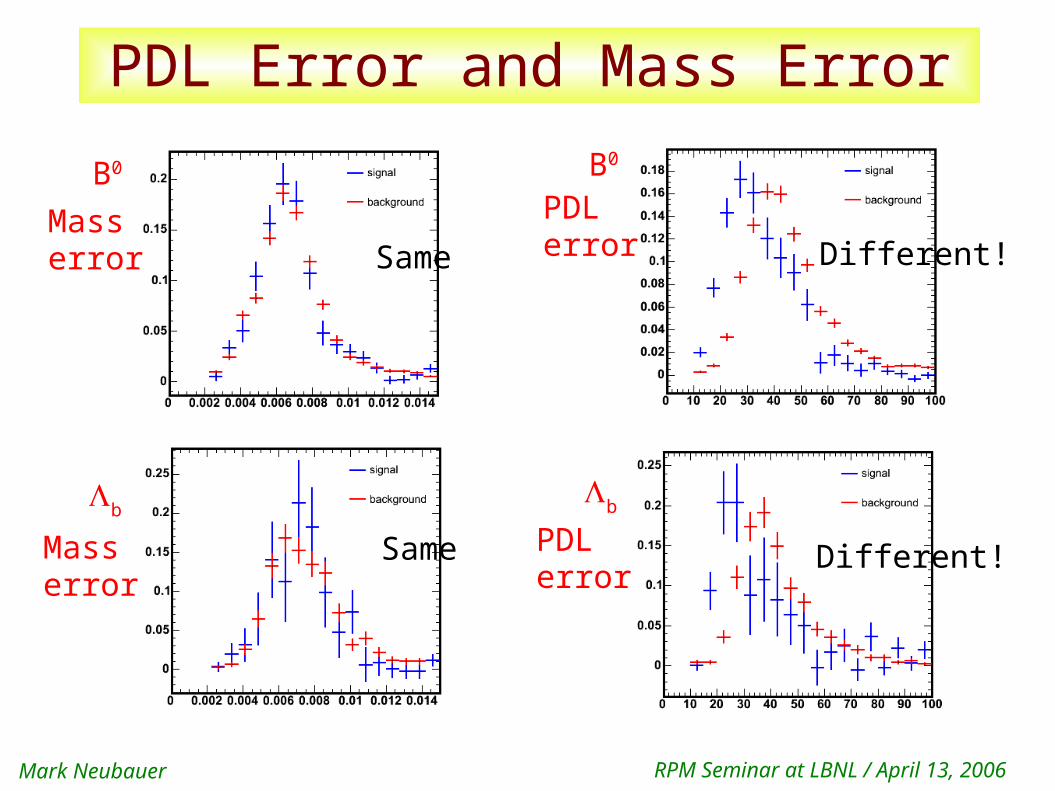
PDL Error and Mass Error
B0
bb
B0
Masserror
PDLerror
Masserror
PDLerrorSame
Same
Different!
Different!
Mark Neubauer RPM Seminar at LBNL / April 13, 2006
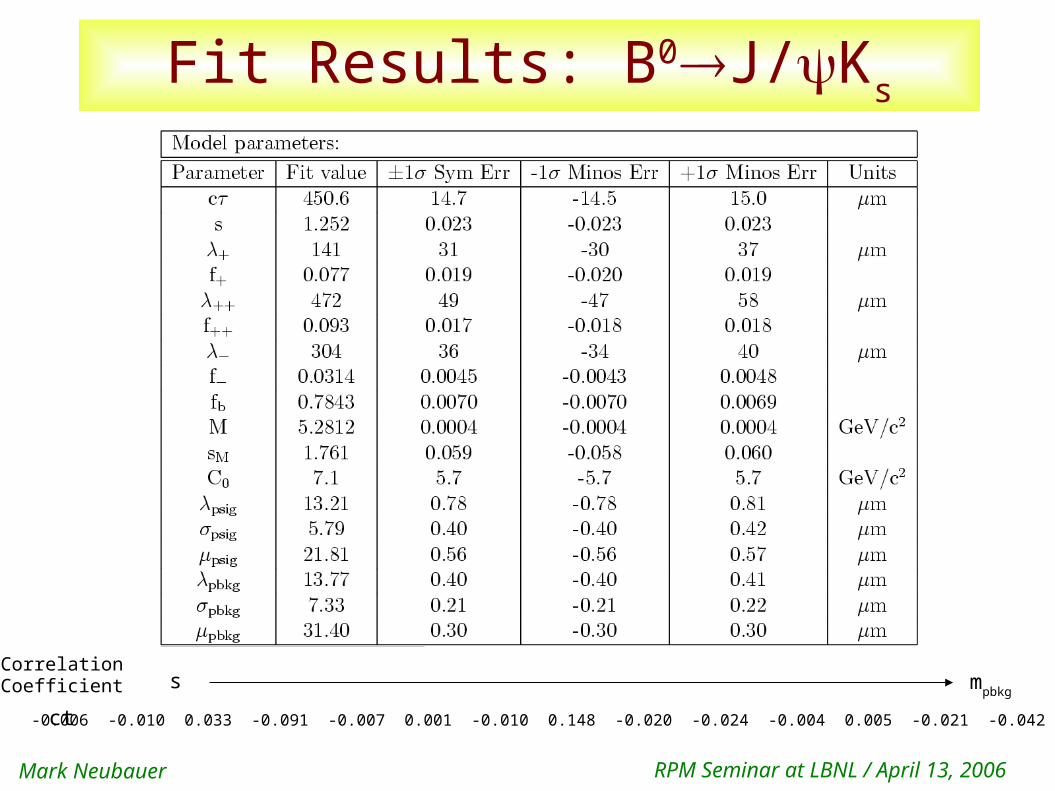
Fit Results: B0J/Ks
-0.006 -0.010 0.033 -0.091 -0.007 0.001 -0.010 0.148 -0.020 -0.024 -0.004 0.005 -0.021 -0.042 -0.002
CorrelationCoefficient
ct
s mpbkg
Mark Neubauer RPM Seminar at LBNL / April 13, 2006
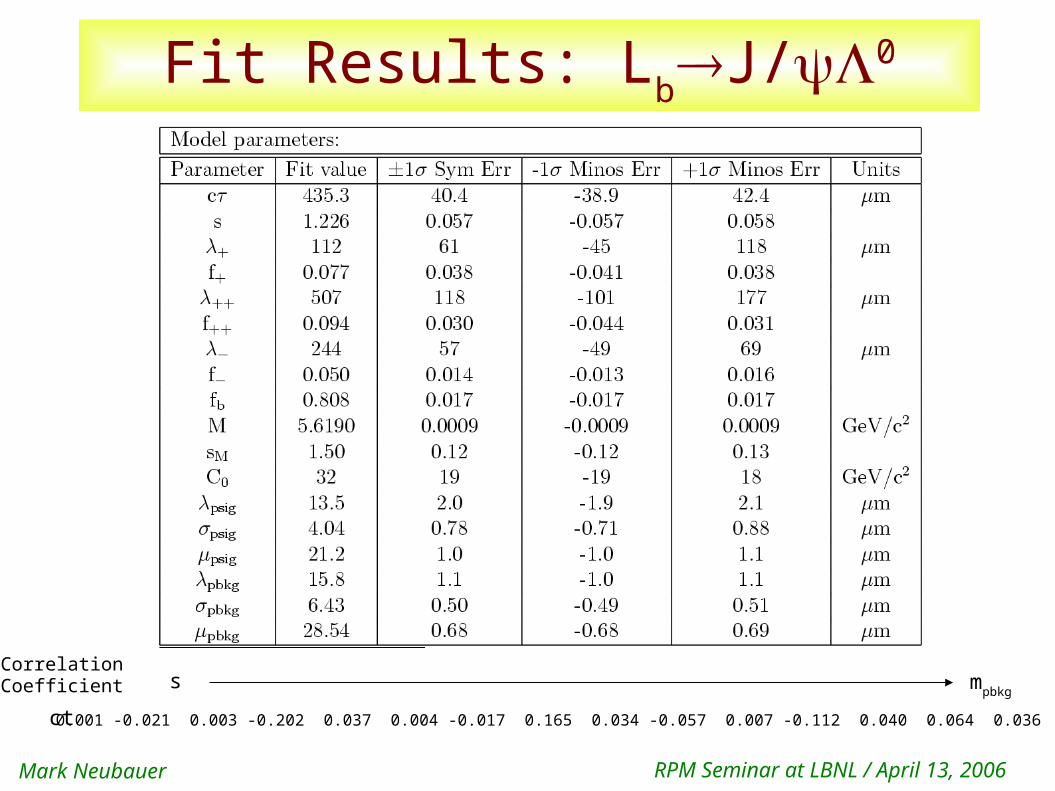
Fit Results: LbJ/0
0.001 -0.021 0.003 -0.202 0.037 0.004 -0.017 0.165 0.034 -0.057 0.007 -0.112 0.040 0.064 0.036
CorrelationCoefficient
ct
s mpbkg
Mark Neubauer RPM Seminar at LBNL / April 13, 2006
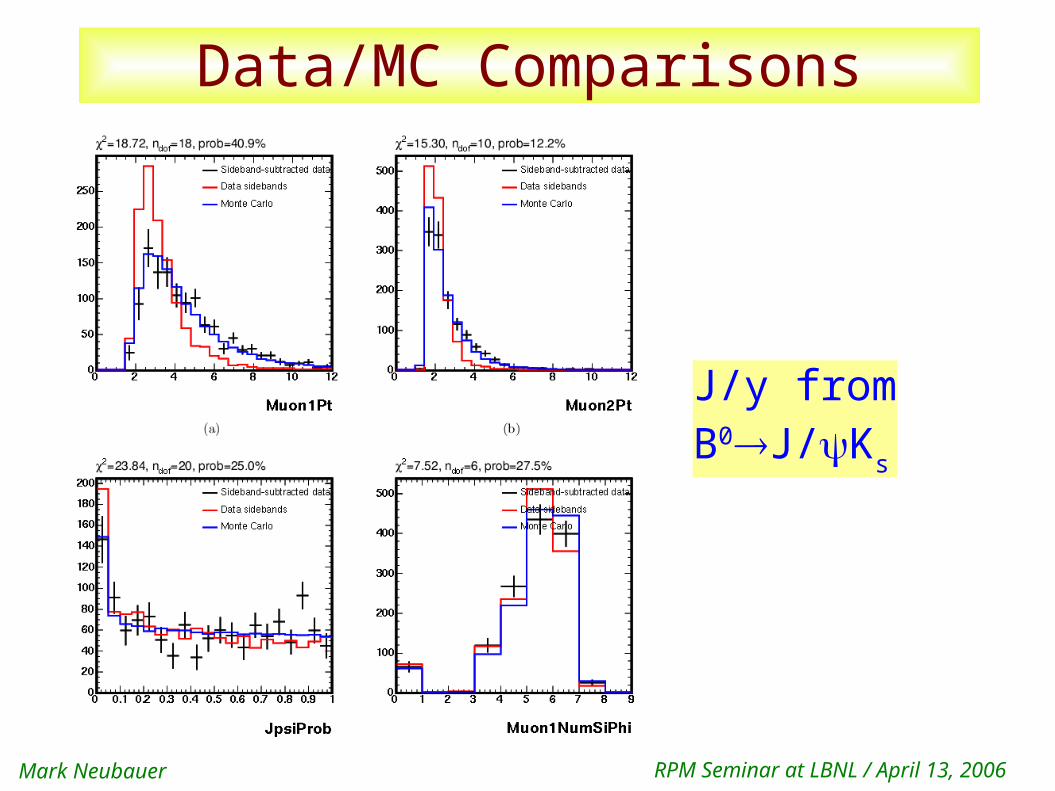
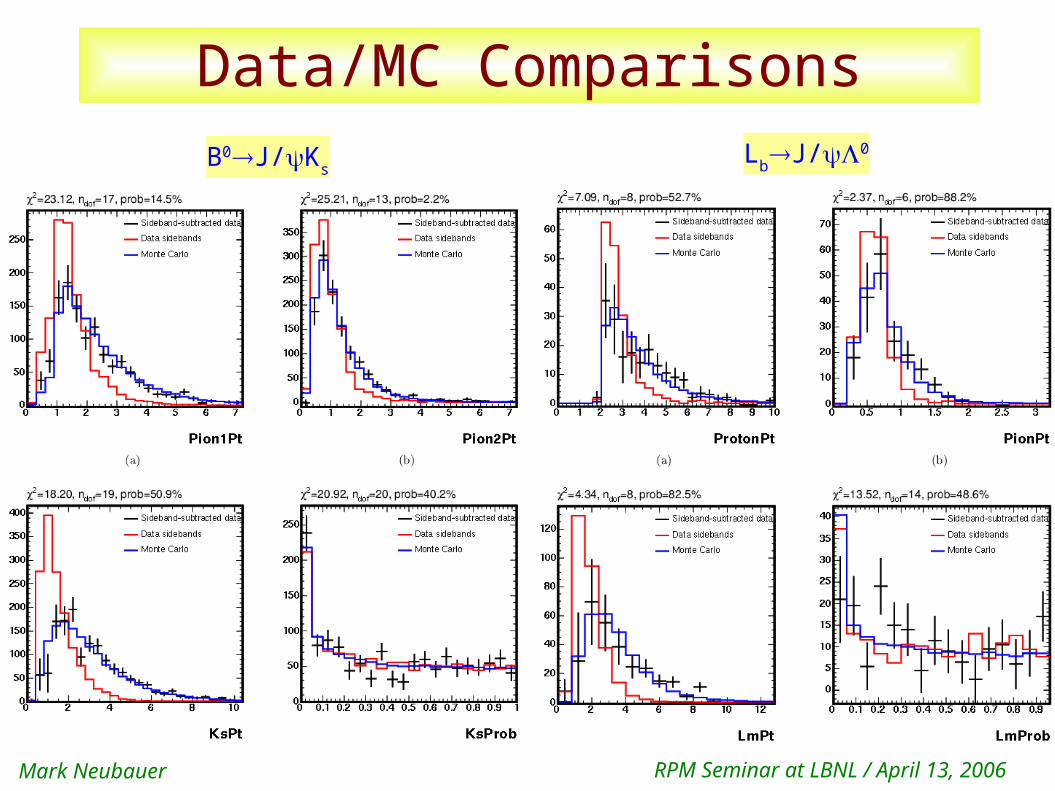
Data/MC Comparisons
J/y fromB0J/Ks
Mark Neubauer RPM Seminar at LBNL / April 13, 2006
Data/MC ComparisonsB0J/Ks
LbJ/0
Mark Neubauer RPM Seminar at LBNL / April 13, 2006
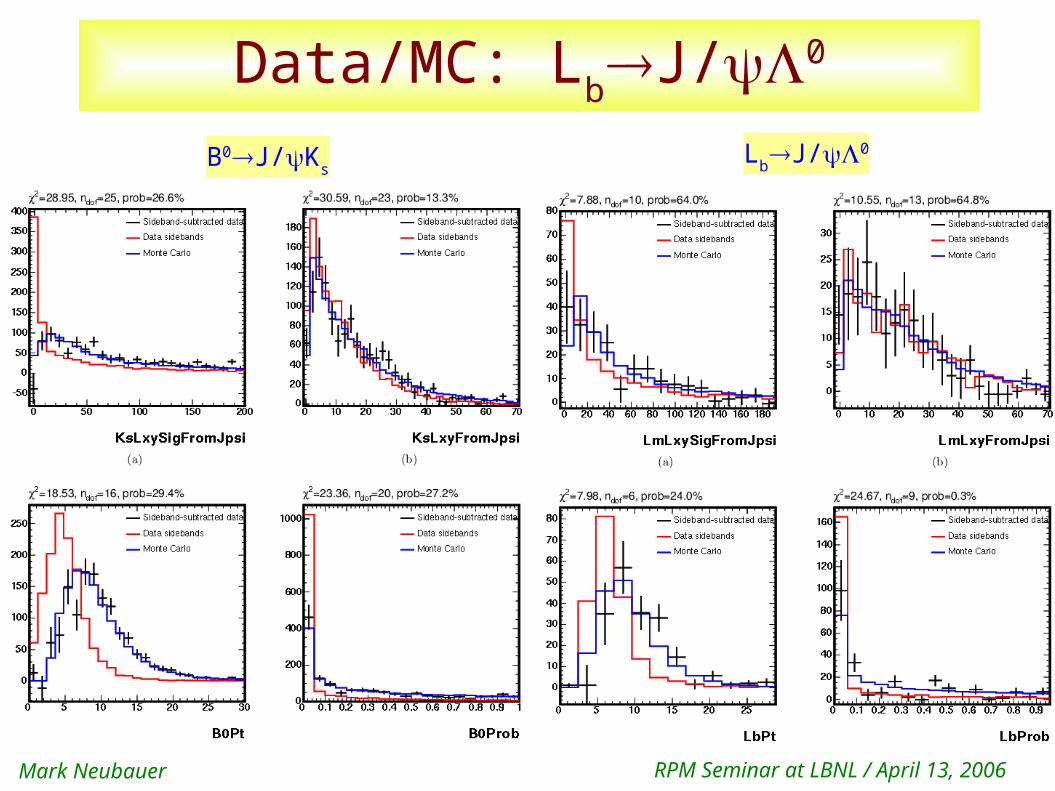
Data/MC: LbJ/0
LbJ/0B0J/Ks
Mark Neubauer RPM Seminar at LBNL / April 13, 2006
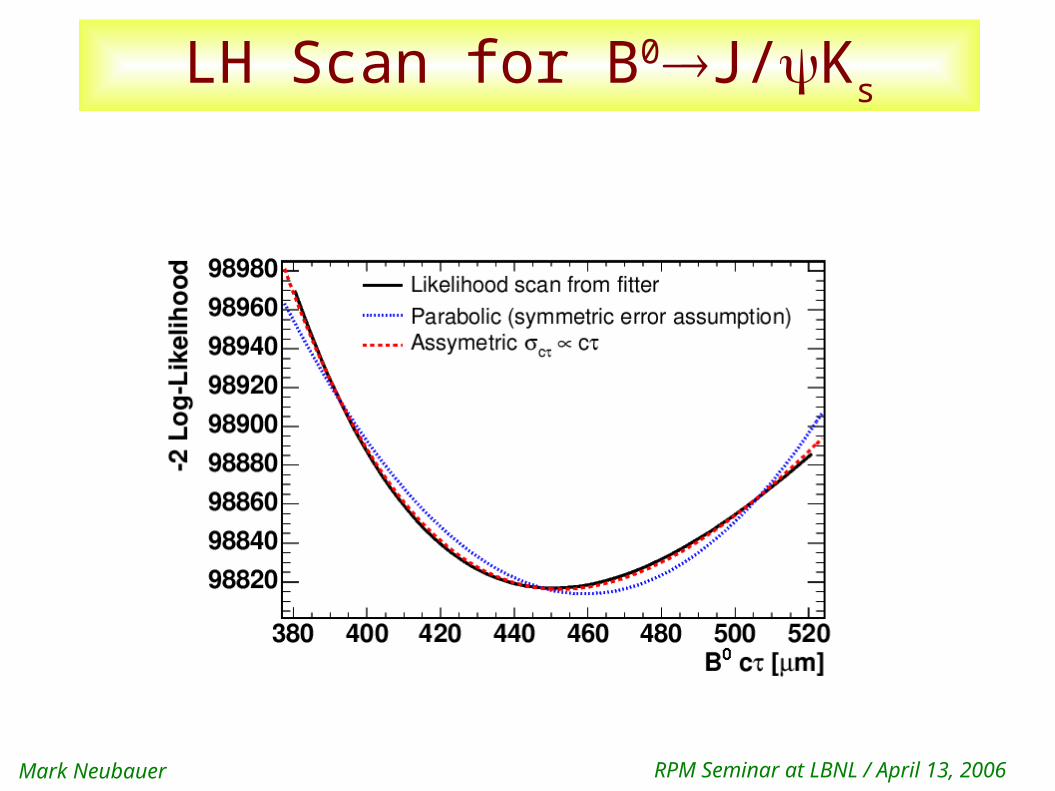
LH Scan for B0J/Ks
Mark Neubauer RPM Seminar at LBNL / April 13, 2006
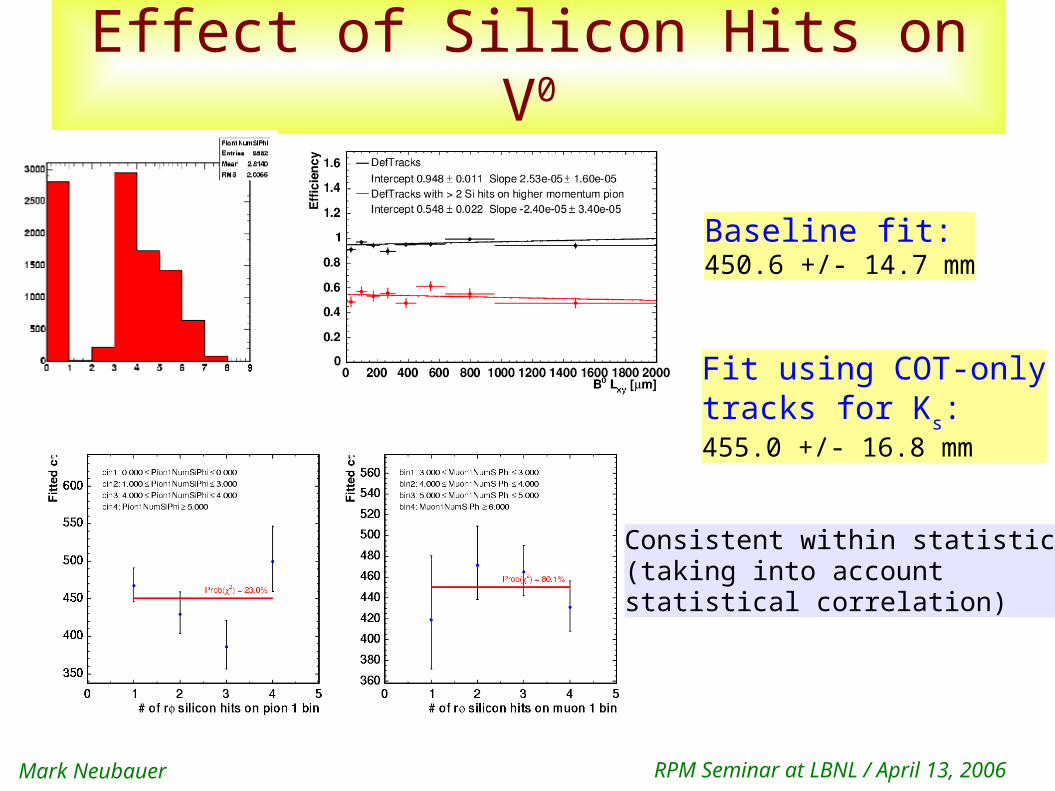
Effect of Silicon Hits on V0
Baseline fit:450.6 +/- 14.7 mm
Fit using COT-onlytracks for Ks:455.0 +/- 16.8 mm
Consistent within statistics (taking into account statistical correlation)
Mark Neubauer RPM Seminar at LBNL / April 13, 2006
Alternative Fitting Methods
Mark Neubauer RPM Seminar at LBNL / April 13, 2006
Pythia MC for LbJ/0


![Selected Publications for Mark S. Neubauer · 2020. 4. 15. · Selected Publications for Mark S. Neubauer Journal Articles [1] G. Aad, “Search for the electroweak diboson production](https://img.pdfslide.us/doc/110x75/60f3de1202bd5d55091858e6/selected-publications-for-mark-s-neubauer-2020-4-15-selected-publications.jpg)