Embed Size (px)
Citation preview
Introduction Drinking water must be “wholesome”, as defined in law by standards for a wide range of substances, organisms and
properties of water. The standards are set to be protective of public health, while the definition of wholesome reflects the importance of ensuring that water quality is acceptable to consumers. Throughout the world, a variety of regulations exist for metal concentrations in various forms of water, with a small representation of drinking water regulations being shown in Table 1. These regulations are driven by a number of factors, including safety and health concerns, as well as the local geology, which has a large impact on the metal content of the water. Even within a region/country, the geology and, hence, the composition of the water can vary greatly. As a result, it is impossible for a single set of regulations to cover global water quality.
The Analysis of Drinking and Natural Waters using the NexION 2000 ICP-MS
A P P L I C A T I O N N O T E
Author:
Ken Neubauer
PerkinElmer, Inc. Shelton, Inc.
ICP - Mass Spectrometry
2
In the United States, the Environmental Protection Agency (EPA) had developed methodology for the analysis of 21 elements in ground, surface, drinking, and waste waters by inductively coupled plasma mass spectrometry (ICP-MS): U.S. EPA Method 200.8. The elements covered are listed in Table 2, along with whether they are primary or secondary elements. Although the element list does not exactly match those of other regions, it is fairly comprehensive and can serve as a basis for analysis of other elements, such as boron (B), among others. The distinction between the classes is that primary elements are enforceable, while secondary elements are not. Some elements are listed as part of Method 200.8 but are classified as neither primary nor secondary.
Method 200.8 is well-established and characterized, having been introduced in 1994. An important aspect of this methodology is how it deals with interferences: mathematical correction equations must be used since the use of collision/reaction cells are not permitted.
This work demonstrates the ability of PerkinElmer’s NexION® 2000 ICP Mass Spectrometer (ICP-MS) to analyze natural and drinking waters in accordance with EPA Method 200.8.
Experimental
Samples and Sample/Standard PreparationAll water samples were analyzed without dilution, after acidification to 2% HNO3 (v/v) to help preserve elements in solution. To aid mercury (Hg) washout, 200 µg/L gold (Au) was added to all samples and standards. Calibration standards were also made in 2% HNO3 at the levels shown in Table 3.
Internal standards were added on-line to all samples and standards. According to Method 200.8, a minimum of three internal standards must be used to cover the complete mass range. While a variety of internal standards will work, the five shown in Table 3 were found to be effective for all elements by spanning both the mass range and ionization potentials of the analytes. The internal standard elements are not all added at the same concentration to account for differences in isotopic abundance, ionization potential, and the potential presence of interferences from samples.
In order to verify the accuracy of the technique, certified reference materials (CRMs) were analyzed, including Trace Metals in Drinking Water (High Purity Standards™, Charleston, South Carolina, USA) and 1640a Natural Water and 1643f Water (NIST, Rockville, Maryland, USA). For acidification, Veritas-grade double distilled nitric acid (GFS Chemicals™, Powell, Ohio, USA) was used. All standards and internal standards were made from stock solutions shown in the Consumables Used table at the end of this document.
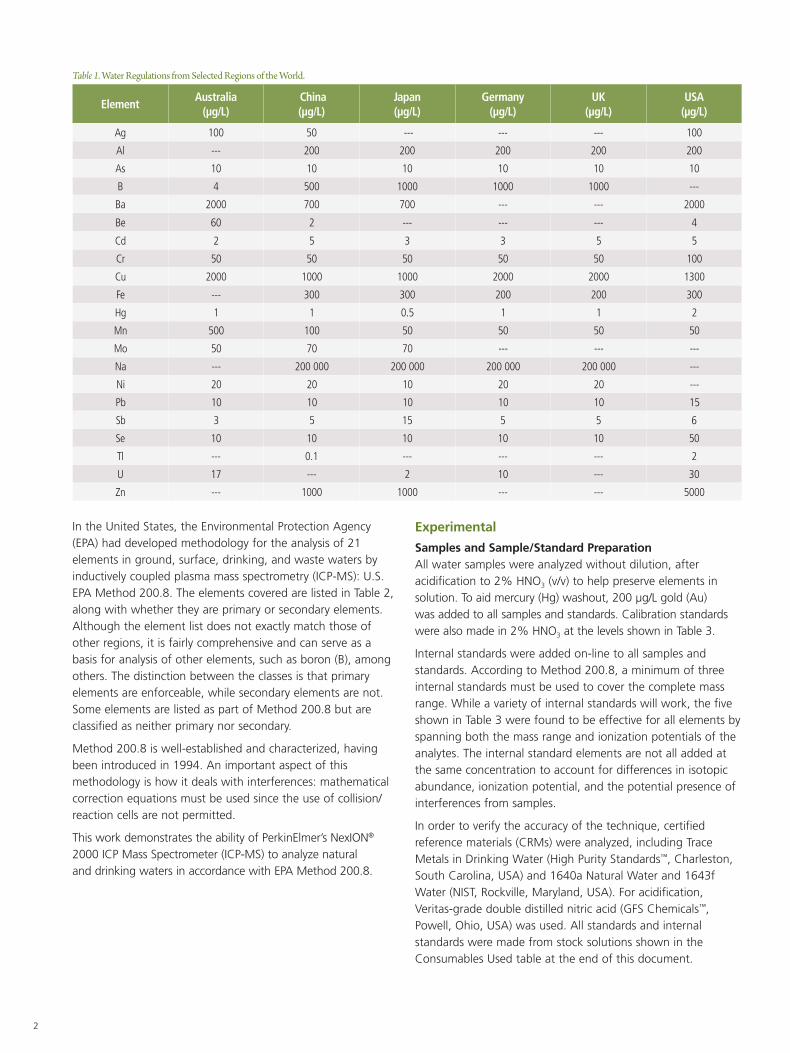
Table 1. Water Regulations from Selected Regions of the World.
ElementAustralia
(µg/L) China (µg/L)
Japan (µg/L)
Germany (µg/L)
UK (µg/L)
USA (µg/L)
Ag 100 50 --- --- --- 100
Al --- 200 200 200 200 200
As 10 10 10 10 10 10
B 4 500 1000 1000 1000 ---
Ba 2000 700 700 --- --- 2000
Be 60 2 --- --- --- 4
Cd 2 5 3 3 5 5
Cr 50 50 50 50 50 100
Cu 2000 1000 1000 2000 2000 1300
Fe --- 300 300 200 200 300
Hg 1 1 0.5 1 1 2
Mn 500 100 50 50 50 50
Mo 50 70 70 --- --- ---
Na --- 200 000 200 000 200 000 200 000 ---
Ni 20 20 10 20 20 ---
Pb 10 10 10 10 10 15
Sb 3 5 15 5 5 6
Se 10 10 10 10 10 50
Tl --- 0.1 --- --- --- 2
U 17 --- 2 10 --- 30
Zn --- 1000 1000 --- --- 5000
3
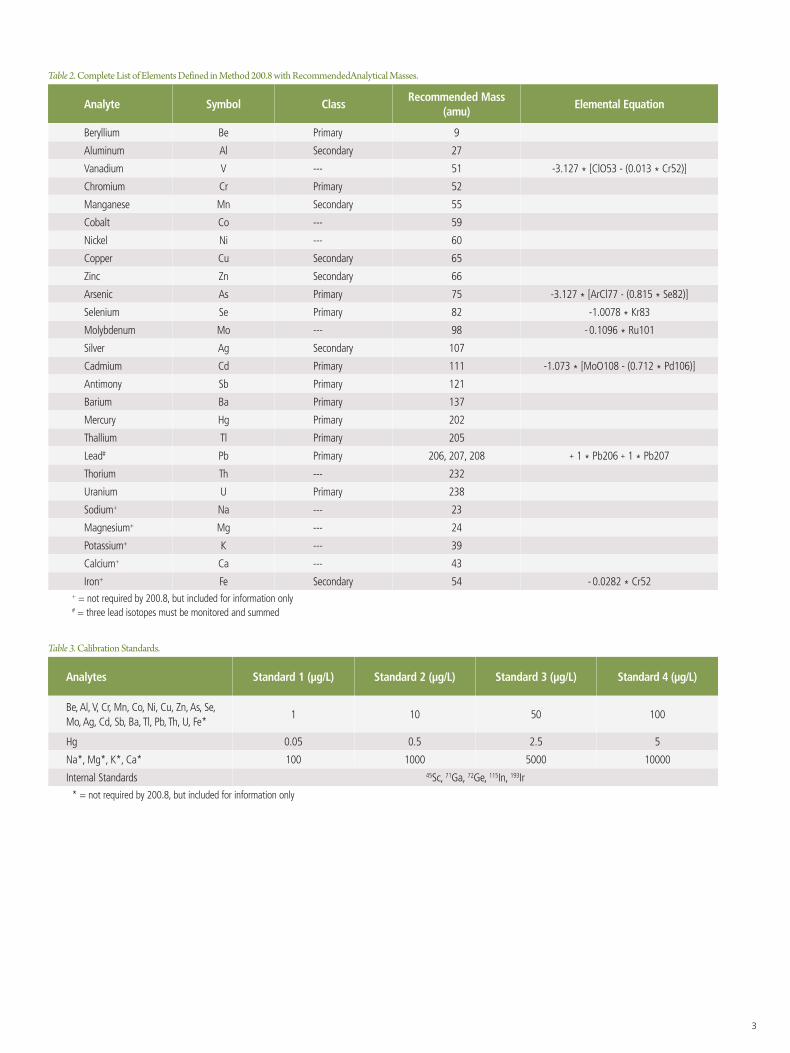
Table 2. Complete List of Elements Defined in Method 200.8 with RecommendedAnalytical Masses.
Analyte Symbol ClassRecommended Mass
(amu)Elemental Equation
Beryllium Be Primary 9
Aluminum Al Secondary 27
Vanadium V --- 51 -3.127 * [ClO53 - (0.013 * Cr52)]
Chromium Cr Primary 52
Manganese Mn Secondary 55
Cobalt Co --- 59
Nickel Ni --- 60
Copper Cu Secondary 65
Zinc Zn Secondary 66
Arsenic As Primary 75 -3.127 * [ArCl77 - (0.815 * Se82)]
Selenium Se Primary 82 -1.0078 * Kr83
Molybdenum Mo --- 98 - 0.1096 * Ru101
Silver Ag Secondary 107
Cadmium Cd Primary 111 -1.073 * [MoO108 - (0.712 * Pd106)]
Antimony Sb Primary 121
Barium Ba Primary 137
Mercury Hg Primary 202
Thallium Tl Primary 205
Lead# Pb Primary 206, 207, 208 + 1 * Pb206 + 1 * Pb207
Thorium Th --- 232
Uranium U Primary 238
Sodium+ Na --- 23
Magnesium+ Mg --- 24
Potassium+ K --- 39
Calcium+ Ca --- 43
Iron+ Fe Secondary 54 - 0.0282 * Cr52+ = not required by 200.8, but included for information only# = three lead isotopes must be monitored and summed
Table 3. Calibration Standards.
Analytes Standard 1 (µg/L) Standard 2 (µg/L) Standard 3 (µg/L) Standard 4 (µg/L)
Be, Al, V, Cr, Mn, Co, Ni, Cu, Zn, As, Se, Mo, Ag, Cd, Sb, Ba, Tl, Pb, Th, U, Fe*
1 10 50 100
Hg 0.05 0.5 2.5 5
Na*, Mg*, K*, Ca* 100 1000 5000 10000
Internal Standards 45Sc, 71Ga, 72Ge, 115In, 193Ir
* = not required by 200.8, but included for information only
4
Table 4. NexION 2000 ICP-MS Parameters.
Component/Parameter Type/Value
Nebulizer MEINHARD® plus Glass Type C
Spray Chamber Glass Cyclonic at 2 °C
Sample Uptake Rate 350 µL/min
RF Power 1200 W
Injector 2.0 mm id quartz
Sweeps 20
Dwell Time 15 – 25 ms
Replicates 3
Mixing Tee On-line addition of internal standards
InstrumentationAll analyses were performed with the NexION® 2000 ICP-MS (PerkinElmer Inc., Shelton, Connecticut, USA) using the conditions shown in Table 4. Because collision/reaction cell technology is not currently permitted with Method 200.8, the Standard mode was used with the elemental equations shown in Table 2 to correct for common polyatomic and isobaric interferences.
A unique capability of quadrupole cells is the ability to selectively adjust the ion transmission of any element/isotope, without affecting other masses/elements. This capability was applied to Na and K since both of these elements have low ionization potentials, isotopic abundancies of 100% (Na) and 93% (K), and are present at high levels in waters. By selectively suppressing these signals, much higher levels can be measured while preserving the lifetime of the detector.
Results and Discussion
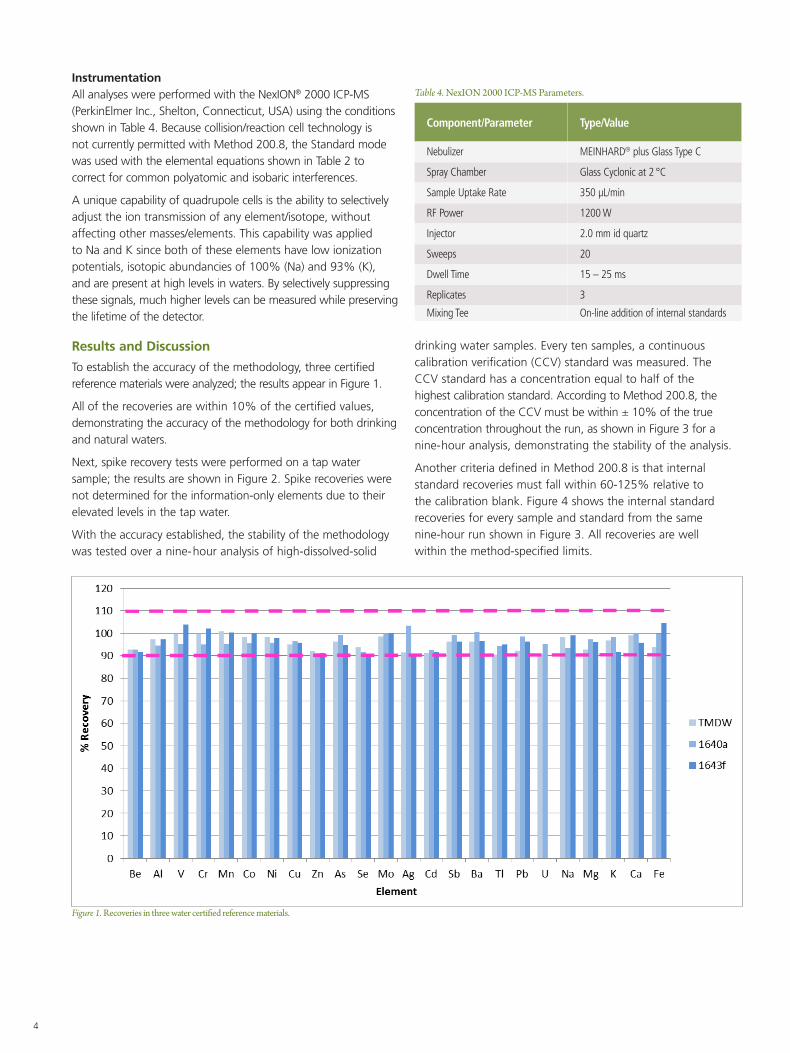
To establish the accuracy of the methodology, three certified reference materials were analyzed; the results appear in Figure 1.
All of the recoveries are within 10% of the certified values, demonstrating the accuracy of the methodology for both drinking and natural waters.
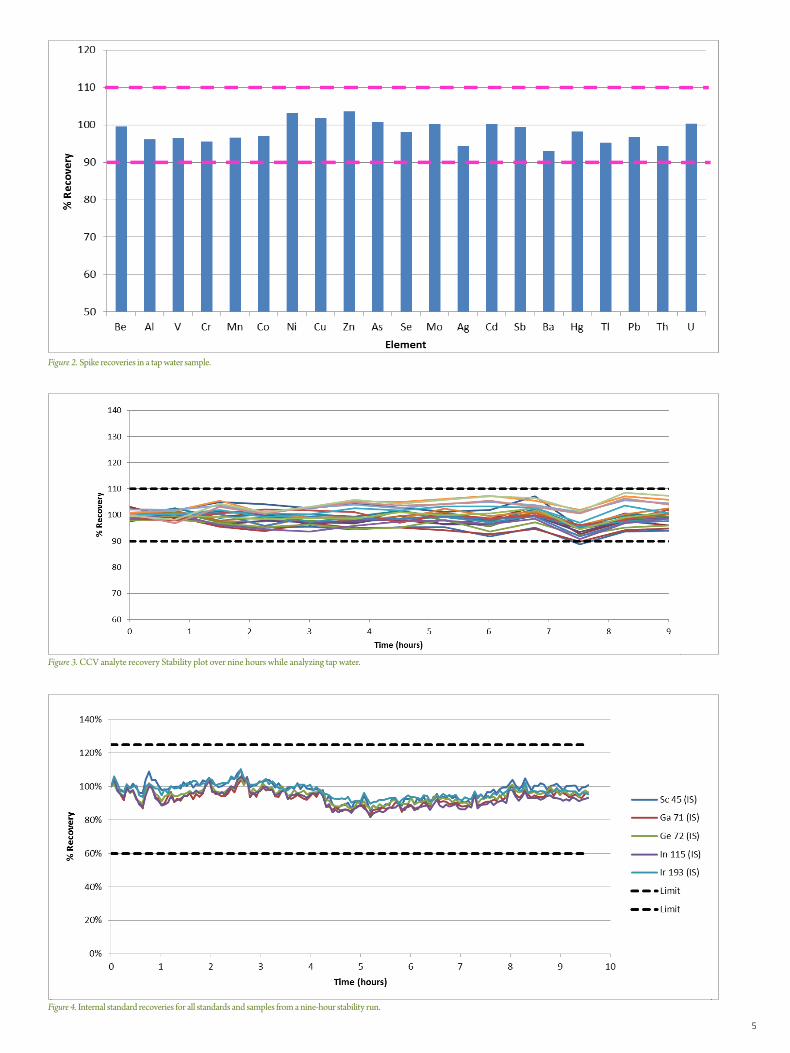
Next, spike recovery tests were performed on a tap water sample; the results are shown in Figure 2. Spike recoveries were not determined for the information-only elements due to their elevated levels in the tap water.
With the accuracy established, the stability of the methodology was tested over a nine-hour analysis of high-dissolved-solid
drinking water samples. Every ten samples, a continuous calibration verification (CCV) standard was measured. The CCV standard has a concentration equal to half of the highest calibration standard. According to Method 200.8, the concentration of the CCV must be within ± 10% of the true concentration throughout the run, as shown in Figure 3 for a nine-hour analysis, demonstrating the stability of the analysis.
Another criteria defined in Method 200.8 is that internal standard recoveries must fall within 60-125% relative to the calibration blank. Figure 4 shows the internal standard recoveries for every sample and standard from the same nine-hour run shown in Figure 3. All recoveries are well within the method-specified limits.
Figure 1. Recoveries in three water certified reference materials.
5
Figure 3. CCV analyte recovery Stability plot over nine hours while analyzing tap water.
Figure 4. Internal standard recoveries for all standards and samples from a nine-hour stability run.
Figure 2. Spike recoveries in a tap water sample.
6
Table 5. High-Concentration Analysis of Sodium and Potassium.
ElementMass of Lowest Abundance
Analytical Isotope Abundance of
Analytical IsotopeRPa Value
% Recovery of a 500 mg/L Standard
% Recovery of a 1000 mg/L Standard
Na 23 100 0.016 101 102
K 39 93 0.015 103 107
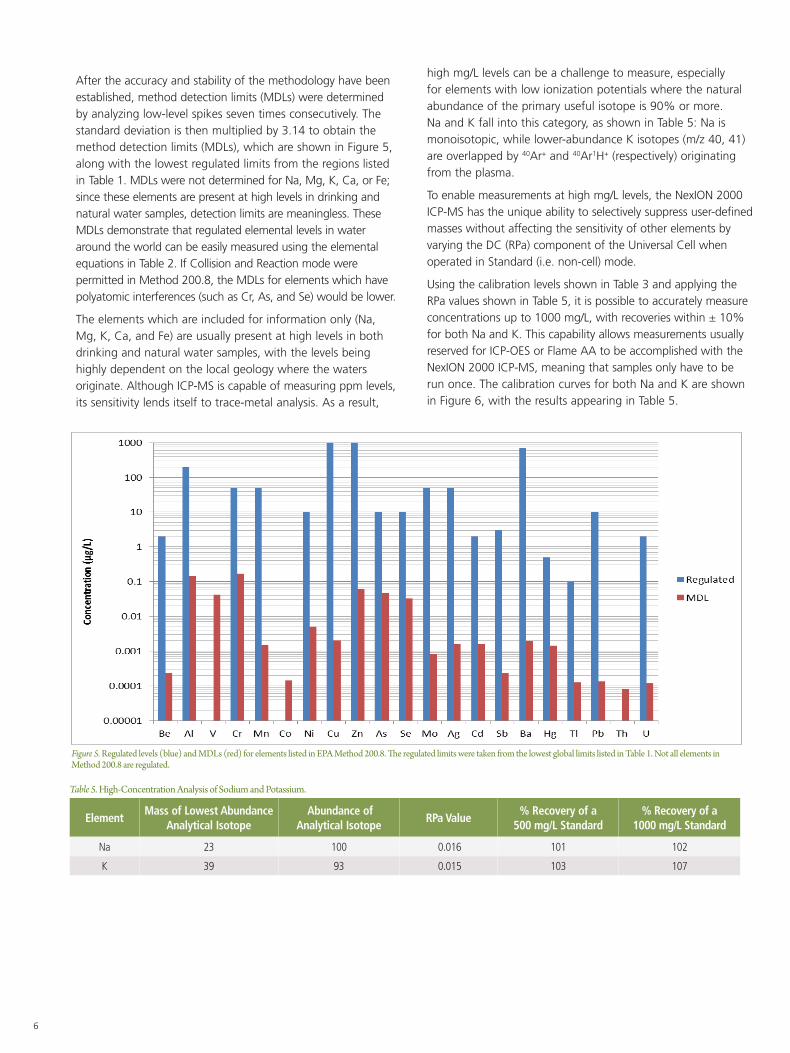
Figure 5. Regulated levels (blue) and MDLs (red) for elements listed in EPA Method 200.8. The regulated limits were taken from the lowest global limits listed in Table 1. Not all elements in Method 200.8 are regulated.
After the accuracy and stability of the methodology have been established, method detection limits (MDLs) were determined by analyzing low-level spikes seven times consecutively. The standard deviation is then multiplied by 3.14 to obtain the method detection limits (MDLs), which are shown in Figure 5, along with the lowest regulated limits from the regions listed in Table 1. MDLs were not determined for Na, Mg, K, Ca, or Fe; since these elements are present at high levels in drinking and natural water samples, detection limits are meaningless. These MDLs demonstrate that regulated elemental levels in water around the world can be easily measured using the elemental equations in Table 2. If Collision and Reaction mode were permitted in Method 200.8, the MDLs for elements which have polyatomic interferences (such as Cr, As, and Se) would be lower.
The elements which are included for information only (Na, Mg, K, Ca, and Fe) are usually present at high levels in both drinking and natural water samples, with the levels being highly dependent on the local geology where the waters originate. Although ICP-MS is capable of measuring ppm levels, its sensitivity lends itself to trace-metal analysis. As a result,
high mg/L levels can be a challenge to measure, especially for elements with low ionization potentials where the natural abundance of the primary useful isotope is 90% or more. Na and K fall into this category, as shown in Table 5: Na is monoisotopic, while lower-abundance K isotopes (m/z 40, 41) are overlapped by 40Ar+ and 40Ar1H+ (respectively) originating from the plasma.
To enable measurements at high mg/L levels, the NexION 2000 ICP-MS has the unique ability to selectively suppress user-defined masses without affecting the sensitivity of other elements by varying the DC (RPa) component of the Universal Cell when operated in Standard (i.e. non-cell) mode.
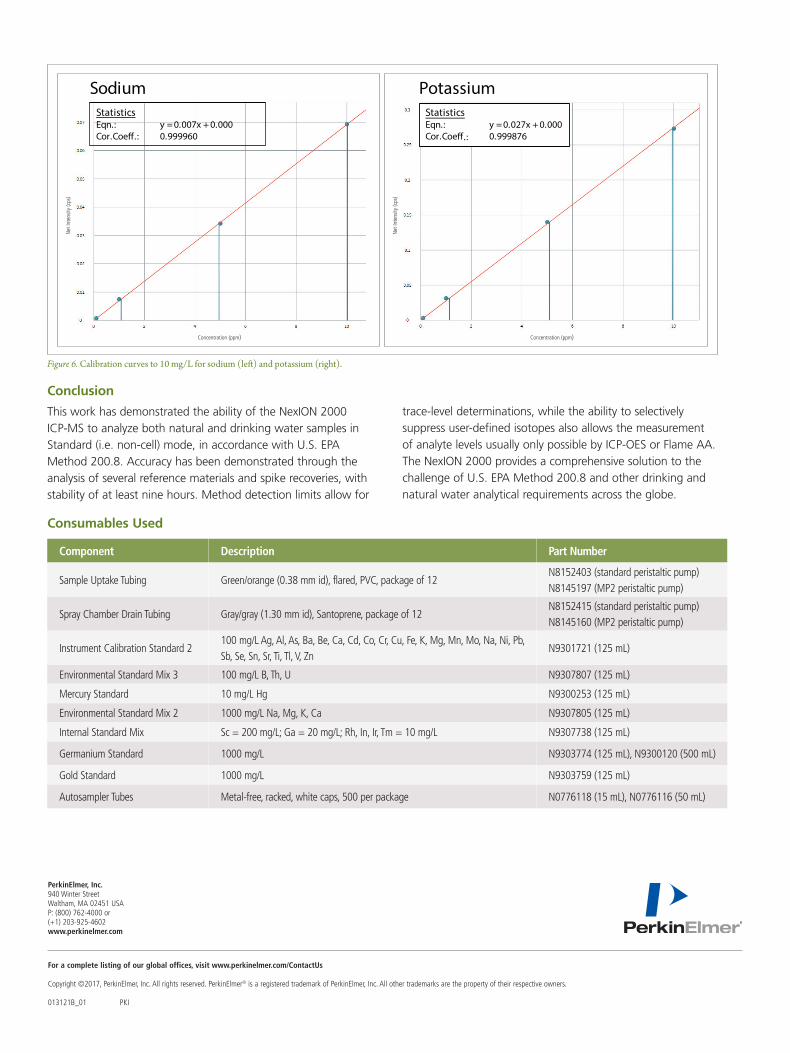
Using the calibration levels shown in Table 3 and applying the RPa values shown in Table 5, it is possible to accurately measure concentrations up to 1000 mg/L, with recoveries within ± 10% for both Na and K. This capability allows measurements usually reserved for ICP-OES or Flame AA to be accomplished with the NexION 2000 ICP-MS, meaning that samples only have to be run once. The calibration curves for both Na and K are shown in Figure 6, with the results appearing in Table 5.
For a complete listing of our global offices, visit www.perkinelmer.com/ContactUs
Copyright ©2017, PerkinElmer, Inc. All rights reserved. PerkinElmer® is a registered trademark of PerkinElmer, Inc. All other trademarks are the property of their respective owners. 013121B_01 PKI
PerkinElmer, Inc. 940 Winter Street Waltham, MA 02451 USA P: (800) 762-4000 or (+1) 203-925-4602www.perkinelmer.com
Conclusion
This work has demonstrated the ability of the NexION 2000 ICP-MS to analyze both natural and drinking water samples in Standard (i.e. non-cell) mode, in accordance with U.S. EPA Method 200.8. Accuracy has been demonstrated through the analysis of several reference materials and spike recoveries, with stability of at least nine hours. Method detection limits allow for
trace-level determinations, while the ability to selectively suppress user-defined isotopes also allows the measurement of analyte levels usually only possible by ICP-OES or Flame AA. The NexION 2000 provides a comprehensive solution to the challenge of U.S. EPA Method 200.8 and other drinking and natural water analytical requirements across the globe.
Component Description Part Number
Sample Uptake Tubing Green/orange (0.38 mm id), flared, PVC, package of 12N8152403 (standard peristaltic pump)N8145197 (MP2 peristaltic pump)
Spray Chamber Drain Tubing Gray/gray (1.30 mm id), Santoprene, package of 12N8152415 (standard peristaltic pump)N8145160 (MP2 peristaltic pump)
Instrument Calibration Standard 2100 mg/L Ag, Al, As, Ba, Be, Ca, Cd, Co, Cr, Cu, Fe, K, Mg, Mn, Mo, Na, Ni, Pb, Sb, Se, Sn, Sr, Ti, Tl, V, Zn
N9301721 (125 mL)
Environmental Standard Mix 3 100 mg/L B, Th, U N9307807 (125 mL)
Mercury Standard 10 mg/L Hg N9300253 (125 mL)
Environmental Standard Mix 2 1000 mg/L Na, Mg, K, Ca N9307805 (125 mL)
Internal Standard Mix Sc = 200 mg/L; Ga = 20 mg/L; Rh, In, Ir, Tm = 10 mg/L N9307738 (125 mL)
Germanium Standard 1000 mg/L N9303774 (125 mL), N9300120 (500 mL)
Gold Standard 1000 mg/L N9303759 (125 mL)
Autosampler Tubes Metal-free, racked, white caps, 500 per package N0776118 (15 mL), N0776116 (50 mL)
Consumables Used
Figure 6. Calibration curves to 10 mg/L for sodium (left) and potassium (right).
StatisticsEqn.: y = 0.007x + 0.000Cor.Coe�.: 0.999960
SodiumStatisticsEqn.: y = 0.027x + 0.000Cor.Coe�.: 0.999876
PotassiumStatisticsEqn.: y = 0.007x + 0.000Cor.Coe�.: 0.999960
SodiumStatisticsEqn.: y = 0.027x + 0.000Cor.Coe�.: 0.999876
Potassium
Concentration (ppm)Concentration (ppm)
Net
Inte
nsity
(cps
)
Net
Inte
nsity
(cps
)