Embed Size (px)
Citation preview

Government Debt Issuance in the Euro Area: The Impact of the Financial Crisis
Mark De Broeck and Anastasia Guscina
WP/11/21

© 2010 International Monetary Fund WP/11/21
IMF Working Paper
European Department
Government Debt Issuance in the Euro Area: The Impact of the Financial Crisis
Prepared by Mark De Broeck and Anastasia Guscina1
Authorized for distribution by Ashoka Mody
January 2011
Abstract
This paper documents and analyzes crisis-related changes in government debt issuance practices in the 16 euro zone countries and Denmark. Using a newly constructed database on primary market debt issuance during 2007–09, we find evidence of a shift away from pre-crisis standards of best funding practices—competitive auctions of debt instruments with a fixed coupon, long maturity and local currency denomination (DLTF). Exploiting the cross-country panel data dimension of the data, we conclude that the crisis and related changes in the macroeconomic environment and investor sentiment can account for a significant proportion of the deviation. The negative effect of the crisis on DLTF debt issuance was especially pronounced in high deficit and high debt euro area countries, and has forced governments to assume additional risk.
JEL Classification Numbers: C24, C23, F34, F39, G15, H30, H63
Keywords: sovereign debt, fiscal policy, sovereign debt management
Author’s E-Mail Address: [email protected], [email protected]
This Working Paper should not be reported as representing the views of the IMF.
The views expressed in this Working Paper are those of the author(s) and do not necessarily represent those of the IMF or IMF policy. Working Papers describe research in progress by the author(s) and are published to elicit comments and to further debate.
1 We are grateful for comments from Ashoka Mody and European Department brown bag seminar participants.

2
Contents Page
Abstract ......................................................................................................................................1
I. Introduction ............................................................................................................................3
II. Database and Stylized Facts ..................................................................................................5
A. Database ....................................................................................................................5
B. Stylized Facts ............................................................................................................6
III. Econometric Analysis and Results.....................................................................................13
A. Determinants of Total Issuance ...............................................................................13
B. Determinants of Issuance Composition...................................................................15
IV. Conclusion .........................................................................................................................22 References ................................................................................................................................29
Tables 1. Changes in the Structure of Sovereign Borrowing ..............................................................12
2A. Determinants of Total Debt Issuance ................................................................................14
2B. Determinants of Total Debt Issuance—Exploring Heterogeneity ....................................15
3A. Determinants of Auction Share in Total Issuance—Censored Tobit Estimation .............18
3B. Determinants of Auction Share in Total Issuance—Exploring Heterogeneity .................19
4A. Determinants of DLTF Issuance—Censored Tobit Estimation ........................................20
4B. Determinants of DLTF Issuance—Exploring Heterogeneity ............................................21
Appendix Tables A1. Changes in Total Debt Issuance ........................................................................................23
A2. Changes in Number of Issues............................................................................................24
A3. Changes in Average Size of Issue .....................................................................................25
A4. Variable Definitions and Sources .....................................................................................26
Annex Determinants of Total Debt Issuance—Estimated in Levels ...................................................27

3
I. INTRODUCTION
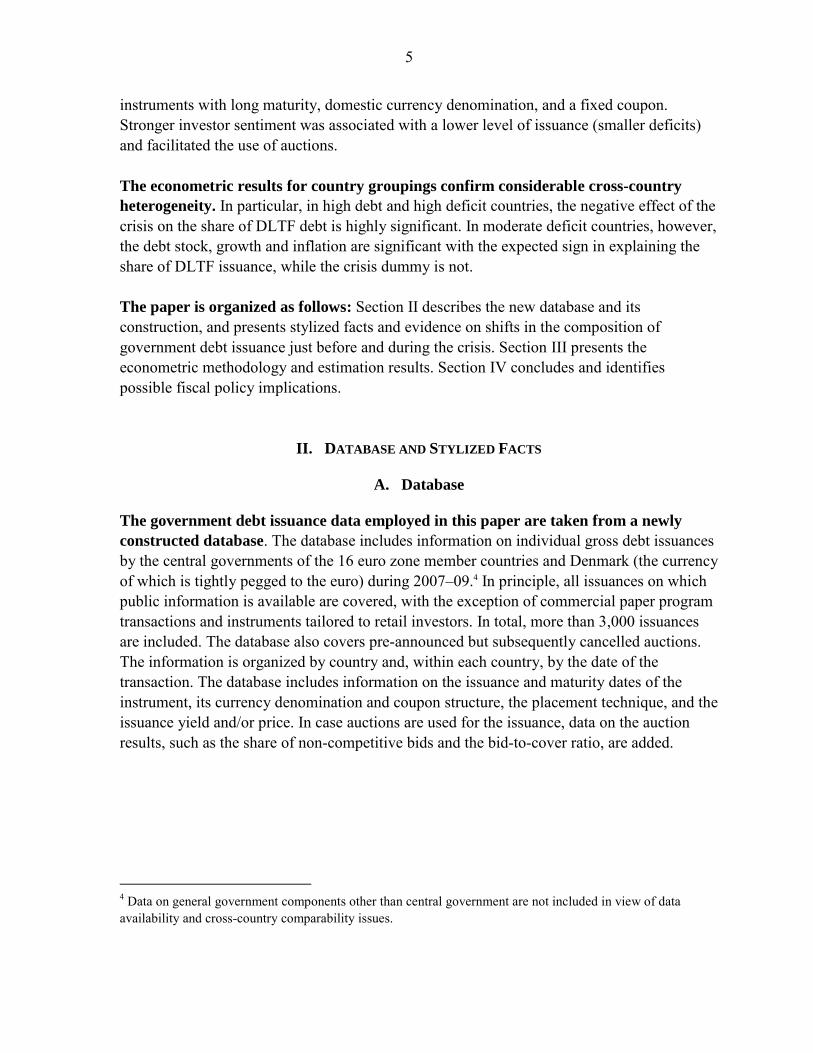
The global financial crisis has had a major impact on government debt issuance
practices in the euro zone countries and Denmark. These practices had broadly converged to a common standard prior to the crisis: placement via competitive auctions of long-term, fixed rate debt denominated in national currency. The standard was intended to achieve low borrowing costs while minimizing rollover and currency risks. However, in tandem with the unfolding global financial crisis, starting in mid-2008, the increase in sovereign funding needs and sharp reduction in investor risk appetite have forced sovereigns in the euro zone to move away from the previous standard and, as risk premia have risen, so has the risk borne by the sovereign borrower. While the pressures and direction of change faced have been similar across countries,
their impact has varied considerably. The differentiation is in part related to the size of gross financing needs before the crisis. Countries such as Ireland which had a budget surplus and small government debt prior to the crisis were confronted with a surge in gross funding needs from low pre-crisis levels, and they had to re-introduce issuance procedures and instruments to meet these needs. Other countries, Belgium and Italy for instance, entered the crisis with a deficit and already high debt and hence substantial gross financing needs. In these countries, additional issuance due to the crisis-related widening of the deficit resulted in a relatively small increase in gross financing needs, which could be absorbed through limited adjustments in well-established mechanisms and instruments. This paper studies changes in euro zone and Danish issuance practices and their
consequences from three perspectives. First, it explores the determinants of the burgeoning gross debt issuance during the crisis. Next, the paper examines changes in issuance procedures, with a particular focus on the diminishing role of auctions in particular, reflecting challenging market conditions. Finally, it turns to shifts in instrument choice and their implications for the allocation of risks between sovereigns and investors. The analysis is based on a newly constructed database. The dataset includes detailed information on the more than 3,000 debt issuances by central governments in the euro zone and Denmark during 2007–09. It contains data on the issuance and maturity dates, the nature of the instrument, its currency denomination and coupon structure, the placement technique, and the issuance yield and/or price. For the purpose of the paper’s econometric analysis, the data are divided into a pre-crisis (January 2007–June 2008) and a crisis (July 2008–December 2009) period. The database’s panel structure facilitates a focus on cross-country differences.

4
The paper complements the expanding literature on euro zone sovereign spreads
following the onset of the crisis. This literature has focused on secondary market and CDS spreads.2 Our paper focuses on the primary market and is the first systematic study of issuance information to analyse the impact of the crisis on euro zone sovereign issuing procedures and instruments in response to changed market conditions, and the resulting shifts in the allocation of risks between sovereigns and investors.3 These changes in risk allocation cannot be identified by an analysis of movements in spreads. In future work, we intend to further explore the links between issuances and primary and secondary market spreads. The paper first documents the trends in gross government debt issuance and its
composition. Reflecting automatic stabilizers and fiscal stimulus packages, central government deficits in the euro zone widened from 1 percent of GDP in 2007 to 5 percent of GDP in 2009. The sharp increase in deficits and support to the financial sector raised central government debt in the zone (relative to GDP) from 54 percent to 65 percent over the same time span. The surge in deficits and debt was accompanied by shifts towards international/external debt, rising spreads, increased use of syndicates, and a spike in foreign currency denominated issuance. Next, a panel econometric analysis of the factors influencing the level and composition
of government debt issuance is carried out. A dynamic specification with random country effects links the level of issuance to a crisis dummy (defined as 0 between January 2007–June 2008, and 1 from June 2008–December 2009), the debt stock, key macroeconomic variables and a business confidence indicator. To relate the composition of issuance to the same set of explanatory variables, an estimation technique is employed which takes into account that the dependent variable (a share) is bounded between zero and that unobserved country heterogeneity may be present. To further explore this heterogeneity, the two sets of regressions were run for different country groupings based on combinations of debt and deficit thresholds: high debt (Belgium, Greece, Italy); high deficit (Belgium, Greece, France, Ireland, Portugal and Spain); and moderate deficit (countries other than the high deficit ones). The main results from the econometric analysis for the sample as a whole are broadly
in line with theoretical priors. Notably, the crisis shifted the composition of issuance away from domestic currency, fixed interest rate instruments with long maturity (DLTF debt) toward shorter maturities, a foreign currency denomination, or a floating rate. But, controlling for the crisis effects, lower inflation and higher growth supported the issuance of 2 For a recent summary of this literature, see Barbosa and Costa (2010).
3 Biais et al. (2004) is an earlier paper studying the determinants of primary issuance in the euro zone Treasury Bill markets. Hoogduin et al. (2010) use aggregate issuance information from the ECB to estimate a government debt management reaction function for the euro area.
5
instruments with long maturity, domestic currency denomination, and a fixed coupon. Stronger investor sentiment was associated with a lower level of issuance (smaller deficits) and facilitated the use of auctions. The econometric results for country groupings confirm considerable cross-country
heterogeneity. In particular, in high debt and high deficit countries, the negative effect of the crisis on the share of DLTF debt is highly significant. In moderate deficit countries, however, the debt stock, growth and inflation are significant with the expected sign in explaining the share of DLTF issuance, while the crisis dummy is not. The paper is organized as follows: Section II describes the new database and its construction, and presents stylized facts and evidence on shifts in the composition of government debt issuance just before and during the crisis. Section III presents the econometric methodology and estimation results. Section IV concludes and identifies possible fiscal policy implications.
II. DATABASE AND STYLIZED FACTS
A. Database
The government debt issuance data employed in this paper are taken from a newly
constructed database. The database includes information on individual gross debt issuances by the central governments of the 16 euro zone member countries and Denmark (the currency of which is tightly pegged to the euro) during 2007–09.4 In principle, all issuances on which public information is available are covered, with the exception of commercial paper program transactions and instruments tailored to retail investors. In total, more than 3,000 issuances are included. The database also covers pre-announced but subsequently cancelled auctions. The information is organized by country and, within each country, by the date of the transaction. The database includes information on the issuance and maturity dates of the instrument, its currency denomination and coupon structure, the placement technique, and the issuance yield and/or price. In case auctions are used for the issuance, data on the auction results, such as the share of non-competitive bids and the bid-to-cover ratio, are added.
4 Data on general government components other than central government are not included in view of data availability and cross-country comparability issues.

6
The database draws from various sources, the mutual consistency of which was
checked:
Announcements of debt issuances and their results on the website of national debt agencies/national central banks, and on dedicated web pages of Bloomberg and Reuters.5
Longer series on auction results and syndicated issuances posted on the website of national debt agencies/ national central banks; and longer series on Treasury bill and government bond issuances made available by Bloomberg.
Information on debt issuances and stocks provided by trading platforms (MTS, domestic stock exchanges).
B. Stylized Facts
1. Larger bond issuance
Gross debt issuance increased in all euro zone countries as the crisis unfolded. Defining for the purpose of the further analysis January 2007–June 2008 as the pre-crisis period, and July 2008–December 2009 as the crisis period, gross issuance in the euro zone as a share of GDP almost doubled. A large increase was observed in France, Ireland and the Netherlands in particular. Among the smaller euro zone countries, Cyprus and Malta stand out. Italy already before the crisis issued a lot of debt, and gross issuance further rose during the crisis. (See also Appendix Table 1, illustrating a general trend of increased debt issuance in the euro zone).
5 Bloomberg and Reuters also provide market comments on important auctions and syndicated issuances.

7
0
100
200
300
400
500
600
700
800
900
1000
Belg
ium
Fra
nce
Germ
an
y
Gre
ece
Italy
Neth
erl
ands
Po
rtug
al
Sp
ain
Central Government Bond Issuance(In billions of Euros)
2007-2008H1
2008H2-2009
0
10
20
30
40
50
60
70
Cyp
rus
Malta
Slo
vakia
Slo
ven
ia
Den
mark
Fin
land
Austr
ia
Irela
nd
Central Government Bond Issuance(In billions of Euros)
2007-2008H1
2008H2-2009
0
10
20
30
40
50
60
70
Belg
ium
Fra
nce
Germ
an
y
Gre
ece
Italy
Neth
erl
ands
Po
rtug
al
Sp
ain
Central Government Bond Issuance(In percent of GDP)
2007-2008H1
2008H2-2009
0
10
20
30
40
50
60
70
Cyp
rus
Malta
Slo
vakia
Slo
ven
ia
Den
mark
Fin
land
Austr
ia
Irela
nd
Central Government Bond Issuance(In percent of GDP)
2007-2008H1
2008H2-2009
Different combinations of roll-over and net issuance underlie cross-country differences
in gross issuance. For example, and as indicated in the introduction, in Ireland, the pre-crisis debt was low, and gross issuance during the crisis mainly reflected the sharp widening of the deficit. In Belgium and Italy, on the other hand, countries with already high debt before the crisis, most of the gross issuance continued to be due to roll-over of maturing debt.
AUT BEL
CYP DNK
FRA
DEU GRC
IRL
ITA
MLT
NLD
PRT SLV SVK
ESP
- 100
100
300
500
700
900
1100
0 20 40 60 80 100 120
Gross Bond Issuance in Billions of Euros
General Government Debt to GDP in 2007
Correlation Between Debt to GDP Ratio and Gross Bond Issuance (In billions of Euros)
AUT
BEL
CYP
DNK
FRA
DEU
GRC IRL
ITA
MLT NLD
PRT SVK
SLV ESP
0 10 20 30 40 50 60 70 80 90
0 20 40 60 80 100 120
Gross Bond Issuances to GDP After the Crisis
General Government Debt to GDP in 2007
Correlation Between Government Debt Prior to the Crisis and Gross Bond Issuances During the Crisis
(In percent of GDP)
8
2. More Frequent and Larger Auctions
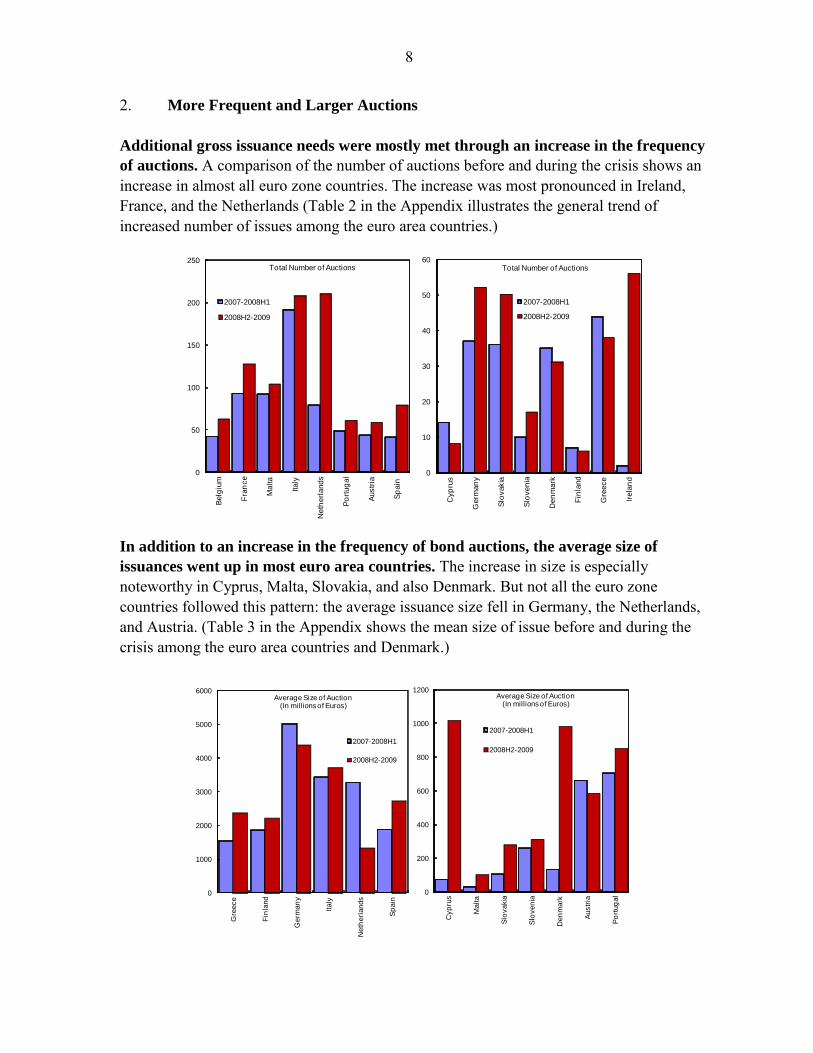
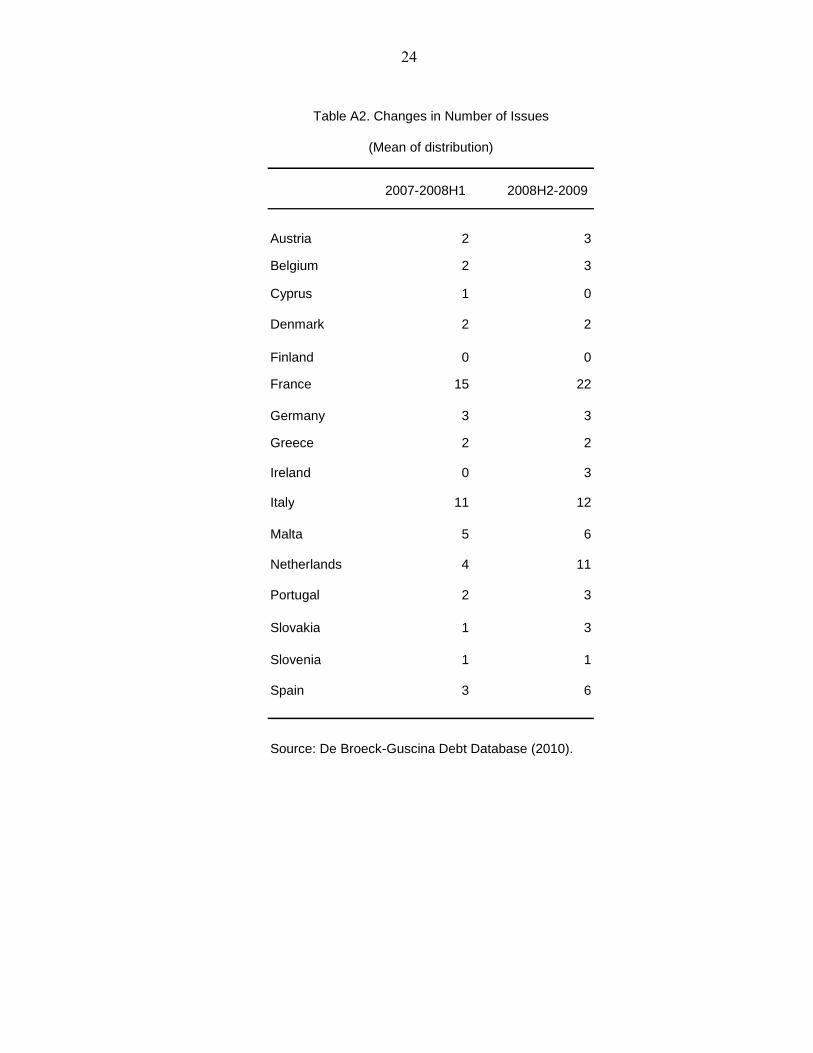
Additional gross issuance needs were mostly met through an increase in the frequency
of auctions. A comparison of the number of auctions before and during the crisis shows an increase in almost all euro zone countries. The increase was most pronounced in Ireland, France, and the Netherlands (Table 2 in the Appendix illustrates the general trend of increased number of issues among the euro area countries.)
Source: DeBroeck-Guscina Euro Area Debt Database 2010.
0
50
100
150
200
250
Belg
ium
Fra
nce
Malta
Italy
Neth
erl
ands
Po
rtug
al
Austr
ia
Sp
ain
Total Number of Auctions
2007-2008H1
2008H2-2009
0
10
20
30
40
50
60
Cyp
rus
Germ
an
y
Slo
vakia
Slo
ven
ia
Den
mark
Fin
land
Gre
ece
Irela
nd
Total Number of Auctions
2007-2008H1
2008H2-2009
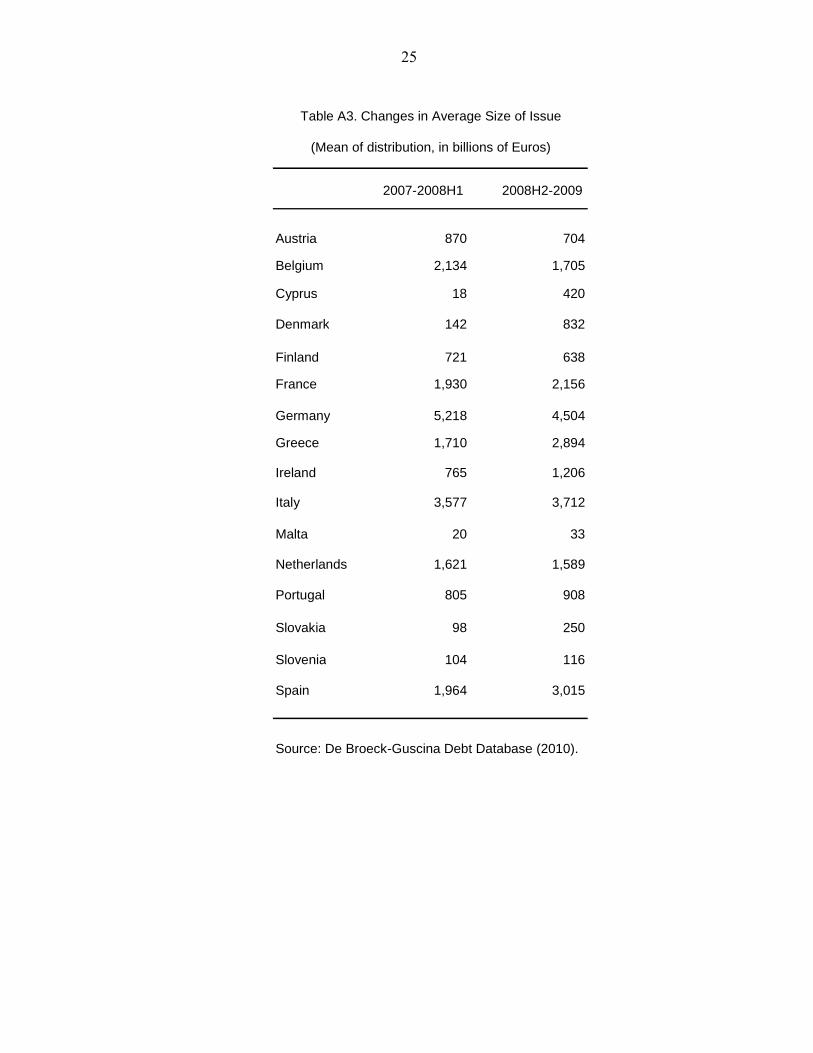
In addition to an increase in the frequency of bond auctions, the average size of
issuances went up in most euro area countries. The increase in size is especially noteworthy in Cyprus, Malta, Slovakia, and also Denmark. But not all the euro zone countries followed this pattern: the average issuance size fell in Germany, the Netherlands, and Austria. (Table 3 in the Appendix shows the mean size of issue before and during the crisis among the euro area countries and Denmark.)
0
1000
2000
3000
4000
5000
6000
Gre
ece
Fin
land
Germ
an
y
Italy
Neth
erl
ands
Sp
ain
Average Size of Auction(In millions of Euros)
2007-2008H1
2008H2-2009
0
200
400
600
800
1000
1200
Cyp
rus
Malta
Slo
vakia
Slo
ven
ia
Den
mark
Austr
ia
Po
rtug
al
Average Size of Auction(In millions of Euros)
2007-2008H1
2008H2-2009

9
3. Spread widening and spread differentiation
Rising deficits and debt have pushed up and disentangled sovereign primary market
spreads. Spread movements relative to the German Bund since the start of the crisis have reflected increasing concerns over debt sustainability and sovereign risk. Moreover, the spreads increased significantly more in higher risk countries such as Greece and Ireland. Spreads in the primary market generally moved in line with those in the secondary market. 4. An evolving role of international placements and syndication
A number of euro zone countries have shifted issuance to the international market. For instance, in Austria, more than 95 percent of outstanding debt is domestically issued, but only 60 percent of the new issuances were placed in domestic markets during the crisis period. Such a movement was not observed in other euro zone countries, however. For example, in Slovenia, the share of domestically issued bonds increased during this period. These shifts reflect, among other factors, the depth of the market for domestically issued debt, and the degree of preference of local investors for domestically issued instruments.
40
50
60
70
80
90
100
110
Belg
ium
Fin
land
Slo
ven
ia
Gre
ece
Italy
Fra
nce
Countries with Increased Share of Domestic Bonds in Total Bond Issuance
(In percent)
2007-2008H1
2008H2-2009
40
50
60
70
80
90
100
110
Cyp
rus
Slo
vakia
Den
mark
Austr
ia
Germ
an
y
Po
rtug
al
Countries with Decreased Share of Domestic Bonds in Total Bond Issuance
(In billions of Euros)
2007-2008H12008H2-2009
The crisis has affected the use of syndication as a selling technique. Prior to the crisis, a number of countries, Belgium and France for instance, used syndication to introduce a new bond to the market, followed by re-issuances through auctions. In Austria, Finland and Ireland, on the other hand, syndication accounted for most of the issuance in 2007 and the first half of 2008. Recourse to syndicates generally increased in the following 18 months: Cyprus and Greece, which did not use syndicates prior to the crisis, relied on them for almost half of total issuance, and Belgium and France
0
20
40
60
80
100
120
Slo
ven
ia
Gre
ece
Irela
nd
Fin
land
Den
mark
Austr
ia
Cyp
rus
Belg
ium
Po
rtug
al
Slo
vakia
Italy
Share of Syndicated Bonds in Total Issuance(In percent)
2007-2008H1
2008H2-2009
10
used syndication beyond first issuances. However, in some cases, for instance in Austria, Ireland, Portugal, and Slovakia, the share of syndicated issuance was reduced during the crisis. 5. Shorter Maturities
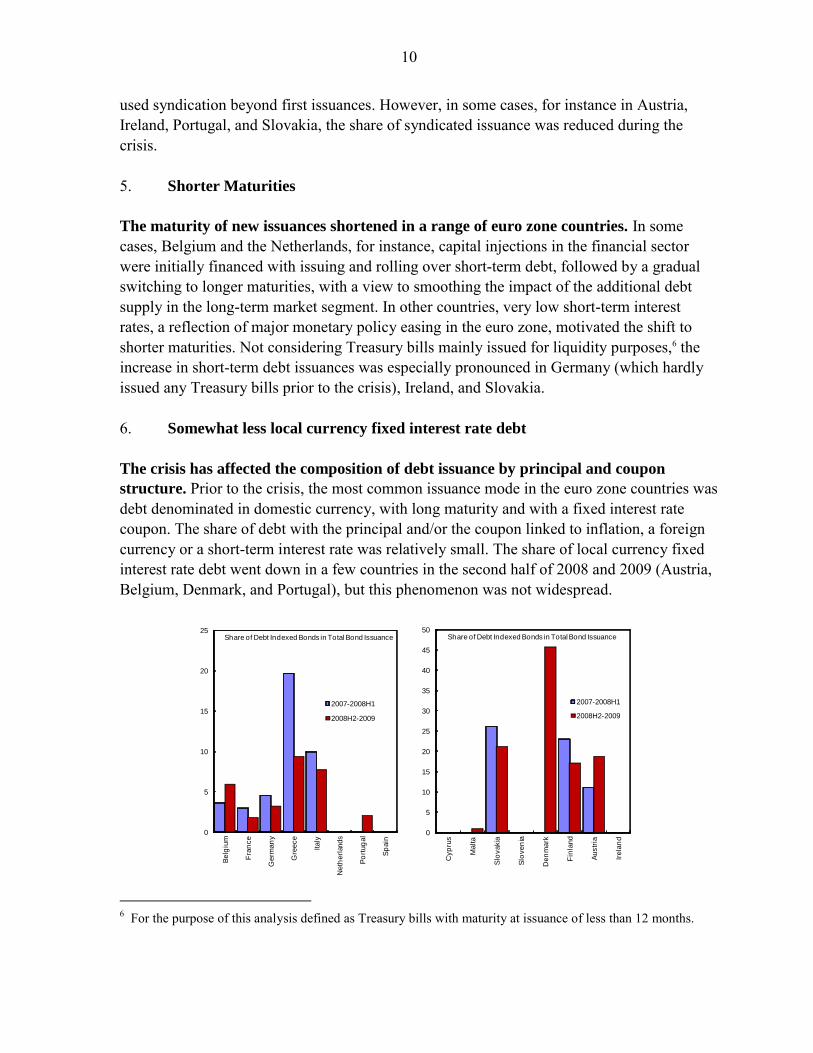
The maturity of new issuances shortened in a range of euro zone countries. In some cases, Belgium and the Netherlands, for instance, capital injections in the financial sector were initially financed with issuing and rolling over short-term debt, followed by a gradual switching to longer maturities, with a view to smoothing the impact of the additional debt supply in the long-term market segment. In other countries, very low short-term interest rates, a reflection of major monetary policy easing in the euro zone, motivated the shift to shorter maturities. Not considering Treasury bills mainly issued for liquidity purposes,6 the increase in short-term debt issuances was especially pronounced in Germany (which hardly issued any Treasury bills prior to the crisis), Ireland, and Slovakia. 6. Somewhat less local currency fixed interest rate debt
The crisis has affected the composition of debt issuance by principal and coupon
structure. Prior to the crisis, the most common issuance mode in the euro zone countries was debt denominated in domestic currency, with long maturity and with a fixed interest rate coupon. The share of debt with the principal and/or the coupon linked to inflation, a foreign currency or a short-term interest rate was relatively small. The share of local currency fixed interest rate debt went down in a few countries in the second half of 2008 and 2009 (Austria, Belgium, Denmark, and Portugal), but this phenomenon was not widespread.
0
5
10
15
20
25
Belg
ium
Fra
nce
Germ
an
y
Gre
ece
Italy
Neth
erl
ands
Po
rtug
al
Sp
ain
Share of Debt Indexed Bonds in Total Bond Issuance
2007-2008H1
2008H2-2009
0
5
10
15
20
25
30
35
40
45
50
Cyp
rus
Malta
Slo
vakia
Slo
ven
ia
Den
mark
Fin
land
Austr
ia
Irela
nd
Share of Debt Indexed Bonds in Total Bond Issuance
2007-2008H1
2008H2-2009
6 For the purpose of this analysis defined as Treasury bills with maturity at issuance of less than 12 months.

11
The evolution of the use of alternative principal and coupon formulas was not uniform.
a. Less CPI-Indexed Debt
Inflation indexed bonds were not common in the euro area before the crisis. In fact, when the crisis broke, only four member countries still issued debt indexed to some measure of inflation. In the following 18-month period, France, Germany and Italy significantly reduced the share of inflation-indexed bonds, and Greece abandoned the instrument altogether. b. More Foreign Currency-Denominated Debt
A number of euro zone sovereigns raised the proportion of foreign currency-denominated debt during the crisis period. In particular, they issued US dollar debt in the fall of 2009 to take advantage of the strength of the euro and low US dollar interest rates in that period. c. More Floating Rate Debt
A range of euro zone members issued a higher share of floating rate debt. Greece almost doubled the share of floating rate bond issuances in the crisis period compared with the previous eighteen months. Some countries, for instance, Finland, Malta, Portugal and Slovakia, which did not issue floating rate bonds prior to the crisis, introduced them during the crisis.
0
5
10
15
20
25
30
35
40
45
50
Den
mark
Austr
ia
Slo
vakia
Fin
land
Italy
Belg
ium
Po
rtug
al
Share of Foreign Currency Bonds in Total Issuance(In percent)
2007-2008H1
2008H2-2009
Source: DeBroeck-Guscina Euro Area Debt Database 2010.
0
1
2
3
4
5
6
7
8
Fra
nce
Germ
an
y
Italy
Gre
ece
Share of CPI-Indexed Bonds in Total Issuance(In percent)
2007-2008H1
2008H2-2009
12
The table below summarizes shifts in the structure of government borrowing before and
during the crisis.
Country Time Period Auctions Domestic Short-term Foreign currency CPI indexed Variable rate DLTF
Austria 2007-2008H1 79.7 79.7 3.8 20.2 0 8.5 79.75
2008H2-2009 83.75 95.6 5.82 16.2 0 0.5 82.8
Belgium 2007-2008H1 78.1 100 21.3 0 0 3.63 78.69
2008H2-2009 86.7 100 50.7 4.1 0 2.98 45.45
Cyprus 2007-2008H1 100 100 23.8 0 0 0 76.18
2008H2-2009 85.7 85.7 57.1 0 0 0 28.6
Denmark 2007-2008H1 100 100 85.14 0 0 0 14.86
2008H2-2009 65.2 71 23.5 34.8 0 0 41.6
Finland 2007-2008H1 38.9 72 0 27.8 0 0 72.2
2008H2-2009 62.2 80 0 18 0 2 80
France 2007-2008H1 98.73 100 64.2 0 5.41 0 35.8
2008H2-2009 99.56 100 71.4 0 2.25 0 28.56
Germany 2007-2008H1 100 100 0 0 4.08 0 100
2008H2-2009 99.5 100 23.73 0.53 2.94 0 75.74
Greece 2007-2008H1 54.6 95.6 3.3 0 12.2 4.4 92.3
2008H2-2009 46.6 95.4 13.46 1.8 0 10.78 81.91
Ireland 2007-2008H1 0 100 0 0 0 0 100
2008H2-2009 67.9 100 47.4 0 0 0 52.6
Italy 2007-2008H1 97.94 99.46 37.55 0.52 4.07 4.95 61.7
2008H2-2009 98.4 99.7 36.2 0.29 2.94 4.2 63.53
Malta 2007-2008H1 100 100 89.53 0 0 0 10.46
2008H2-2009 100 100 79.78 0 0 0 20.22
Netherlands 2007-2008H1 100 100 75.56 0 0 0 24.44
2008H2-2009 100 100 82.1 0 0 0 17.9
Portugal 2007-2008H1 89.9 100 51.9 0 0 0 48.1
2008H2-2009 88.5 98.8 61.97 1.22 0 0 36.81
Slovakia 2007-2008H1 93.84 93.84 7.69 6.15 0 0 86.15
2008H2-2009 95.65 95.65 23.78 0 0 7.55 71.87
Slovenia 2007-2008H1 61.82 81.8 40.9 0 0 0 40.9
2008H2-2009 77.89 100 77.89 0 0 0 22.11
Spain 2007-2008H1 95.8 99.2 48.5 0.83 0 0 50.62
2008H2-2009 93.3 98.8 36.6 1.17 0 1.31 62.21
Source: De Broeck-Guscina Euro Area Debt Database (2010).
Table 1. Changes in the Structure of Sovereign Borrowing
(In percent of total issuance)
13
III. ECONOMETRIC ANALYSIS AND RESULTS
Complementing the descriptive analysis above, an econometric exercise can provide
additional insight into crisis-related changes in government debt issuance and issuance
practices. In particular, the exercise aims to address the questions as to what impact the crisis had on total debt issuance and as to what extent it moved the composition of debt issuance away from pre-crisis DLTF standards. It also examines what the role of macroeconomic and investor sentiment has been. These questions are explored using a panel of the 16 euro area countries and Denmark for the January 2007–December 2009 period.
The econometric analysis draws from the newly constructed debt database.7 However, for the purposes of this analysis, individual issuances are aggregated into monthly flows, and Treasury bills with a maturity shorter than 12 months are not included. The macroeconomic variables (economic sentiment, industrial production, inflation, central government debt-to-GDP ratio, exchange rates, and spreads) are provided by Haver Analytics. Variable definitions and sources are in Appendix Table 3.
A. Determinants of Total Issuance
Regression analysis can help clarify the impact of the crisis, the debt stock,
macroeconomic variables and investor sentiment on issuance.8 Higher debt typically implies higher roll-over needs and hence higher gross issuance. However, depending upon the maturity structure of the debt, this effect may be absent in the relatively short period considered in this paper. In terms of macroeconomic variables, higher growth and higher business confidence are typically associated with lower headline deficits, while higher levels of inflation will tend to go together with a higher nominal deficit, and thus more borrowing. However, the prior effect of a change in the inflation rate is ambiguous: to the extent it is unanticipated, a change in inflation also acts as a tax on debt and affects the government budget constraint in real terms, with implications for gross financing needs. The determinants of total issuance can be examined in a panel set-up. The panel data equation in levels can be written as:
, , 1 , ,i t i t i t i i ty y X v
7 The information on cancelled issuances is not employed, however.
8 Such regression analysis can complement a simple decomposition of changes in gross issuance into rollover and net issuance.
14
where ,i ty is total issuance of bonds, ,i tX is a vector of explanatory variables, and the s represent estimated coefficients. The disturbances are split into unobserved country effects vi,, which are i.i.d. and panel level effects ,i t . The regression coefficients are estimated using OLS with Newey-West standard errors.9 Using first differences eliminates the cross-sectional effects: ∆yi,t = β∆Xi,t + u i,t,
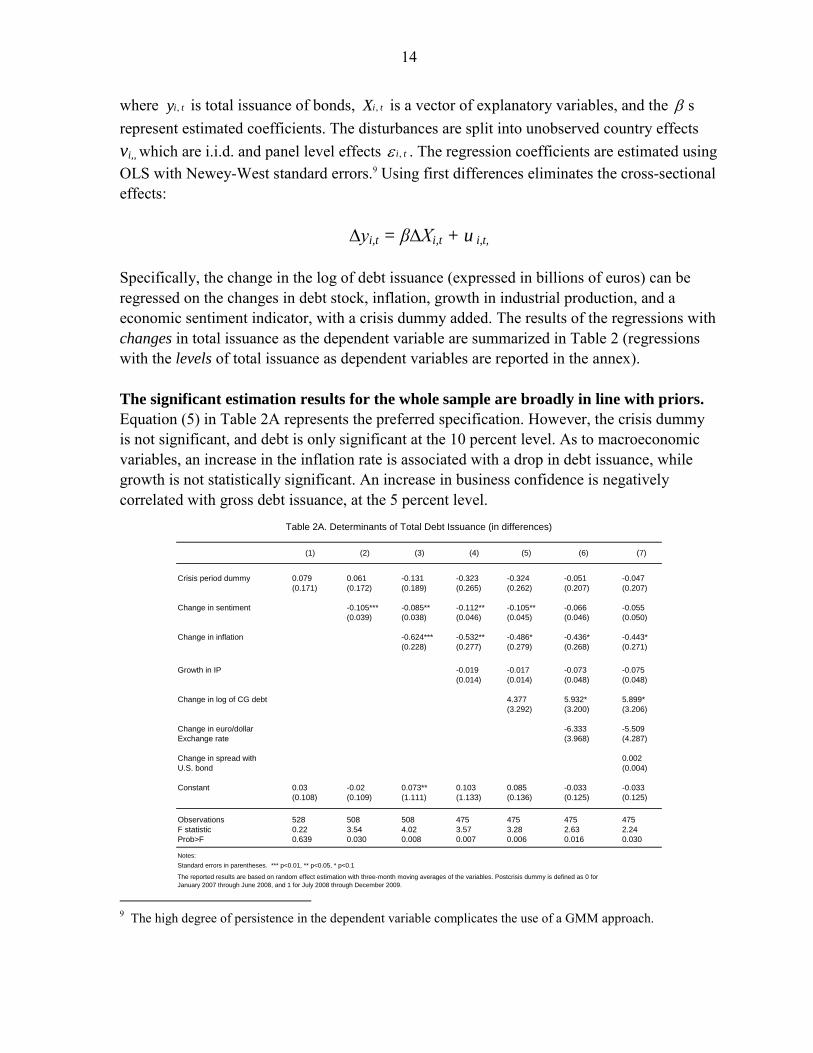
Specifically, the change in the log of debt issuance (expressed in billions of euros) can be regressed on the changes in debt stock, inflation, growth in industrial production, and a economic sentiment indicator, with a crisis dummy added. The results of the regressions with changes in total issuance as the dependent variable are summarized in Table 2 (regressions with the levels of total issuance as dependent variables are reported in the annex). The significant estimation results for the whole sample are broadly in line with priors.
Equation (5) in Table 2A represents the preferred specification. However, the crisis dummy is not significant, and debt is only significant at the 10 percent level. As to macroeconomic variables, an increase in the inflation rate is associated with a drop in debt issuance, while growth is not statistically significant. An increase in business confidence is negatively correlated with gross debt issuance, at the 5 percent level.
(1) (2) (3) (4) (5) (6) (7)
Crisis period dummy 0.079 0.061 -0.131 -0.323 -0.324 -0.051 -0.047
(0.171) (0.172) (0.189) (0.265) (0.262) (0.207) (0.207)
Change in sentiment -0.105*** -0.085** -0.112** -0.105** -0.066 -0.055
(0.039) (0.038) (0.046) (0.045) (0.046) (0.050)
Change in inflation -0.624*** -0.532** -0.486* -0.436* -0.443*
(0.228) (0.277) (0.279) (0.268) (0.271)
Growth in IP -0.019 -0.017 -0.073 -0.075
(0.014) (0.014) (0.048) (0.048)
Change in log of CG debt 4.377 5.932* 5.899*
(3.292) (3.200) (3.206)
Change in euro/dollar -6.333 -5.509
Exchange rate (3.968) (4.287)
Change in spread with 0.002
U.S. bond (0.004)
Constant 0.03 -0.02 0.073** 0.103 0.085 -0.033 -0.033
(0.108) (0.109) (1.111) (1.133) (0.136) (0.125) (0.125)
Observations 528 508 508 475 475 475 475
F statistic 0.22 3.54 4.02 3.57 3.28 2.63 2.24
Prob>F 0.639 0.030 0.008 0.007 0.006 0.016 0.030
Notes:
Standard errors in parentheses. *** p<0.01, ** p<0.05, * p<0.1
Table 2A. Determinants of Total Debt Issuance (in differences)
The reported results are based on random effect estimation with three-month moving averages of the variables. Postcrisis dummy is defined as 0 for
January 2007 through June 2008, and 1 for July 2008 through December 2009. 9 The high degree of persistence in the dependent variable complicates the use of a GMM approach.
15
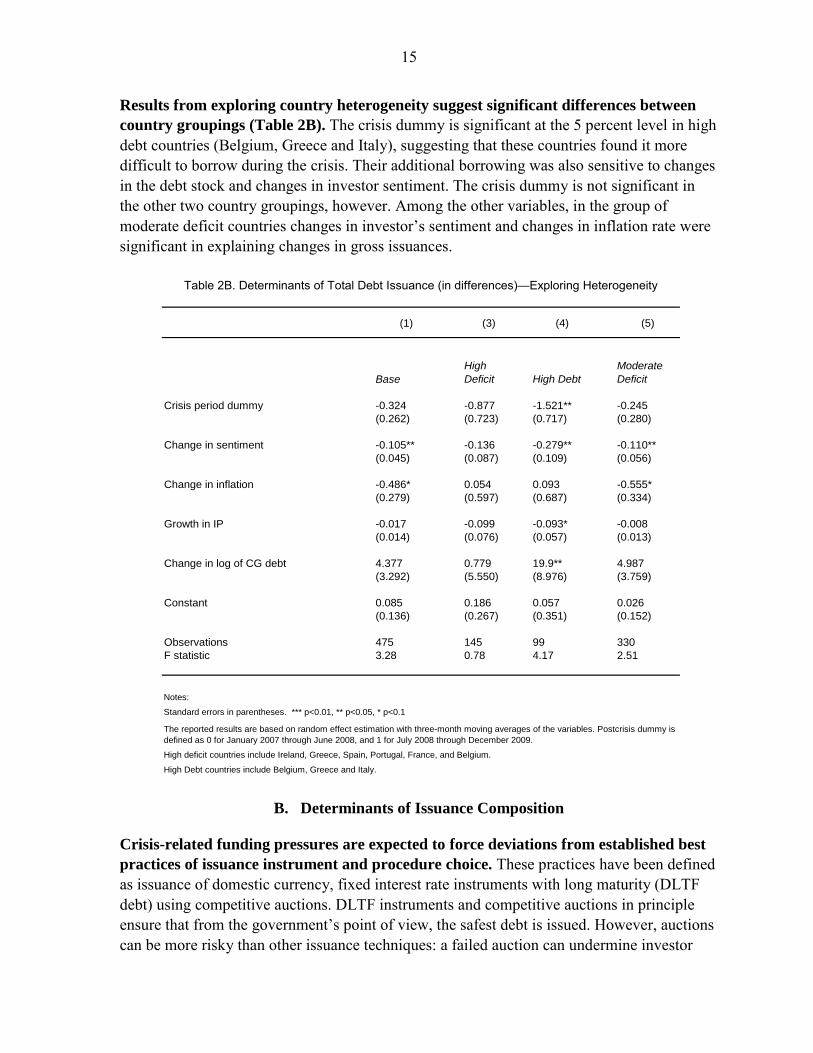
Results from exploring country heterogeneity suggest significant differences between
country groupings (Table 2B). The crisis dummy is significant at the 5 percent level in high debt countries (Belgium, Greece and Italy), suggesting that these countries found it more difficult to borrow during the crisis. Their additional borrowing was also sensitive to changes in the debt stock and changes in investor sentiment. The crisis dummy is not significant in the other two country groupings, however. Among the other variables, in the group of moderate deficit countries changes in investor’s sentiment and changes in inflation rate were significant in explaining changes in gross issuances.
(1) (3) (4) (5)
Base
High
Deficit High Debt
Moderate
Deficit
Crisis period dummy -0.324 -0.877 -1.521** -0.245
(0.262) (0.723) (0.717) (0.280)
Change in sentiment -0.105** -0.136 -0.279** -0.110**
(0.045) (0.087) (0.109) (0.056)
Change in inflation -0.486* 0.054 0.093 -0.555*
(0.279) (0.597) (0.687) (0.334)
Growth in IP -0.017 -0.099 -0.093* -0.008
(0.014) (0.076) (0.057) (0.013)
Change in log of CG debt 4.377 0.779 19.9** 4.987
(3.292) (5.550) (8.976) (3.759)
Constant 0.085 0.186 0.057 0.026
(0.136) (0.267) (0.351) (0.152)
Observations 475 145 99 330
F statistic 3.28 0.78 4.17 2.51
Notes:
Standard errors in parentheses. *** p<0.01, ** p<0.05, * p<0.1
High deficit countries include Ireland, Greece, Spain, Portugal, France, and Belgium.
High Debt countries include Belgium, Greece and Italy.
Table 2B. Determinants of Total Debt Issuance (in differences)—Exploring Heterogeneity
The reported results are based on random effect estimation with three-month moving averages of the variables. Postcrisis dummy is
defined as 0 for January 2007 through June 2008, and 1 for July 2008 through December 2009.
B. Determinants of Issuance Composition
Crisis-related funding pressures are expected to force deviations from established best
practices of issuance instrument and procedure choice. These practices have been defined as issuance of domestic currency, fixed interest rate instruments with long maturity (DLTF debt) using competitive auctions. DLTF instruments and competitive auctions in principle ensure that from the government’s point of view, the safest debt is issued. However, auctions can be more risky than other issuance techniques: a failed auction can undermine investor
16
confidence. Direct placement and syndication, on the other hand, can reduce placement uncertainty, but may also limit the investor base and carries higher intermediation costs, including fees. Faced with the need to place a massive increase in debt, euro zone sovereign debt managers have been willing to entice investors by assuming more risk through instrument choice, and to pragmatically select issuance techniques on a case-by-case basis taking into account placement risk versus intermediation costs trade-offs. To the extent it can limit the cost of funding, a move away from DLTF debt can be a proper government debt management choice. The crisis as such is accordingly expected to have had the following impact on the
composition of debt issuance:
More issuance in international markets: offers additional protection to investors in
case of default
Ambiguous impact on the use of direct placement and syndicated techniques: these techniques can reduce placement uncertainty, but are also more costly
Less DLTF issuances: With DLTF debt, the investor assumes most of the issuance risk. Given heightened market uncertainty and the surge in debt issuance, investors are expected to want less risk exposure and prefer debt of shorter maturity, or debt indexed to foreign-currency, a short-term interest rate and possibly inflation. These alternatives to DLTF placements are discussed below:
o More short-term debt: is typically less costly in the short run for the debtor and can smooth the impact of higher debt issuance on interest payments (inter-temporal risk transfer); such debt is less risky for the investor
o Ambiguous impact on CPI-indexed debt: in principle better protection for the investor, but the crisis has reduced inflation and inflation expectations, bringing down the related value of inflation protection
o More foreign-currency debt: shifts currency risk exposure from the investor to the debtor
o More floating rate debt: is typically less costly in the short run for the debtor; transfers risks related to changes in global interest rates and in the country’s perceived creditworthiness from the investor to the debtor.
Debt, macroeconomic fundamentals and investor confidence are expected to be
important as well. In recent years, research on the macroeconomic and confidence factors determining the composition of government debt has focused on emerging market countries and stock data (see, for instance, Jeanne and Guscina (2006), Guscina (2008), Mehl and

17
Reynaud (2008), Guscina, Ilyina and Kamil (2010)). However, most insights from this analysis carry over to the advanced economies and issuance data. Notably, it emphasizes that while DLTF debt is the least risky from the debtor’s standpoint, creditors will only accept it at a low interest cost to the extent they view government policies as credible and fundamentals as strong. Among other variables, low inflation, associated with a prudent monetary policy, and robust economic growth are expected to promote DLTF issuance at a low interest cost.
Based upon the recent research on DLTF shares, the following priors can be
formulated:
Higher debt has a non-linear effect on DLTF shares and the use of auctions. Debt has
to achieve a critical mass for liquidity purposes and generate institutional investor interest. However, once the debt (as a share of GDP) exceeds a certain threshold, sovereign risk is a concern and DLTF instruments are less attractive for investors
Higher economic growth (proxied by growth in industrial production) creates more favorable conditions for safer and less costly borrowing practices from the government’s point of view (more DLTF debt placed via competitive auctions). The variable’s effect on total borrowing is negative: higher growth is typically associated with lower headline deficits
Higher inflation (expectations) will make it harder for governments to issue DLTF debt and use auctions. As inflation erodes the returns on nominal debt in real terms, investors want to avoid or receive compensation for the risk of real return erosion. However, as inflation in the euro area was generally modest in 2007–09, it is unlikely to have exceeded the threshold above which inflation could have materially affected the choice of debt instrument or selling technique in this period
Finally, greater investor confidence in the economy (as proxied by business sentiment) will support investor risk appetite and facilitate issuance of DLTF instruments using auctions. As a forward looking variable, investor sentiment can be more important than macroeconomic fundamentals in determining the success of individual auctions (and thus the share of new issues that are placed via auctions).
Censored Tobit estimation methodology is used for the regression analysis of issuance
composition. Since DLTF debt shares or auction shares are bounded between zero and one, the estimation technique employed has to take into account the limited dependent variable. Given the panel structure of our dataset, the possible existence of unobservable country effects also has to be considered. Since unobserved country heterogeneity can bias standard Tobit estimation, we resort to random-effects Tobit estimation, which is defined as a combination of linear and probabilistic regressions (see, for instance, Greene, Econometric Analysis, 2007).

18
The results for auction shares are summarized in Table 3A, with equation (6)
representing the preferred specification. The crisis dummy is highly significant in all specifications. It implies that the financial crisis increased the share of debt placed via auctions by 17 percent. While the use of syndication is less risky, it is also more costly. An increase in the share of auctions following the crisis implies that the governments in the euro area tried to raise funds at the lowest possible cost. Debt and macroeconomic fundamentals (inflation, growth in industrial production) are not statistically significant. However, the business sentiment indicator is highly significant and robust to various specifications, suggesting that for competitive auctions to be successful, investor confidence mattered more than ex post economic indicators. The secondary market spread with 10-year US Bond is positively associated with the share of auctions. This suggests that as the cost of borrowing increases, governments are more likely to use auctions, as opposed to more costly syndicates.
(1) (2) (3) (4) (5) (6) (7)
Crisis period dummy -6.655** 17.430*** 17.032*** 17.298*** 15.832*** 16.667*** 14.725***
(3.305) (5.410) (5.435) (5.441) (5.500) (5.469) (5.642)
Sentiment 1.044*** 0.968*** 0.960*** 1.135*** 1.605*** 1.617***
(0.195) (0.205) (0.205) (0.256) (0.336) (0.334)
Inflation 1.247 1.09 1.743 0.427 -0.028
(1.051) (1.062) (1.160) (1.297) (1.334)
log of CG debt -5.225 -0.423 -0.372 -0.563
(5.056) (5.111) (5.364) (5.427)
Growth in IP -0.454 -0.453 -0.472
(0.400) (0.397) (0.396)
Spread with 0.083** 0.091**
10-year U.S. bond (0.038) (0.039)
Change in euro/dollar 80.516
Exchange rate (62.261)
Constant 112.043*** 0.767 5.632 32.888 -14.351 -60.647 -58.967
(8.575) (22.279) (22.729) (35.086) (35.134) (44.439) (44.504)
Observations 391 381 381 381 347 347 347
Number of ID 15 14 14 14 13 13 13
Wald test 4.06 33.03 34.29 35.22 35.2 40.08 41.9
Notes:
Standard errors in parentheses. *** p<0.01, ** p<0.05, * p<0.1
The reported results are based on random effect estimation with three-month moving averages of the variables. Postcrisis dummy is defined as 0 for
January 2007 through June 2008, and 1 for July 2008 through December 2009.
Table 3A. Determinants of Auction Share in Total Issuance—Censored Tobit Estimation
Results for country sub-groupings show considerable heterogeneity (Table 3B.) The crisis dummy is highly significant in the high deficit countries only, but insignificant in moderate deficit sub-group. What matters the most for high debt countries, is the stock of debt, and investor sentiment. The debt variable is highly significant in the high debt countries, and the macroeconomic variables are significant (at the 5 or 10 percent level) in

19
the moderate deficit countries. The results by sub-groupings confirm the general significance at the 1 percent level of the sentiment indicator.
(1) (2) (3) (4) (5)
Base no Greece High Deficit High Debt
Moderate
Deficit
Crisis period dummy 16.667*** 11.869** 27.224*** 17.907** 8.075
(5.469) (5.241) (8.027) (9.118) (7.430)
Sentiment 1.605*** 1.192*** 2.116*** 2.079*** 1.847***
(0.336) (0.339) (0.550) (0.573) (0.500)
Inflation 0.427 0.402 -1.281 0.956 3.892
(1.297) (1.220) (1.983) (2.494) (1.929)
Log of CG debt -0.372 1.704 9.209 21.233*** 0.583
(5.364) (4.051) (11.617) (7.484) (5.876)
Growth in IP -0.453 -0.247 -0.694 -0.842 -1.193**
(0.397) (0.402) (0.864) (0.712) (0.587)
Spread with 0.083** 0.067* 0.112 0.141* 0.075
10-year U.S. bond (0.038) (0.036) (0.057) (0.078) (0.052)
Constant -60.647 -26.249 -185.22 -270.229 -82.07
(44.439) (40.136) (86.938) (74.029) (58.973)
Observations 347 320 129 95 218
Number of ID 13 12 4 3 9
Wald test 40.08 23.61 25.85 33.22 23.32
Notes:
Standard errors in parentheses. *** p<0.01, ** p<0.05, * p<0.1
High Debt countries include Belgium, Greece and Italy.
Table 3B. Determinants of Auction Share in Total Issuance—Exploring Heterogeneity
The reported results are based on random effect estimation with three-month moving averages of the variables. Postcrisis dummy is defined as 0
for January 2007 through June 2008, and 1 for July 2008 through December 2009.
The results of the panel regressions for the shares of DLTF debt confirm the priors for
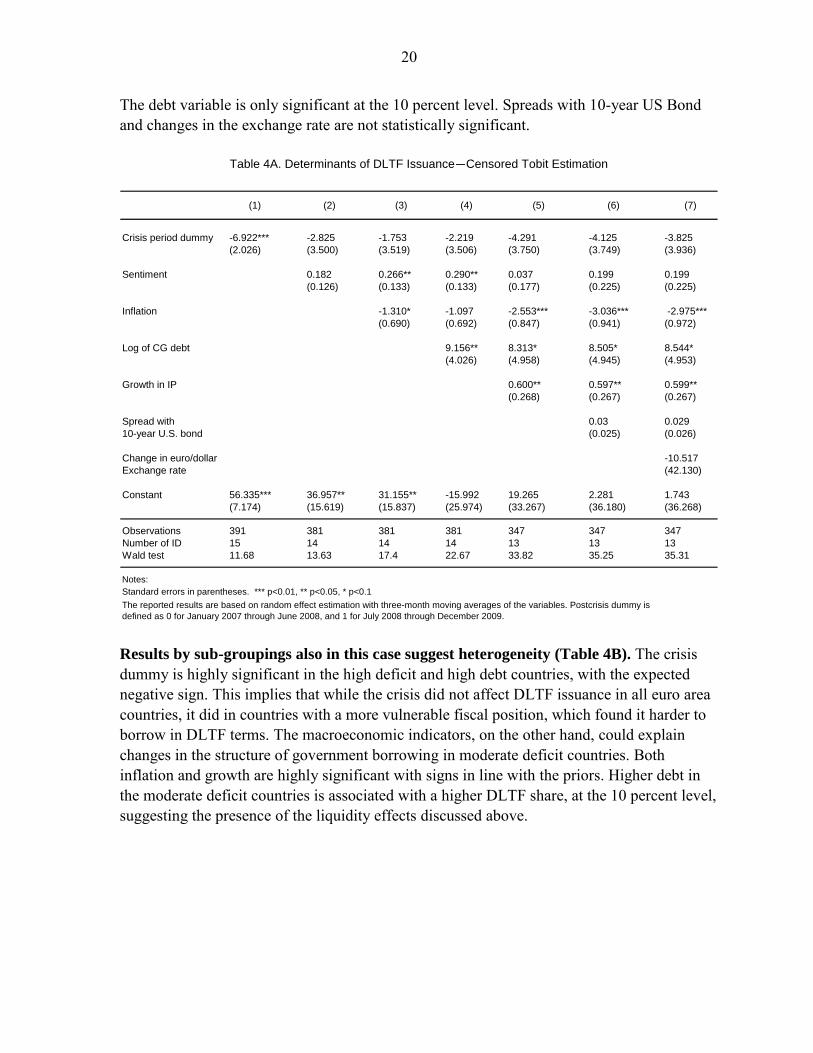
the macroeconomic variables (Table 4A). For the sample as whole, the crisis dummy is not statistically significant. However, the coefficient on the inflation rate is negative and statistically highly significant; a 1 percent increase in inflation rate is associated with a 2.5 percent drop in the share of DLTF issuance. Industrial production growth is positively associated with the share of DLTF debt, with a coefficient significant at the 5 percent level. A one percent increase in industrial production growth rate is associated with 0.6 of a percent increase in the share of DLTF debt. The sentiment indicator is always positive (meaning that investors confidence translates into a higher share of DLTF borrowing), but the effect is not statistically significant when controlling for other macroeconomic fundamentals such as growth in industrial production, exchange rate movements, and secondary market spreads.
20
The debt variable is only significant at the 10 percent level. Spreads with 10-year US Bond and changes in the exchange rate are not statistically significant.
(1) (2) (3) (4) (5) (6) (7)
Crisis period dummy -6.922*** -2.825 -1.753 -2.219 -4.291 -4.125 -3.825
(2.026) (3.500) (3.519) (3.506) (3.750) (3.749) (3.936)
Sentiment 0.182 0.266** 0.290** 0.037 0.199 0.199
(0.126) (0.133) (0.133) (0.177) (0.225) (0.225)
Inflation -1.310* -1.097 -2.553*** -3.036*** -2.975***
(0.690) (0.692) (0.847) (0.941) (0.972)
Log of CG debt 9.156** 8.313* 8.505* 8.544*
(4.026) (4.958) (4.945) (4.953)
Growth in IP 0.600** 0.597** 0.599**
(0.268) (0.267) (0.267)
Spread with 0.03 0.029
10-year U.S. bond (0.025) (0.026)
Change in euro/dollar -10.517
Exchange rate (42.130)
Constant 56.335*** 36.957** 31.155** -15.992 19.265 2.281 1.743
(7.174) (15.619) (15.837) (25.974) (33.267) (36.180) (36.268)
Observations 391 381 381 381 347 347 347
Number of ID 15 14 14 14 13 13 13
Wald test 11.68 13.63 17.4 22.67 33.82 35.25 35.31
Notes:
Standard errors in parentheses. *** p<0.01, ** p<0.05, * p<0.1
Table 4A. Determinants of DLTF Issuance—Censored Tobit Estimation
The reported results are based on random effect estimation with three-month moving averages of the variables. Postcrisis dummy is
defined as 0 for January 2007 through June 2008, and 1 for July 2008 through December 2009. Results by sub-groupings also in this case suggest heterogeneity (Table 4B). The crisis dummy is highly significant in the high deficit and high debt countries, with the expected negative sign. This implies that while the crisis did not affect DLTF issuance in all euro area countries, it did in countries with a more vulnerable fiscal position, which found it harder to borrow in DLTF terms. The macroeconomic indicators, on the other hand, could explain changes in the structure of government borrowing in moderate deficit countries. Both inflation and growth are highly significant with signs in line with the priors. Higher debt in the moderate deficit countries is associated with a higher DLTF share, at the 10 percent level, suggesting the presence of the liquidity effects discussed above.

21
(1) (2) (3) (4) (5)
Base no Greece High Deficit High Debt
Moderate
Deficit
Crisis period dummy -4.291 -4.135 -20.346*** -22.623*** 6.807
(3.750) (4.074) (5.120) (5.386) (5.343)
Sentiment 0.037 0.855 -0.483* 0.194 0.108
(0.177) (0.207) (0.256) (0.220) (0.257)
Inflation -2.553*** -2.507*** -1.327 -0.971 -4.046***
(0.847) (0.918) (0.999) (1.155) (1.380)
Log of CG debt 8.313* 7.687 -13.379 -10.363 10.570*
(4.958) (4.888) (12.638) (7.251) (5.794)
Growth in IP 0.600** 0.534* 0.578 -0.532 1.020***
(0.268) (0.301) (0.529) (0.410) (0.363)
Constant 19.265 14.618 195.433** 166.111*** 1.55
(33.267) (34.757) (79.030) (51.144) (42.235)
Observations 347 320 129 95 218
Number of ID 13 12 4 4 9
Wald test 33.82 30.49 40.39 31.36 25
Notes:
Standard errors in parentheses. *** p<0.01, ** p<0.05, * p<0.1
High deficit countries include Ireland, Greece, Spain, Portugal, France, and Belgium.
High Debt countries include Belgium, Greece and Italy.
Table 4B. Determinants of DLTF Issuance—Exploring Heterogeneity
The reported results are based on random effect estimation with three-month moving averages of the variables. Postcrisis dummy is defined as 0 for January
2007 through June 2008, and 1 for July 2008 through December 2009.

22
IV. CONCLUSION
This paper has documented and analyzed crisis-related changes in government debt
issuance practices in the 16 euro zone countries and Denmark. Using a newly constructed database on primary market debt issuance during 2007–09, we find evidence of a shift away from pre-crisis standards of best funding practices—competitive auctions of debt instruments with a fixed coupon, long maturity and local currency denomination (DLTF). Exploiting the cross-country panel data dimension of the data, we conclude that the crisis and related changes in the macroeconomic environment and investor sentiment can account for a significant proportion of the deviation. The crisis has forced governments to assume additional risk. Shorter maturities, a foreign currency denomination, or a floating rate coupon have reduced investor risk, while giving government debt managers the opportunity to limit the immediate impact of the crisis on interest payments in return for accepting more risk. The negative effect of the crisis on DLTF debt issuance was especially pronounced in high deficit and high debt euro area countries. In addition to the crisis, the debt stock, investor sentiment and macroeconomic
fundamentals continued to have an important impact. The paper’s results in this regard are broadly in line with those suggested by previous theoretical and empirical research. In particular, a higher debt stock is associated with higher issuance, with a higher share of auctions in high debt countries, and with a higher share of DLTF issuance in moderate deficit countries. Stronger investor sentiment is associated with lower issuance and facilitates the use of auctions. Growth and inflation are highly significant with the expected sign in explaining the share of DLTF issuance in moderate deficit countries, but they have limited explanatory power as to the use of auctions both in the aggregate and for country sub-groupings—in line with the theoretical ambiguity of the link between macroeconomic variables and the share of auctions in issuances. Additional contingent exposure is a major concern. Euro zone sovereigns have generally assumed more issuance risk and in some cases opportunistically pursued interest cost minimization during the crisis. In particular, the shift to shorter maturities, and the issuance of floating rate and foreign currency denominated debt allowed governments simultaneously to match reduced risk appetite of investors and, in an environment with exceptionally low short-term interest rates, limit the impact of higher deficits and debt on interest payments. But they also exposed these governments to substantially higher refinancing and repricing risks and, in the case of foreign currency-denominated debt, important exchange rate risks.

23
Appendix Tables
2007-2008H1 2008H2-2009
Austria 1,667 1,816
Belgium 4,697 4,722
Cyprus 62 429
Denmark 271 1,609
Finland 765 697
France 28,027 48,102
Germany 10,301 12,531
Greece 3,808 4,884
Ireland 765 3,335
Italy 36,384 42,382
Malta 111 206
Netherlands 7,692 18,726
Portugal 1,850 2,961
Slovakia 223 740
Slovenia 150 279
Spain 5,089 16,697
Source: De Broeck-Guscina Debt Database (2010).
Table A1. Changes in Total Debt Issuance
(Mean of distribution, in billions of Euros)
24
2007-2008H1 2008H2-2009
Austria 2 3
Belgium 2 3
Cyprus 1 0
Denmark 2 2
Finland 0 0
France 15 22
Germany 3 3
Greece 2 2
Ireland 0 3
Italy 11 12
Malta 5 6
Netherlands 4 11
Portugal 2 3
Slovakia 1 3
Slovenia 1 1
Spain 3 6
Source: De Broeck-Guscina Debt Database (2010).
Table A2. Changes in Number of Issues
(Mean of distribution)
25
2007-2008H1 2008H2-2009
Austria 870 704
Belgium 2,134 1,705
Cyprus 18 420
Denmark 142 832
Finland 721 638
France 1,930 2,156
Germany 5,218 4,504
Greece 1,710 2,894
Ireland 765 1,206
Italy 3,577 3,712
Malta 20 33
Netherlands 1,621 1,589
Portugal 805 908
Slovakia 98 250
Slovenia 104 116
Spain 1,964 3,015
Source: De Broeck-Guscina Debt Database (2010).
Table A3. Changes in Average Size of Issue
(Mean of distribution, in billions of Euros)
26
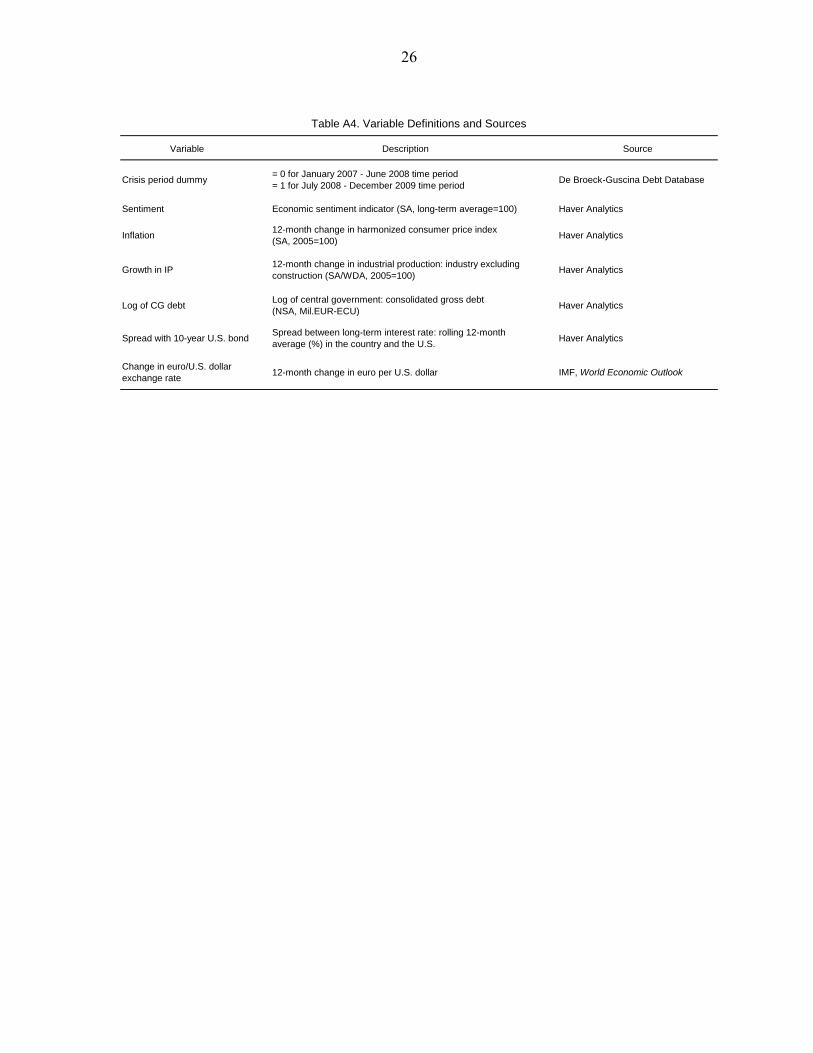
Variable Description Source
Crisis period dummy= 0 for January 2007 - June 2008 time period
= 1 for July 2008 - December 2009 time periodDe Broeck-Guscina Debt Database
Sentiment Economic sentiment indicator (SA, long-term average=100) Haver Analytics
Inflation12-month change in harmonized consumer price index
(SA, 2005=100) Haver Analytics
Growth in IP12-month change in industrial production: industry excluding
construction (SA/WDA, 2005=100) Haver Analytics
Log of CG debt Log of central government: consolidated gross debt
(NSA, Mil.EUR-ECU) Haver Analytics
Spread with 10-year U.S. bondSpread between long-term interest rate: rolling 12-month
average (%) in the country and the U.S.Haver Analytics
Change in euro/U.S. dollar
exchange rate12-month change in euro per U.S. dollar IMF, World Economic Outlook
Table A4. Variable Definitions and Sources

27
Annex: Determinants of Total Debt Issuance—Estimated in Levels
The results of panel regressions in levels with total issuance as the dependent variable are summarized in Annex Table 1. The log of debt issuance (expressed in billions of euros) is regressed on the debt stock, inflation, growth in industrial production, and a business sentiment indicator, with a post-crisis dummy added. The significant estimation results for the whole sample are broadly in line with priors. However, the post-crisis dummy is not significant, and debt is only significant at the 10 percent level. As to macroeconomic variables, higher inflation is correlated with higher debt issuance, but growth is not significant. Business confidence is negatively correlated with gross debt issuance at the 5 percent level.
(1) (2) (3) (4) (5) (6)
Lag dep. variable 0.997*** 0.996*** 0.998*** 0.998*** 0.988***
(0.012) (0.012) (0.012) (0.012) (0.015)
Crisis period dummy 3.725** 0.091 -0.343 -0.444 -0.486 -0.44
(1.511) (0.165) (0.291) (0.299) (0.338) (0.342)
Sentiment -0.020* -0.028** -0.026** -0.027**
(0.010) (0.011) (0.013) (0.013)
Inflation 0.132*** 0.165*** 0.169***
(0.046) (0.054) (0.054)
Growth in IP -0.011 -0.008
(0.016) (0.016)
Log of CG debt 0.130*
(0.067)
Constant 6.257*** 0.049 2.229** 2.753** 2.473* 1.984
(0.922) (0.104) (1.128) (1.169) (1.381) (1.423)
Observations 544 528 508 508 475 475
F statistic 6.074 3303 2319 1830 1437 1381
Prob>F 0.014 0.000 0.000 0.000 0.000 0.000
Notes:
Standard errors in parentheses. *** p<0.01, ** p<0.05, * p<0.1
Annex Table 1. Determinants of Total Debt Issuance (in levels)
The reported results are based on random effect estimation with three-month moving averages of the variables. Postcrisis dummy is defined
as 0 for January 2007 through June 2008, and 1 for July 2008 through December 2009.

28
Results from exploring country heterogeneity suggest significant differences between country groupings (Annex Table 2). The post-crisis dummy is highly significant in high debt countries (Belgium, Greece and Italy). The dummy is also significant at the 5 percent level in high deficit countries (Belgium, France, Greece, Ireland, Portugal, Spain), but not when the deficit is only moderate. However, in this group of moderate deficit countries, the debt (rollover proxy) is highly significant.
(1) (3) (4) (5)
Base High Deficit High Debt
Moderate
Deficit
Lag dep. variable 0.988*** 0.992*** 0.992*** 0.968***
(0.015) (0.026) (0.016) (0.017)
Crisis period dummy -0.44 -1.399* -2.100*** -0.303
(0.342) (0.783) (0.783) (0.402)
Sentiment -0.027** -0.048* -0.065*** -0.024
(0.013) (0.025) (0.024) (0.016)
Inflation 0.169*** 0.238** 0.389** 0.174***
(0.054) (0.118) (0.154) (0.060)
Growth in IP -0.008 -0.062 -0.062 -0.006
(0.016) (0.072) (0.066) (0.019)
Log of CG debt 0.130* 0.458 -0.15 0.191***
(0.067) (0.417) (0.121) (0.074)
Constant 1.984 2.220 7.001*** 1.393
(1.423) (2.017) (2.516) (1.620)
Observations 475 145 132 330
F statistic 1381 466 933 1084
Notes:
Standard errors in parentheses. *** p<0.01, ** p<0.05, * p<0.1
High deficit countries include Ireland, Greece, Spain, Portugal, France, and Belgium.
High Debt countries include Belgium, Greece and Italy.
Annex Table 2. Determinants of Total Debt Issuance—Exploring Heterogeneity
The reported results are based on random effect estimation with three-month moving averages of the variables. Postcrisis
dummy is defined as 0 for January 2007 through June 2008, and 1 for July 2008 through December 2009.
(In levels)

29
References
Barbosa, Luciana and Sónia Costa, 2010, ―Determinants of Sovereign Bond Yield Spreads in the Euro Area in the Context of the Economic and Financial Crisis,‖ Banco de Portugal, Working Paper 22/2010 (Lisbon: Banco de Portugal). Biais, Bruno, Antoine Renucci and Gilles Saint-Paul, 2004,‖Liquidity and the Cost of Funds in the European Treasury Bills Market,‖ IDEI Working Papers 285 (Toulouse: Institut d'Économie Industrielle). Guscina, Anastasia. 2008, ―Impact of Macroeconomic, Political, and Institutional Factors on the Structure of Government Debt in Emerging Market Countries,‖ IMF Working Paper 08/205 (Washington DC: International Monetary Fund). Guscina, Anastasia, Anna, Ilyina, and Herman Kamil, 2010, ―Does Procyclical Fiscal Policy Reinforce Incentives to Dollarize Sovereign Debt?‖ IMF Working Paper 10/168 (Washington DC: International Monetary Fund). Greene, William, 2007, Econometric Analysis, Prentice-Hall, sixth edition (Upper Saddle River NJ: Pearson-Prentice Hall). Hoogduin, Lex, Bahar Öztürk, and Peter Wierts, 2010, ―Public Debt Managers’ Behaviour: Interactions with Macro Policies,‖ DNB Working Paper No. 273 (Amsterdam: De Nederlandsche Bank).
Jeanne, Olivier, and Anastasia Guscina, 2006, ―Government Debt in Emerging Market Countries: New Data Set,‖ IMF Working Paper 06/98 (Washington DC: International Monetary Fund).
Mehl, Arnaud, and Julien Reynaud, 2008, "Domestic Debt Structures in Emerging Markets:
New Empirical Evidence,‖ Documents de travail du Centre d’Economie de la Sorbonne, 08059 (Paris: Université Panthéon-Sorbonne (Paris 1), Centre d'Economie de la Sorbonne).


![[Engel a., Van Den Broeck C.] Statistical Mechanic(BookZZ.org)](https://img.pdfslide.us/doc/110x75/55cf8f53550346703b9b3540/engel-a-van-den-broeck-c-statistical-mechanicbookzzorg.jpg)