Embed Size (px)
Citation preview

TECHNICAL MEMORANDUM
MARK CENTER (BRAC) TRANSPORTATION STUDY
TASK ORDER 7 VIRGINIA DEPARTMENT OF TRANSPORTATION
STATEWIDE TRAFFIC ENGINEERING LIMITED SERVICES CONTRACT – YEAR 3
APRIL 2009

Page 2 of 29
TECHNICAL MEMORANDUM
EXECUTIVE SUMMARY The Mark Center (BRAC) Transportation study was conducted to assist the Virginia Department of Transportation to evaluate the impacts due to the BRAC development on the surrounding arterial network and at the I-395 interchange. The primary purpose of the study was to assess the existing, opening year (2011) and year 2030 traffic conditions using Synchro/Simtraffic modeling. PB reviewed the existing Transportation Improvement & Management Program (TIMP) for Washington Headquarters (WHS) at Mark Center prepared for Duke Realty Corporation. The following observations are noted:
• With all trip assumptions made in the TIMP report, there are approximately 831 additional parking spaces which are not accounted for in the trip generation. The availability of these additional parking spaces could encourage more people to drive to the facility rather than using one of the TIMP options.
• A very high percentage (40%) TMP reductions are assumed which appears to be very aggressive to achieve for this location.
• Lower cycle lengths (100-seconds for AM peak hour and 110-seconds for PM peak hour) are used in the traffic analysis which may not be adequate for the opening year traffic conditions. Using the lower cycle lengths, delays reported may be less than the actual.
• Some of the left turn phases are considered as protected/permissive which should be protected only phase. As a result, the delays reported are lower than the actual.
• The traffic analysis for the opening year 2011 in the report shows an acceptable LOS “D” or better for all the intersections. But PB analysis shows the LOS “E” and “F” for some of the intersections.
PB has conducted an independent traffic analysis and Synchro modeling. All seven signalized intersections currently operate at an acceptable LOS “D” or better for the AM peak hour conditions. Only five of the seven signalized intersections operate an acceptable LOS “D” or better in the PM peak hour. PB used existing traffic volumes from the TIMP report for Mark Center and revised the traffic volumes for the opening year to account for the additional parking spaces not accounted for in the trip generation process. The offsite road improvements recommended in TIMP report are not adequate to handle the additional site generated traffic as some of the intersections will operate at unacceptable LOS “E” and LOS “F” by opening year 2011. Simtraffic analysis show queues extending to the mainline I-395 from the NB & SB off-ramps. Site generated traffic puts tremendous stress on the adjacent arterial network with very high turning volumes and heavy weaving and merging movements. The results of the traffic analysis indicate the proposed arterial improvements do not adequately provide an acceptable LOS and alternate access could be warranted. Direct access to Mark Center from I-395 general purpose and HOT lanes is desirable as it would provide an additional alternative for vehicular access to Mark Center. Alternatives to include direct access that would provide mitigation of the impacts to the surrounding network could be investigated during the preparation of the Interchange Justification Report (JR).

Page 3 of 29
TECHNICAL MEMORANDUM
PROJECT DESCRIPTION PB Americas Inc. (PB) was tasked to perform an independent analysis and review of the Traffic Impact Studies / Transportation Management Plans related to Mark Center. The scope of the work also includes Synchro modeling and independent traffic analysis on the impacts on the surrounding arterial network due to the additional traffic to Mark Center. REVIEWING THE EXISTING TRAFFIC STUDIES PB has identified and reviewed two traffic studies related to Mark Center, Alexandria, VA.
1. Mark Center Parcel 1A and 1B Traffic Impact Study and Transportation Management Plan, March 31, 2003: This Traffic Impact Studies / Transportation Management Plans (TIS/TMP) evaluates the cumulative traffic impacts of developing a total of 1,743,116 square feet of office space on Parcel 1A and 1B. The TIS/TMP for Mark Center Parcels 1A and 1B was approved by the City of Alexandria City Council on January 24, 2004. According to the study, Mark Center 1A will generate an additional 1350 AM peak hour trips and 1451 PM peak hours trips, upon completion and full occupancy. Mark Center Parcel 1B will generate an additional 481 AM peak hour trips and 449 PM peak hour trips upon completion and at full occupancy.
2. Transportation Improvement & Management Program (TIMP) for Washington Headquarters (WHS) at Mark Center, July 30, 2008: This TIMP is essentially an enhanced update to the previously approved TIS/TMP noted above, and includes many additional features designed specifically to accommodate the WHS requirement. Duke Realty Corporation proposes to develop a 1,750,000 gross square foot (GSF) headquarters campus that would accommodate 6,409 employees, as specified in BRAC 133 Build to Suit Request for Proposal. This TIMP was prepared in support of Duke Realty Corporation’s proposal, and is consistent with the TIS/TMP in place for Mark Center.
The review is mainly focused on the latest Transportation Improvement & Management Plan for Washington Headquarters (WHS) at Mark Center. Below is a summary some of the main observations:
1. On page 32 of the report it states that “the number of AM and PM peak hour trips that would be generated by the WHS were estimated based on parameters measured at Liberty Crossing, a comparable, large, secure, government installation” in Northern Virginia. The details for the Liberty Crossing building, like the number of employees, size of building, parking spaces, etc., are not provided in the report, therefore, it cannot be determined if the facility is of similar scale to the planned Washington Headquarters at Mark Center.
2. With trip assumptions made as shown in Table 1 below, it seems there will be
approximately 831 vacant parking spaces more than that identified in the TMP. The proposed number of parking spaces is 3846 (information provided by Duke Reality

Page 4 of 29
TECHNICAL MEMORANDUM
Corporation) and the parking spaces required with the TMP is 3015 (2872 Auto-drivers and 43 visitors). This may encourage more people to drive to the facility instead of using a carpool, shuttle bus or public transport. There is no additional information to indicate the rationale behind the assumptions in the Table 1 (percent scheduled to work day shift, percent due to illness, vacation and travel etc.) or the assumptions of how the percentage of mode splits were arrived at.
The table can be found on Page 36 of the TIMP report.
TRANSPORTATION IMPROVEMENT AND MANAGEMENT PLAN Table 3-6 (Page 36)
WHS Vehicle-Trip Generation Assumptions Number of WHS employees: 6,409 Number of WHS visitors:
239 (5% of WHS employees scheduled and present during the morning shift)
Percent schedules to work day shift: 83% 5319
Percent absent due to illness, vacation, travel etc. 10% 4787 Percent present on average day: 75% 4806 Parking Spaces: 3,904 (60% of all employees) Mode splits:
4787 Employees Visitors 239
Auto-drivers: 4787*.6=2872 60% 60% 239*.6=143 Auto passengers: 4787*.12=574 12% 18% 239*.18=43 Public Transit: 4787*.05=240 5% 5% 239*.05=12 Shuttle Bus: 4787*.2=957 20% 20% 239*.2=48 Walk/Bike/Other: 4787*.03=144 3% 3% 239*.03=7 Total: 4787 100% 100% 253 The number of parking spaces needed with the TMP reductions are 3015 The number of parking spaces available are 3846
Table 1. TMP Plan
3. As shown in Table 1, the total predicted TMP reductions are approximately 40%,
which appears to be a very aggressive goal. Maximum trip reductions of nearly 48% have been observed for employment sites that have the characteristics of being located in a central business districts, have preferential reserved parking for car/van

Page 5 of 29
TECHNICAL MEMORANDUM
pooling, restrict parking for single occupancy vehicles, charge for parking, and have a high level employer support for transit, carpool and vanpool usage1.
4. It is stated on Page 1 of the report that “the enclosed TMP is essentially an enhanced
update to the previously approved TIS/TMP for Mark Center dated March 31, 2003.” Only 10% TMP trip reduction is assumed for the previous TMP for Mark Center. No reasons were given in the report for such a dramatic increase (to 40%) in the TMP reduction percentage from the previous TIS/TMP to the new enhanced TIMP.
5. In the TIS/TMP dated March 31, 2003, it is mentioned that “The Mark Winkler
Company has also preserved sufficient land for a right-of-way to allow construction of a roadway that would carry inbound traffic only from the southbound I-395 on ramp. This ramp would be used by traffic that approaches from both the north and south on I-395 and from the east on Seminary Road”. The additional roadway will provide an alternative route instead of traveling on Seminary Road; to Beauregard Street; to Mark Center Drive. This additional recommendation was not mentioned in the latest TIMP. This recommendation will have a substantial reduction of impact on the arterial network because of the site generated traffic.
SYNCHRO ANALYSIS REVIEW
1. Page 38 of the TIMP report indicates that a 100-second cycle length should be considered for existing and future conditions for AM and a 110-second cycle length for PM. The Synchro files received from the City of Alexandria shows a 120-second cycle length for both AM and PM. The cycle lengths used in the TIMP report are not adequate from the Synchro analysis for the opening year and future year and therefore, the delays reported in the studies may be less than the actual.
2. In the Synchro analysis, some of the phases are shown as protected + permissive
instead of protected only phase. This could cause the delay values shown in the report to be less than the actual delays. The locations and phases where it was coded as protected + permissive are:
• Southbound left turn phase 3 at Seminary Road & N Beauregard Street. Presently phase 3 is protected only phase as shown in the Synchro files received from City of Alexandria and was field verified
• EBL (phase 1) and WBL (phase 5) at Seminary Road & Mark Center Drive for both existing and future year conditions. Presently both phases 1 & 5 are protected only from the Synchro files and from the field observations. Also, according to VDOT guidelines the left turn phase has to be protected only when they have to cross three opposing lanes.
• It is coded as protected + permissive phase for SBL at N Beauregard Street & Mark Center Drive. According VDOT guidelines protected only phase for dual left turns. SB will be converted to dual left turns in future, so it has to be coded
1 Institute of Transportation Engineers (ITE). 1993. Implementing Effective Employer-Based Travel Demand Management Programs, Final Report. Federal Highway Administration, Washington D.C., November.

Page 6 of 29
TECHNICAL MEMORANDUM
as protected only phase. The delays reported in the report may be less than the actual.
3. Presently, the four signals at the I-395 ramps operate as free operation at maximum
cycle length of 201.5 seconds. These ramps are coded with coordinated plans at 100-second cycle length for AM and 110-second cycle length for PM for both existing and future conditions.
4. There is a discrepancy in the report regarding for the NB through movement at
Seminary Road & Mark Center Drive. The traffic volumes shown in the Synchro analysis are different from the volume shown in the volume graphics. It appears that this may be a typographical error.
PB TRAFFIC ANALYSIS
STUDY AREA The study area for the traffic analysis is shown in the Figure 1 which includes 7 signalized intersections.
Figure 1. Study Area
N
IDA Building
Page 7 of 29
TECHNICAL MEMORANDUM
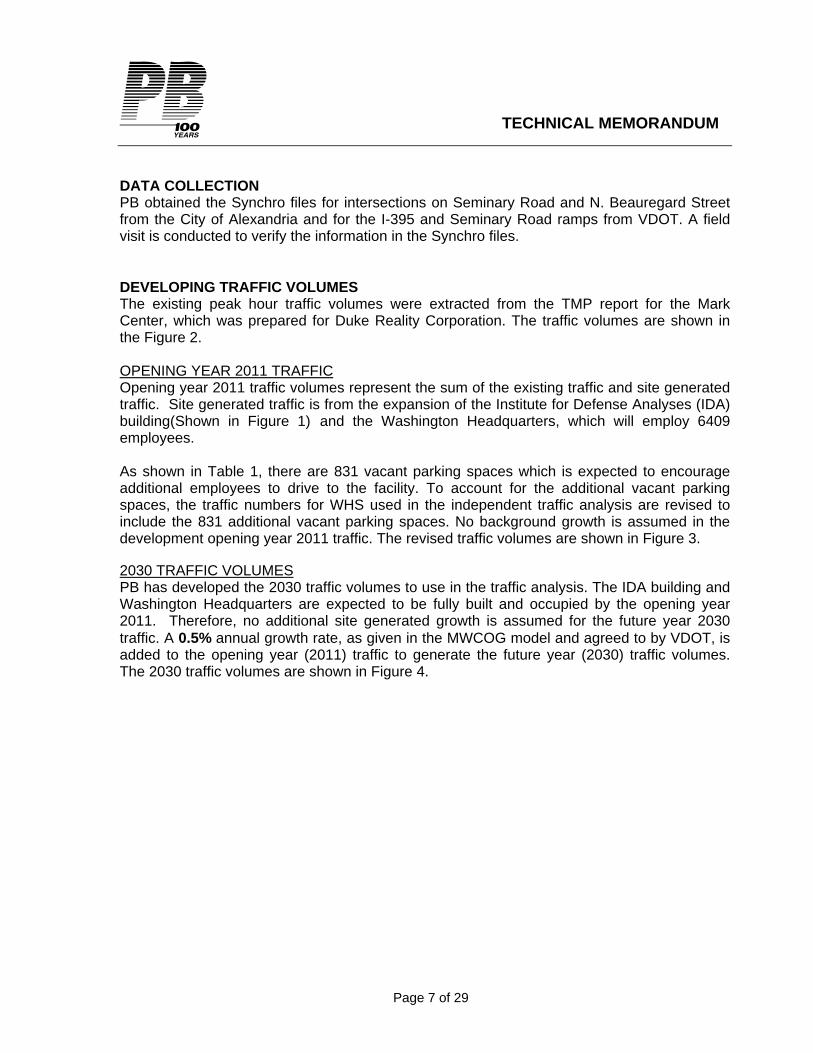
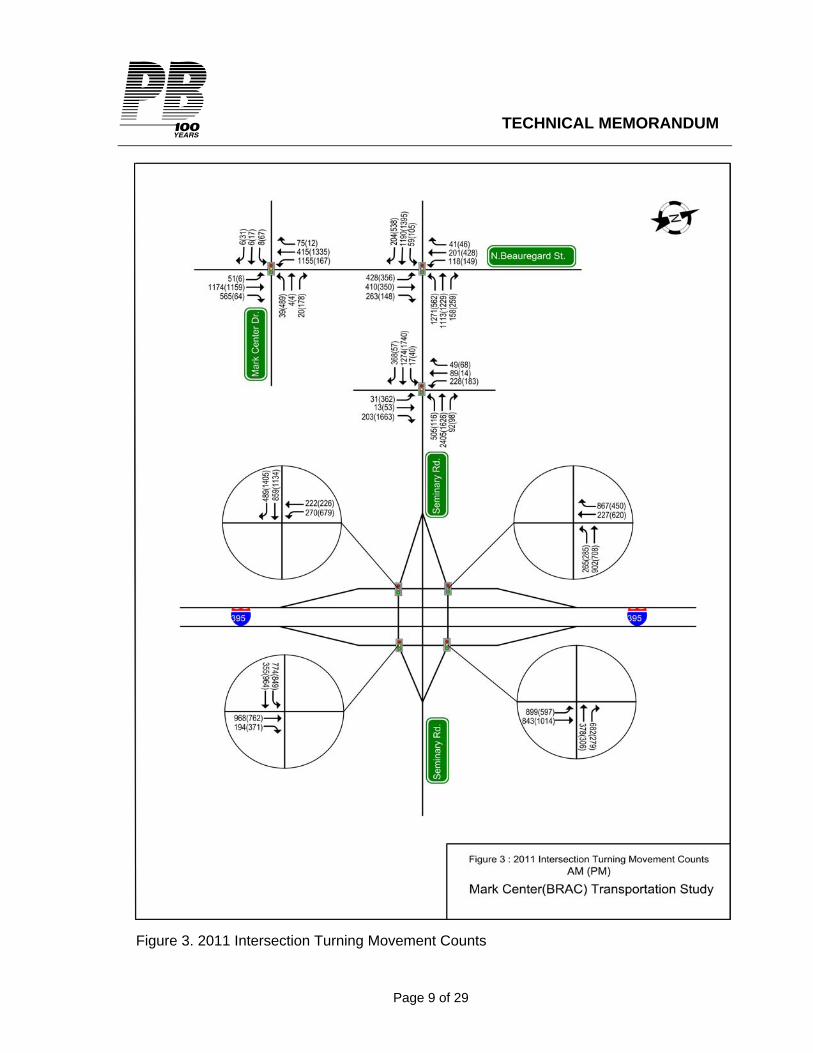
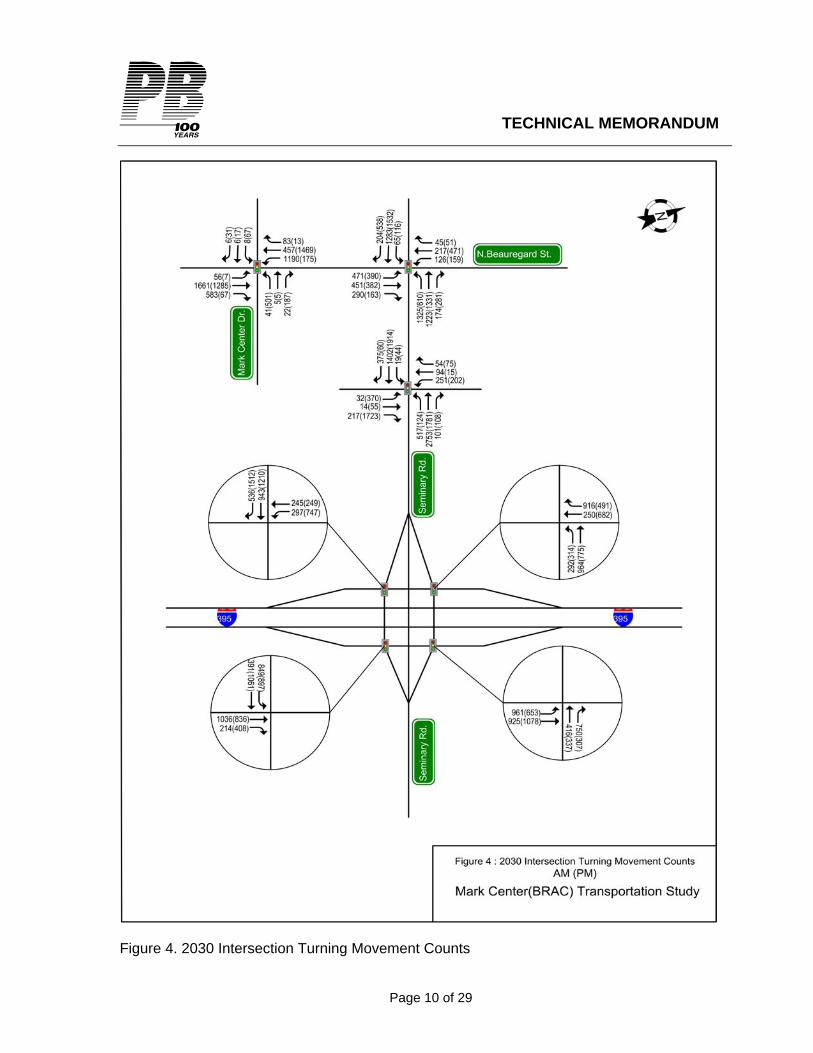
DATA COLLECTION PB obtained the Synchro files for intersections on Seminary Road and N. Beauregard Street from the City of Alexandria and for the I-395 and Seminary Road ramps from VDOT. A field visit is conducted to verify the information in the Synchro files. DEVELOPING TRAFFIC VOLUMES The existing peak hour traffic volumes were extracted from the TMP report for the Mark Center, which was prepared for Duke Reality Corporation. The traffic volumes are shown in the Figure 2. OPENING YEAR 2011 TRAFFIC Opening year 2011 traffic volumes represent the sum of the existing traffic and site generated traffic. Site generated traffic is from the expansion of the Institute for Defense Analyses (IDA) building(Shown in Figure 1) and the Washington Headquarters, which will employ 6409 employees. As shown in Table 1, there are 831 vacant parking spaces which is expected to encourage additional employees to drive to the facility. To account for the additional vacant parking spaces, the traffic numbers for WHS used in the independent traffic analysis are revised to include the 831 additional vacant parking spaces. No background growth is assumed in the development opening year 2011 traffic. The revised traffic volumes are shown in Figure 3. 2030 TRAFFIC VOLUMES PB has developed the 2030 traffic volumes to use in the traffic analysis. The IDA building and Washington Headquarters are expected to be fully built and occupied by the opening year 2011. Therefore, no additional site generated growth is assumed for the future year 2030 traffic. A 0.5% annual growth rate, as given in the MWCOG model and agreed to by VDOT, is added to the opening year (2011) traffic to generate the future year (2030) traffic volumes. The 2030 traffic volumes are shown in Figure 4.

Page 8 of 29
TECHNICAL MEMORANDUM
Figure 2. Existing Intersection Turning Movement Counts (Source: extracted from transportation management plan for Mark Center
Page 9 of 29
TECHNICAL MEMORANDUM
Figure 3. 2011 Intersection Turning Movement Counts
Page 10 of 29
TECHNICAL MEMORANDUM
Figure 4. 2030 Intersection Turning Movement Counts

Page 11 of 29
TECHNICAL MEMORANDUM
SYNCHRO MODELING The Synchro files received from City of Alexandria were combined with those from VDOT the traffic volumes were updated. In addition, Synchro files were prepared to simulate opening year 2011 and future year 2030. The cycle lengths and splits were optimized and adjusted to minimize the delay for the intersections. Existing Levels of Service: The existing levels of service (LOS) for the signalized intersections are shown in Figure 5. All seven signalized intersections currently operate at an acceptable LOS “D” or better for the AM peak hour conditions. Five signalized intersections currently operate at an acceptable LOS “D” or better for the PM peak hour conditions. However, Seminary Road & N. Beauregard Street and I-395 Northbound Off-ramp & Seminary Road intersections currently operate at an LOS “E”. Future Levels of Service: Opening year 2011: The levels of service (LOS) for the year 2011 are shown in Figure 6. For the AM peak hour, six intersections will operate at an acceptable LOS “D” or better. The I-395 Northbound off-ramp & Seminary Road intersection will operate at an LOS “E”. For the PM peak hour, four of the seven signalized intersections will operate at an acceptable LOS “D” or better. The Seminary Road & N. Beauregard Street and I-395 Southbound on-ramp & Seminary Road intersections will operate at an LOS “E”. The Seminary Road and Mark Center Drive intersection will operate at an LOS “F’. Future year 2030: The levels of service (LOS) for the year 2030 are shown in Figure 7. For the AM peak hour, five intersections will operate at an acceptable LOS “D” or better. The intersection of Seminary Road & N. Beauregard Street will operate at LOS “E” and the intersection of I-395 Northbound off-ramp & Seminary Road will operate at “F”. For the PM peak hour, only three of the seven intersections will operate an acceptable LOS “D” or better. The intersection I-395 Northbound off-ramp & Seminary Road will operate at an LOS “E” and the following three intersections will operate at an LOS “F”.
• Seminary Road & N. Beauregard Street • Seminary Road & Mark Center Drive • I-395 Southbound On-ramp & Seminary Road

Page 12 of 29
TECHNICAL MEMORANDUM
Figure 5. Existing AM/PM Levels of Service

Page 13 of 29
TECHNICAL MEMORANDUM
Figure 6. 2011 Levels of Service (LOS)

Page 14 of 29
TECHNICAL MEMORANDUM
Figure 7. 2030 Levels of Service (LOS)

Page 15 of 29
TECHNICAL MEMORANDUM
Comparison of Levels of Service: The levels of service from the PB traffic analysis are compared to the TMP and shown in Table 2. It should be noted that the cycle lengths are different between the two studies. PB has used Synchro optimized cycle lengths for both AM and PM peak periods.
EXISTING AM
EXISTING PM 2011 AM 2011 PM
S.No. Intersection TMP PB TMP PB TMP PB TMP PB
1 N Beauregard St & Mark Center Dr B C B B C C C D
2 Seminary Rd & N Beauregard St C D D E D D D E
3 Seminary Rd & Mark Center Dr C B C C D C C F
4 I-395 Southbound off-ramp & Seminary Rd B B C C C B C D
5 I-395 Northbound on-ramp & Seminary Rd B B B B C B C B
6 I-395 Northbound off-ramp & Seminary Rd B D C E C E D D
7 I-395 Southbound on-ramp & Seminary Rd B C B B B D C E Table 2. Comparison of LOS

Page 16 of 29
TECHNICAL MEMORANDUM
Comparison of delays: The delay (seconds/vehicle) for existing conditions, opening year 2011 and the future year 2030 are compared and tabulated as shown in Table 3.
Table 3. Comparison of Delay and LOS
Existing LOS(Delay) 2011 LOS(Delay) 2030 LOS(Delay) Approach AM PM AM PM AM PM 1. N. Beauregard Street & Mark Center Drive
EB D (42.5) D (42.4) D (48.7) C (20.1) D (51.5) C (20.4) WB D (38.7) E (58.6) E (60.2) F (92.3) E (64.8) F (103.1) NB B (14.0) B (11.0) D (45.8) C (33.6) E (59.7) D (35.8) SB C (20.0) A (6.8) A (9.8) C (29.2) B (10.2) D (36.2)
OVERALL B (16.8) B (13.6) C (29.2) D (42.4) D (36.9) D (47.7) 2. Seminary Road & N. Beauregard Street
EB D (41.3) E (66.4) E (73.2) E (66.6) F (96.0) F (123.1) WB D (53.2) D (40.4) D (43.1) D (44.4) D (44.2) E (63.8) NB D (37.9) E (70.1) D (43.1) E (58.0) F (88.8) E (65.0) SB D (42.5) E (58.4) E (72.8) E (71.2) E (79.6) F (102.3)
OVERALL D (45.5) E (57.2) D (53.0) E (57.5) E (69.4) F (89.8) 3. Seminary Road & Mark Center Drive
EB A (9.9) B (14.3) B (17.5) C (24.5) C (20.3) D (54.9) WB B (15.8) C (20.7) C (28.4) D (35.7) C (29.6) D (38.8) NB B (18.1) D (41.3) C (27.4) F (237.3) C (31.4) F (251.2) SB D (54.4) D (47.2) E (76.6) E (56.8) F (87.2) E (57.2)
OVERALL B (17.2) C (22.8) C (28.3) F (102.8) C (30.8) F (115.1) 4. I-395 Southbound Off-ramp &Seminary Road
WB A (1.8) A (4.4) A (4.7) A (6.9) A (6.0) A (7.1) SB C (21.6) D (43.1) B (17.4) E (71.7) B (18.3) F (91.1)
OVERALL B (10.6) C (24.4) B (10.8) D (40.5) B (11.9) D (50.7) 5. I-395 Northbound On-ramp &Seminary Road
WB C (27.4) D (39.3) C (31.8) D (46.4) C (33.1) D (46.8) NB A (1.3) A (2.9) A (2.8) A (4.7) A (3.9) A (8.1)
OVERALL B (12.4) B (14.8) B (13.8) B (15.8) B (15.1) B (18.6) 6. I-395 Northbound Off-ramp &Seminary Road
EB A (2.6) A (3.5) A (6.1) C (21.0) B (14.7) E (56.2) NB F (116.4) F (152.5) F (126.3) E (61.7) F (161.3) F (84.2)
OVERALL D (52.9) E (67.9) E (67.1) D (36.6) F (88.3) E (67.1) 7. I-395 Southbound On-ramp &Seminary Road
EB E (55.9) C (26.4) D (54.3) E (73.4) E (62.9) F (95.2) SB A (6.0) A (4.6) A (4.0) A (5.2) A (4.0) A (6.2)
OVERALL C (27.8) B (19.2) D (40.8) E (55.5) D (48.2) E (73.0)

Page 17 of 29
TECHNICAL MEMORANDUM
Comparison of V/C Ratios: The volume/capacity ratios for existing conditions, opening year 2011 and future year 2030 are shown in Table 4. The V/C ratios which exceed 0.90 are highlighted in yellow.
Existing Conditions Opening Year 2011 Future Year 2030 Approach
AM PM AM PM AM PM
1. N. Beauregard Street & Mark Center Drive EB 0.17 0.48 0.10 0.16 0.11 0.19
WB 0.27 0.79 0.43 1.14 0.47 1.18
NB 0.49 0.38 0.89 0.62 0.98 0.70
SB 0.66 0.58 0.85 0.79 0.85 0.87 2. Seminary Road & N. Beauregard Street
EB 0.76 1.04 0.99 0.70 1.07 1.10
WB 0.97 0.89 0.91 0.97 0.92 1.05
NB 0.87 0.91 0.98 0.83 1.18 0.92
SB 0.49 0.79 0.80 0.86 0.77 1.01 3. Seminary Road & Mark Center Drive
EB 0.48 0.71 0.75 0.93 0.85 1.06
WB 0.56 0.61 0.89 0.77 0.87 0.85
NB 0.23 0.77 0.37 1.53 0.39 1.56
SB 0.65 0.53 0.78 0.58 0.85 0.62 4. I-395 Southbound Off-ramp &Seminary Road
WB 0.32 0.38 0.41 0.36 0.44 0.39
SB 0.40 0.75 0.55 1.04 0.58 1.16 5. I-395 Northbound On-ramp &Seminary Road
WB 0.68 0.63 0.73 0.67 0.77 0.69
NB 0.43 0.37 0.62 0.40 0.67 0.45 6. I-395 Northbound Off-ramp &Seminary Road
EB 0.36 0.45 0.44 0.68 0.48 0.73
NB 1.18 1.34 1.21 0.96 1.31 1.06 7. I-395 Southbound On-ramp &Seminary Road
EB 0.59 0.67 0.86 1.15 0.48 1.24
SB 0.15 0.25 0.13 0.28 0.13 0.27 Table 4. Comparison of V/C Ratio

Page 18 of 29
TECHNICAL MEMORANDUM
Queuing Analysis: Peak hour queues were forecasted for the critical movements of each intersection, for existing, opening year and future year traffic volumes. Simtraffic simulation was used to determine the maximum queue lengths and is shown in Table 5.
Existing 2011 2030 Approach
AM PM AM PM AM PM
1. N. Beauregard Street & Mark Center Drive SBL 234 44 234 64 234 59
2. Seminary Road & N. Beauregard Street WBL 289 489 275 629 432 196
3. Seminary Road & Mark Center Drive WBL 156 43 234 168 234 146
NBR 70 392 130 634 75 634 4. I-395 Southbound Off-ramp &Seminary Road
SBR 172 1833 1833 1833 1833 1833 6. I-395 Northbound Off-ramp &Seminary Road
NBT 1418 1418 1418 655 1418 148
The actual queue lengths may be more than reported, The queues are more than the length of the link in Synchro model.
Table 5. Maximum queue lengths for critical movements Simtraffic analysis shows long queues for the following locations:
• Long queues for NB I-395 off-ramp & Seminary Road for AM peak hour: The available stacking for NB off-ramp is 1418 ft approximately. The traffic going to Mark Center is very heavy and Simtraffic simulation show queues using the entire available storage space and the queues are expected to extend to the I-395 mainline.
• Long queues for SB off-ramp & Seminary Road for AM peak Hour: The available
stacking distance for SB off-ramp is 1833 feet. Because of the heavy Mark center traffic and lane drop, Simtraffic simulation show queues extend to the I-395 mainline which will cause delays to the I-395 mainline.
• Long queues for NB Mark Center Drive at Seminary Road for PM peak hour:
Simtraffic show very long queues for NB because of the heavy right turning traffic (1723 vph) and are estimated to cause delay on the local roads within Mark Center.

Page 19 of 29
TECHNICAL MEMORANDUM
Also because of the heavy right turning traffic, queues are estimated to extend from I-395 to N. Beauregard Street on Seminary Road during evening peak hour.

Page 20 of 29
TECHNICAL MEMORANDUM
IDENTIFIED TRAFFIC CONCERNS All the traffic concerns noted below are applicable to both the opening year (2011) and future year (2030). Only 2011 traffic volumes are shown in the identified concerns.
1. Unacceptable levels of service (LOS): The traffic analysis shows that the following intersections will operate at unacceptable LOS by opening year (2011).
o I-395 Northbound Off-ramp & Seminary Road will operate at LOS “E” for AM peak hour.
o Seminary Road & N. Beauregard Street and I-395 Southbound On-ramp & Seminary Road will both operate at LOS “E” for the PM peak hour.
o Seminary Road & Mark Center Drive will operate at LOS “F” for the PM peak hour.
2. Heavy left turning traffic and merging problems: The WB Seminary Road left onto
N. Beauregard Street is expected to be very heavy (1271vph) in the AM peak hour for opening year. Even though Synchro modeling show an acceptable LOS for the intersection, it would be very difficult to process such a very high volume. Also, it is expected that all three lanes will be filled with traffic destined to the Mark Center, which will then have to immediately merge over into one left turn lane as shown in Figure 8. Since all three lanes of left turn traffic then need to merge into a single left turn lane, it is expected that disproportionate amount of the westbound Seminary left turn traffic will use the inside most lane, causing a significant lane imbalance between the three.
Figure 8. Left turns at Seminary Road & N. Beauregard Street

Page 21 of 29
TECHNICAL MEMORANDUM
3. Heavy merging traffic from I-395 Southbound Off-ramp: as the off-ramp approaches westbound Seminary Road, two lanes merge into one while the southbound off-ramp turns right onto Seminary Road, as shown in Figure 9. This is situation equates to 1769 vph (opening year) using a single lane and is expected to cause significant merge issues and delays. Also, since most of the traffic is destined for the Mark Center; they have to merge across two through lanes in short distance, causing compounding merge issues and delays.
Figure 9. Heavy I-395 Southbound Off-ramp traffic.
4. Heavy right turning traffic: For the future PM peak hour (year 2011), the NB Mark Center Drive right turning traffic at Seminary Road is expected to be very heavy (1723 vph), as shown in the Figure 10. It is difficult to process such a high turn volume and the Simtraffic simulation indicates there will be long queues, as shown in Figure 11. Also, the right turning traffic onto I -395 SB on-ramps is correspondingly heavy. This is expected to cause backups from the I-395 on-ramp to Mark Center Drive and beyond.

Page 22 of 29
TECHNICAL MEMORANDUM
Figure 10. Heavy right turning traffic at Seminary Road & Mark Center Drive
Figure 11. Long queues for NB Mark Center Drive.
Page 23 of 29
TECHNICAL MEMORANDUM
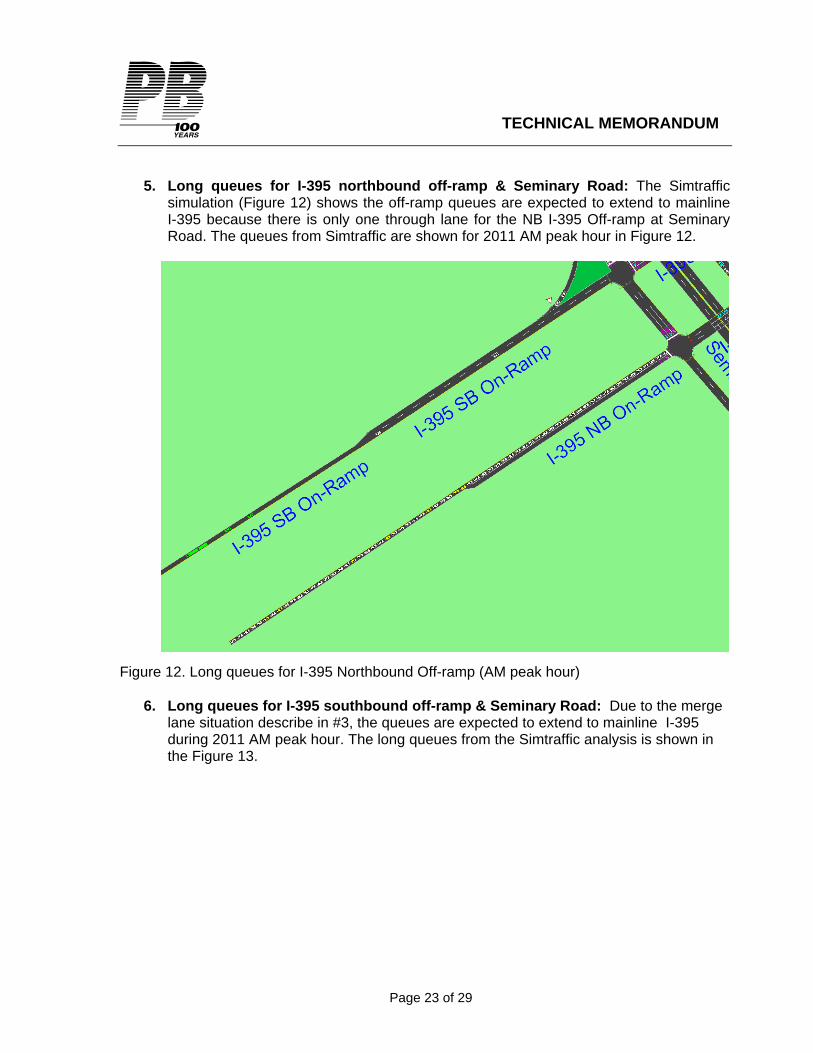
5. Long queues for I-395 northbound off-ramp & Seminary Road: The Simtraffic
simulation (Figure 12) shows the off-ramp queues are expected to extend to mainline I-395 because there is only one through lane for the NB I-395 Off-ramp at Seminary Road. The queues from Simtraffic are shown for 2011 AM peak hour in Figure 12.
Figure 12. Long queues for I-395 Northbound Off-ramp (AM peak hour)
6. Long queues for I-395 southbound off-ramp & Seminary Road: Due to the merge lane situation describe in #3, the queues are expected to extend to mainline I-395 during 2011 AM peak hour. The long queues from the Simtraffic analysis is shown in the Figure 13.

Page 24 of 29
TECHNICAL MEMORANDUM
Figure 13. Long queues for I-395 Southbound Off-ramp (AM peak hour)
7. Warrants for Dual left turns: The VDOT Roadway Design Manual (Appendix C) recommends considering dual left turns if the peak hour volume exceeds 350 vph. The peak hour left turning volume for WB Seminary Road at Mark Center Drive is expected to be 505 vph; thus, dual left turns are desirable to handle the traffic.
8. Exclusive right-turn lane: The VDOT Design Manual (Appendix C) recommends
considering an exclusive right turn lane when the volume exceeds 300 vph. The peak hour volume for NB Beauregard Street right turning traffic at Mark Center Drive is expected to be 565 vph. The heavy right turning traffic contributes to the delay to through traffic as vehicles slow down to make turns.
9. Offsite Road Improvements: The offsite road improvements recommended in TIMP
report as shown in Figure 14 are not adequate to handle the additional site generated traffic. As shown in the Figure 6, some of the intersections will still operate at un-acceptable LOS “E” and LOS “F”.

Page 25 of 29
TECHNICAL MEMORANDUM
Figure 14. Off-site improvements (Source: TIMP report for Washington Headquarters) RECOMMENDATIONS All the recommendations are shown in the Figure 15. Direct Access to Mark Center from I-395: The heavy left turning traffic to Mark Center puts tremendous stress on the arterial network with very high weaving and merging problems at a number of locations. Providing a direct access from I-395 will take some of the traffic off of the arterial network. There may be several alternatives to provide direct access which could be analyzed through an IJR (Interchange Justification Report). The direct access will provide alternative route for traffic coming from I-395 NB, I-395 SB and WB Seminary Road. Dual left turns for WB Seminary Road at N. Beauregard Street: With the direct connection to the Mark Center from I-395, it is expected that about 50-60% of the traffic turning left at Seminary Road & N. Beauregard Street will be re-distributed to the ramp and directly to Mark Center from I-395. The remaining left turns can be easily accommodated using dual left turns instead of triple left turns. This will eliminate some of the concern with merging after the turn. Provide exclusive right-turn lane: Provide exclusive right-turn lane for NB N. Beauregard Street at Mark Center Drive. Provide additional lane: Provide additional through lane for I-395 Northbound Off-ramp at Seminary Road. Synchro/Simtraffic analysis for the opening year show queues extending to

Page 26 of 29
TECHNICAL MEMORANDUM
the mainline I-395 and the intersection will operate at LOS “E”, Additional lane provides more capacity, reduces the queues and the intersection will operate at an acceptable LOS “C”. Lane-configuration changes: Modify the existing left through lane to through/left shared for NB I-395 Off-ramp at Seminary Road

Page 27 of 29
TECHNICAL MEMORANDUM
Figure 15. Recommendations
Page 28 of 29
TECHNICAL MEMORANDUM
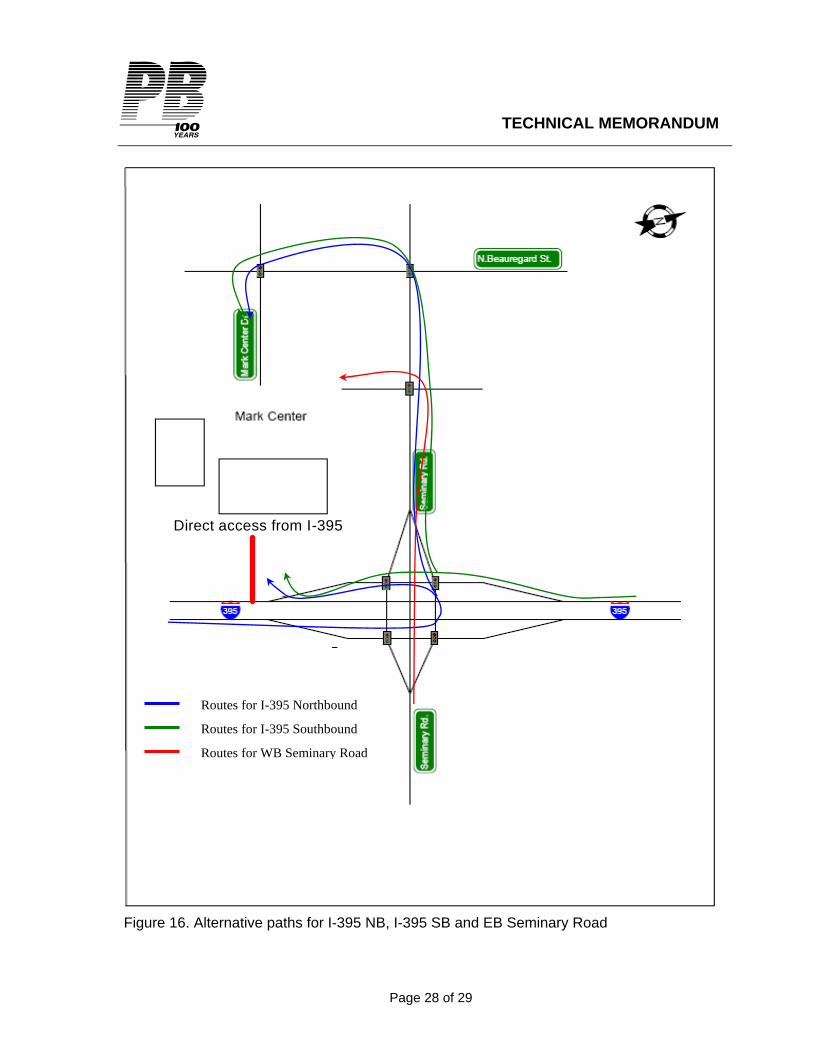
Figure 16. Alternative paths for I-395 NB, I-395 SB and EB Seminary Road
Routes for I-395 Northbound
Routes for I-395 Southbound
Routes for WB Seminary Road
Direct access from I-395

Page 29 of 29
TECHNICAL MEMORANDUM
CONCLUSIONS
• Currently all the seven signalized intersections operate at an acceptable LOS “D” or better.
• For the opening year 2011, six of the seven intersections will operate at an acceptable
LOS “D” or better for the AM peak hour. The intersection of I-395 southbound on-ramp & Seminary Road will operate at LOS “E”. For the PM peak hour, only four of seven intersections will operate at an acceptable LOD “D” or better. Two intersections will operate at LOS “E” and one intersection at LOS “F”. The levels of service are shown in Figure 6.
• For the future year 2030, five of the seven intersections will operate at an acceptable
LOS “D” or better, one will operate at LOS “E”, and one will operate at LOS “F” in the AM peak hour.
In the PM peak hour, only three of the seven intersections will operate at LOS “D” or Better, three will operate at LOS “F” and one will operate at LOS “E”. • Additional improvements are needed apart from the off-site improvements shown in
Figure 14. A direct access to the Mark Center from I-395 will provide an alternative path, re-distributing and balancing traffic between the two paths.