Embed Size (px)
DESCRIPTION
Maritime Education Factors and Presenteeism: A Comparative Quantitative Study. Virginia (Vicki) Ferritto, Ph.D. Assistant Professor, SUNY Maritime College `. Maritime Education Summit (MES) 2014 October 18, 2014. Presenteeism. Problem. - PowerPoint PPT Presentation
Citation preview
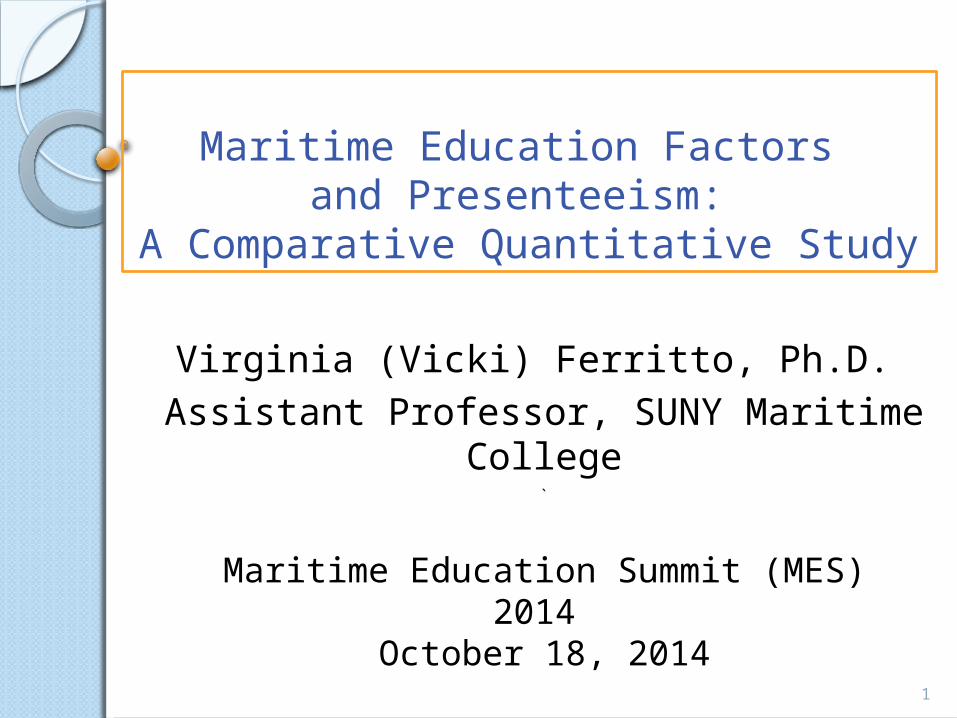
Maritime Education Factors and Presenteeism:
A Comparative Quantitative Study
Virginia (Vicki) Ferritto, Ph.D. Assistant Professor, SUNY Maritime
College`
1
Maritime Education Summit (MES) 2014 October 18, 2014

Presenteeism
2
Not Absent (1950s)
Present but unwell – Measurement related
to health issues (1970s)
Student perceived academic
performance loss – Measurement related to health issues (2005; 2009; 2011,
2013)
Student perceived academic
performance loss – Measurement related to academic success
behaviors (this study)
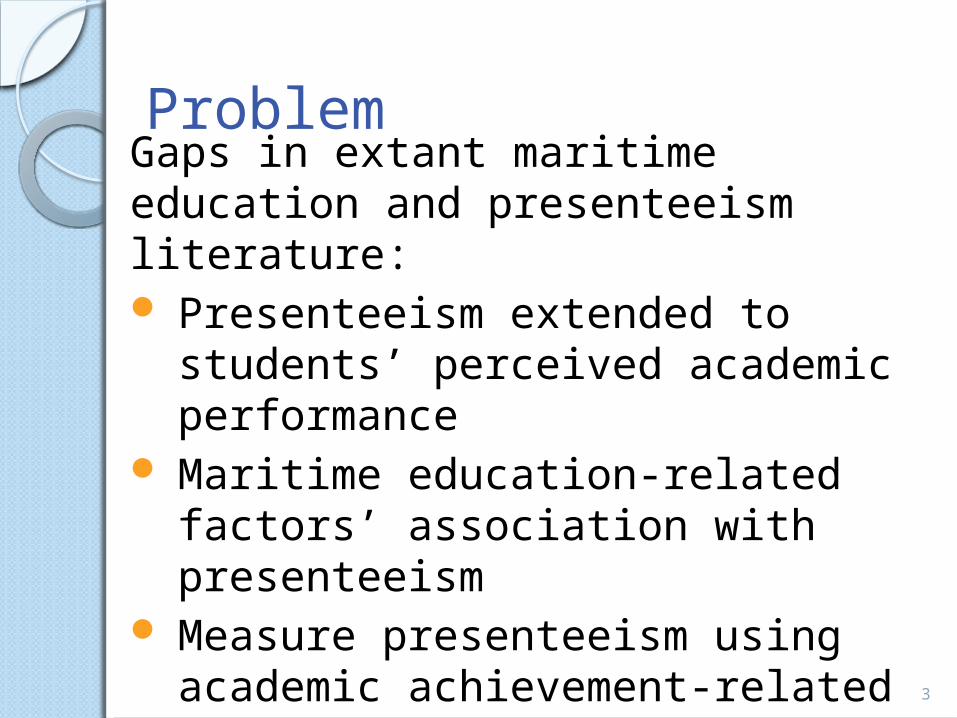
ProblemGaps in extant maritime education and presenteeism literature: Presenteeism extended to
students’ perceived academic performance
Maritime education-related factors’ association with presenteeism
Measure presenteeism using academic achievement-related elements instead of health issues 3

Research Questions• Overarching research question: What is the
difference in the level of presenteeism between license students who do and do not report distinct maritime education factors as having either a favorable or negative impact on their perceived academic performance?
• Favorable Factors• ResQ 1: Cruise • ResQ 2: License/Maritime Instruction
• Negative Factors• ResQ 3: Mandatory Regimental Activities • ResQ 4: Taps• ResQ 5: Morning or Afternoon Formations• ResQ 6: Watch 4

Reported Favorable Factors
5
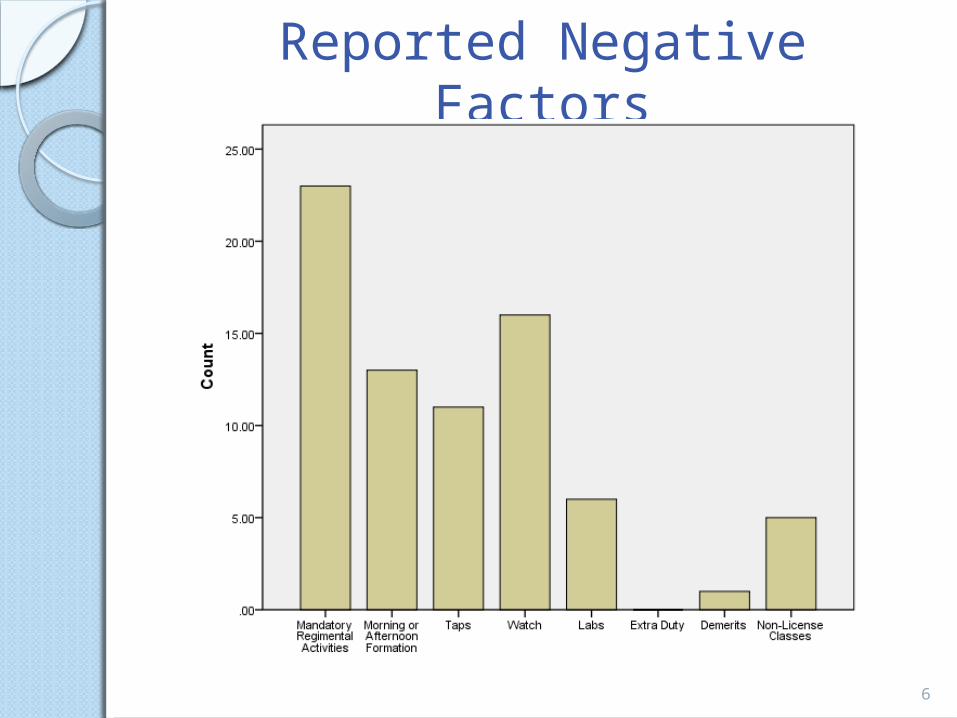
Reported Negative Factors
6

Methodology
Comparative quantitative research design◦ Cross-sectional◦ Non-experimental◦ Paper-pencil survey◦ Likert-type and open-ended questions◦ SPSS for Windows (IBM SPSS 19.0
Professional, SPSS Inc., Chicago, IL) All analyses were two-sided with 5% alpha
level Hypotheses tested with two-sample t-tests
7
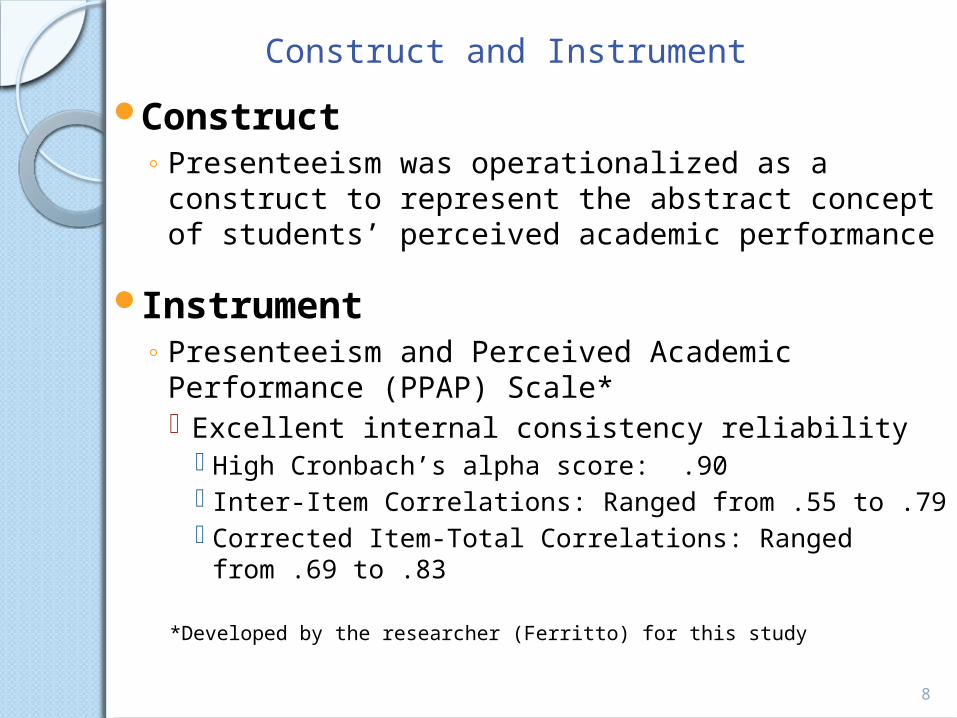
Construct and InstrumentConstruct
◦ Presenteeism was operationalized as a construct to represent the abstract concept of students’ perceived academic performance
Instrument◦ Presenteeism and Perceived Academic
Performance (PPAP) Scale* Excellent internal consistency reliability
High Cronbach’s alpha score: .90 Inter-Item Correlations: Ranged from .55 to .79 Corrected Item-Total Correlations: Ranged from .69
to .83
*Developed by the researcher (Ferritto) for this study
8

Population• Purposive sampling technique• Study’s Sample (N = 54)
• Supported with power analysis• Filtered from 73 respondents
• Gender: 12 (22%) female; 42 (78%) male
• Class• 3/C - 16 (30%)• 2/C - 18 (33%)• 1/C - 20 (37%)
• Program: • 47 (87%) - Marine Transportation Deck License• 6 (11%) - Marine Engineering License• 1 (0.2%) - Naval Architecture License
9
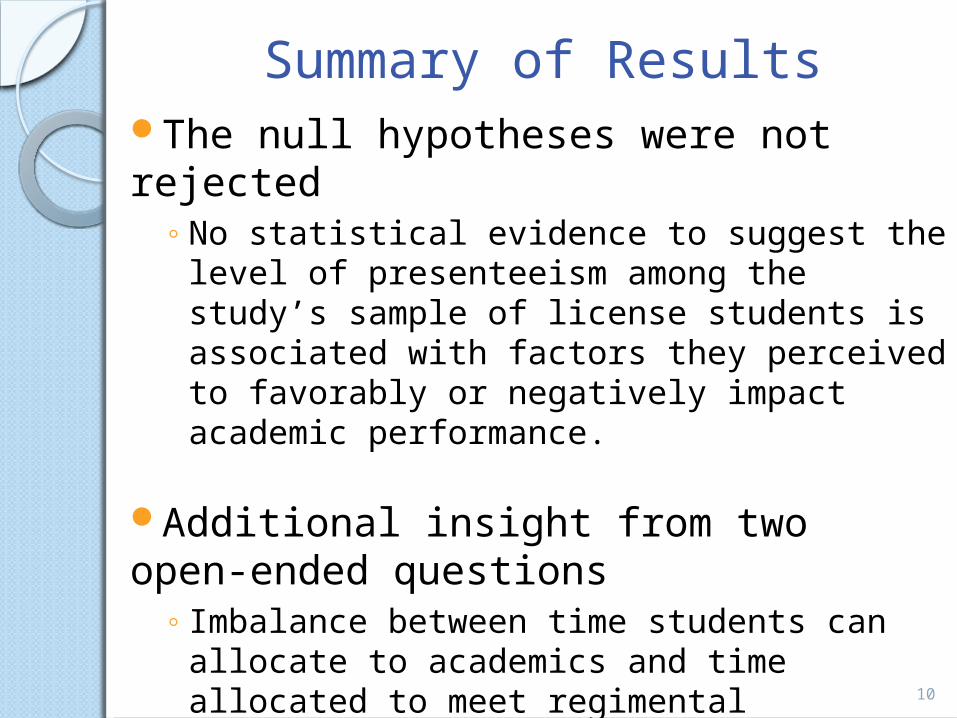
Summary of ResultsThe null hypotheses were not rejected
◦No statistical evidence to suggest the level of presenteeism among the study’s sample of license students is associated with factors they perceived to favorably or negatively impact academic performance.
Additional insight from two open-ended questions
◦ Imbalance between time students can allocate to academics and time allocated to meet regimental requirements and responsibilities
◦Lack of sleep opportunities 10
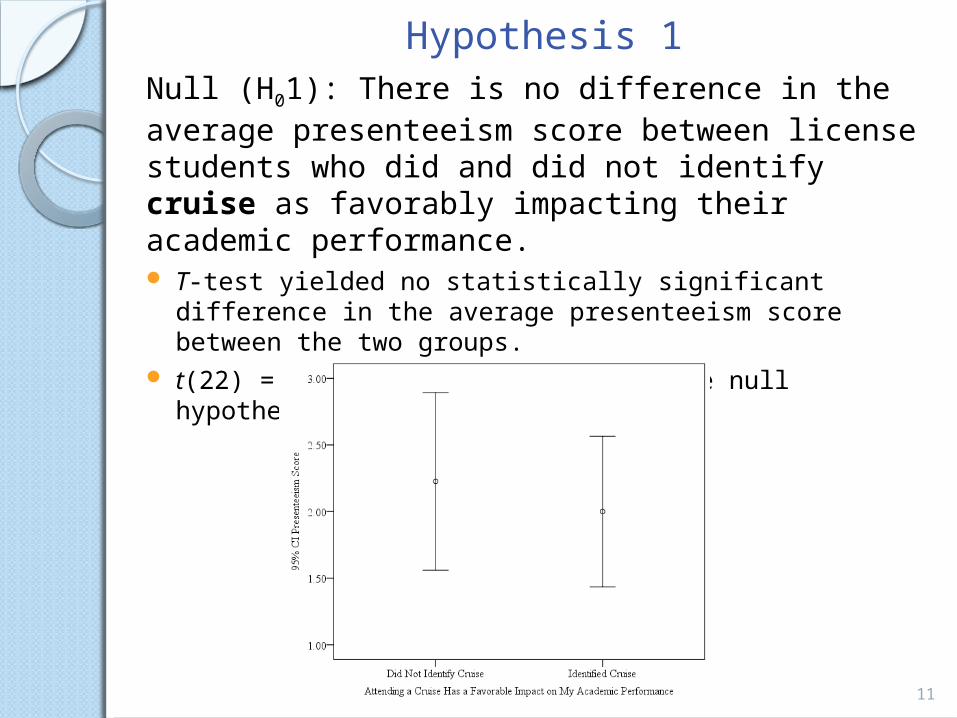
Hypothesis 1Null (H01): There is no difference in the average presenteeism score between license students who did and did not identify cruise as favorably impacting their academic performance. T-test yielded no statistically significant difference in the
average presenteeism score between the two groups. t(22) = .51; p = .62; therefore, the null hypothesis was not
rejected
11
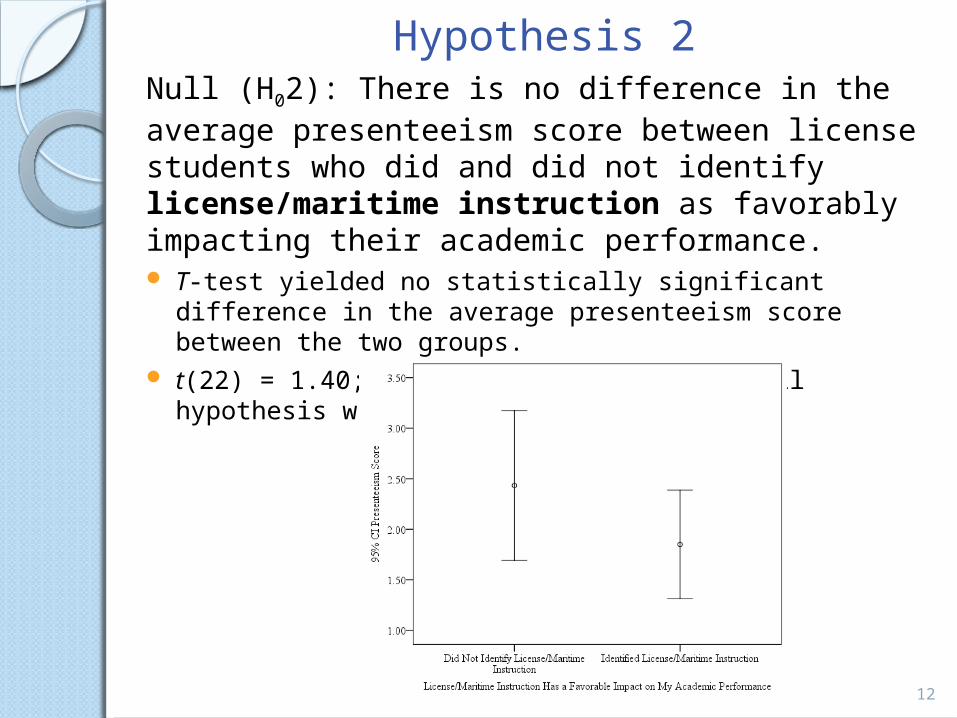
Hypothesis 2Null (H02): There is no difference in the average presenteeism score between license students who did and did not identify license/maritime instruction as favorably impacting their academic performance. T-test yielded no statistically significant difference in the
average presenteeism score between the two groups. t(22) = 1.40; p = .18; therefore, the null hypothesis was
not rejected
12

Hypothesis 3Null (H03): There is no difference in the average presenteeism score between license students who did and did not identify mandatory regimental activities as negatively impacting their academic performance. T-test yielded no statistically significant difference in the
average presenteeism score between the two groups. t(52) = -.05; p = .96; therefore, the null hypothesis was not
rejected
13

Hypothesis 4Null (H04): There is no difference in the average presenteeism score between license students who did and did not identify taps as negatively impacting their academic performance. T-test yielded no statistically significant difference in the
average presenteeism score between the two groups. t(52) = .56; p = .58; therefore, the null hypothesis was not
rejected
14

Hypothesis 5Null (H05): There is no difference in the average presenteeism score between license students who did and did not identify morning or afternoon formations as negatively impacting their academic performance. T-test yielded no statistically significant difference in the
average presenteeism score between the two groups. t(52) = -.56; p = .58; therefore, the null hypothesis was not
rejected
15

Hypothesis 6Null (H06): There is no difference in the average presenteeism score between license students who did and did not identify watch as negatively impacting their academic performance. T-test yielded no statistically significant difference in the
average presenteeism score between the two groups. t(52) = -1.15; p = .25; therefore, the null hypothesis was
not rejected
16

Significance of the Study
• Filled gaps in presenteeism and maritime education literature• First to investigate presenteeism among
license students• First to operationalize presenteeism using
student behaviors associated with academic performance
• May add insight to support discussions with license students
• May be of interest to maritime education administrators, policy makers, and educators
17
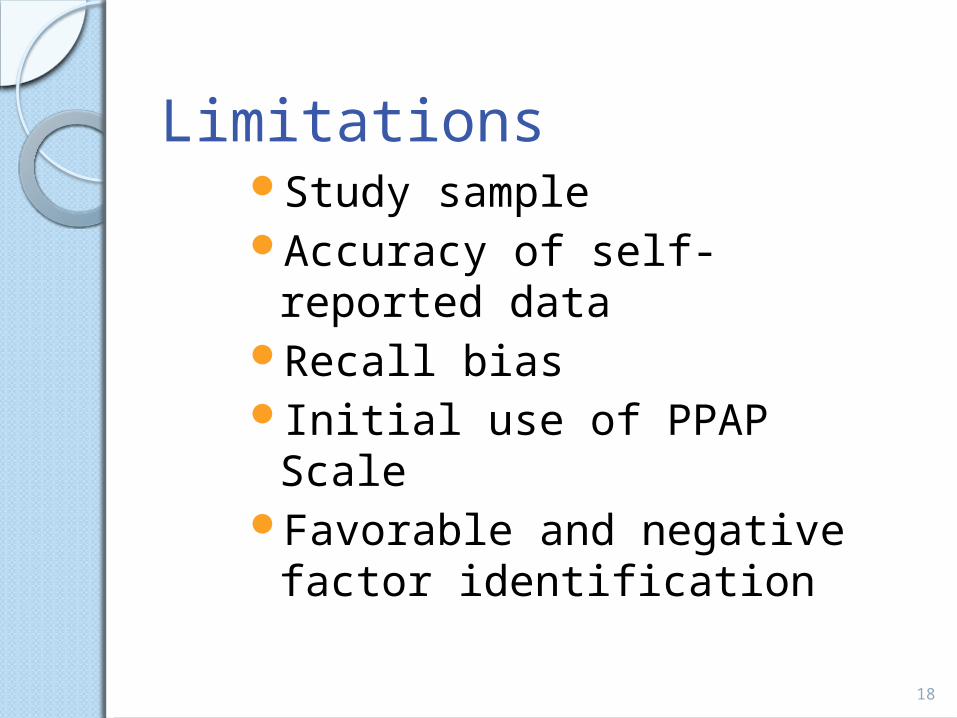
Limitations
Study sampleAccuracy of self-reported
dataRecall biasInitial use of PPAP ScaleFavorable and negative
factor identification
18

Recommendations for Future ResearchOther license student populationsGeneral student populationsDemographic variables (e.g., age, gender,
class, major, GPA)Investigate other respondent identified
favorable and negative factorsOffer respondents list of negative and
favorable factorsCompare PPAP Scale results to objective
measuresLongitudinal studiesComplement studies using health-related
issues to operationalize presenteeism among students
19
ReferencesDeroma, V. M., Leach, J. B., & Leverett, J. P. (2009). The relationship between depression and college academic performance. College Student Journal, 43(2), 325-334.
Hysenbegasi, A., Hass, S. L., & Rowland, C. R. (2005). The impact of depression on the academic productivity of university students. Journal of Mental Health Policy and Economics, 8(3), 145-151.
Matsushita, M., Adachi, H., Arakida, M., Namura, I., Takahashi, Y., Miyata, M., . . . Sugita, Y. (2011). Presenteeism in college students: Reliability and validity of the presenteeism scale for students. Quality of Life Research, 20(3), 439-446. doi:10.1007/s11136-010-9763-9
Mikami, A., Matsushita, M., Adachi, H., Suganuma, N., Koyama, A., Ichimi, N., . . . Sugita, Y. (2013). Sense of coherence, health problems, and presenteeism in Japanese university students. Asian Journal of Psychiatry, 6(5), 369-372. doi:10.1016/j.ajp.2013.03.008
20
Thank you for your attention!
Questions?
Comments?
21
Virginia (Vicki) Ferritto, Ph.D. Assistant Professor, SUNY Maritime
CollegeEmail: [email protected] or [email protected]
Office: 718-409-4181Cell: 201-650-2638