Embed Size (px)
Citation preview
Marine Ecosystem and Air Quality Programs at the
Port of Prince RupertMarch 20, 2018Pacific Ports Clean Air Collaborative
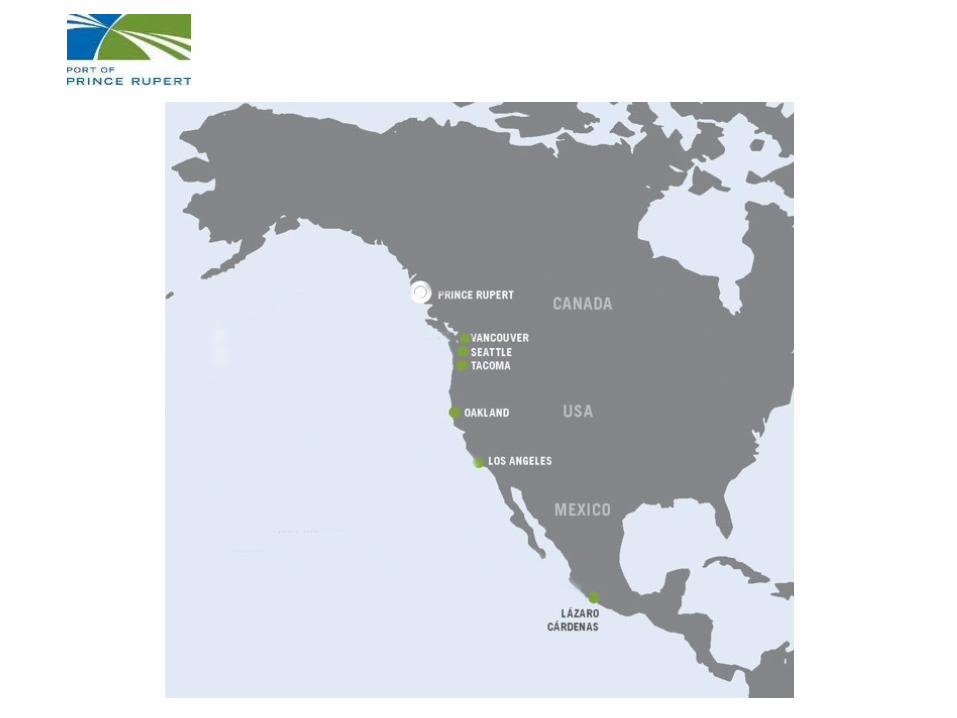
Canada Marine ActPort was established and is governed by three distinct articles:
• Canada Marine Act - 1998
• Port Authority Operations Regulations
• PRPA Letters Patent
• Build marine infrastructure for Canada
• Manage services and infrastructure in a commercial manner
• Provide and ensure a high level of safety and environmental protection
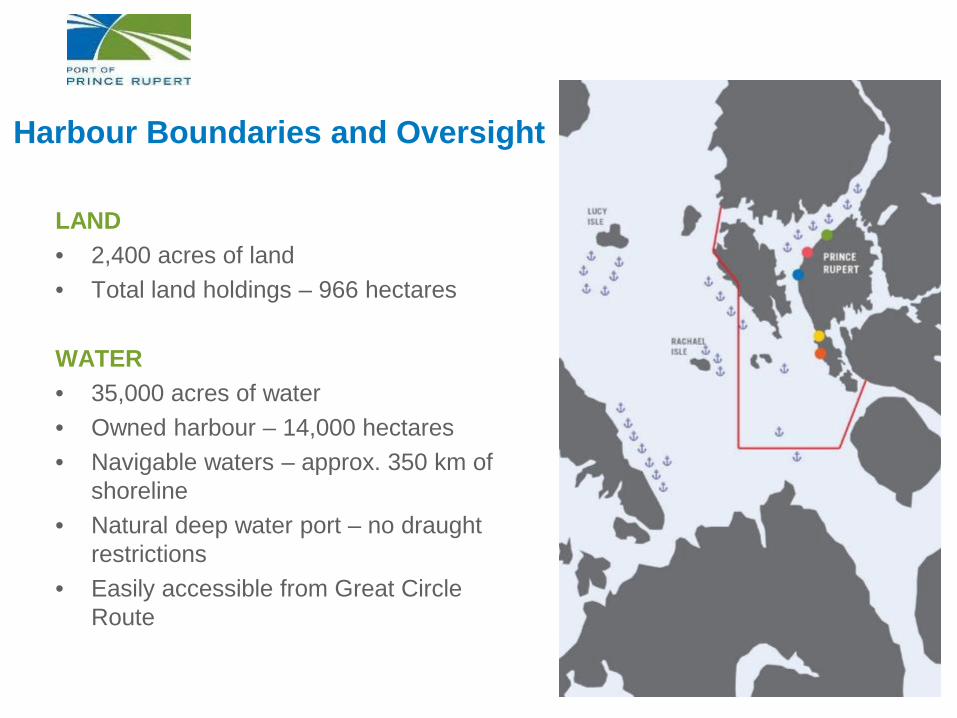
LAND• 2,400 acres of land• Total land holdings – 966 hectares
WATER• 35,000 acres of water• Owned harbour – 14,000 hectares• Navigable waters – approx. 350 km of
shoreline• Natural deep water port – no draught
restrictions• Easily accessible from Great Circle
Route
Harbour Boundaries and Oversight
------------5
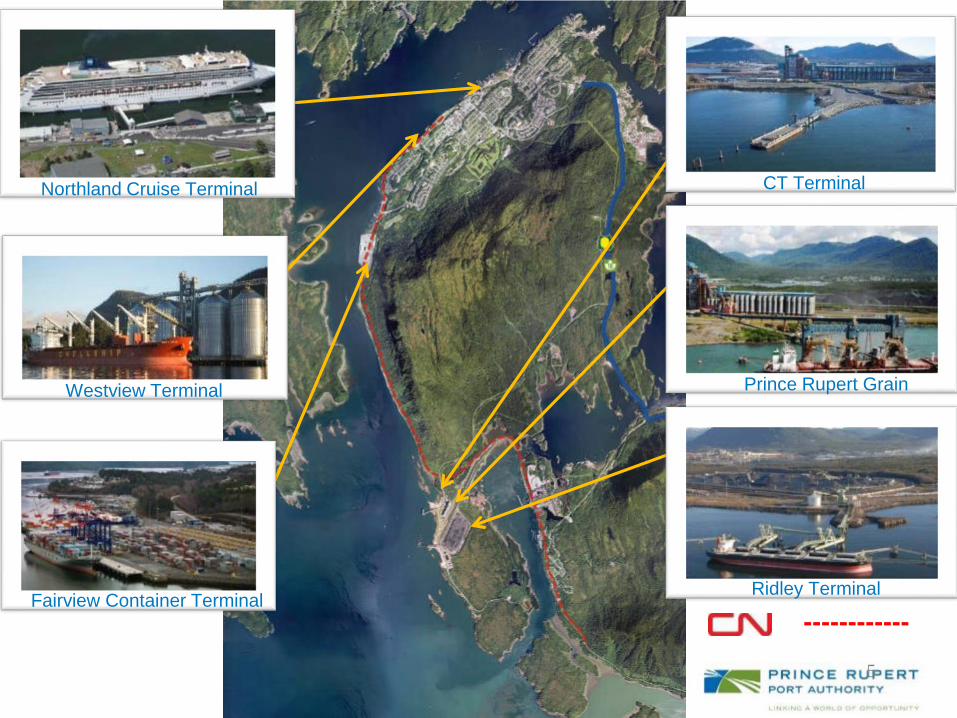
Northland Cruise Terminal
Westview Terminal
Fairview Container Terminal
CT Terminal
Prince Rupert Grain
Ridley Terminal
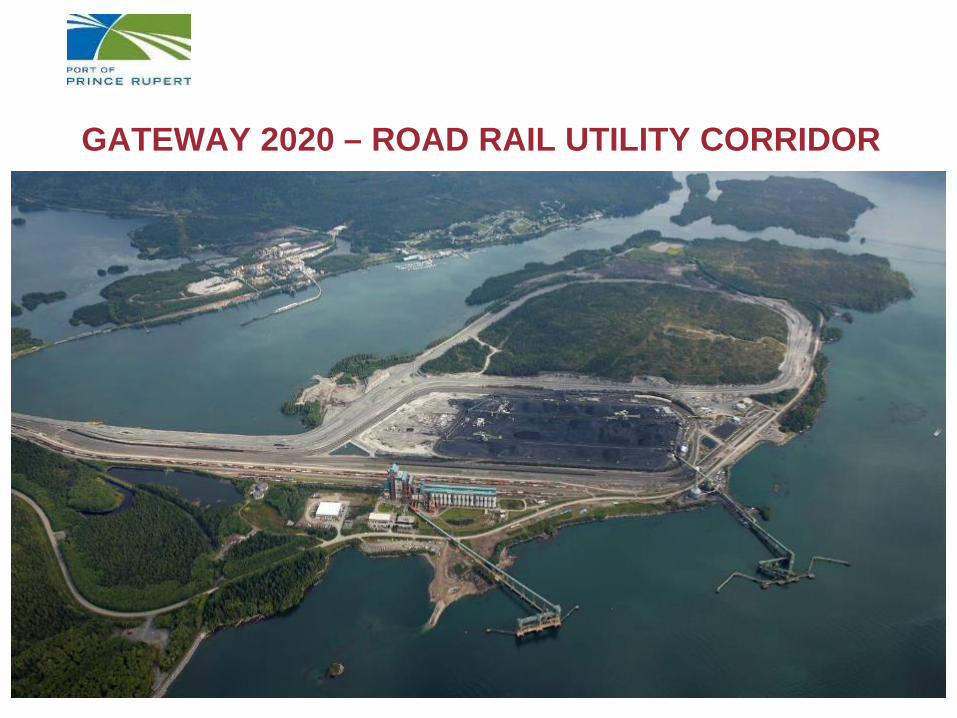
GATEWAY 2020 – ROAD RAIL UTILITY CORRIDOR
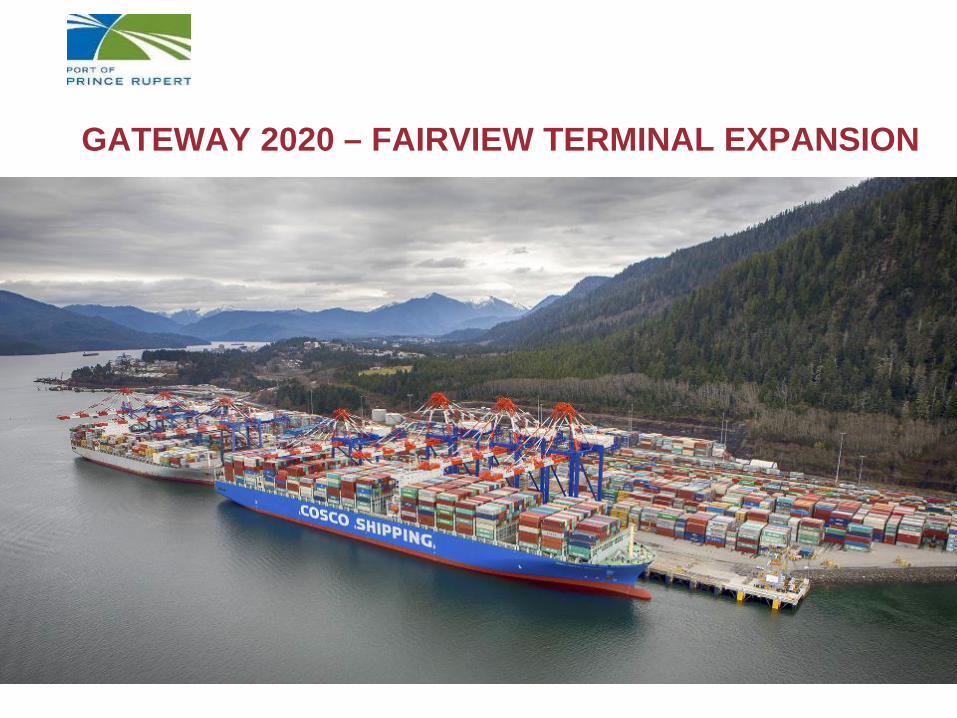
GATEWAY 2020 – FAIRVIEW TERMINAL EXPANSION
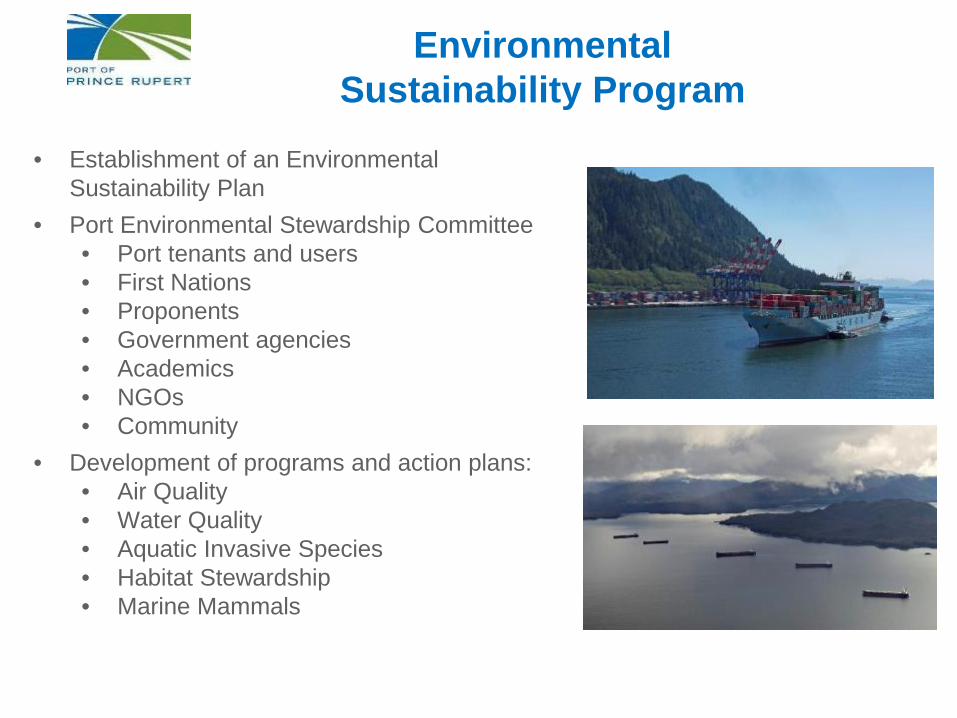
Environmental Sustainability Program
• Establishment of an Environmental Sustainability Plan
• Port Environmental Stewardship Committee• Port tenants and users• First Nations• Proponents• Government agencies• Academics• NGOs• Community
• Development of programs and action plans:• Air Quality• Water Quality• Aquatic Invasive Species• Habitat Stewardship• Marine Mammals
Green Marine Program
• Program established 2007
• Collaboration of ship owners, ship yards, port authorities and terminals in Canada and US
• Prince Rupert Port Authority joined program in 2010
• First west coast participant
• Core of program is continued improvement
• Program has facilitated communication and collaboration with other program participants and supporters including NGOs, academics and government agencies.
Green Marine Program
• Performance indictors for port authorities include:
• Air and GHG Emissions
• Spill Prevention
• Community Impacts
• Environmental Leadership
• Waste Management
• Underwater Noise
ParticipantsPrince Rupert Port Authority
Ridley Terminals IncDP WorldSaam Smit
Tidal TransportPinnacle Renewable Energy
BC Ferries
SupportersCity of Prince Rupert
District of Port EdwardPort Edward Harbour Authority
Environment CanadaTransport Canada
Fisheries and Oceans CanadaOcean Networks CanadaBC Chamber of Shipping
WWFVancouver Aquarium
Northwest Community CollegeQuickload Logistics
Western Canada Marine Response CorporationPacific Pilotage Authority
BC Coast PilotsDucks Unlimited
Pacific Salmon Foundation
Water Quality
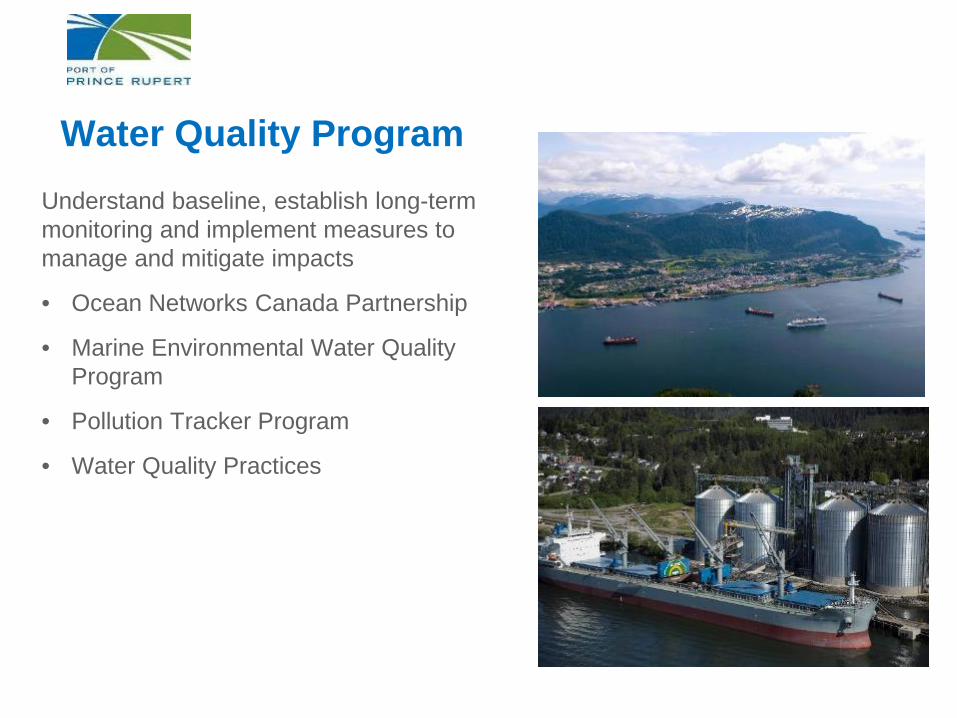
Water Quality ProgramUnderstand baseline, establish long-term monitoring and implement measures to manage and mitigate impacts
• Ocean Networks Canada Partnership
• Marine Environmental Water Quality Program
• Pollution Tracker Program
• Water Quality Practices
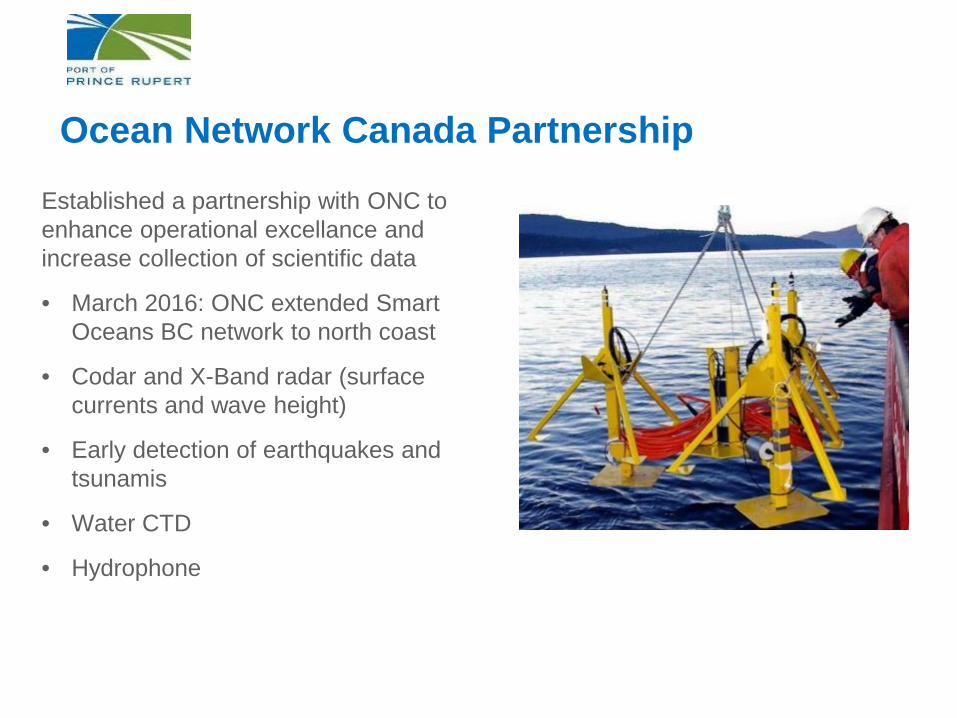
Ocean Network Canada Partnership
Established a partnership with ONC to enhance operational excellance and increase collection of scientific data
• March 2016: ONC extended Smart Oceans BC network to north coast
• Codar and X-Band radar (surface currents and wave height)
• Early detection of earthquakes and tsunamis
• Water CTD
• Hydrophone
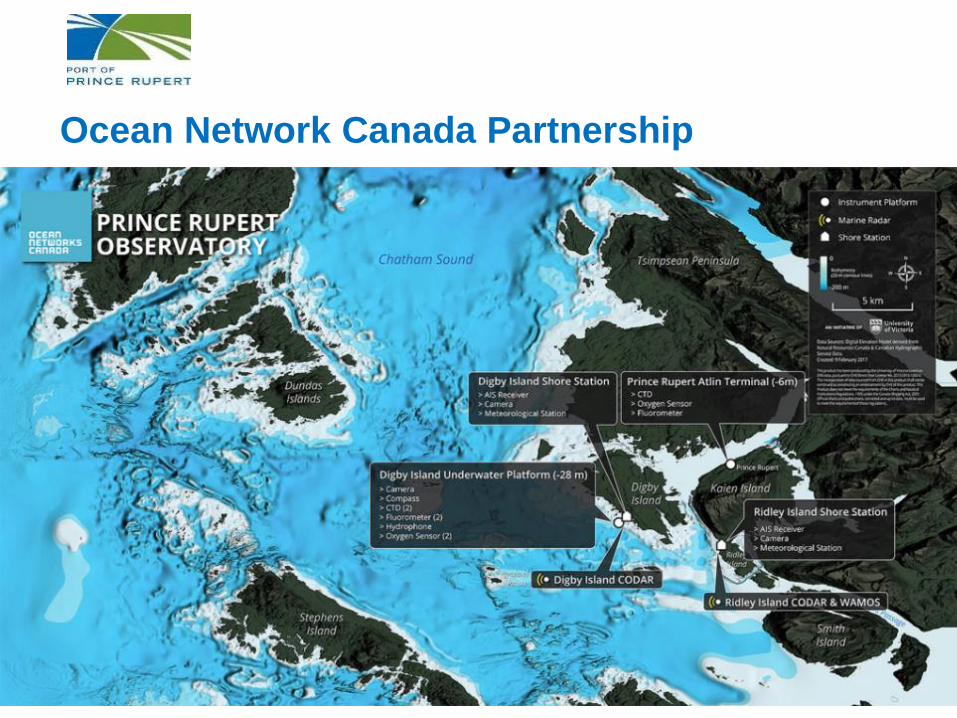
Ocean Network Canada Partnership
Ocean Network Canada Partnership
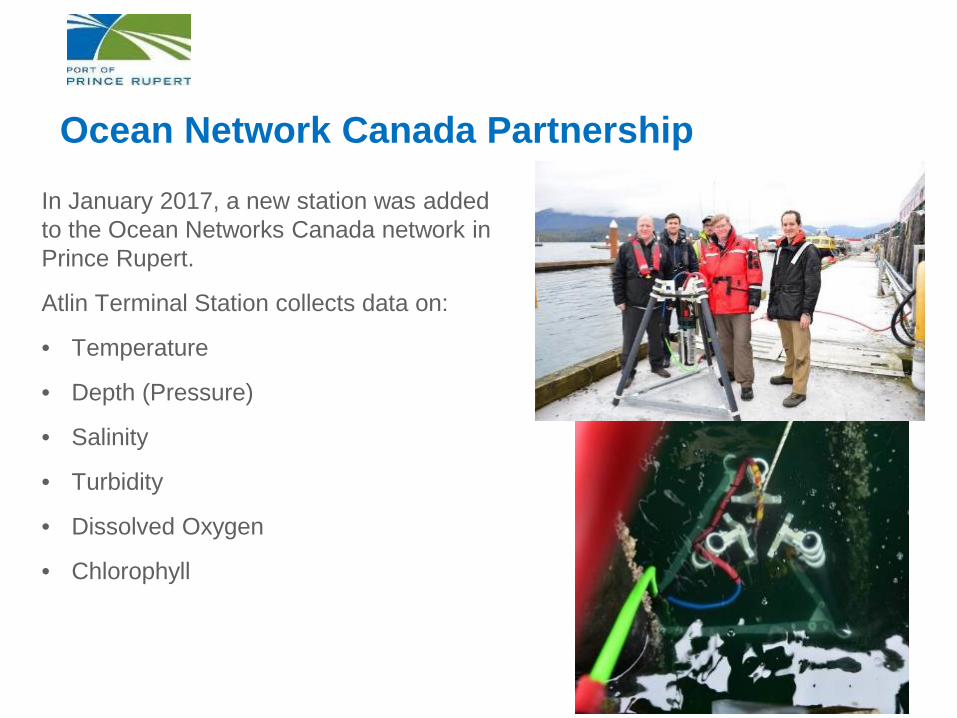
In January 2017, a new station was added to the Ocean Networks Canada network in Prince Rupert.
Atlin Terminal Station collects data on:
• Temperature
• Depth (Pressure)
• Salinity
• Turbidity
• Dissolved Oxygen
• Chlorophyll
Ocean Network Canada Partnership
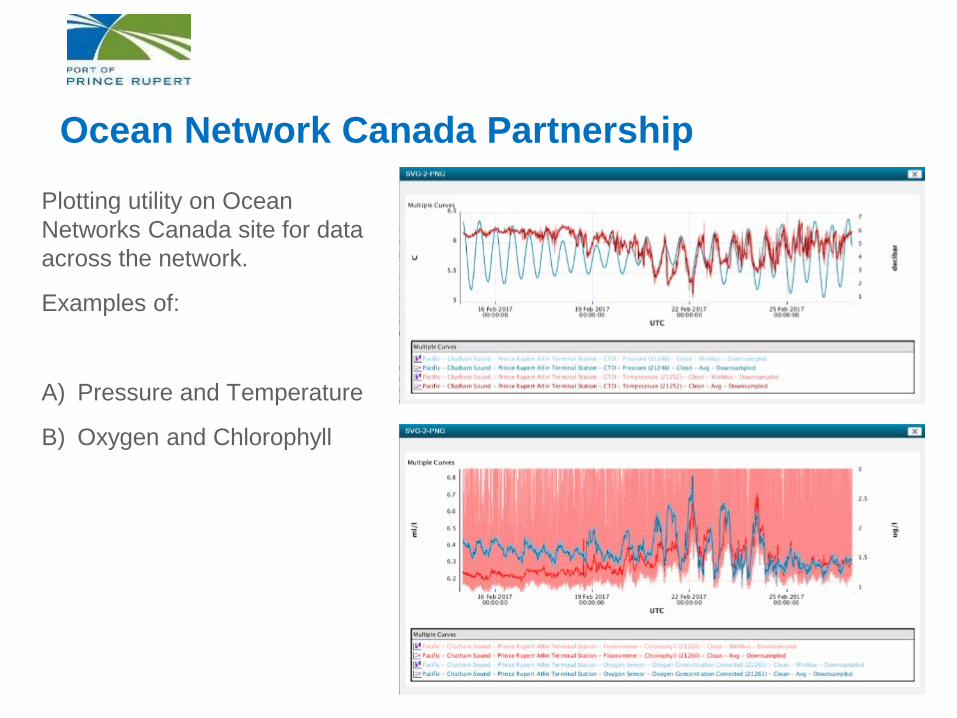
Plotting utility on Ocean Networks Canada site for data across the network.
Examples of:
A) Pressure and Temperature
B) Oxygen and Chlorophyll
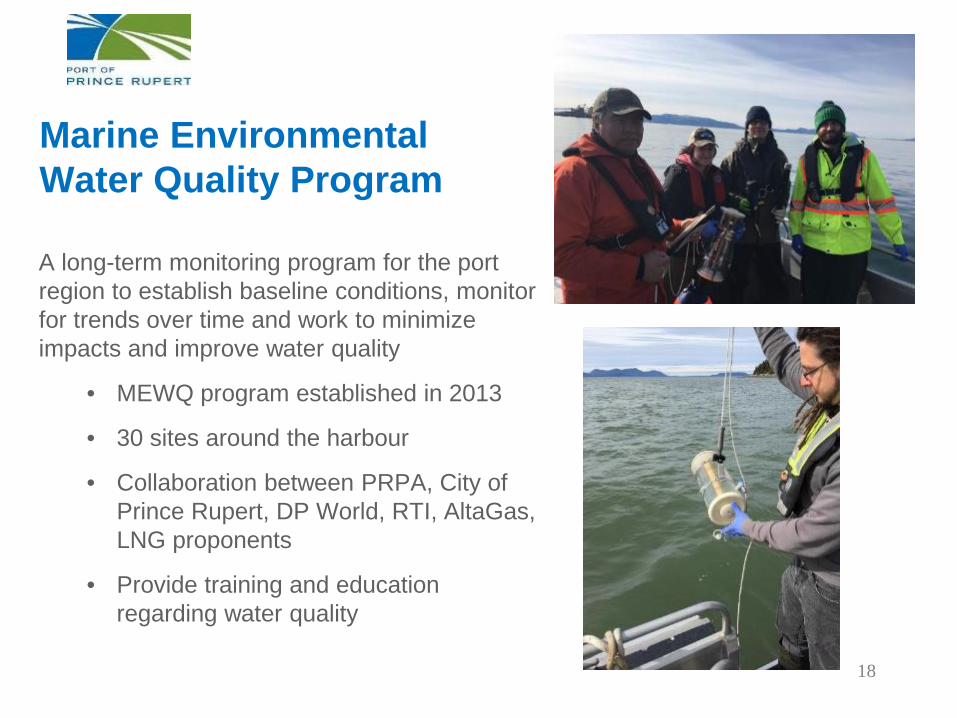
A long-term monitoring program for the port region to establish baseline conditions, monitor for trends over time and work to minimize impacts and improve water quality
• MEWQ program established in 2013
• 30 sites around the harbour
• Collaboration between PRPA, City of Prince Rupert, DP World, RTI, AltaGas, LNG proponents
• Provide training and education regarding water quality
18
Marine Environmental Water Quality Program
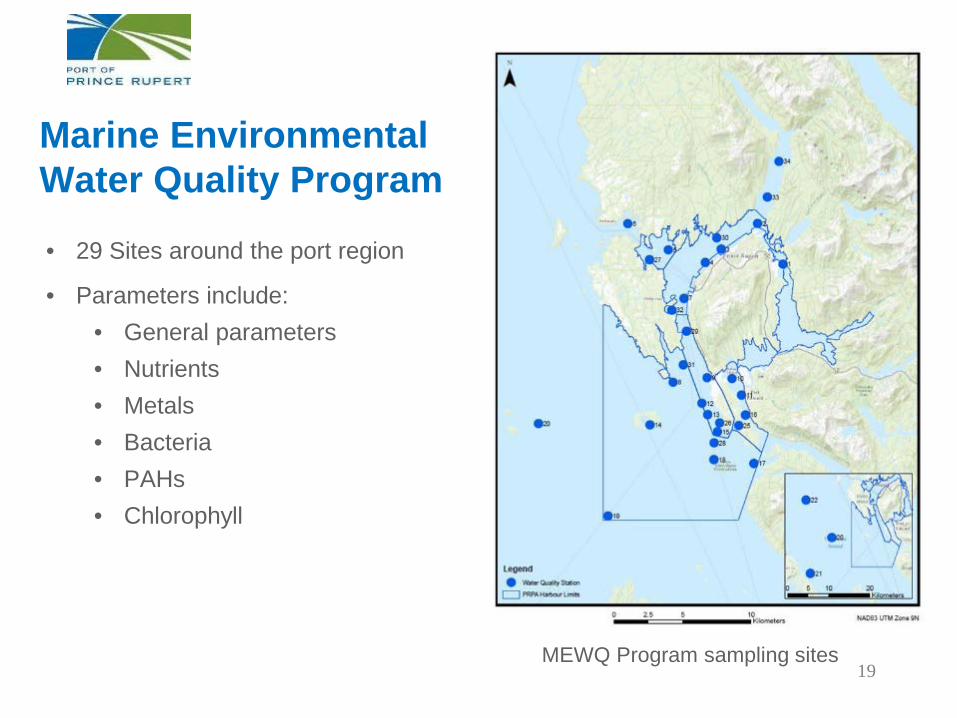
• 29 Sites around the port region
• Parameters include:• General parameters• Nutrients• Metals• Bacteria• PAHs• Chlorophyll
19MEWQ Program sampling sites
Marine Environmental Water Quality Program
Marine Environmental Water Quality Program
20
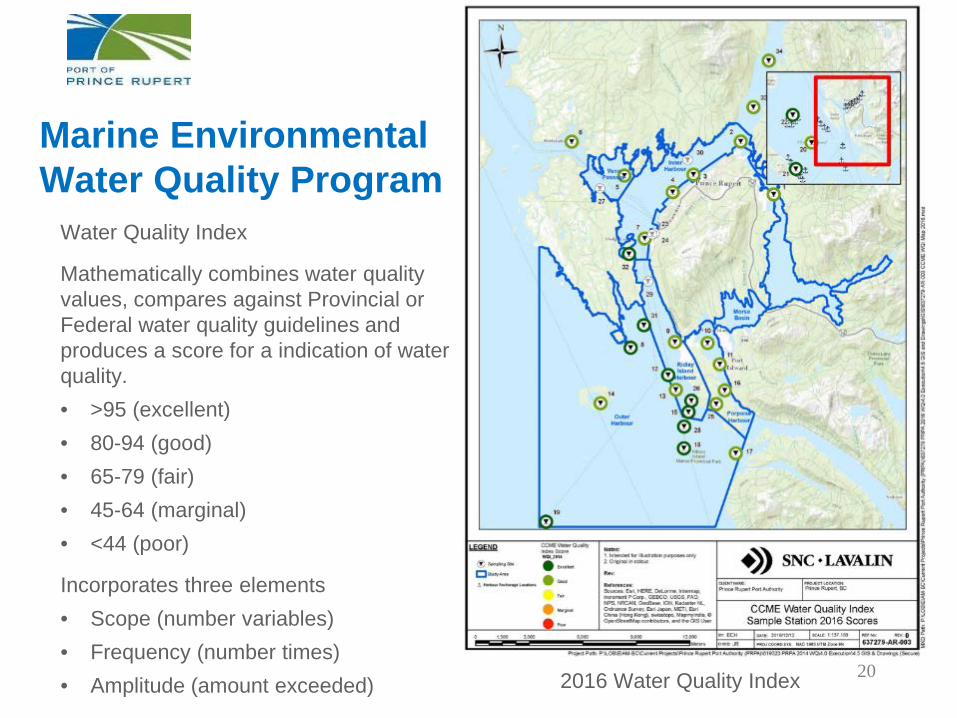
Water Quality Index
Mathematically combines water quality values, compares against Provincial or Federal water quality guidelines and produces a score for a indication of water quality.• >95 (excellent)• 80-94 (good)• 65-79 (fair)• 45-64 (marginal)• <44 (poor)
Incorporates three elements• Scope (number variables)• Frequency (number times)• Amplitude (amount exceeded) 2016 Water Quality Index
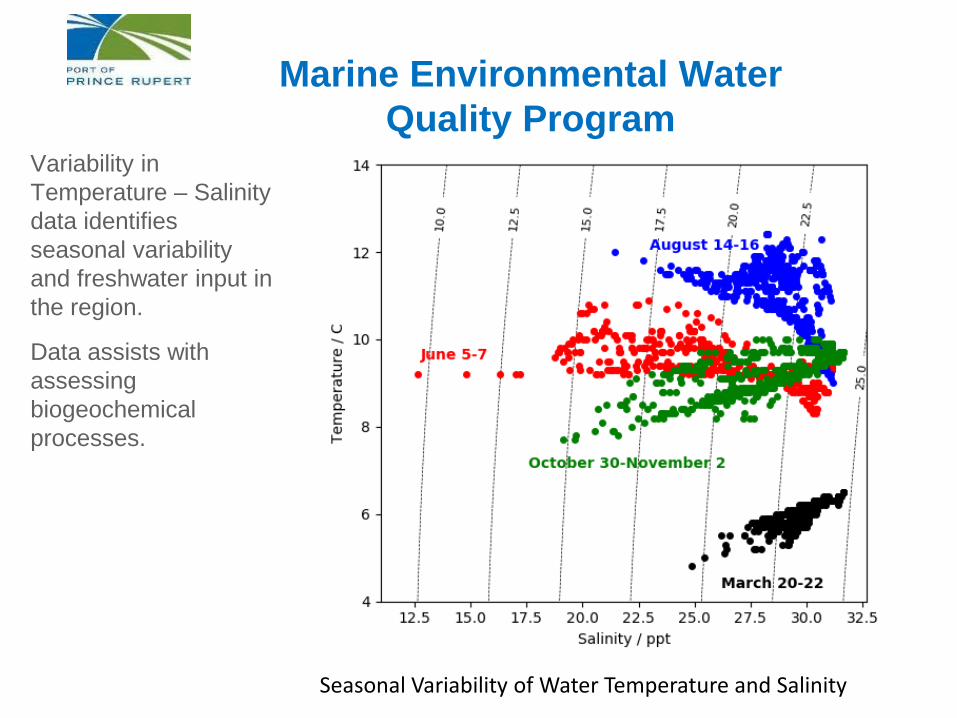
Variability in Temperature – Salinity data identifies seasonal variability and freshwater input in the region.
Data assists with assessing biogeochemical processes.
Marine Environmental Water Quality Program
Seasonal Variability of Water Temperature and Salinity
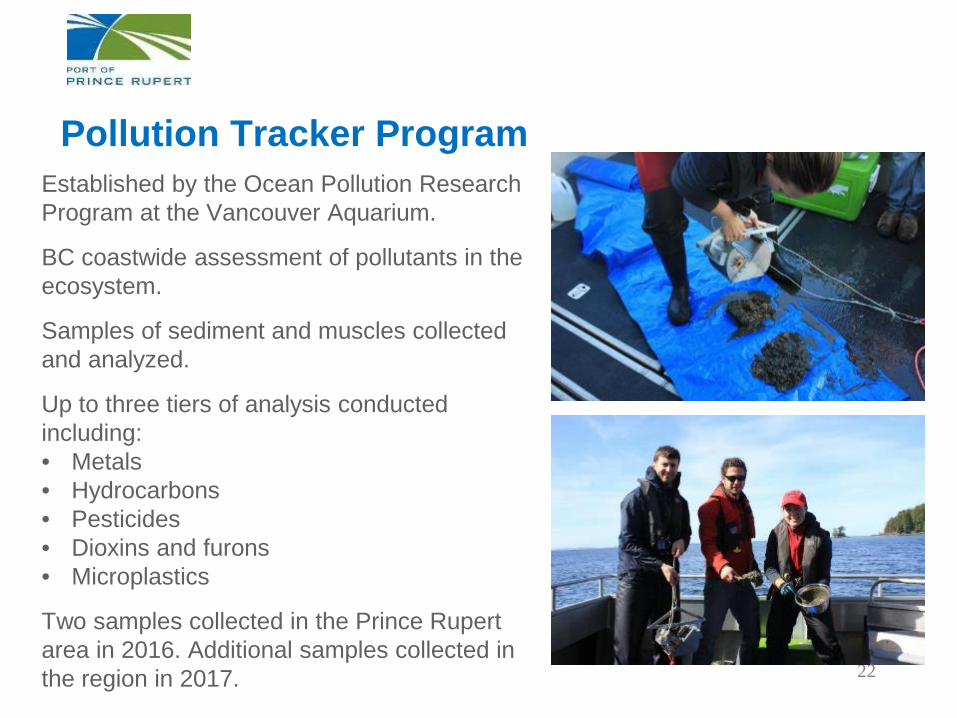
Pollution Tracker ProgramEstablished by the Ocean Pollution Research Program at the Vancouver Aquarium.
BC coastwide assessment of pollutants in the ecosystem.
Samples of sediment and muscles collected and analyzed.
Up to three tiers of analysis conducted including:• Metals • Hydrocarbons• Pesticides• Dioxins and furons• Microplastics
Two samples collected in the Prince Rupert area in 2016. Additional samples collected in the region in 2017. 22
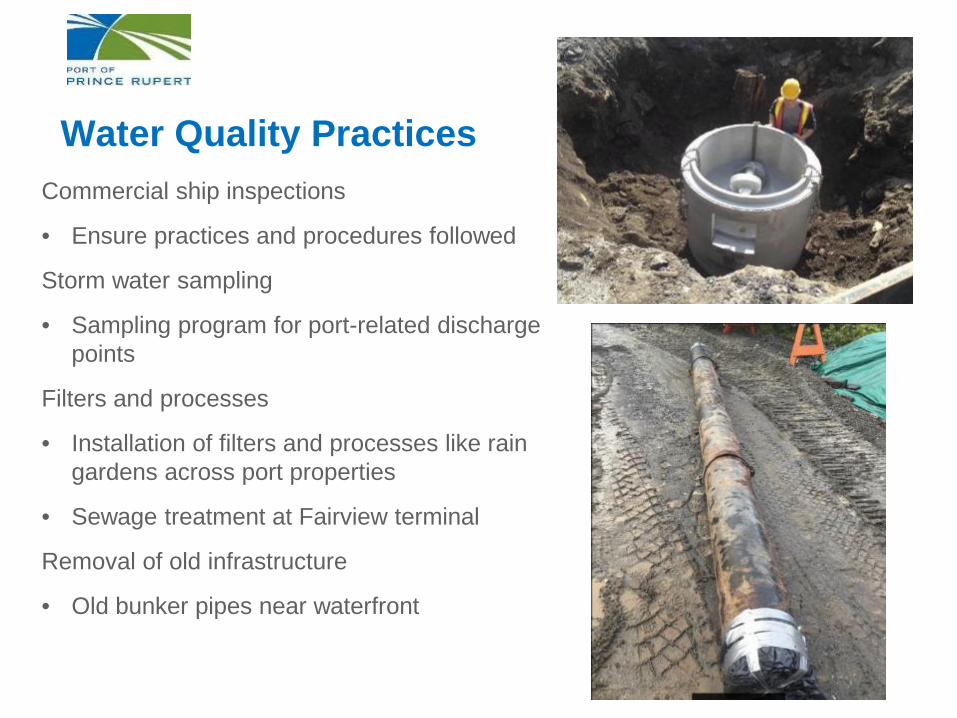
Water Quality PracticesCommercial ship inspections
• Ensure practices and procedures followed
Storm water sampling
• Sampling program for port-related discharge points
Filters and processes
• Installation of filters and processes like rain gardens across port properties
• Sewage treatment at Fairview terminal
Removal of old infrastructure
• Old bunker pipes near waterfront
23
Marine Ecosystems
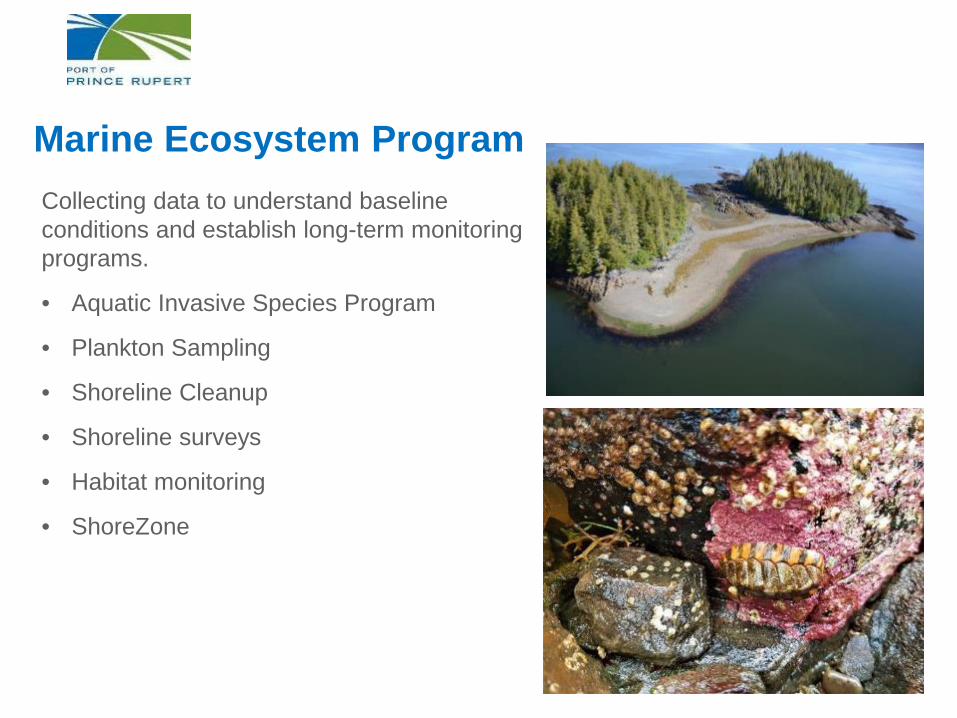
Marine Ecosystem ProgramCollecting data to understand baseline conditions and establish long-term monitoring programs.
• Aquatic Invasive Species Program
• Plankton Sampling
• Shoreline Cleanup
• Shoreline surveys
• Habitat monitoring
• ShoreZone
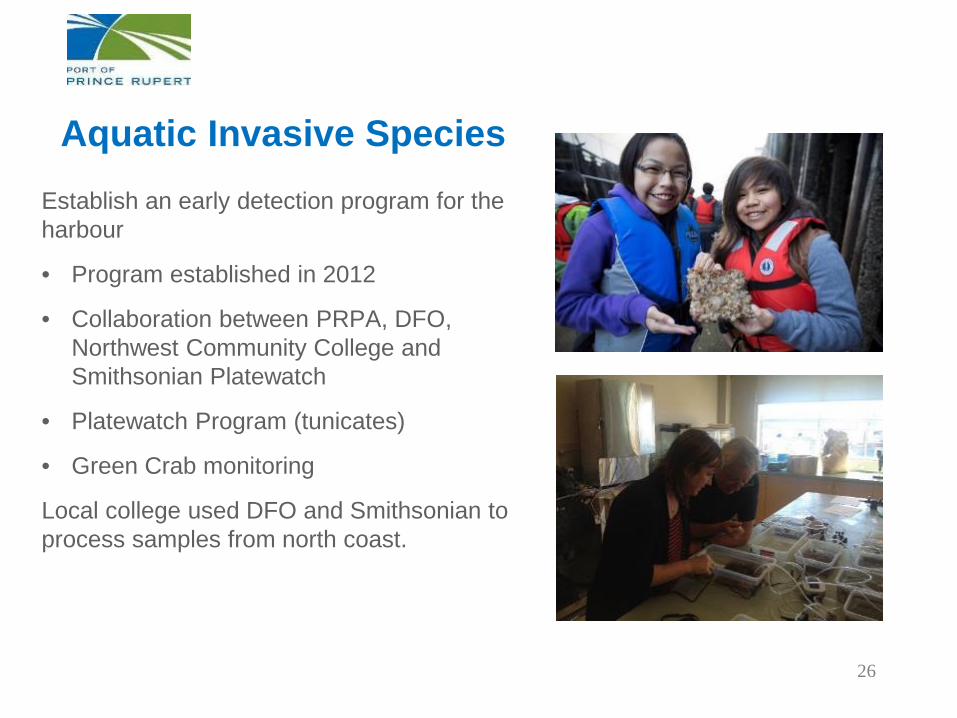
Aquatic Invasive SpeciesEstablish an early detection program for the harbour
• Program established in 2012
• Collaboration between PRPA, DFO, Northwest Community College and Smithsonian Platewatch
• Platewatch Program (tunicates)
• Green Crab monitoring
Local college used DFO and Smithsonian to process samples from north coast.
26
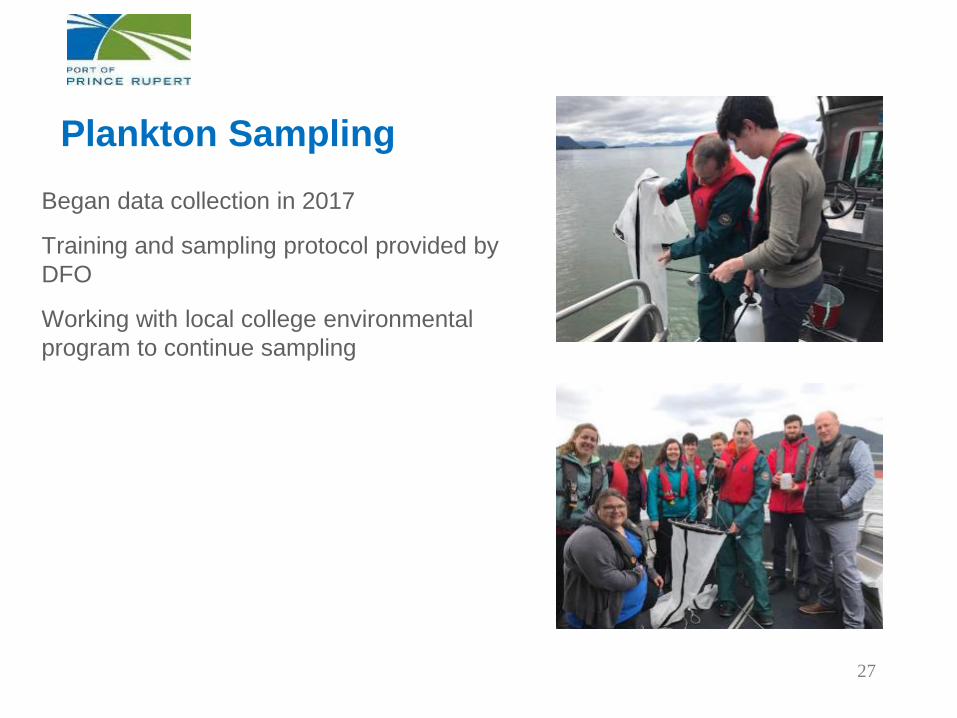
Plankton SamplingBegan data collection in 2017
Training and sampling protocol provided by DFO
Working with local college environmental program to continue sampling
27
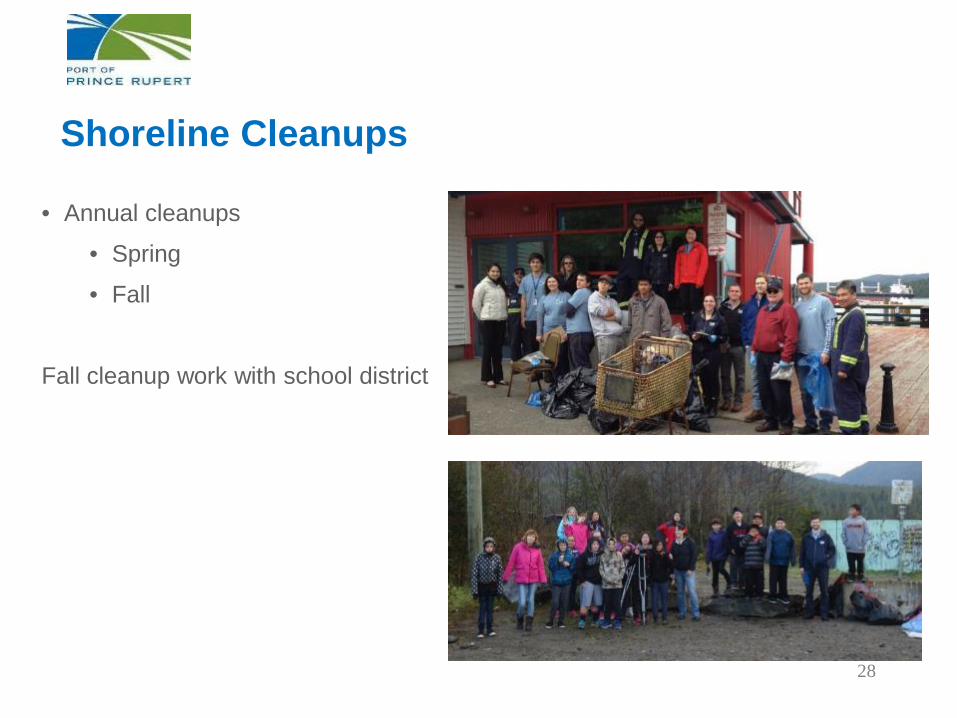
Shoreline Cleanups
• Annual cleanups
• Spring
• Fall
Fall cleanup work with school district
28
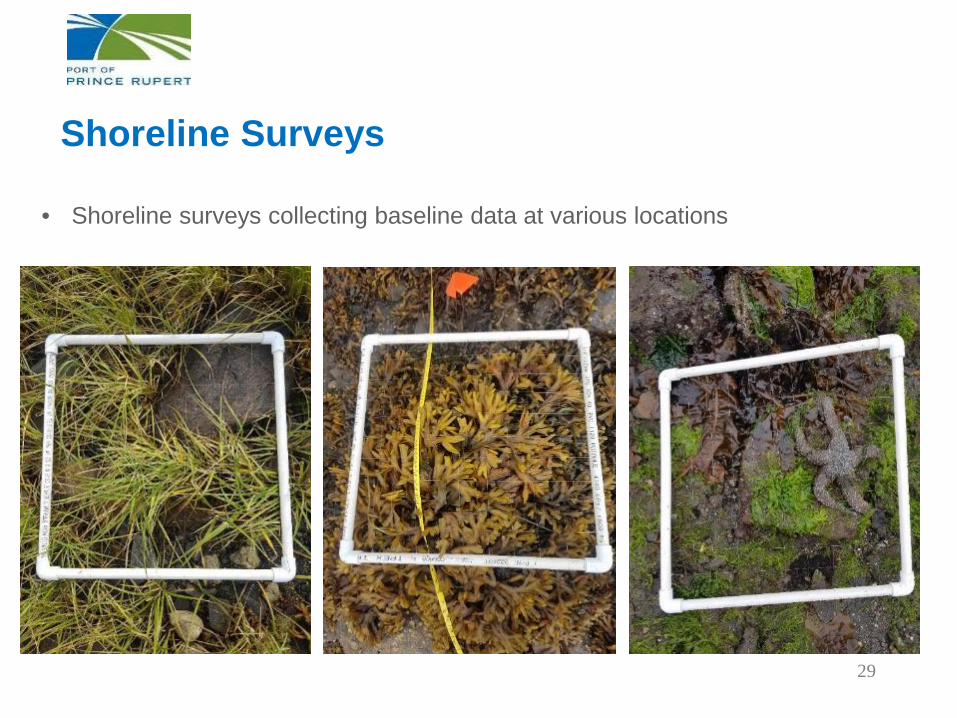
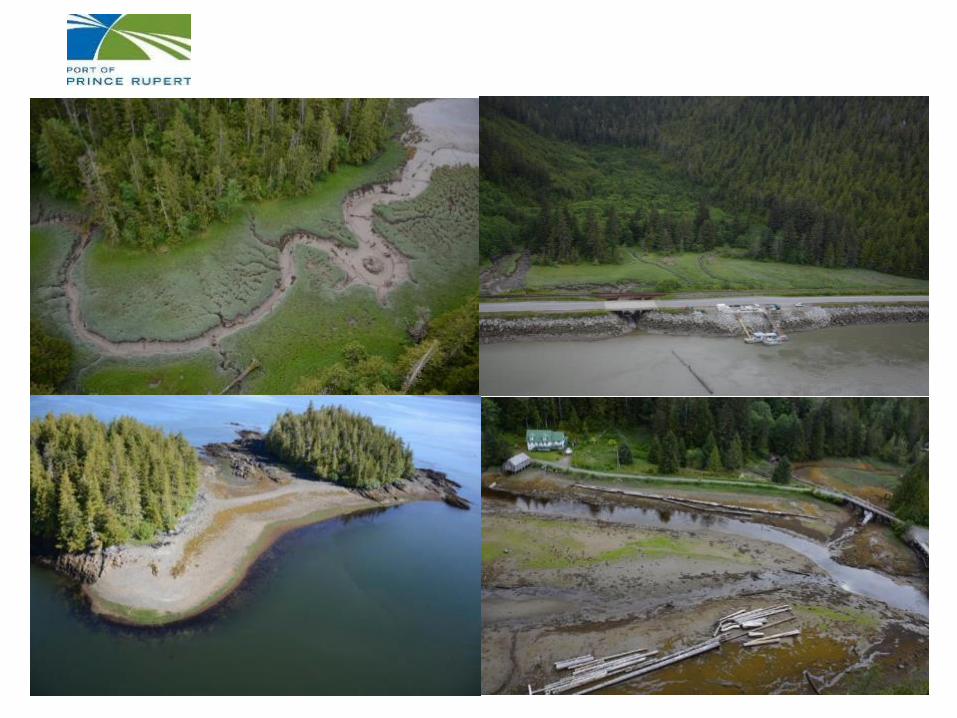
Shoreline Surveys
• Shoreline surveys collecting baseline data at various locations
29
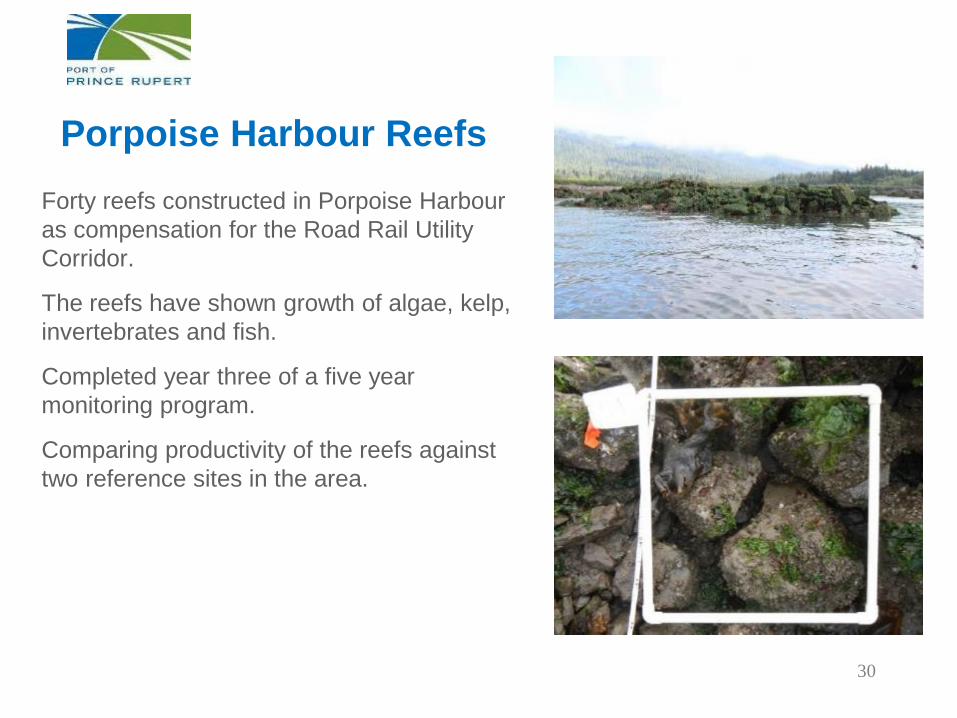
Porpoise Harbour ReefsForty reefs constructed in Porpoise Harbouras compensation for the Road Rail Utility Corridor.
The reefs have shown growth of algae, kelp, invertebrates and fish.
Completed year three of a five year monitoring program.
Comparing productivity of the reefs against two reference sites in the area.
30
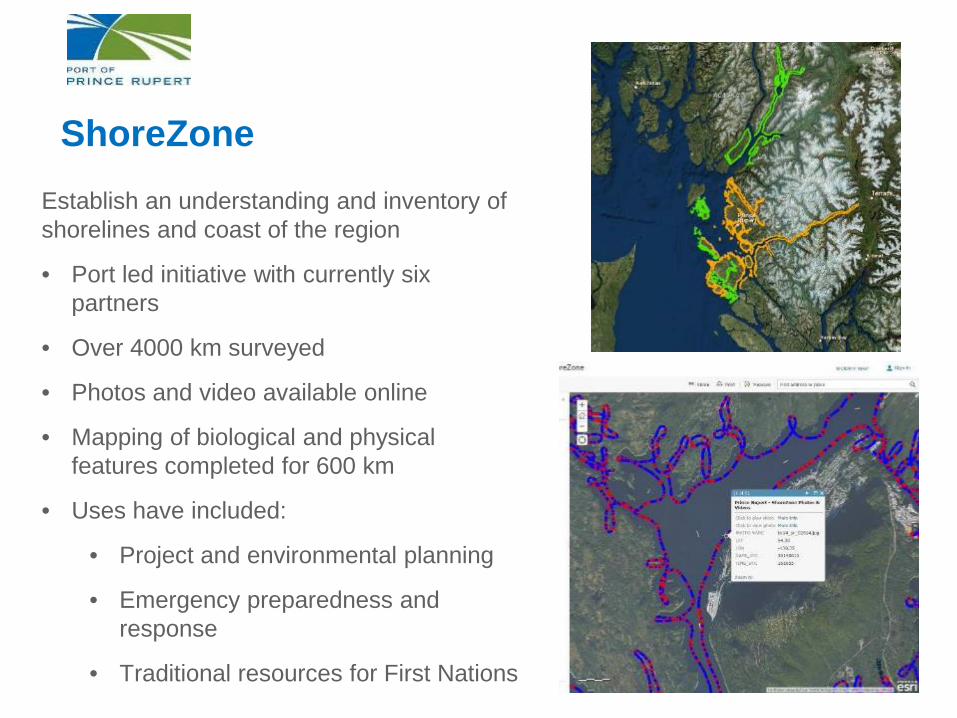
ShoreZoneEstablish an understanding and inventory of shorelines and coast of the region
• Port led initiative with currently six partners
• Over 4000 km surveyed
• Photos and video available online
• Mapping of biological and physical features completed for 600 km
• Uses have included:
• Project and environmental planning
• Emergency preparedness and response
• Traditional resources for First Nations 31
Shorezone
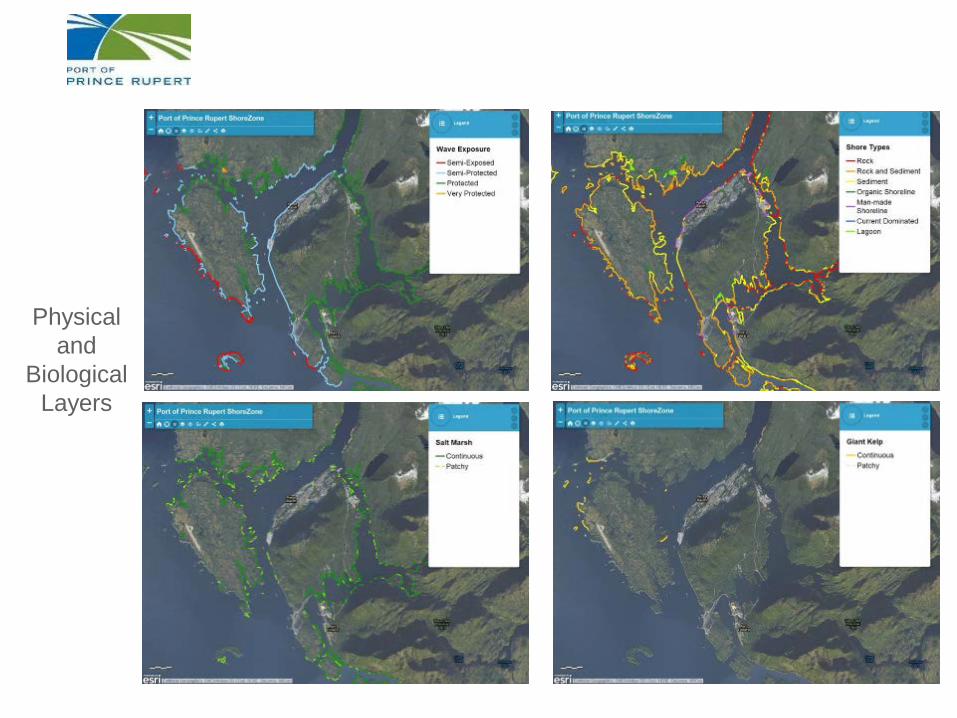
Physicaland
Biological Layers
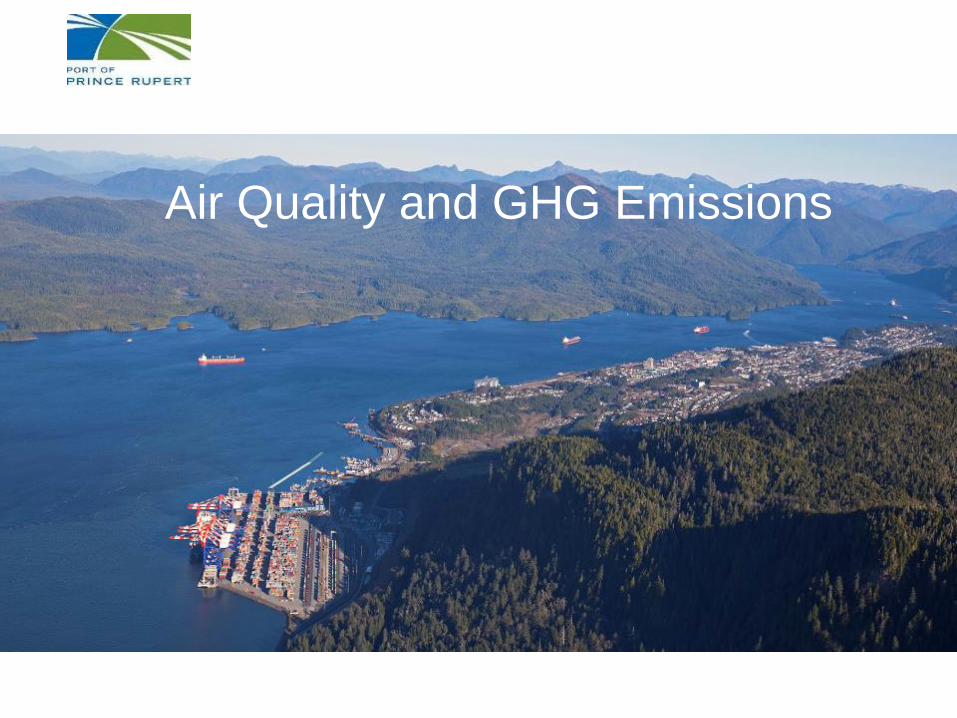
Air Quality and GHG Emissions
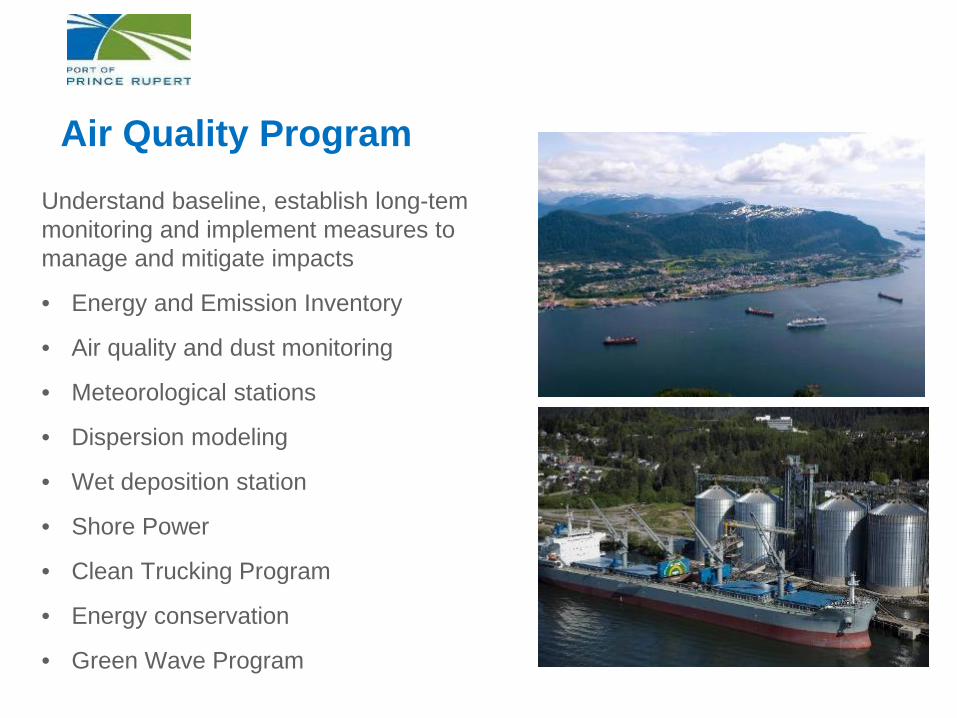
Air Quality ProgramUnderstand baseline, establish long-tem monitoring and implement measures to manage and mitigate impacts
• Energy and Emission Inventory
• Air quality and dust monitoring
• Meteorological stations
• Dispersion modeling
• Wet deposition station
• Shore Power
• Clean Trucking Program
• Energy conservation
• Green Wave Program
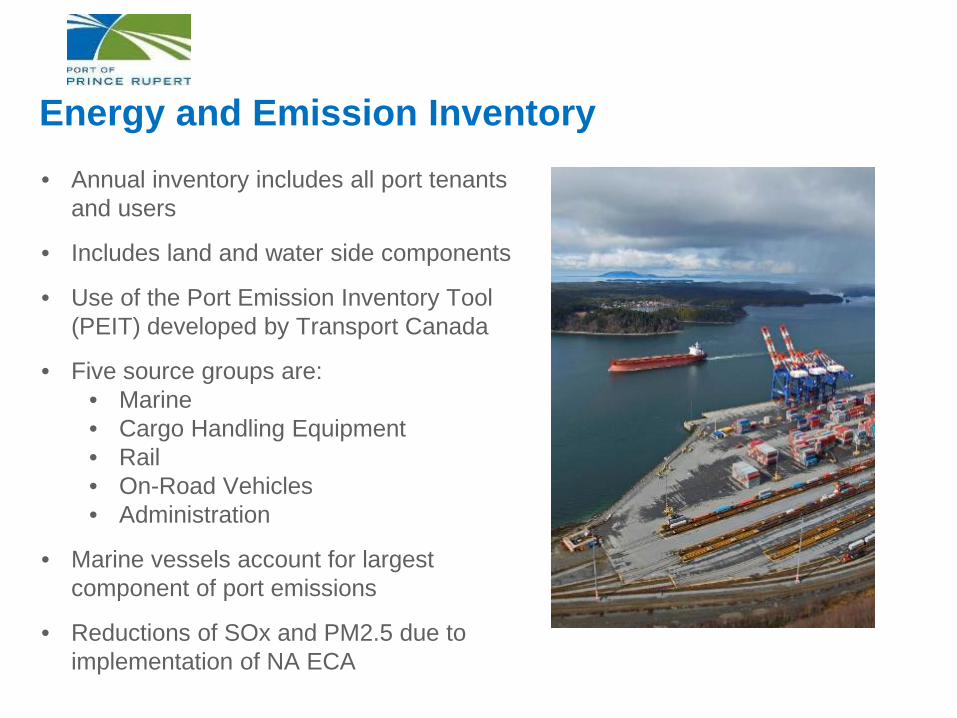
Energy and Emission Inventory• Annual inventory includes all port tenants
and users
• Includes land and water side components
• Use of the Port Emission Inventory Tool (PEIT) developed by Transport Canada
• Five source groups are:• Marine• Cargo Handling Equipment• Rail• On-Road Vehicles• Administration
• Marine vessels account for largest component of port emissions
• Reductions of SOx and PM2.5 due to implementation of NA ECA
Energy and Emission Inventory
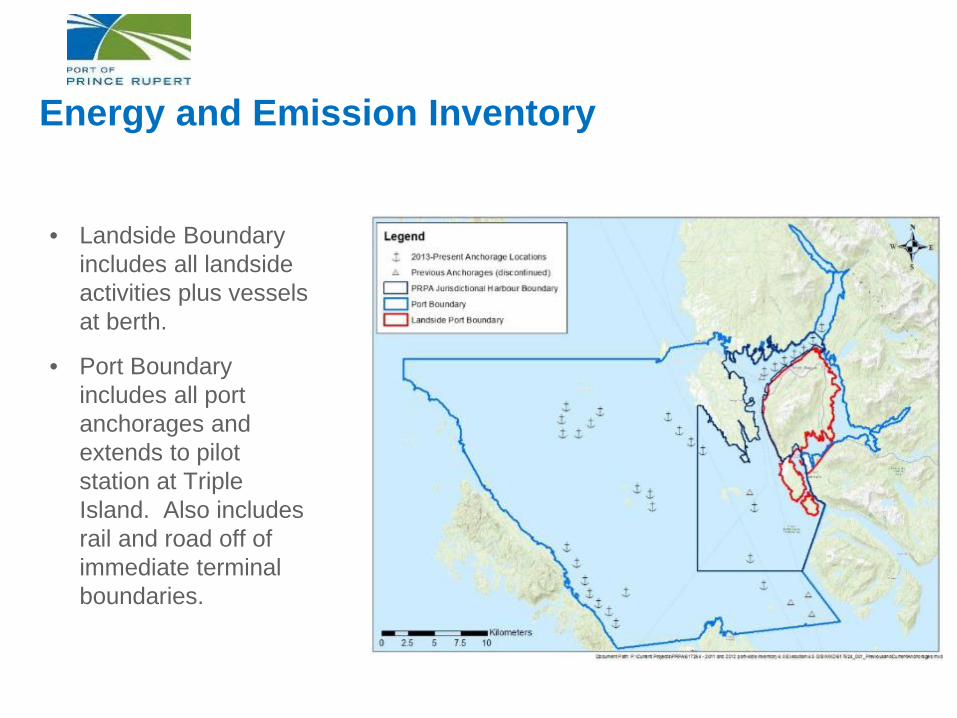
• Landside Boundary includes all landside activities plus vessels at berth.
• Port Boundary includes all port anchorages and extends to pilot station at Triple Island. Also includes rail and road off of immediate terminal boundaries.
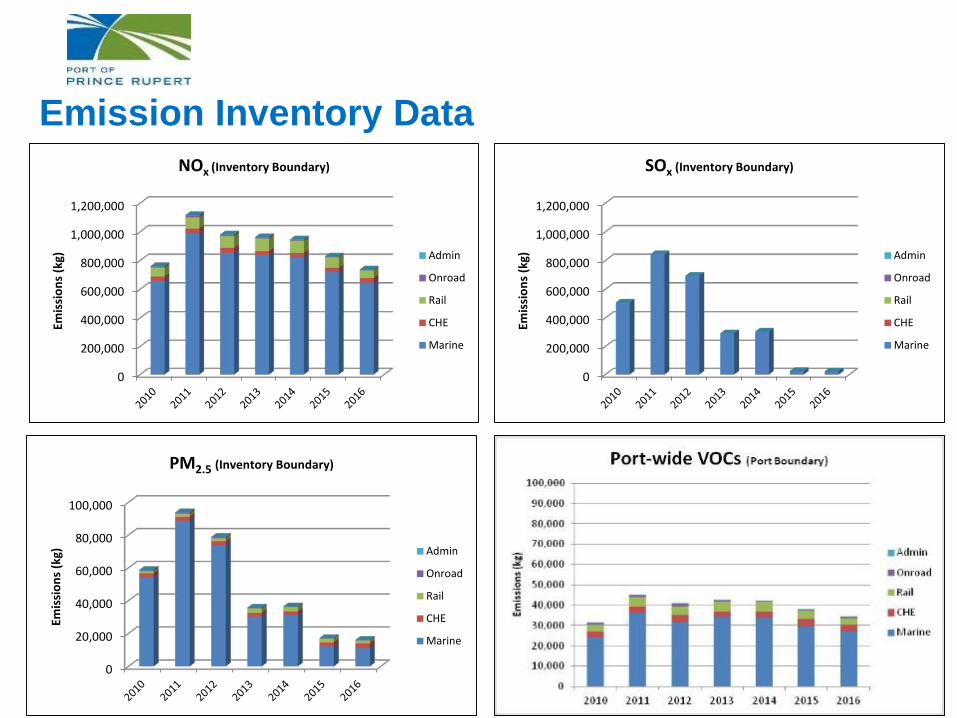
Emission Inventory Data
0
200,000
400,000
600,000
800,000
1,000,000
1,200,000
Emis
sion
s (k
g)
NOx (Inventory Boundary)
Admin
Onroad
Rail
CHE
Marine
0
200,000
400,000
600,000
800,000
1,000,000
1,200,000
Emis
sion
s (k
g)
SOx (Inventory Boundary)
Admin
Onroad
Rail
CHE
Marine
0
20,000
40,000
60,000
80,000
100,000
Emis
sion
s (k
g)
PM2.5 (Inventory Boundary)
Admin
Onroad
Rail
CHE
Marine
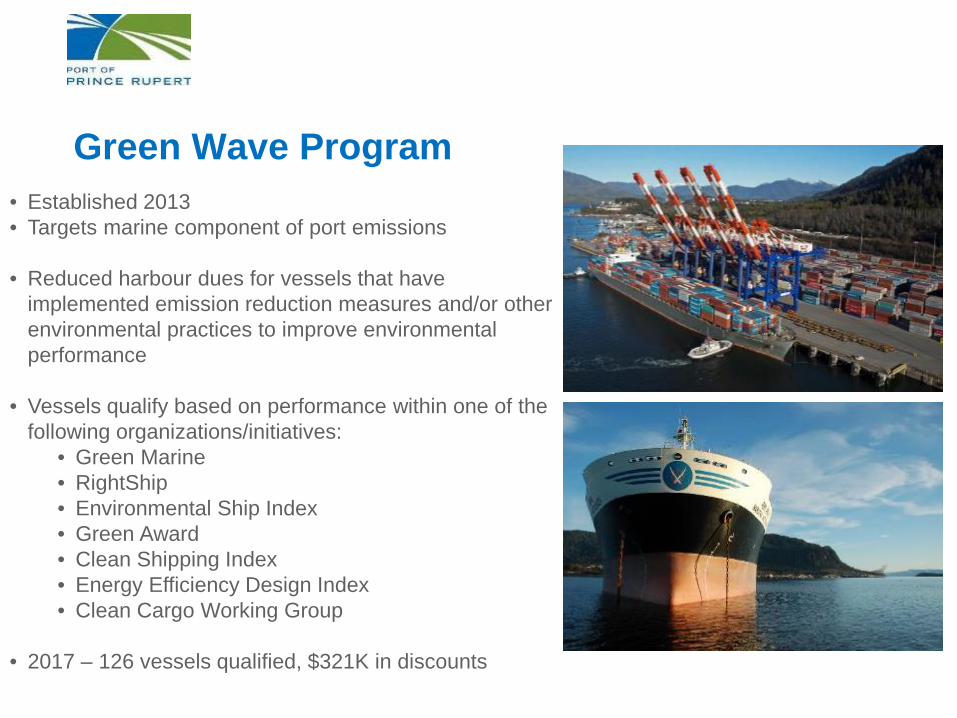
Green Wave Program• Established 2013• Targets marine component of port emissions
• Reduced harbour dues for vessels that have implemented emission reduction measures and/or other environmental practices to improve environmental performance
• Vessels qualify based on performance within one of the following organizations/initiatives:
• Green Marine• RightShip• Environmental Ship Index• Green Award• Clean Shipping Index• Energy Efficiency Design Index• Clean Cargo Working Group
• 2017 – 126 vessels qualified, $321K in discounts
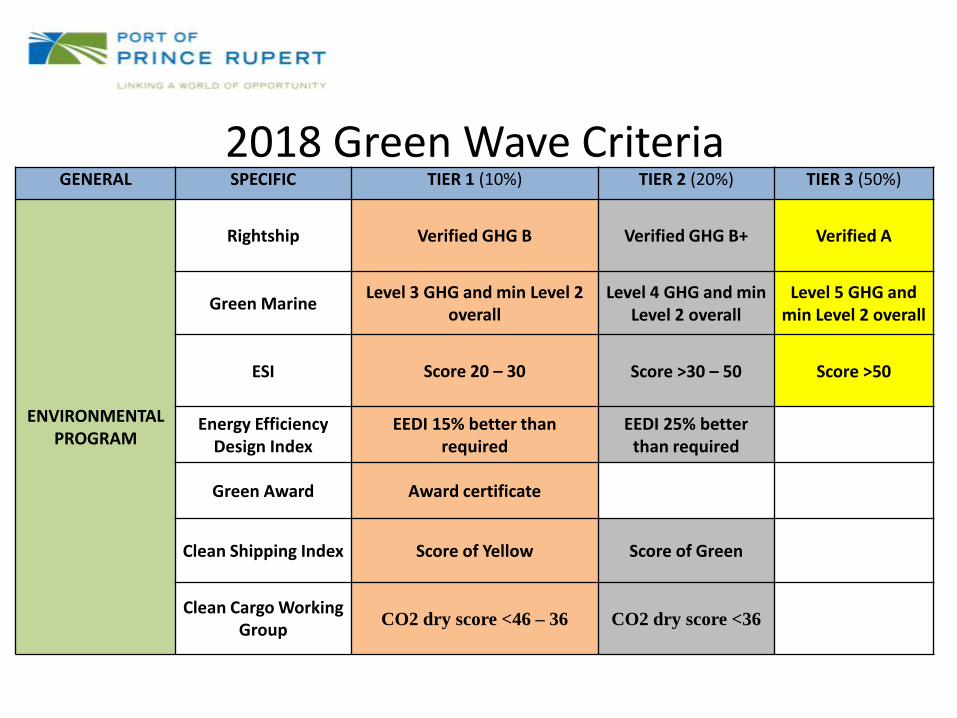
GENERAL SPECIFIC TIER 1 (10%) TIER 2 (20%) TIER 3 (50%)
ENVIRONMENTAL PROGRAM
Rightship Verified GHG B Verified GHG B+ Verified A
Green Marine Level 3 GHG and min Level 2 overall
Level 4 GHG and min Level 2 overall
Level 5 GHG and min Level 2 overall
ESI Score 20 – 30 Score >30 – 50 Score >50
Energy Efficiency Design Index
EEDI 15% better than required
EEDI 25% better than required
Green Award Award certificate
Clean Shipping Index Score of Yellow Score of Green
Clean Cargo Working Group CO2 dry score <46 – 36 CO2 dry score <36
2018 Green Wave Criteria
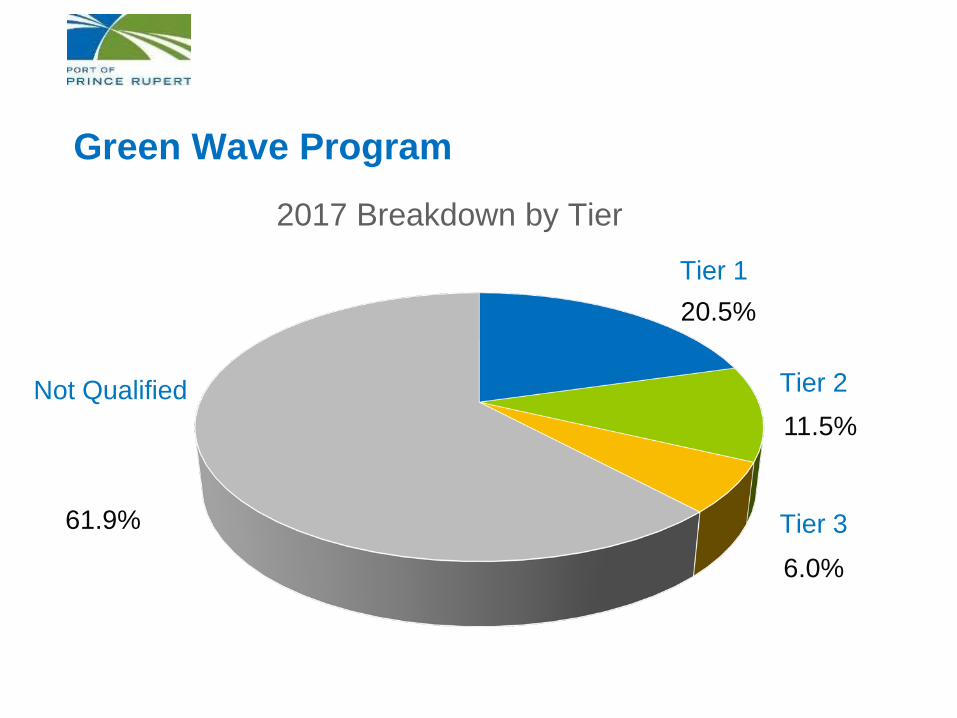
20.5%
11.5%
6.0%
61.9%
Green Wave Program
2017 Breakdown by Tier
Not Qualified
Tier 1
Tier 2
Tier 3
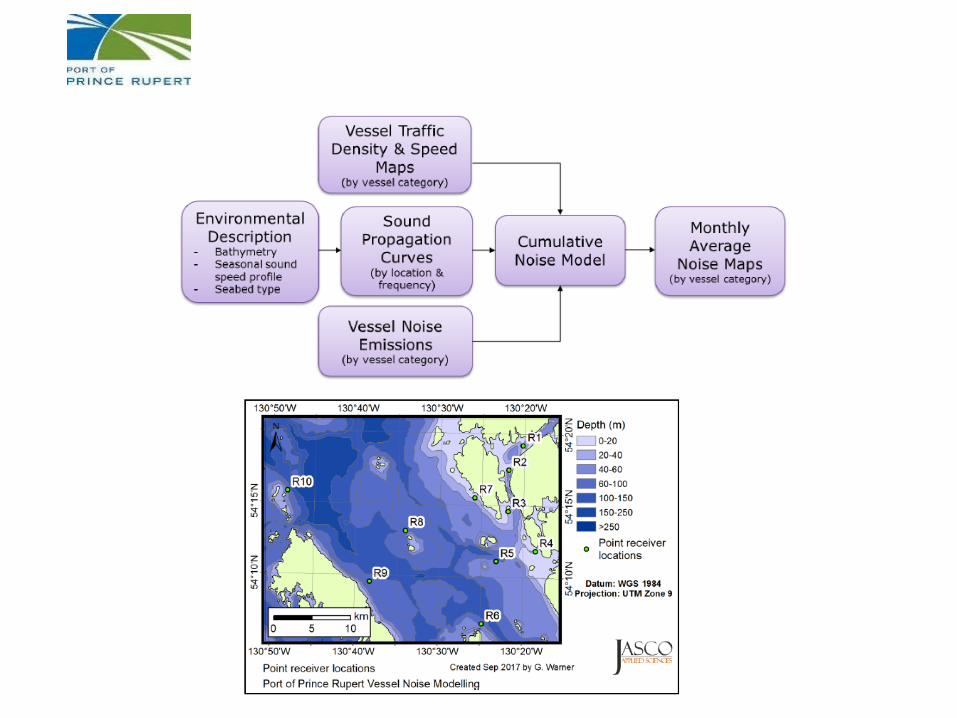
Marine Mammal Program
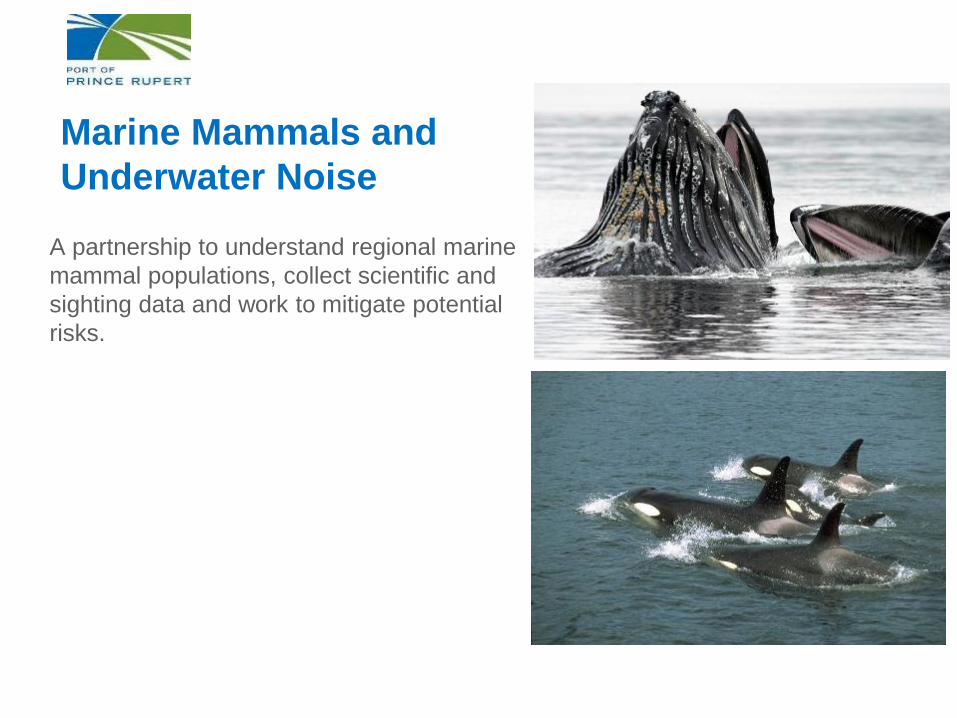
Marine Mammals and Underwater Noise
A partnership to understand regional marine mammal populations, collect scientific and sighting data and work to mitigate potential risks.
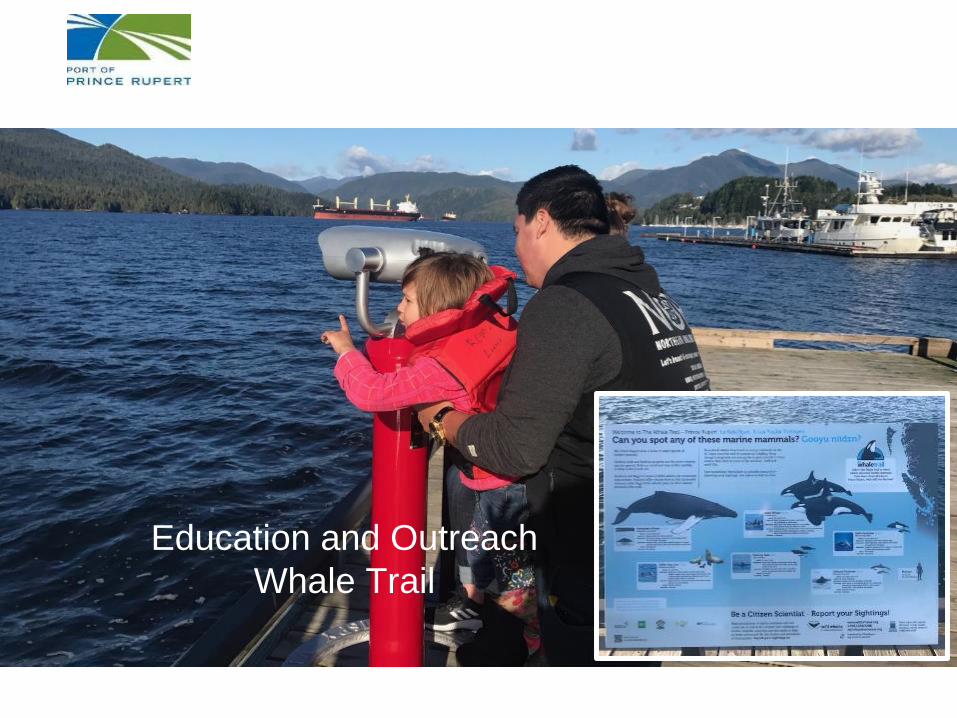
Education and OutreachWhale Trail
46
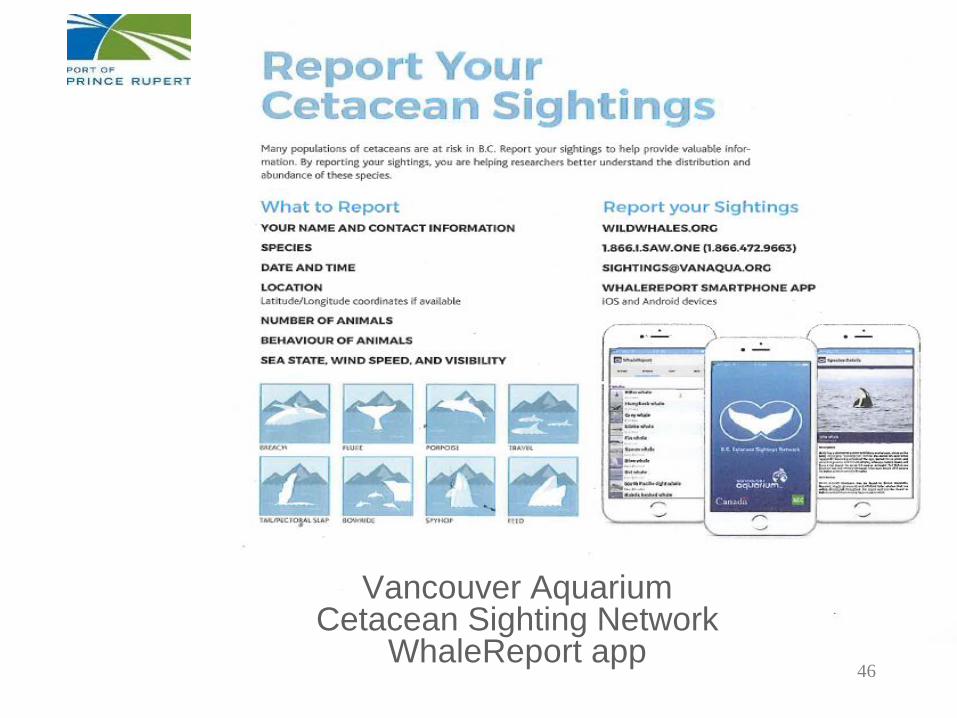
Vancouver AquariumCetacean Sighting Network
WhaleReport app
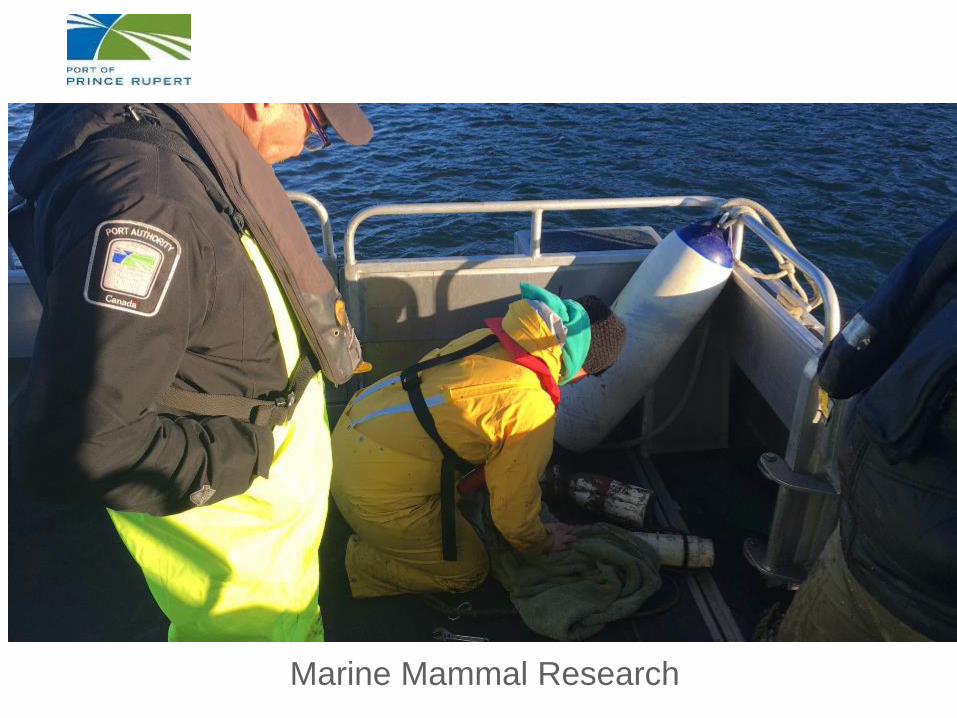
Marine Mammal Research
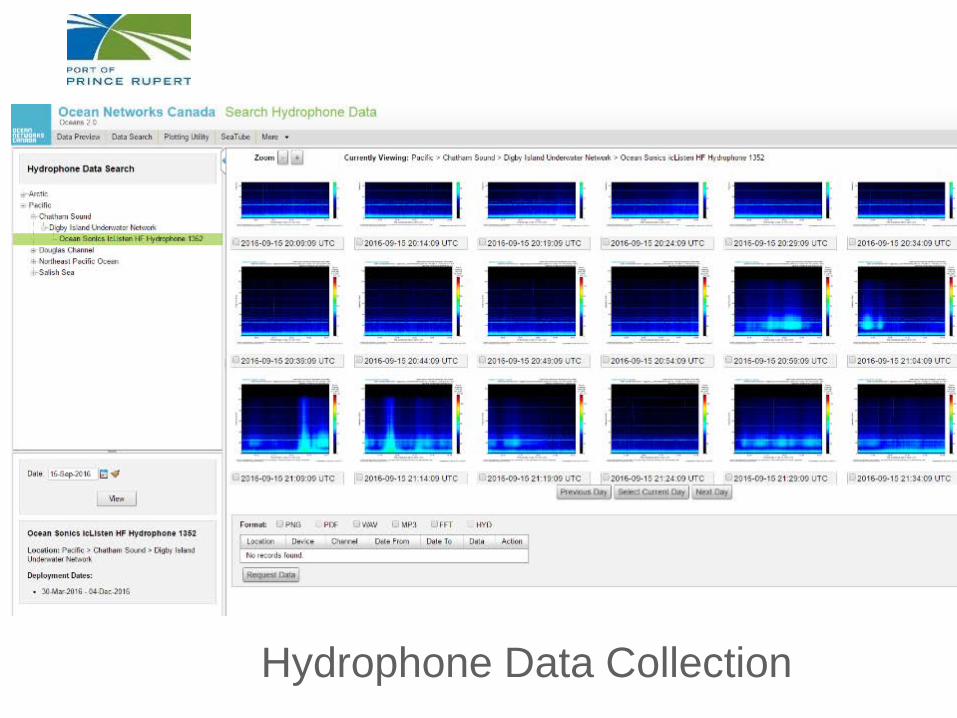
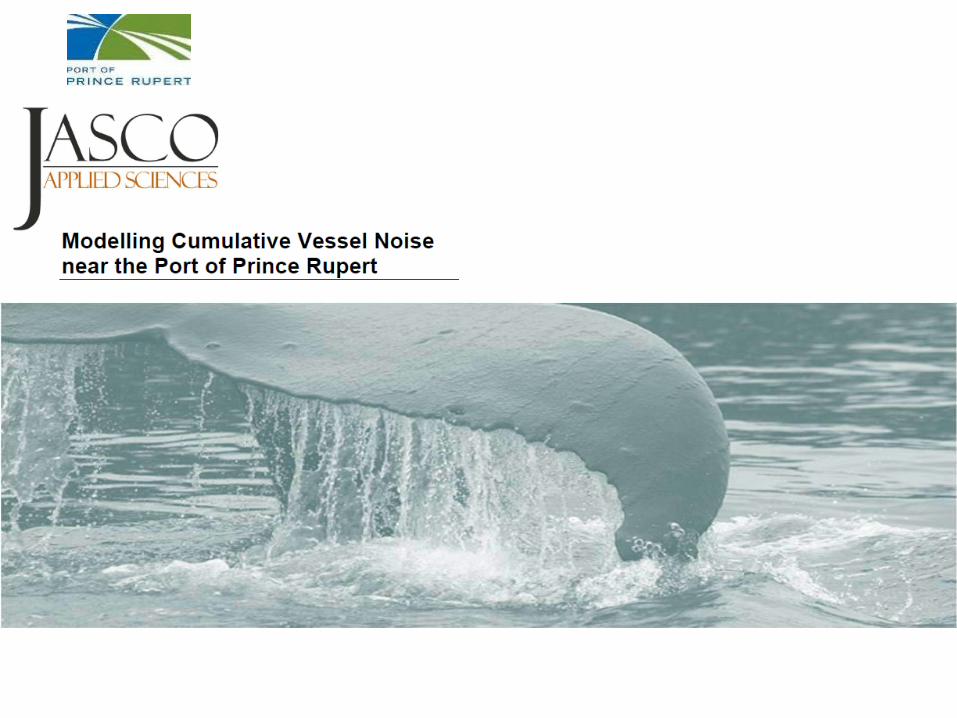
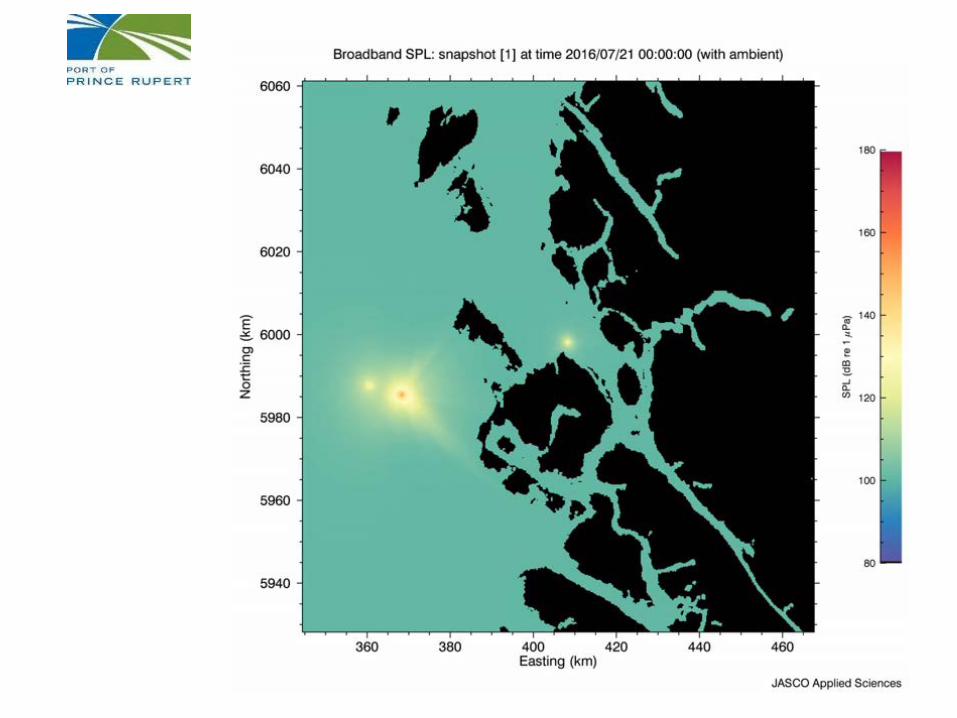
Hydrophone Data Collection
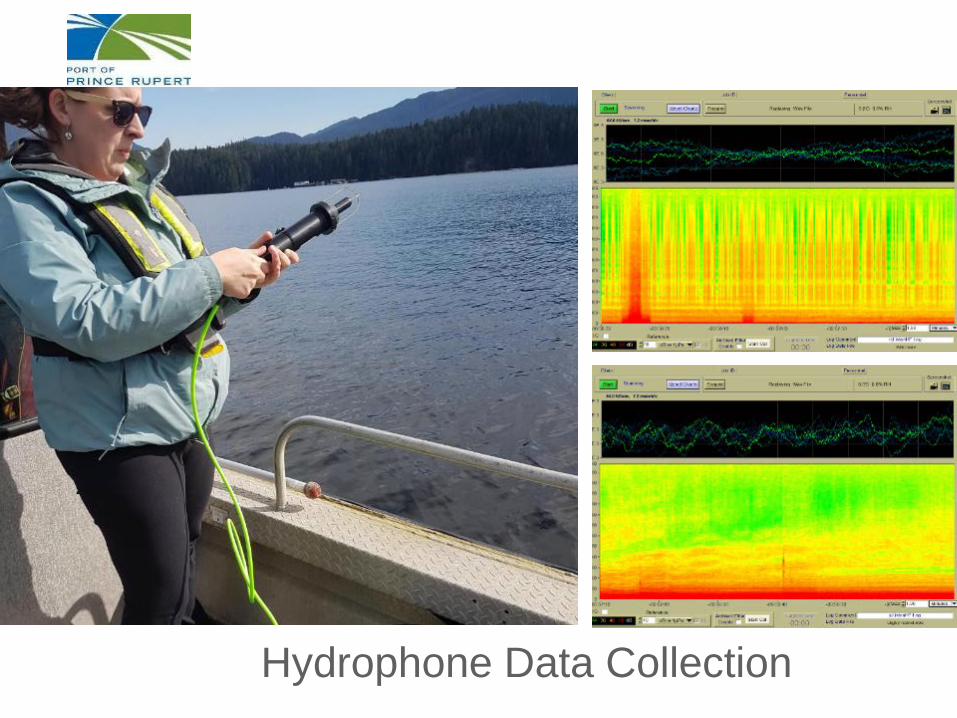
Hydrophone Data Collection
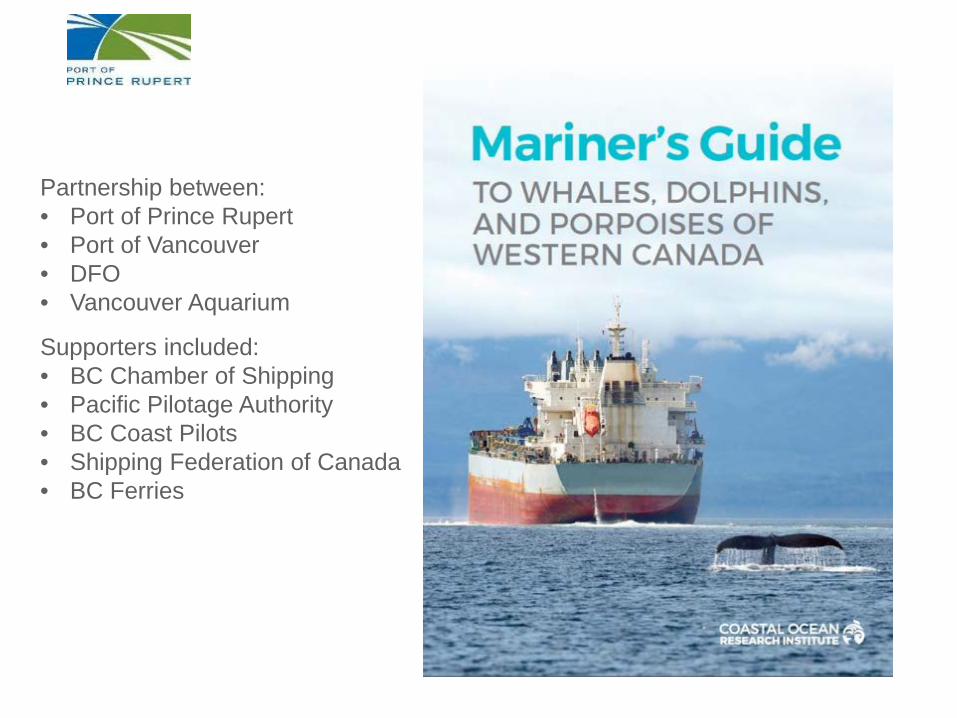
Partnership between:• Port of Prince Rupert• Port of Vancouver• DFO• Vancouver Aquarium
Supporters included:• BC Chamber of Shipping• Pacific Pilotage Authority• BC Coast Pilots• Shipping Federation of Canada• BC Ferries
51
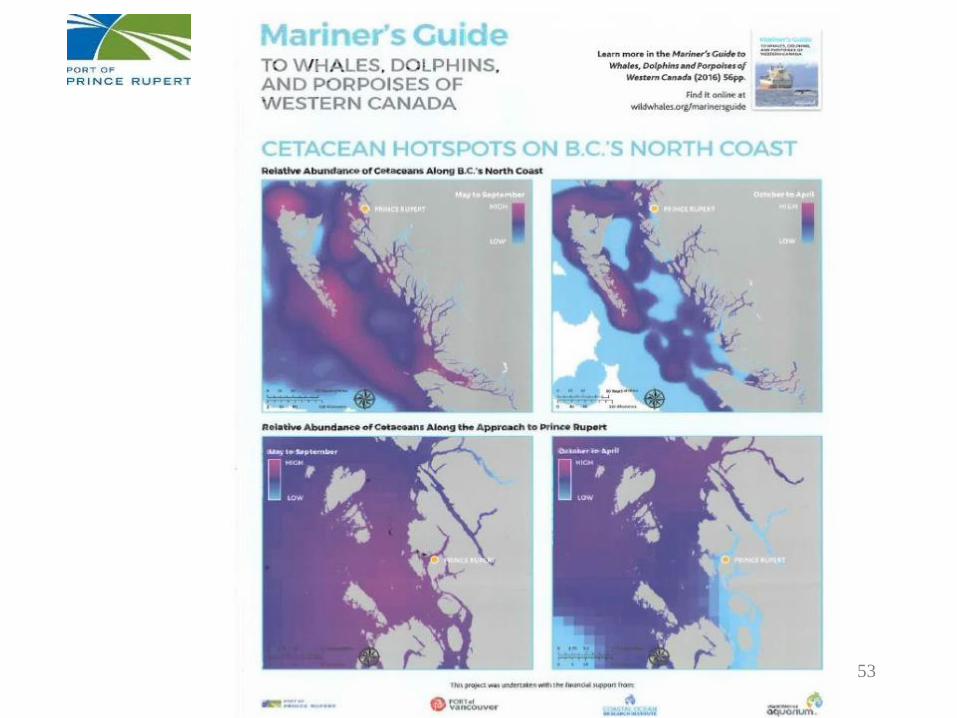
53
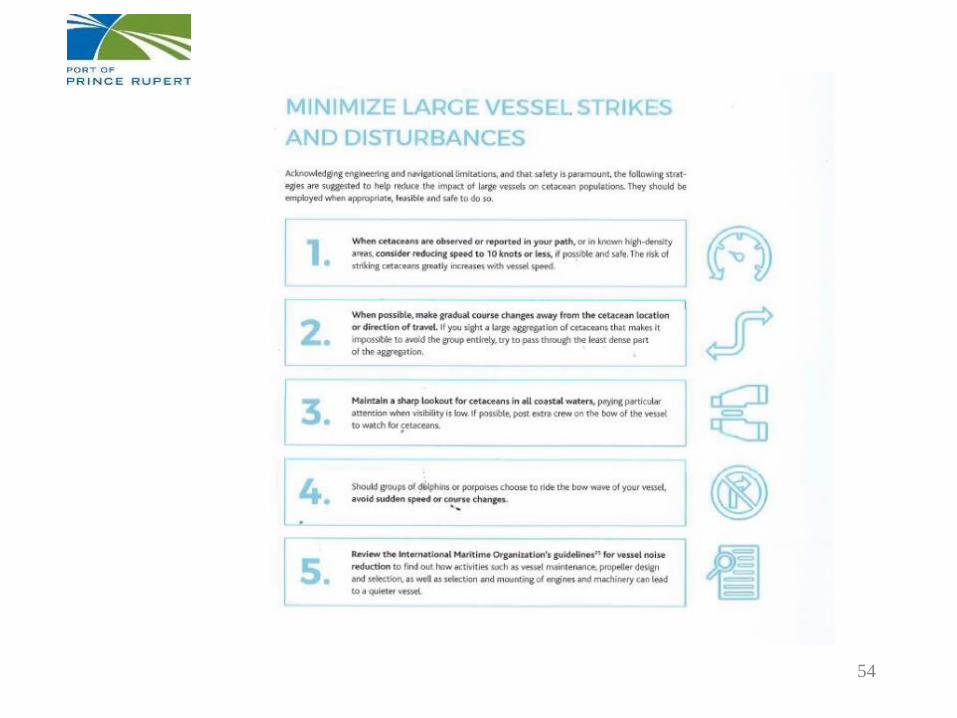
54
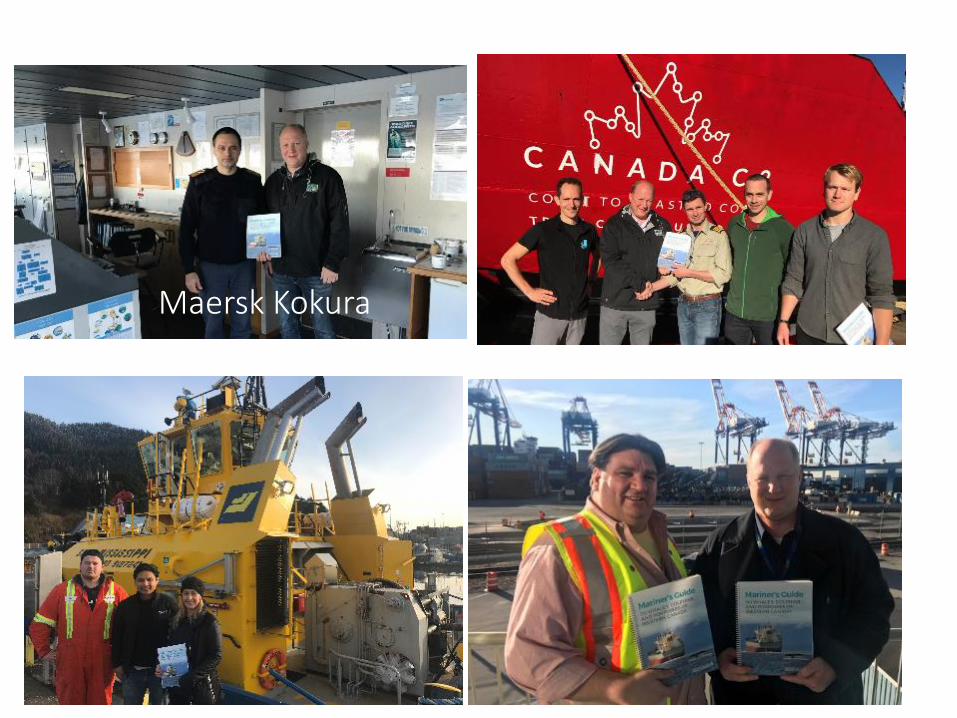
Maersk Kokura
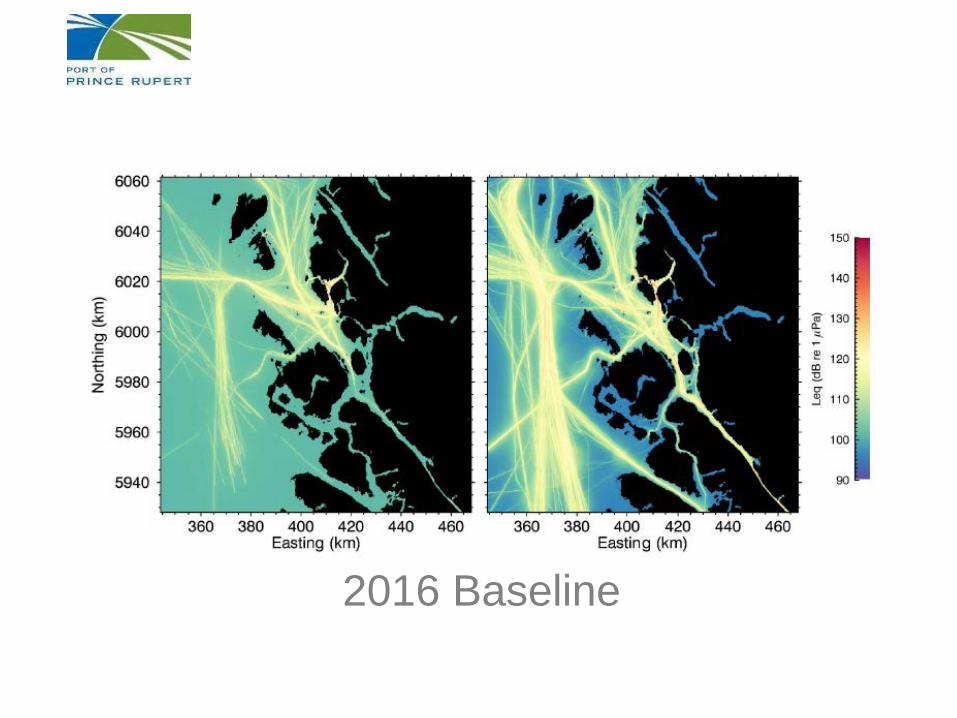
2016 Baseline

Port Buildout
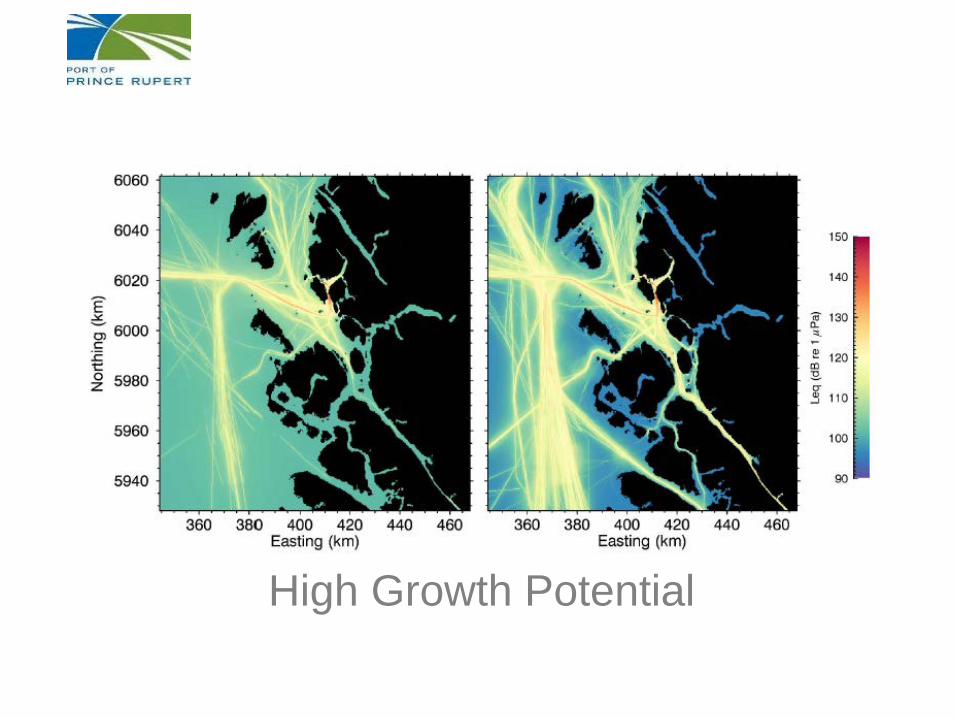
High Growth Potential
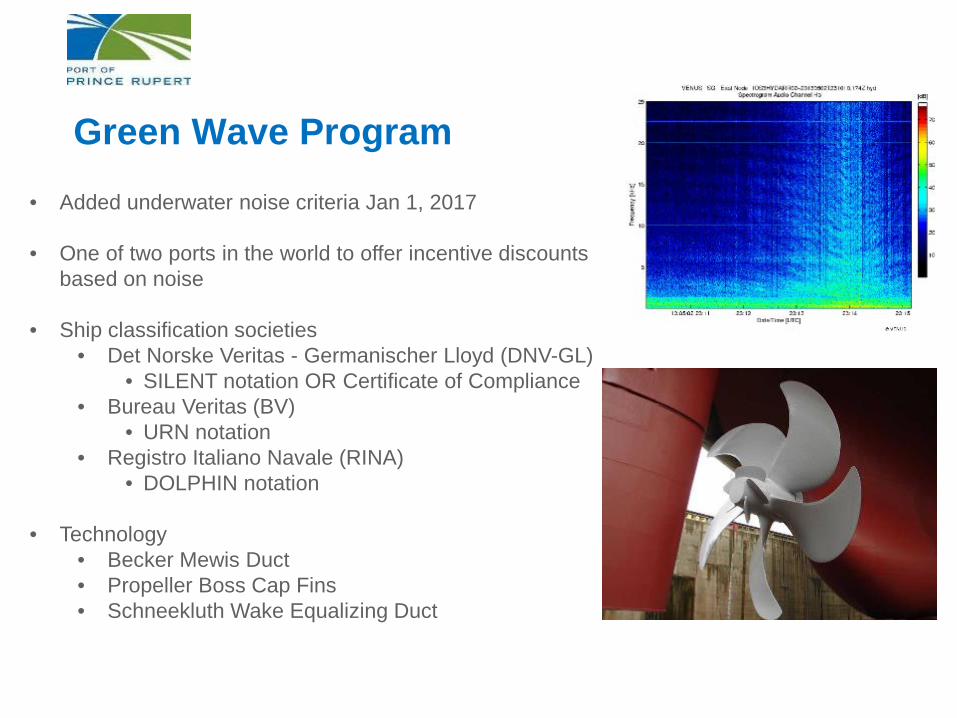
Green Wave Program
• Added underwater noise criteria Jan 1, 2017
• One of two ports in the world to offer incentive discounts based on noise
• Ship classification societies• Det Norske Veritas - Germanischer Lloyd (DNV-GL)
• SILENT notation OR Certificate of Compliance• Bureau Veritas (BV)
• URN notation• Registro Italiano Navale (RINA)
• DOLPHIN notation
• Technology• Becker Mewis Duct• Propeller Boss Cap Fins• Schneekluth Wake Equalizing Duct
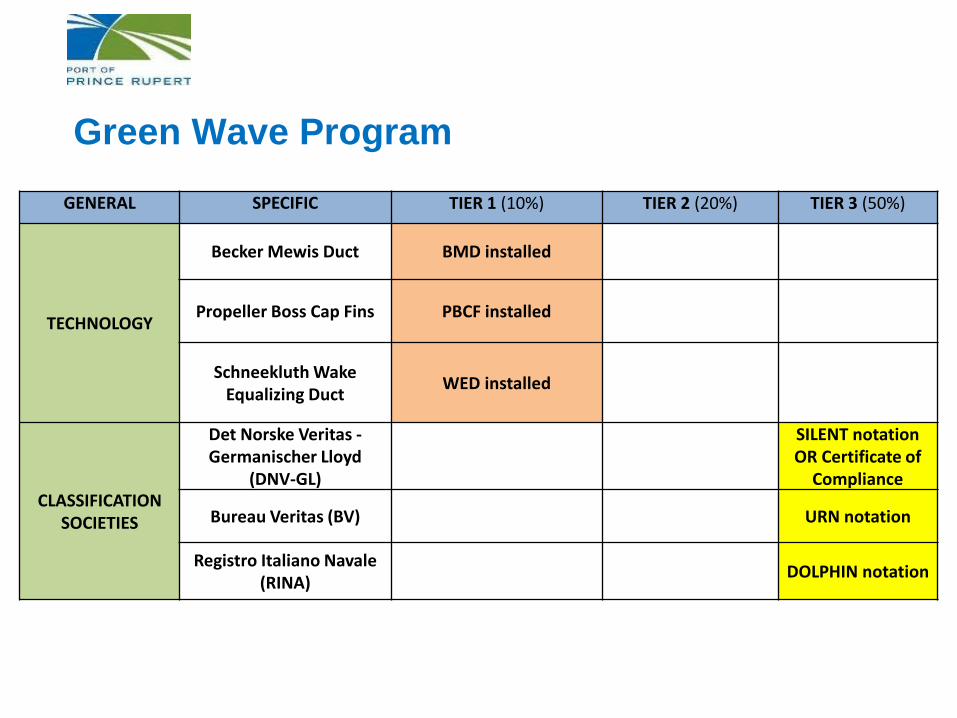
Green Wave ProgramGENERAL SPECIFIC TIER 1 (10%) TIER 2 (20%) TIER 3 (50%)
TECHNOLOGY
Becker Mewis Duct BMD installed
Propeller Boss Cap Fins PBCF installed
Schneekluth Wake Equalizing Duct WED installed
CLASSIFICATION SOCIETIES
Det Norske Veritas -Germanischer Lloyd
(DNV-GL)
SILENT notation OR Certificate of
Compliance
Bureau Veritas (BV) URN notation
Registro Italiano Navale(RINA) DOLPHIN notation
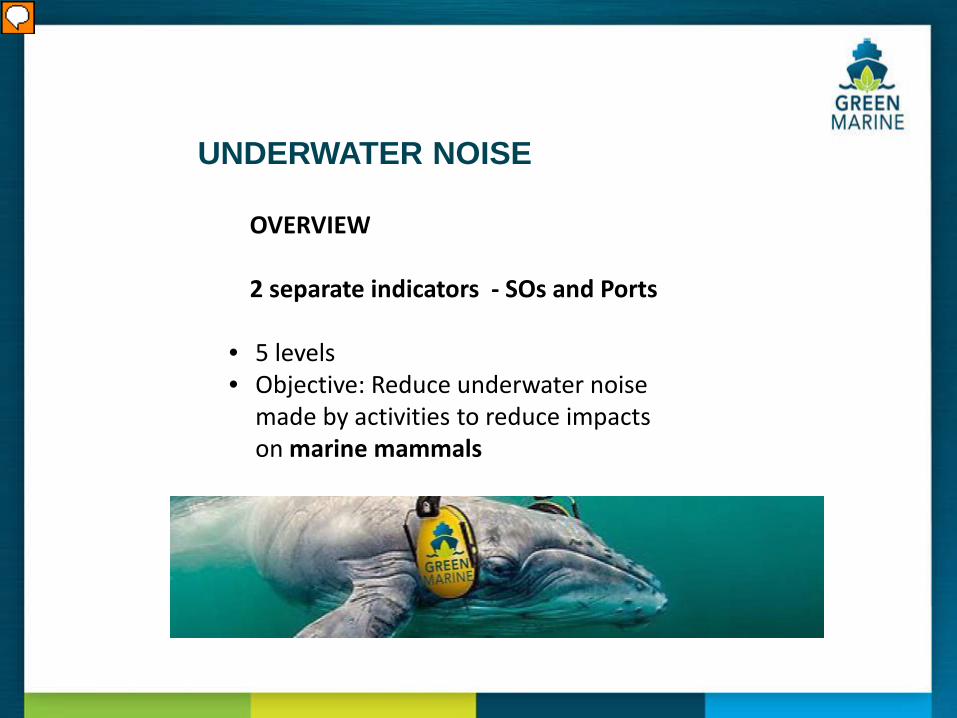
UNDERWATER NOISE
OVERVIEW
2 separate indicators - SOs and Ports
• 5 levels• Objective: Reduce underwater noise
made by activities to reduce impacts on marine mammals
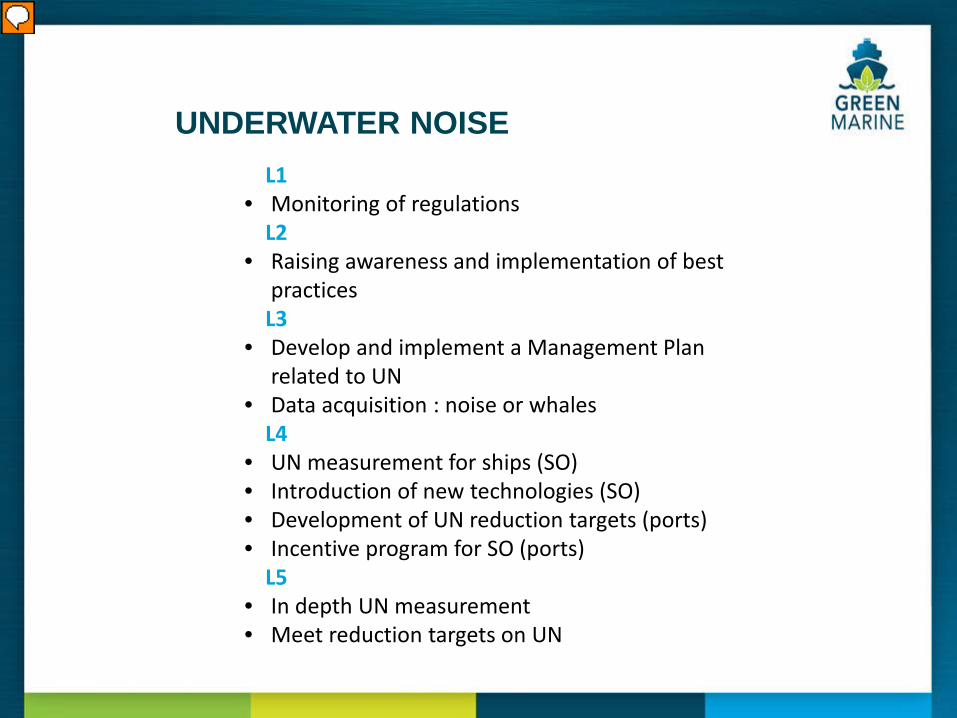
UNDERWATER NOISEL1
• Monitoring of regulations L2
• Raising awareness and implementation of best practices
L3• Develop and implement a Management Plan
related to UN• Data acquisition : noise or whales
L4• UN measurement for ships (SO)• Introduction of new technologies (SO)• Development of UN reduction targets (ports)• Incentive program for SO (ports)
L5• In depth UN measurement• Meet reduction targets on UN
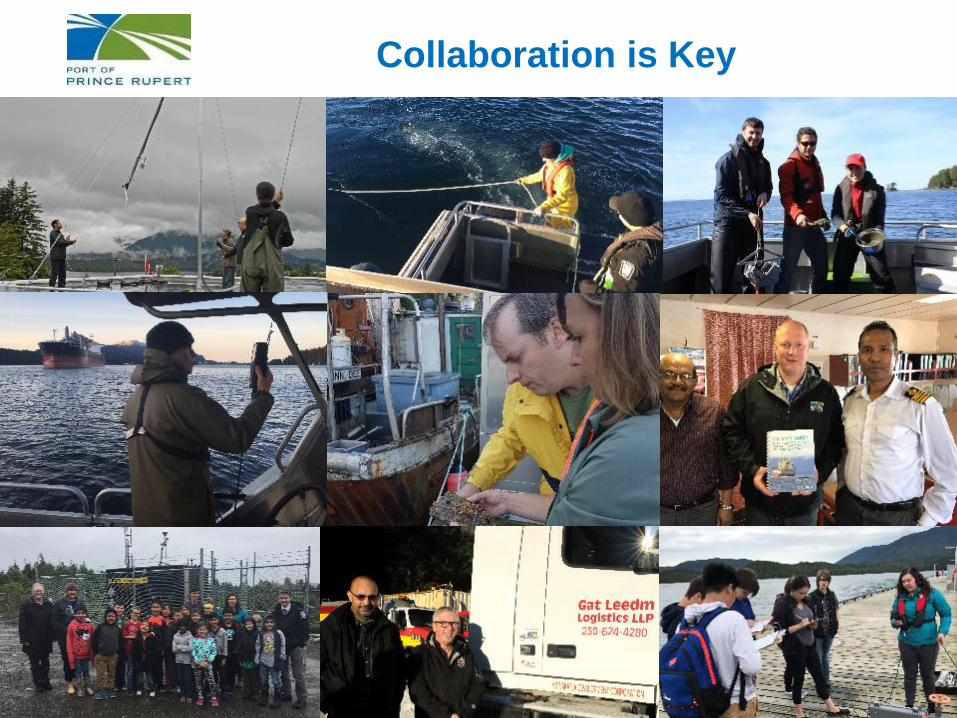
Collaboration is Key


![Awaveletframemethodwithshapepriorforultrasoundvideosegment ...matzuows/video.pdf · The wavelet frame based models [38, 19] and the variational models of [14, 41, 3] are closely related,](https://img.pdfslide.us/doc/110x75/5caedd5388c99333788de5af/awaveletframemethodwithshapepriorforultrasoundvideosegment-matzuowsvideopdf.jpg)