Embed Size (px)
Citation preview
MARINE ECOLOGY PROGRESS SERIESMar Ecol Prog Ser
Vol. 555: 49–64, 2016doi: 10.3354/meps11831
Published August 18
INTRODUCTION
Pronounced seasonal oscillations in abiotic (e.g.solar radiation, temperature, sea ice) and biotic (e.g.food availability, predation pressure) environmentsoffer challenges to zooplankton in high latitudes. Inparticular, seasonality in food availability is believedto be a significant challenge (Clarke & Peck 1991,Conover & Huntley 1991, Hagen 1999, Varpe 2012).Arctic zooplankton possess adaptations to counter aseasonally variable food supply, such as energy stor-
age (Lee et al. 2006, Varpe et al. 2009), diapause(Carlisle 1961, Hirche 1996), and seasonal verticalmigrations (Conover 1988). Zooplankton seasonalvertical migrations are understood as an adaptive be -havior that optimizes their position in the water col-umn in response to seasonal variability in the envi-ronment (Werner & Gilliam 1984). We refer to thisbehavior as their ‘seasonal vertical strategy’. Sea-sonal vertical strategies of some high-latitude herbi -vorous zooplankton are well-documented (e.g. Con -over 1988, Falk-Petersen et al. 2009), and their adap-
© The authors 2016. Open Access under Creative Commons byAttribution Licence. Use, distribution and reproduction are un -restricted. Authors and original publication must be credited.
Publisher: Inter-Research · www.int-res.com
*Corresponding author: [email protected]
Seasonal vertical strategies in a high-Arctic coastalzooplankton community
Kanchana Bandara1,*, Øystein Varpe2,3, Janne E. Søreide2, Jago Wallenschus2, Jørgen Berge2,4, Ketil Eiane1
1Faculty of Biosciences and Aquaculture, Nord University, 8049 Bodø, Norway2The University Centre in Svalbard (UNIS), 9171 Longyearbyen, Norway
3Akvaplan-niva, Fram Centre, 9296 Tromsø, Norway4Faculty of Biosciences, Fisheries and Economics, UiT The Arctic University of Norway, 9037 Tromsø, Norway
ABSTRACT: We studied the larger (>1000 µm) size fraction of zooplankton in an Arctic coastalwater community in Billefjorden, Svalbard (78°40’ N), Norway, in order to describe seasonal ver-tical distributions of the dominant taxa in relation to environmental variability. Calanus spp.numerically dominated the herbivores; Aglantha digitale, Mertensia ovum, Beroë cucumis, andParasagitta elegans were the dominant carnivores. Omnivores and detritivores were numericallyless important. Descent to deeper regions of the water column (>100 m) between August andOctober, and ascent to the shallower region (<100 m) between November and May was the overallseasonal pattern in this zooplankton community. In contrast to other groups, P. elegans did notexhibit pronounced vertical migrations. Seasonal vertical distributions of most species showedstatistical associations with the availability of their main food source. The vertical distribution oflater developmental stages of Calanus spp. was inversely associated with fluorescence, indicatingthat they descended from the shallower region while it was still relatively productive, andascended before the primary production had started to increase. Strong associations between thevertical distributions of secondary consumer M. ovum and Calanus spp., and tertiary consumerB. cucumis and M. ovum indicated that these carnivores seasonally followed their prey throughthe water column. We conclude that seasonal vertical migrations are a widespread trait in the highArctic community studied, and predator−prey interactions seem particularly central in shapingthe associations between the seasonal vertical strategies of adjacent trophic levels.
KEY WORDS: Seasonal vertical migration · Food availability · Trophic interactions · Pelagic environments · Predator−prey interactions
OPENPEN ACCESSCCESS
Mar Ecol Prog Ser 555: 49–64, 2016
tive value has also been analyzed in modeling stud-ies (e.g. Fiksen 2000, Varpe et al. 2007).
The underlying regulation of zooplankton seasonalvertical strategies has been a subject of interest sinceearly 1900s (Russell 1927, Banse 1964). Seasonalvariability in hydrography (Hirche 1991), photo -period (Sømme 1934, Miller et al. 1991), and visualpredation (Kaartvedt 1996, Dale et al. 1999, Kaart -vedt 2000) are some external environmental cuesthat are thought to regulate seasonal vertical strate-gies. Internal (endogenous) regulation through sea-sonal changes in gonad development (Østvedt 1955),lipids and buoyancy (Visser & Jónasdóttir 1999), andlong-term endogenous timers (Miller et al. 1991,Hirche 1996) have also been suggested.
Many components of zooplankton life strategies areviewed as adaptations to seasonal variations in foodsupply (Ji et al. 2010, Varpe 2012), but the influenceof food availability on seasonal vertical strategies re-mains poorly understood, particularly for carni vorousspecies. As the seasonal food supply is more pro-nounced for Arctic herbivorous zooplankton (Conover& Huntley 1991, Hagen 1999), whose energetic de-mands mainly depend on a short period of annual pri-mary production (Falk-Petersen et al. 2009), it can beargued that their seasonal vertical strategies aretightly coupled with food availability. Although verti-cal distributions of Calanus spp. appear to be associ-ated with food availability (chlorophyll a distrib -utions) in spring (Herman 1983, Søreide et al. 2008,Basedow et al. 2010), it is less well-studied for the restof the year. Compared to herbi vores, Arctic carnivo-rous and omnivorous zooplankton rely to a greaterextent on a year-round food supply (Hagen 1999).Therefore, it has been suggested that their seasonaladaptations are less pronounced compared to herbi-vores (Ji et al. 2010, Varpe 2012). As vertical distribu-tions vary seasonally in a number of carnivorous hy-dromedusae (e.g. Pertsova et al. 2006), ctenophores(e.g. Siferd & Conover 1992), chaetognaths (e.g.Grigor et al. 2014), euphausiids (e.g. Lass et al. 2001),and copepods (e.g. Vestheim et al. 2005), it appearsthat seasonal vertical strategies of Arctic carnivo -rous zooplankton are more diverse than previouslythought. Since many carnivores rely on herbivores astheir main food source, the potential influence of thevertical strategies of herbivorous zooplankton ontheir predators may be ecologically significant. This isportrayed in the findings of Nelson et al. (1997) andSims et al. (2005), where a close resemblance be -tween the vertical behavior of planktivorous sharksand the diel vertical migration (DVM) of herbivorouszooplankton were reported. Whether such relation-
ships exist on seasonal timescales is not known, andopen for investigation.
Investigating the seasonality of zooplankton strate-gies and interactions requires studying pelagic com-munities over the course of an annual cycle. Apartfrom a few studies (e.g. Hop et al. 2006), year-roundzooplankton community investigations are rare in theArctic. Here, we investigated seasonal vertical distri-butions of the dominant herbivore and carnivore zoo-plankton in a high-latitude coastal zooplankton com-munity during a 10-month period in 2008 and 2009.We studied the extent to which the seasonal verticaldistributions of the above zooplankton could be ex -plained by the seasonal dynamics of their primaryfood source, or physical environmental variablessuch as temperature, salinity, and irradiance.
MATERIALS AND METHODS
Study site
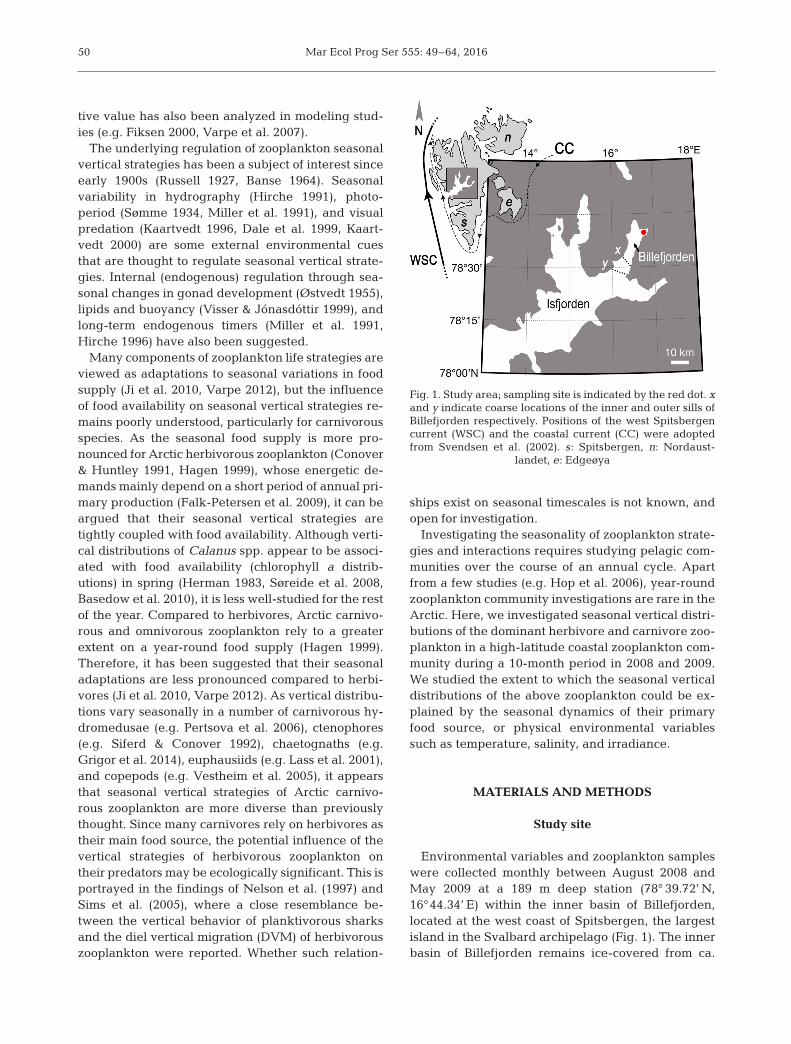
Environmental variables and zooplankton sampleswere collected monthly between August 2008 andMay 2009 at a 189 m deep station (78° 39.72’ N,16°44.34’ E) within the inner basin of Billefjorden,located at the west coast of Spitsbergen, the largestisland in the Svalbard archipelago (Fig. 1). The innerbasin of Billefjorden remains ice-covered from ca.
50
Fig. 1. Study area; sampling site is indicated by the red dot. xand y indicate coarse locations of the inner and outer sills ofBillefjorden respectively. Positions of the west Spitsbergencurrent (WSC) and the coastal current (CC) were adoptedfrom Svendsen et al. (2002). s: Spitsbergen, n: Nordaust-
landet, e: Edgeøya
Bandara et al.: Zooplankton seasonal vertical strategies
December to June (Arnkværn et al. 2005). Two 50 to70 m deep sills located near the mouth of the fjord(Fig. 1) act as a topographical barrier that hinders theadvection of the Atlantic water masses into Billefjor-den (Cottier et al. 2005, Nilsen et al. 2008). Becauseof this, Arnkværn et al. (2005) argued that zooplank-ton population dynamics in Billefjorden are influ-enced more by internal processes than by ad vection.
Environmental variables
Temperature and salinity were profiled in situusing either a CTD/STD model DS 204 (SAIV) or aSeabird™ CTD (Sea-Bird Electronics). Since noCTDs were deployed on 27 August and 07 Septem-ber 2008, and 23 March 2009 (Table 1), we ob -tained temperature and salinity data for these datesfrom a moored instrument series (www.sams. ac. uk/oceans-2025/arctic-mooring) deployed <0.5 nauticalmiles away (78° 39.76’ N, 16° 11.24’ E) from the sam-pling site (see Supplement 1 at www. int-res. com/articles/suppl/m555 p049_ supp. pdf). We measuredphotosynthetically active radiation (PAR) from aQSP 2300 log quantum scalar irradiance sensor(Biospherical Instruments), and fluorescence from aSeapoint™ chlorophyll fluoro meter (Seapoint Sen-sors) affixed to the above mooring at 29 m. Fluores-cence could not be accurately estimated due to thelack of fluorometer calibration coefficients for most
of the year. Therefore, raw voltage outputs of thefluoro meter were presented as normalized valuesbetween 0 and 1 after removing some extremereadings (sensor noise). This provided an approxi-mate variation of the fluorescence during the study,because according to the calibration equation (Sea-point Sensors; data not shown), fluorescence is esti-mated as a linear function of the voltage outputs.
Raw voltage outputs (Oi) of the irradiance sensorwere converted to PAR by applying a wet calibrationfactor (C = 5.05 × 10¹²), and a dark voltage of 0.0130 V(Biospherical Instruments) as:
PAR = C (10Oi – 100.0130) (1)
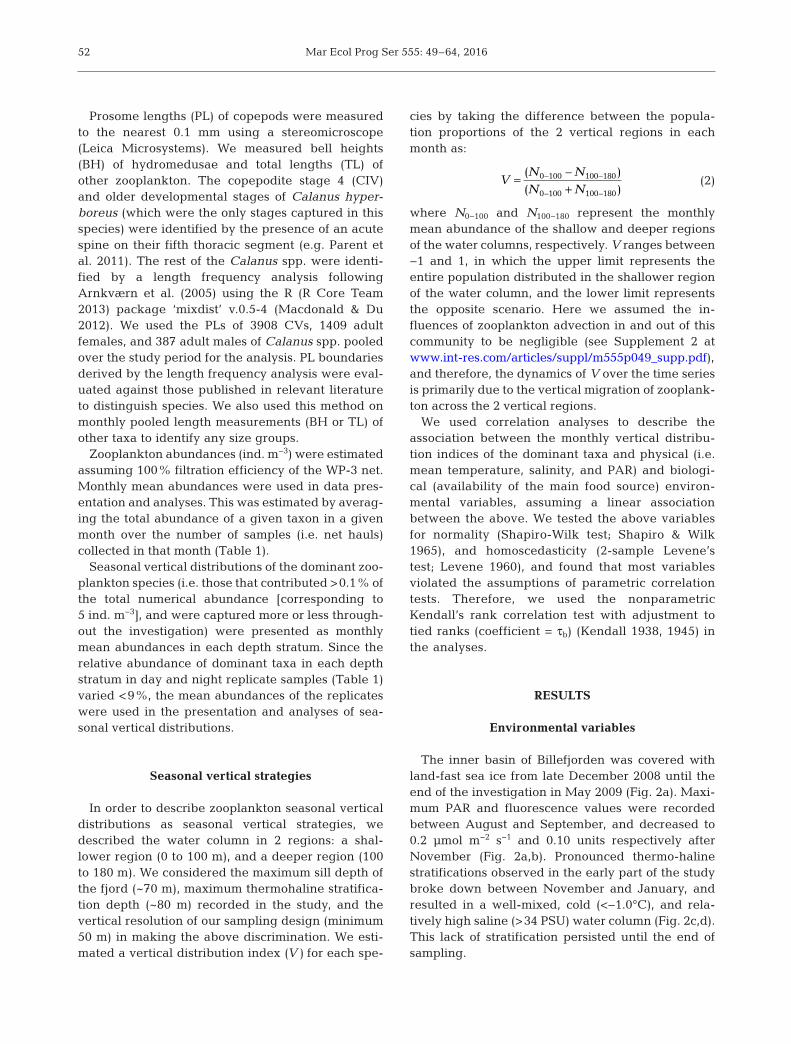
Temperature and salinity measurements werevisualized using the Spatial Analyst™ extension ofArcGIS™ version 9.3 (ESRI). Here, the data wereinterpolated temporally over the depth range usingthe natural neighbor method (Sibson 1981). Fluores-cence and PAR data are presented as daily means.Sea ice charts developed by the Ice Information Por-tal of the Norwegian Metrological Institute (http://polarview.met.no/) were used to describe the sea iceextent in Billefjorden during the study period.
Zooplankton
Zooplankton were sampled by vertical hauls usinga WP-3 net (area of the opening: 1 m2; mesh size:1 mm) fitted with a Nansen-type messenger-operatedclosing device. Samples were taken from the vessel,or with a tetrapod-mounted cable towed by a snow-mobile at ca. 1 m s−1 when sampling from sea ice.Three depth strata were sampled (0–50, 50–100, and100–180 m), excluding the bottommost 10 m. Larger(>10 mm) gelatinous zooplankton that could dissolveupon formaldehyde preservation were identified,and their body lengths were measured immediatelyafter collection. The rest of the samples were pre-served in a borax-buffered 4% formaldehyde-in-sea-water solution.
In the laboratory, the larger specimens werecounted from the entire samples. The smaller andmore numerous individuals (predominantly cope-pods) were counted in subsamples obtained using abox splitter (Motoda 1985) until a minimum of 100individuals were counted per sample. On average,~24% (range: 0.15 to 100%) of the total sample vol-ume was used. Zooplankton were identified to thelowest possible taxonomic level, and classified intotrophic groups according to the literature (seeTable 2).
51
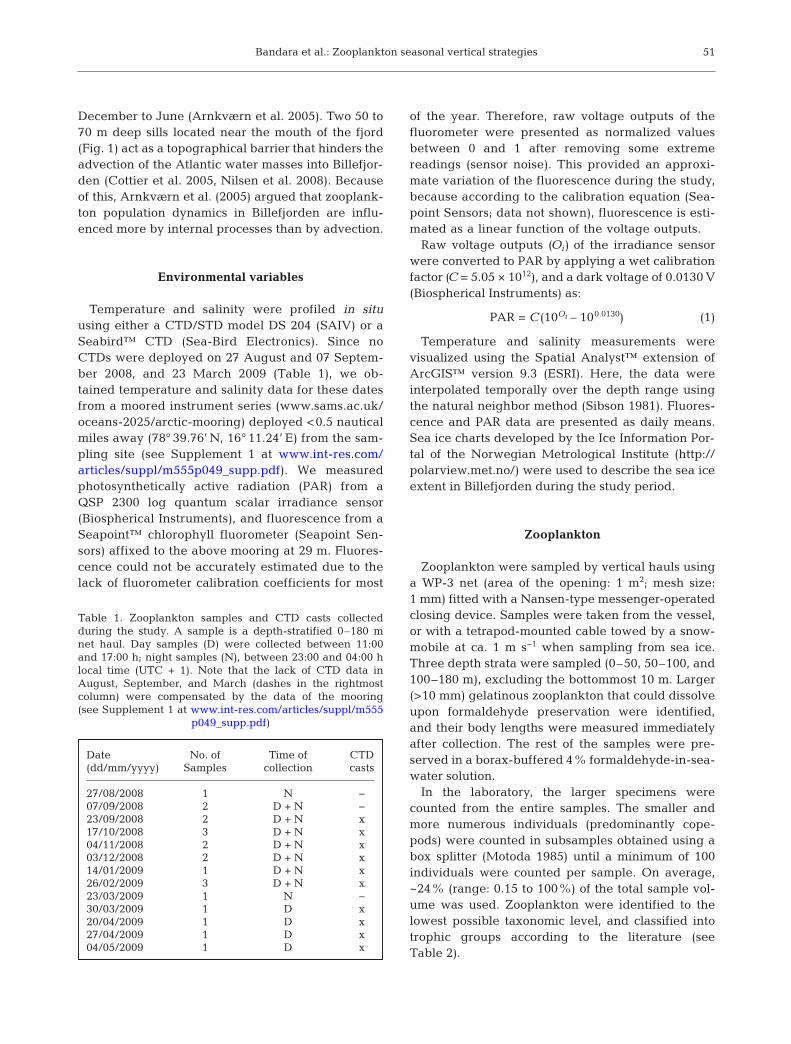
Date No. of Time of CTD (dd/mm/yyyy) Samples collection casts
27/08/2008 1 N −07/09/2008 2 D + N −23/09/2008 2 D + N x17/10/2008 3 D + N x04/11/2008 2 D + N x03/12/2008 2 D + N x14/01/2009 1 D + N x26/02/2009 3 D + N x23/03/2009 1 N −30/03/2009 1 D x20/04/2009 1 D x27/04/2009 1 D x04/05/2009 1 D x
Table 1. Zooplankton samples and CTD casts collected during the study. A sample is a depth-stratified 0–180 mnet haul. Day samples (D) were collected between 11:00and 17:00 h; night samples (N), between 23:00 and 04:00 hlocal time (UTC + 1). Note that the lack of CTD data in August, September, and March (dashes in the rightmost column) were compensated by the data of the mooring(see Supplement 1 at www. int-res. com/ articles/ suppl/ m555
p049 _ supp. pdf)
Mar Ecol Prog Ser 555: 49–64, 2016
Prosome lengths (PL) of copepods were measuredto the nearest 0.1 mm using a stereomicroscope(Leica Microsystems). We measured bell heights(BH) of hydromedusae and total lengths (TL) ofother zooplankton. The copepodite stage 4 (CIV)and older developmental stages of Calanus hyper-boreus (which were the only stages captured in thisspecies) were identified by the presence of an acutespine on their fifth thoracic segment (e.g. Parent etal. 2011). The rest of the Calanus spp. were identi-fied by a length frequency analysis followingArnkværn et al. (2005) using the R (R Core Team2013) package ‘mixdist’ v.0.5-4 (Macdonald & Du2012). We used the PLs of 3908 CVs, 1409 adultfemales, and 387 adult males of Calanus spp. pooledover the study period for the analysis. PL boundariesderived by the length frequency analysis were eval-uated against those published in relevant literatureto distinguish species. We also used this method onmonthly pooled length measurements (BH or TL) ofother taxa to identify any size groups.
Zooplankton abundances (ind. m−3) were estimatedassuming 100% filtration efficiency of the WP-3 net.Monthly mean abundances were used in data pres-entation and analyses. This was estimated by averag-ing the total abundance of a given taxon in a givenmonth over the number of samples (i.e. net hauls)collected in that month (Table 1).
Seasonal vertical distributions of the dominant zoo-plankton species (i.e. those that contributed >0.1% ofthe total numerical abundance [corresponding to5 ind. m−3], and were captured more or less through-out the investigation) were presented as monthlymean abundances in each depth stratum. Since therelative abundance of dominant taxa in each depthstratum in day and night replicate samples (Table 1)varied <9%, the mean abundances of the replicateswere used in the presentation and analyses of sea-sonal vertical distributions.
Seasonal vertical strategies
In order to describe zooplankton seasonal verticaldistributions as seasonal vertical strategies, wedescribed the water column in 2 regions: a shal-lower region (0 to 100 m), and a deeper region (100to 180 m). We considered the maximum sill depth ofthe fjord (~70 m), maximum thermohaline stratifica-tion depth (~80 m) recorded in the study, and thevertical resolution of our sampling design (minimum50 m) in making the above discrimination. We esti-mated a vertical distribution index (V) for each spe-
cies by taking the difference between the popula-tion proportions of the 2 vertical regions in eachmonth as:
(2)
where N0−100 and N100−180 represent the monthlymean abundance of the shallow and deeper regionsof the water columns, respectively. V ranges between−1 and 1, in which the upper limit represents theentire population distributed in the shallower regionof the water column, and the lower limit representsthe opposite scenario. Here we assumed the in -fluences of zooplankton advection in and out of thiscommunity to be negligible (see Supplement 2 atwww. int-res. com/ articles/suppl/m555 p049_ supp. pdf),and therefore, the dynamics of V over the time seriesis primarily due to the vertical migration of zooplank-ton across the 2 vertical regions.
We used correlation analyses to describe theassociation between the monthly vertical distribu-tion indices of the dominant taxa and physical (i.e.mean temperature, salinity, and PAR) and biologi-cal (availability of the main food source) environ-mental variables, assuming a linear associationbetween the above. We tested the above variablesfor normality (Shapiro-Wilk test; Shapiro & Wilk1965), and homo scedasticity (2-sample Levene’stest; Levene 1960), and found that most variablesviolated the assumptions of parametric correlationtests. Therefore, we used the nonparametricKendall’s rank correlation test with adjustment totied ranks (coefficient = τb) (Kendall 1938, 1945) inthe analyses.
RESULTS
Environmental variables
The inner basin of Billefjorden was covered withland-fast sea ice from late December 2008 until theend of the investigation in May 2009 (Fig. 2a). Maxi-mum PAR and fluorescence values were recordedbetween August and September, and decreased to0.2 µmol m−2 s−1 and 0.10 units respectively afterNovember (Fig. 2a,b). Pronounced thermo-halinestratifications observed in the early part of the studybroke down between November and January, andresulted in a well-mixed, cold (<−1.0°C), and rela-tively high saline (>34 PSU) water column (Fig. 2c,d).This lack of stratification persisted until the end ofsampling.
VN NN N
=+
( – )( )
– –
– –
0 100 100 180
0 100 100 180
52
Bandara et al.: Zooplankton seasonal vertical strategies
Zooplankton community composition and trophic relationships
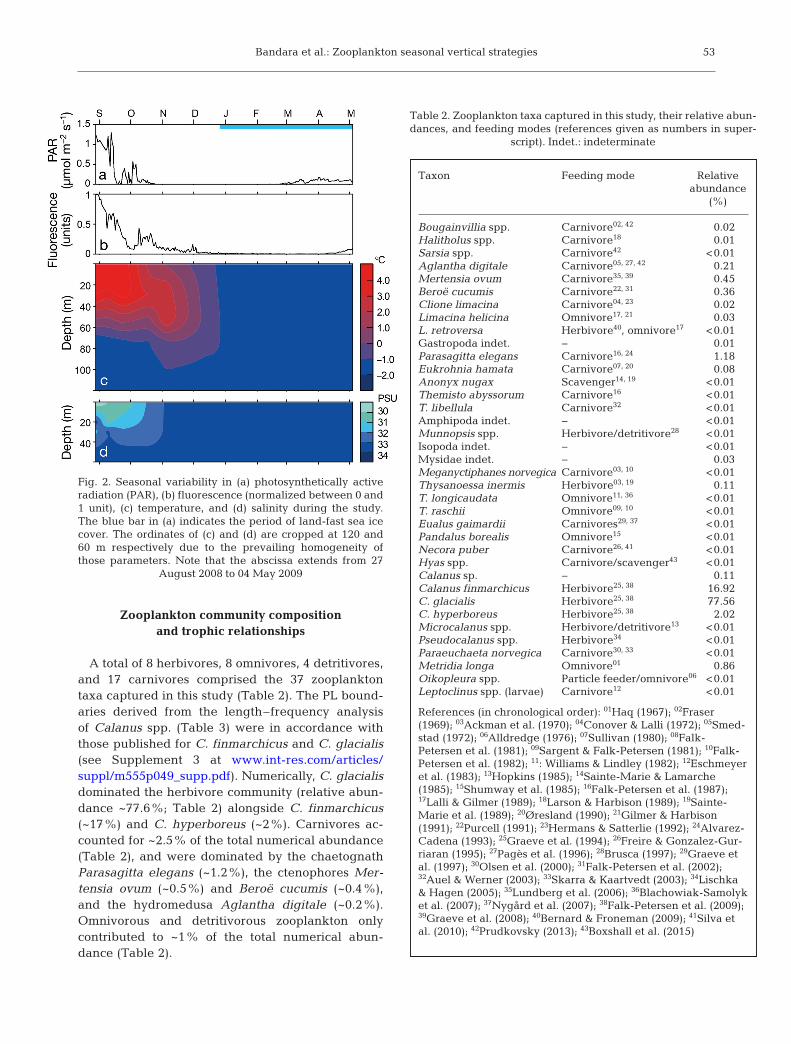
A total of 8 herbivores, 8 omnivores, 4 detritivores,and 17 carnivores comprised the 37 zooplanktontaxa captured in this study (Table 2). The PL bound-aries derived from the length–frequency analysisof Cala nus spp. (Table 3) were in accordance withthose published for C. finmarchicus and C. glacialis(see Supplement 3 at www.int-res.com/ articles/suppl/ m555 p049_supp.pdf). Numerically, C. glacialisdominated the herbivore community (relative abun-dance ~77.6%; Table 2) alongside C. finmarchicus(~17%) and C. hyperboreus (~2%). Carnivores ac -counted for ~2.5% of the total numerical abundance(Table 2), and were dominated by the chaetognathParasagitta elegans (~1.2%), the cteno phores Mer -tensia ovum (~0.5%) and Beroë cucumis (~0.4%),and the hydro medusa Aglantha digitale (~0.2%).Omnivorous and detritivorous zooplankton onlycontributed to ~1% of the total numerical abun-dance (Table 2).
53
Fig. 2. Seasonal variability in (a) photosynthetically activeradiation (PAR), (b) fluorescence (normalized between 0 and1 unit), (c) temperature, and (d) salinity during the study.The blue bar in (a) indicates the period of land-fast sea icecover. The ordinates of (c) and (d) are cropped at 120 and60 m respectively due to the prevailing homogeneity ofthose parameters. Note that the abscissa extends from 27
August 2008 to 04 May 2009
Taxon Feeding mode Relative abundance (%)
Bougainvillia spp. Carnivore02, 42 0.02Halitholus spp. Carnivore18 0.01Sarsia spp. Carnivore42 <0.01Aglantha digitale Carnivore05, 27, 42 0.21Mertensia ovum Carnivore35, 39 0.45Beroë cucumis Carnivore22, 31 0.36Clione limacina Carnivore04, 23 0.02Limacina helicina Omnivore17, 21 0.03L. retroversa Herbivore40, omnivore17 <0.01Gastropoda indet. − 0.01Parasagitta elegans Carnivore16, 24 1.18Eukrohnia hamata Carnivore07, 20 0.08Anonyx nugax Scavenger14, 19 <0.01Themisto abyssorum Carnivore16 <0.01T. libellula Carnivore32 <0.01Amphipoda indet. − <0.01Munnopsis spp. Herbivore/detritivore28 <0.01Isopoda indet. − <0.01Mysidae indet. − 0.03Meganyctiphanes norvegica Carnivore03, 10 <0.01Thysanoessa inermis Herbivore03, 19 0.11T. longicaudata Omnivore11, 36 <0.01T. raschii Omnivore09, 10 <0.01Eualus gaimardii Carnivores29, 37 <0.01Pandalus borealis Omnivore15 <0.01Necora puber Carnivore26, 41 <0.01Hyas spp. Carnivore/scavenger43 <0.01Calanus sp. − 0.11Calanus finmarchicus Herbivore25, 38 16.92C. glacialis Herbivore25, 38 77.56C. hyperboreus Herbivore25, 38 2.02Microcalanus spp. Herbivore/detritivore13 <0.01Pseudocalanus spp. Herbivore34 <0.01Paraeuchaeta norvegica Carnivore30, 33 <0.01Metridia longa Omnivore01 0.86Oikopleura spp. Particle feeder/omnivore06 <0.01Leptoclinus spp. (larvae) Carnivore12 <0.01
References (in chronological order): 01Haq (1967); 02Fraser(1969); 03Ackman et al. (1970); 04Conover & Lalli (1972); 05Smed-stad (1972); 06Alldredge (1976); 07Sullivan (1980); 08Falk-Petersen et al. (1981); 09Sargent & Falk-Petersen (1981); 10Falk-Petersen et al. (1982); 11: Williams & Lindley (1982); 12Esch meyeret al. (1983); 13Hopkins (1985); 14Sainte-Marie & Lamarche(1985); 15Shumway et al. (1985); 16Falk-Petersen et al. (1987);17Lalli & Gilmer (1989); 18Larson & Harbison (1989); 19Sainte-Marie et al. (1989); 20Øresland (1990); 21Gilmer & Harbison(1991); 22Purcell (1991); 23Hermans & Satterlie (1992); 24Alvarez-Cadena (1993); 25Graeve et al. (1994); 26Freire & Gonzalez-Gur-riaran (1995); 27Pagès et al. (1996); 28Brusca (1997); 29Graeve etal. (1997); 30Olsen et al. (2000); 31Falk-Petersen et al. (2002);32Auel & Werner (2003); 33Skarra & Kaartvedt (2003); 34Lischka& Hagen (2005); 35Lundberg et al. (2006); 36Blachowiak-Samolyket al. (2007); 37Nygård et al. (2007); 38Falk-Petersen et al. (2009);39Graeve et al. (2008); 40Bernard & Froneman (2009); 41Silva etal. (2010); 42Prudkovsky (2013); 43Boxshall et al. (2015)
Table 2. Zooplankton taxa captured in this study, their relative abun-dances, and feeding modes (references given as numbers in super-
script). Indet.: indeterminate
Mar Ecol Prog Ser 555: 49–64, 2016
Based on the literature, we considered fluores-cence as an indicator of the primary food source forherbivorous zooplankton, and identified Calanusspp. as the main prey of the secondary consumers A.digitale, M. ovum, and P. elegans, and M. ovum asthat of the tertiary consumer B. cucumis (see refer-ences in Table 2).
Seasonal variability in abundance of the dominantzooplankton
Herbivores
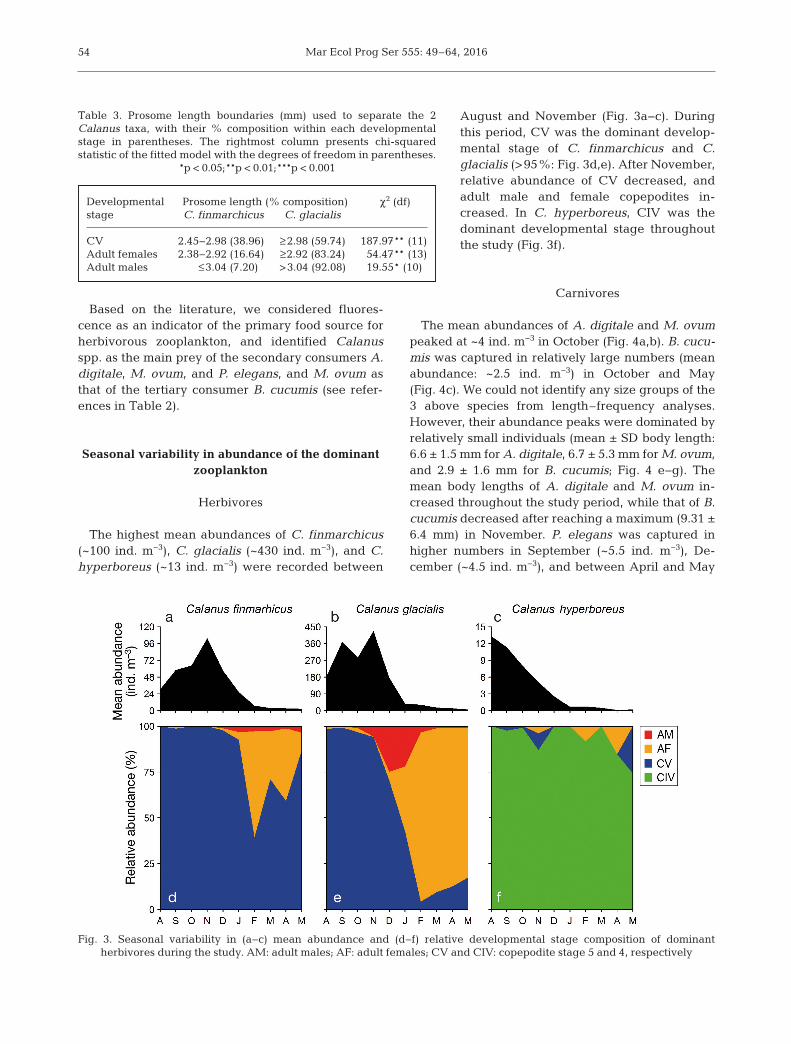
The highest mean abundances of C. finmarchicus(~100 ind. m−3), C. glacialis (~430 ind. m−3), and C.hyperboreus (~13 ind. m−3) were recorded between
August and November (Fig. 3a−c). Duringthis pe riod, CV was the dominant develop-mental stage of C. finmarchicus and C.glacialis (>95%: Fig. 3d,e). After November,relative abundance of CV de creased, andadult male and female copepodites in -creased. In C. hyperboreus, CIV was thedominant developmental stage throughoutthe study (Fig. 3f).
Carnivores
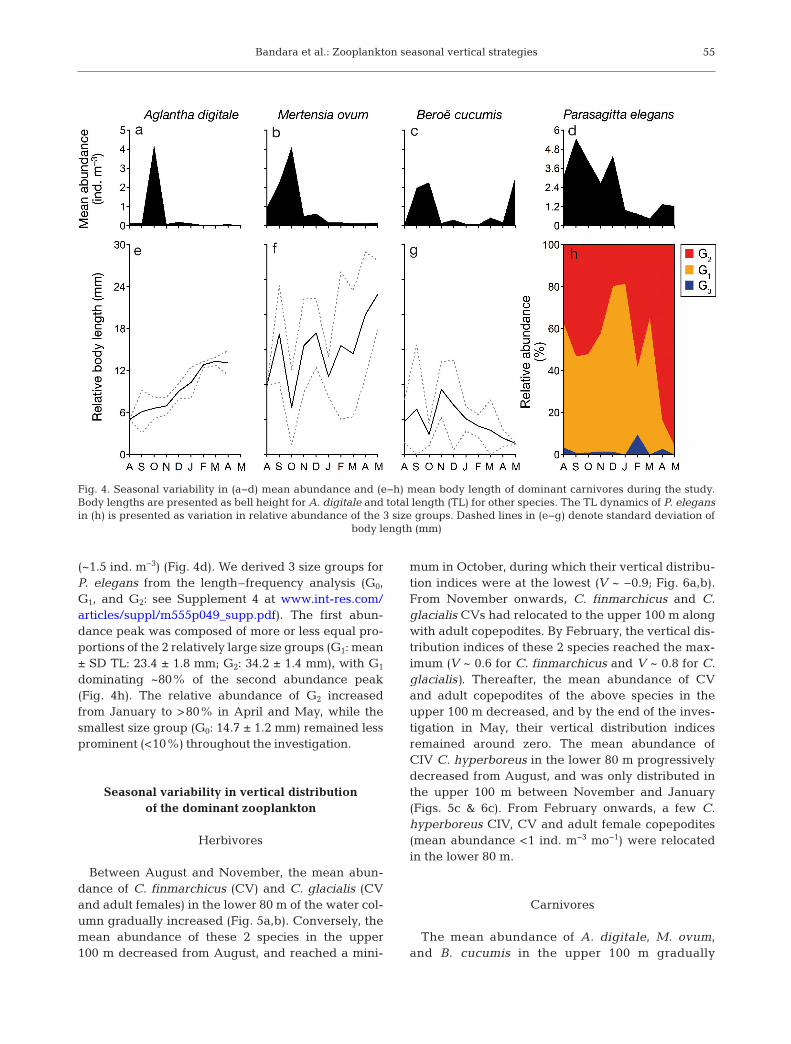
The mean abundances of A. digitale and M. ovumpeaked at ~4 ind. m−3 in October (Fig. 4a,b). B. cucu -mis was captured in relatively large numbers (meanabundance: ~2.5 ind. m−3) in October and May(Fig. 4c). We could not identify any size groups of the3 above species from length–frequency analyses.However, their abundance peaks were dominated byrelatively small individuals (mean ± SD body length:6.6 ± 1.5 mm for A. digitale, 6.7 ± 5.3 mm for M. ovum,and 2.9 ± 1.6 mm for B. cucumis; Fig. 4 e−g). Themean body lengths of A. digitale and M. ovum in-creased throughout the study period, while that of B.cucumis decreased after reaching a maximum (9.31 ±6.4 mm) in November. P. elegans was captured inhigher numbers in September (~5.5 ind. m−3), De -cember (~4.5 ind. m−3), and between April and May
54
Developmental Prosome length (% composition) χ2 (df)stage C. finmarchicus C. glacialis
CV 2.45−2.98 (38.96) ≥2.98 (59.74) 187.97** (11)Adult females 2.38−2.92 (16.64) ≥2.92 (83.24) 54.47** (13)Adult males ≤3.04 (7.20) >3.04 (92.08) 19.55* (10)
Table 3. Prosome length boundaries (mm) used to separate the 2Calanus taxa, with their % composition within each developmentalstage in parentheses. The rightmost column presents chi-squared statistic of the fitted model with the degrees of freedom in parentheses.
*p < 0.05;**p < 0.01;***p < 0.001
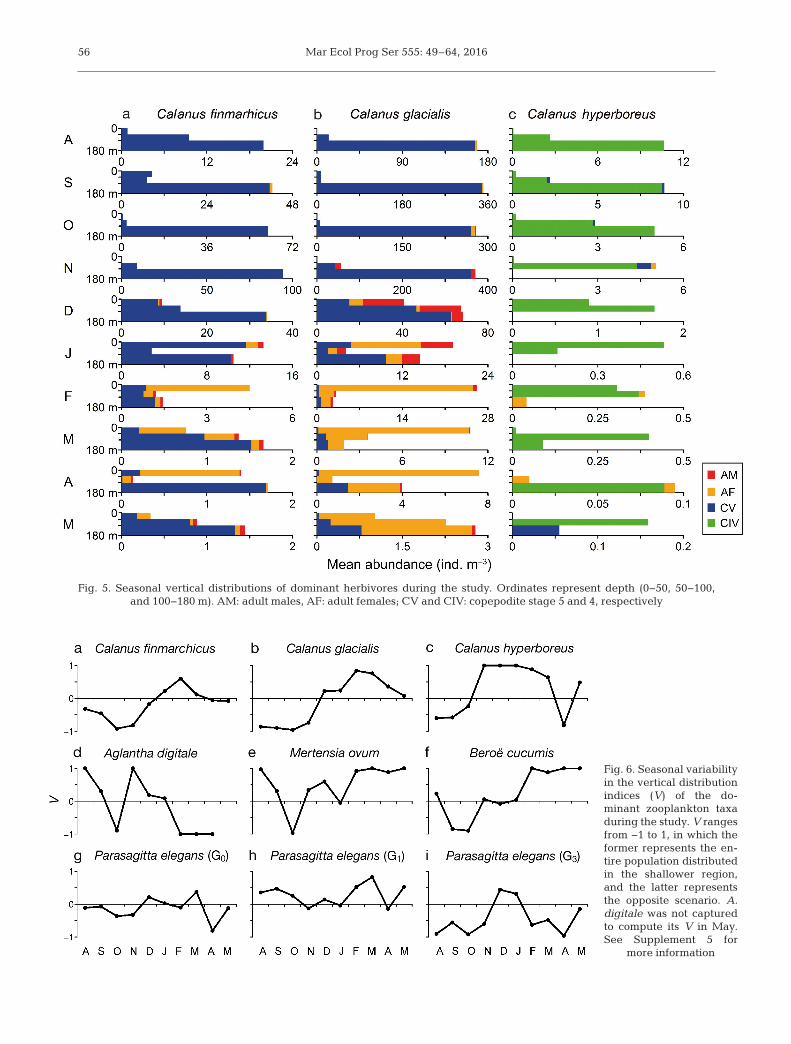
Fig. 3. Seasonal variability in (a−c) mean abundance and (d−f) relative developmental stage composition of dominantherbivores during the study. AM: adult males; AF: adult females; CV and CIV: copepodite stage 5 and 4, respectively
Bandara et al.: Zooplankton seasonal vertical strategies
(~1.5 ind. m−3) (Fig. 4d). We derived 3 size groups forP. elegans from the length–frequency analysis (G0,G1, and G2: see Supplement 4 at www. int-res. com/articles/suppl/m555 p049_ supp. pdf). The first abun-dance peak was composed of more or less equal pro-portions of the 2 relatively large size groups (G1: mean± SD TL: 23.4 ± 1.8 mm; G2: 34.2 ± 1.4 mm), with G1
dominating ~80% of the second abundance peak(Fig. 4h). The relative abundance of G2 increasedfrom January to >80% in April and May, while thesmallest size group (G0: 14.7 ± 1.2 mm) remained lessprominent (<10%) throughout the investigation.
Seasonal variability in vertical distribution of the dominant zooplankton
Herbivores
Between August and November, the mean abun-dance of C. finmarchicus (CV) and C. glacialis (CVand adult females) in the lower 80 m of the water col-umn gradually increased (Fig. 5a,b). Conversely, themean abundance of these 2 species in the upper100 m decreased from August, and reached a mini-
mum in October, during which their vertical distribu-tion indices were at the lowest (V ~ −0.9; Fig. 6a,b).From November onwards, C. finmarchicus and C.glacialis CVs had relocated to the upper 100 m alongwith adult copepodites. By February, the vertical dis-tribution indices of these 2 species reached the max-imum (V ~ 0.6 for C. finmarchicus and V ~ 0.8 for C.glacialis). Thereafter, the mean abundance of CVand adult copepodites of the above species in theupper 100 m decreased, and by the end of the inves-tigation in May, their vertical distribution indicesremained around zero. The mean abundance ofCIV C. hyperboreus in the lower 80 m progressivelydecreased from August, and was only distributed inthe upper 100 m between November and January(Figs. 5c & 6c). From February onwards, a few C.hyperboreus CIV, CV and adult female copepodites(mean abundance <1 ind. m−3 mo−1) were relocatedin the lower 80 m.
Carnivores
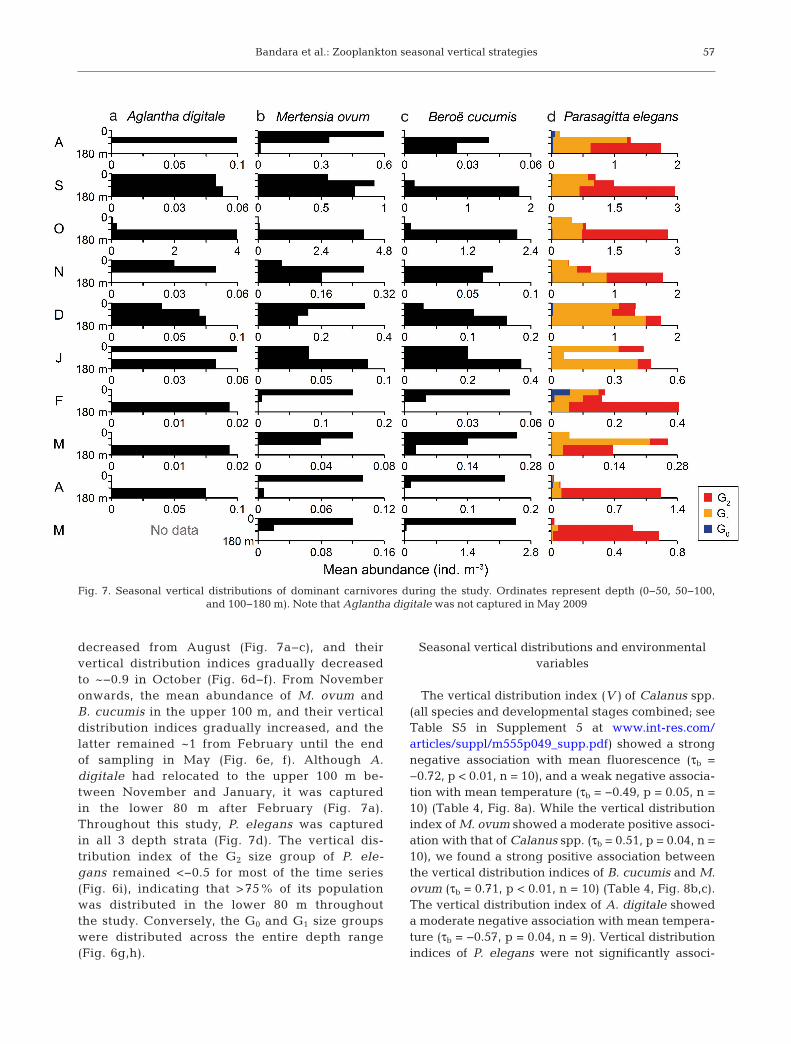
The mean abundance of A. digitale, M. ovum,and B. cucumis in the upper 100 m gradually
55
Fig. 4. Seasonal variability in (a−d) mean abundance and (e−h) mean body length of dominant carnivores during the study.Body lengths are presented as bell height for A. digitale and total length (TL) for other species. The TL dynamics of P. elegansin (h) is presented as variation in relative abundance of the 3 size groups. Dashed lines in (e−g) denote standard deviation of
body length (mm)
Mar Ecol Prog Ser 555: 49–64, 201656
Fig. 5. Seasonal vertical distributions of dominant herbivores during the study. Ordinates represent depth (0−50, 50−100, and 100−180 m). AM: adult males, AF: adult females; CV and CIV: copepodite stage 5 and 4, respectively
Fig. 6. Seasonal variabilityin the vertical distributionindices (V) of the do -minant zooplankton taxaduring the study. V rangesfrom −1 to 1, in which theformer represents the en-tire population distributedin the shallower region,and the latter representsthe opposite scenario. A.digitale was not capturedto compute its V in May.See Supplement 5 for
more information
Bandara et al.: Zooplankton seasonal vertical strategies
decreased from August (Fig. 7a−c), and their vertical distribution indices gradually decreasedto ~−0.9 in October (Fig. 6d−f). From Novemberonwards, the mean abundance of M. ovum andB. cucumis in the upper 100 m, and their verticaldistribution indices gradually increased, and thelatter remained ~1 from February until the endof sampling in May (Fig. 6e, f). Although A. digitale had relocated to the upper 100 m be -tween November and January, it was capturedin the lower 80 m after February (Fig. 7a).Throughout this study, P. elegans was capturedin all 3 depth strata (Fig. 7d). The vertical dis -tribution index of the G2 size group of P. ele-gans remained <−0.5 for most of the time series(Fig. 6i), indicating that >75% of its populationwas distributed in the lower 80 m throughoutthe study. Conversely, the G0 and G1 size groupswere distributed across the entire depth range(Fig. 6g,h).
Seasonal vertical distributions and environmentalvariables
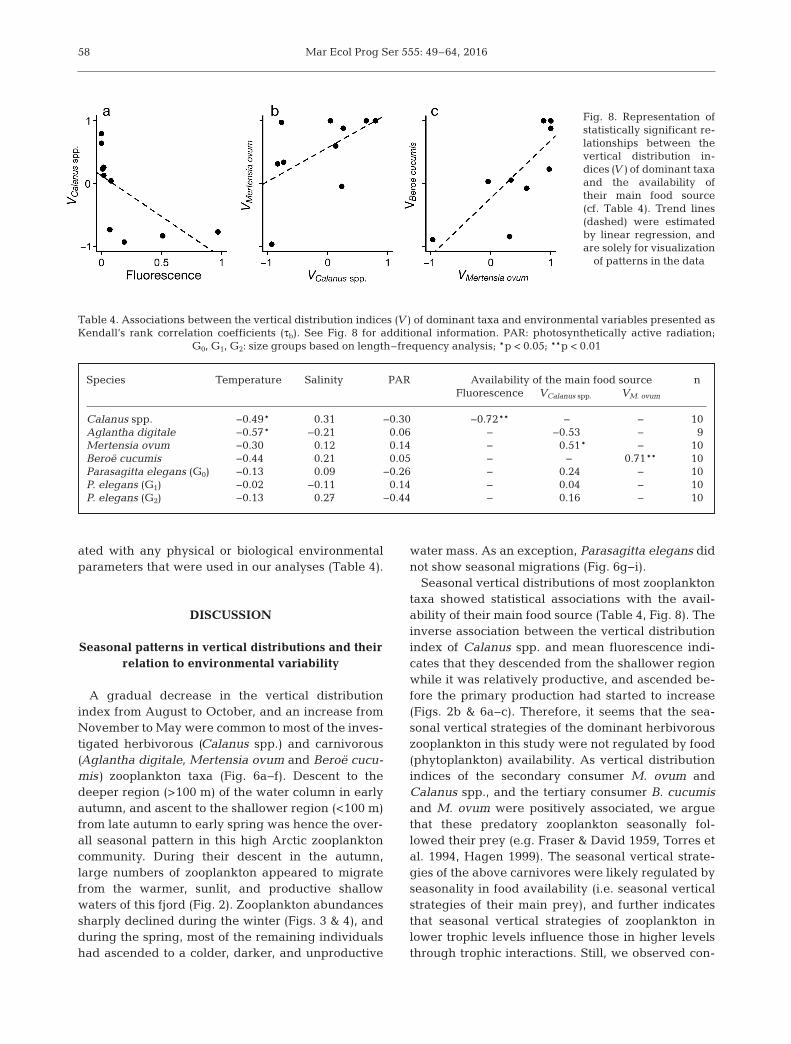
The vertical distribution index (V) of Calanus spp.(all species and developmental stages combined; seeTable S5 in Supplement 5 at www.int-res.com/articles/suppl/ m555 p049_supp.pdf) showed a strongnegative association with mean fluorescence (τb =−0.72, p < 0.01, n = 10), and a weak negative associa-tion with mean temp erature (τb = −0.49, p = 0.05, n =10) (Table 4, Fig. 8a). While the vertical distributionindex of M. ovum showed a moderate positive associ-ation with that of Calanus spp. (τb = 0.51, p = 0.04, n =10), we found a strong positive association betweenthe vertical distribution indices of B. cucumis and M.ovum (τb = 0.71, p < 0.01, n = 10) (Table 4, Fig. 8b,c).The vertical distribution index of A. digitale showeda moderate negative association with mean tempera-ture (τb = −0.57, p = 0.04, n = 9). Vertical distributionindices of P. elegans were not significantly associ-
57
Fig. 7. Seasonal vertical distributions of dominant carnivores during the study. Ordinates represent depth (0−50, 50−100, and 100−180 m). Note that Aglantha digitale was not captured in May 2009
Mar Ecol Prog Ser 555: 49–64, 2016
ated with any physical or biological environmentalparameters that were used in our analyses (Table 4).
DISCUSSION
Seasonal patterns in vertical distributions and theirrelation to environmental variability
A gradual decrease in the vertical distributionindex from August to October, and an increase fromNovember to May were common to most of the inves-tigated herbivorous (Calanus spp.) and carnivorous(Aglantha digitale, Mertensia ovum and Beroë cucu -mis) zooplankton taxa (Fig. 6a−f). Descent to thedeeper region (>100 m) of the water column in earlyautumn, and ascent to the shallower region (<100 m)from late autumn to early spring was hence the over-all seasonal pattern in this high Arctic zooplanktoncommunity. During their descent in the autumn,large numbers of zooplankton appeared to migratefrom the warmer, sunlit, and productive shallowwaters of this fjord (Fig. 2). Zooplankton abundancessharply declined during the winter (Figs. 3 & 4), andduring the spring, most of the remaining individualshad ascended to a colder, darker, and unproductive
water mass. As an exception, Parasagitta elegans didnot show seasonal migrations (Fig. 6g−i).
Seasonal vertical distributions of most zooplanktontaxa showed statistical associations with the avail-ability of their main food source (Table 4, Fig. 8). Theinverse association between the vertical distributionindex of Calanus spp. and mean fluorescence indi-cates that they descended from the shallower regionwhile it was relatively productive, and ascended be -fore the primary production had started to increase(Figs. 2b & 6a−c). Therefore, it seems that the sea-sonal vertical strategies of the dominant herbivorouszooplankton in this study were not regulated by food(phytoplankton) availability. As vertical distributionindices of the secondary consumer M. ovum andCalanus spp., and the tertiary consumer B. cucumisand M. ovum were positively associated, we arguethat these predatory zooplankton seasonally fol-lowed their prey (e.g. Fraser & David 1959, Torres etal. 1994, Hagen 1999). The seasonal vertical strate-gies of the above carnivores were likely regulated byseasonality in food availability (i.e. seasonal verticalstrategies of their main prey), and further indicatesthat seasonal vertical strategies of zooplankton inlower trophic levels influence those in higher levelsthrough trophic interactions. Still, we observed con-
58
Species Temperature Salinity PAR Availability of the main food source nFluorescence VCalanus spp. VM. ovum
Calanus spp. −0.49* 0.31 −0.30 −0.72** − − 10Aglantha digitale −0.57* −0.21 0.06 − −0.53 − 9Mertensia ovum −0.30 0.12 0.14 − 0.51* − 10Beroë cucumis −0.44 0.21 0.05 − − 0.71** 10Parasagitta elegans (G0) −0.13 0.09 −0.26 − 0.24 − 10P. elegans (G1) −0.02 −0.11 0.14 − 0.04 − 10P. elegans (G2) −0.13 0.27 −0.44 − 0.16 − 10
Table 4. Associations between the vertical distribution indices (V ) of dominant taxa and environmental variables presented asKendall’s rank correlation coefficients (τb). See Fig. 8 for additional information. PAR: photosynthetically active radiation;
G0, G1, G2: size groups based on length–frequency analysis; *p < 0.05; **p < 0.01
Fig. 8. Representation ofstatistically significant re-lationships between thevertical distribution in-dices (V) of dominant taxaand the availability oftheir main food source(cf. Table 4). Trend lines(dashed) were estimatedby linear regression, andare solely for visualization
of patterns in the data
Bandara et al.: Zooplankton seasonal vertical strategies
siderable variability, and a lack of seasonal migra-tions in P. elegans. Consequently, numerous otherfactors, such as the timing and trade-offs betweenfeeding and other life cycle events (Heath 1999,Varpe 2012), differences in prey selection (Greene1986), feeding on alternative food sources (Hirche &Kwasniewski 1997, Søreide et al. 2006, Casanova etal. 2012), and predation risk (Kaartvedt 1996, Dale etal. 1999, Varpe & Fiksen 2010) may also have con-tributed to the regulation of the observed seasonalvertical strategies.
Seasonal vertical strategies of the dominant zooplankton
Herbivores
The CVs of Calanus finmarchicus, CVs and adultfemales of C. glacialis, and CIVs of C. hyperboreuslikely resided in the deeper region until November(e.g. Conover 1988, Falk-Petersen et al. 2009, ourFig. 5). The gradually decreasing vertical distributionindices of C. finmarchicus and C. glacialis until Octo-ber (Fig. 6a,b), and simultaneous increase in theirmean abundances in the deeper region (Fig. 5a,b)indicate that a considerable fraction of the CVs ofthese 2 species descended and recruited to theirdeep water populations in the autumn. Conversely,the vertical distribution data of C. hyperboreus indi-cate neither a descent (which may have occurredprior to the commencement of sampling), nor recruit-ment to its deep water population (Figs. 5c & 6c). Inorder to build up energy reserves, a fraction of the C.finmarchicus and C. glacialis CVs may have grazedin the shallower region relatively late into the pro-ductive season prior to their descent (Fig. 2b). TheseCVs may have been the Calanus spp. reported byBerge et al. (2014) that contributed to the acousticbackscattering detected near a chlorophyll maxi-mum in this fjord in late September. Østvedt (1955),Pedersen et al. (1995) and Hirche (1996) also ob erveda part of the summer−autumn C. finmarchicus popu-lation feeding in surface waters, while the rest re -sided in deep waters.
The gradually increasing vertical distribution in -dices indicate an ascent of Calanus spp. betweenNovember and February (Fig. 6a−c). By February, amaximum of ~80% of the Calanus community hadascended to the shallower region (Fig. 5). Similar toour findings, Daase et al. (2014) and Blachowiak-Samolyk et al. (2015) reported shallow vertical distri-butions (<100 m) of Calanus spp. in January from
~81° N in Rijpfjorden, Svalbard. However, the timingof the ascent we report here is earlier than the Marchto June period reported in most high-latitude investi-gations (e.g. Heath 1999, Gislason & Astthorsson2000, Hirche & Kosobokova 2011, Melle et al. 2014).
As the vertical strategy of Calanus spp. was in -versely related to fluorescence, it is unlikely that foodavailability served as a primary cue for their descentand ascent. However, a definitive conclusion on thismatter cannot be made since vertical fluorescenceprofiles were not used in our study. We suggest thatthese herbivores, dominated by C. glacialis, ascen -ded early as a part of a capital breeding strategy or tofeed on ice algae, which were not detected by ourfluorescence measurements (e.g. Varpe et al. 2009,Søreide et al. 2010). Calanus spp. use ice algae as analternative food source to spawn prior to the phyto-plankton bloom (Runge & Ingram 1991, Hirche &Kwasniewski 1997, Søreide et al. 2010). A summer−autumn descent while there is still food availablenear the surface, and ascent to shallow waters duringthe dark, unproductive winter (Fig. 2a,b) suggest amigration driven by processes other than the avail-ability of food. The negative association between theCalanus vertical distribution index and mean tem-perature (Table 4) reflects the tendency of the sea-sonal descent and subsequent induction of diapausein C. glacialis to occur in relation to the summer−autumn warming of the surface waters (Niehoff &Hirche 2005, Pertsova & Kosobokova 2010). Theoverwintering depth and timing of the seasonalmigration of Calanus spp. can also be influenced byplanktivorous fish (Kaartvedt 1996, Dale et al. 1999,Kaartvedt 2000, Varpe & Fiksen 2010). Although wedid not sample fish populations in this investigation,trawl samples collected in Billefjorden in August2008 showed that ~60% of the stomach contents ofpolar cod Boreogadus saida consisted of Calanus spp.(Renaud et al. 2012). Therefore, the potential in -fluence of visual predation on the seasonal verticalstrategies of Calanus spp. in this fjord should not beruled out.
Carnivores
Vertical distribution data of A. digitale, M. ovum,and B. cucumis indicate that these carnivores des -cended to the deeper region between August andOctober (Fig. 6d−f). From November onwards, M.ovum and B. cucumis gradually ascended and re -mained in the shallower region from February to theend of this investigation in May. Unlike the 2 cteno -
59
Mar Ecol Prog Ser 555: 49–64, 2016
phore species, the ascent of A. digitale is not clearlyevident (Fig. 6d). It should be noted that the verticaldistribution data of this species after November maynot be accurate due to its low numerical abundance(Fig. 4a). Descent to deeper waters in autumn, andascent to shallower waters between spring and sum-mer has been reported for A. digitale, M. ovum, andB. cucumis from ~59° N in the Northeast Atlantic(Williams & Conway 1981), ~62.5° N in Frobisher Bay(Percy 1989), ~67° N in White Sea (Pertsova et al.2006), and ~74° N in Resolute Passage (Siferd &Conover 1992). In addition, shallow spring−summervertical distributions of M. ovum and B. cucumishave been reported from ~55.5° N in the Bornholmbasin of the Baltic Sea (Lehtiniemi et al. 2013),between 68 and 80° N in the Barents Sea and FramStrait, (Swanberg & Båmstedt 1991a), and between72 and 75° N in the western Arctic Ocean (Purcell etal. 2010).
Based on the positive association between the ver-tical distribution indices (Table 4, Fig. 8b), we arguethat M. ovum seasonally followed Calanus spp. M.ovum is a secondary consumer that feeds on Calanusspp., and specifically on their older developmentalstages (Greene 1986, Purcell 1991, Swanberg & Båm-stedt 1991b). In the winter, M. ovum feeds on over-wintering Calanus populations (Larson & Harbison1989, Siferd & Conover 1992) and accumulates lipids(Percy 1989, Lundberg et al. 2006). Therefore, theolder developmental stages (CIV, CV, and adultcopepodites) of Calanus spp. sampled in this studymay have served as a main prey source for M. ovum,and this predator−prey relationship is reflected bytheir similar vertical strategies. However, it should benoted that younger developmental stages of Calanusspp. which occupy shallower waters between Marchand May in this fjord (e.g. Arnkværn et al. 2005, Bai-ley 2010) may also have been a potential source ofprey for M. ovum. Although A. digitale is a secondaryconsumer that primarily feed on copepods (see refer-ences in Table 2), its vertical distribution was not sig-nificantly associated with that of Calanus spp.(Table 4). Despite the similarities in the verticalstrategies of A. digitale and M. ovum until October(Fig. 6d,e), the low numerical abundances of the for-mer may have inaccurately represented its verticaldistribution thereafter, and probably affected theresults of the correlation analyses.
The positively associated vertical distribution in -dices suggest that the predatory ctenophore B. cucu -mis seasonally followed M. ovum (Table 4, Fig. 8c). B.cucumis is a tertiary consumer that specifically feedson M. ovum (see references in Table 2). Therefore, it
is likely that the strong predator−prey relationshipbetween these 2 ctenophores were reflected in theirmarkedly similar vertical strategies (Fig. 6e,f). Simi-lar spatial associations between these 2 species havebeen reported from ~74° N in Resolute Passage(Siferd & Conover 1992), and between 75 and 79° Nin the Barents Sea (Swanberg & Båmstedt 1991a,Søreide et al. 2003). Although the mean TL of M.ovum became substantially larger than that of B.cucumis after November (Fig. 4f,g), it may not haveaffected their predator−prey relationship as Beroëcan feed on prey larger than itself (Tamm & Tamm1991), or on body parts of the prey (Swanberg 1974).
The accuracy of interpreting statistical associationsbetween predator and prey zooplankton, as theirtrophic relationships can be hampered by the coarsevertical resolution of our samples (e.g. Pearre 1979).It is possible for predator and prey zooplankton tocoexist in a depth stratum of 50 m (the vertical sam-pling resolution of this study) without encounteringeach other. As this bias tends to be pronounced inperiods with low predator and/or prey abundances(e.g. Greene 1986), we did not interpret the verticalstrategies of A. digitale (after November), or the G0
size group of P. elegans in detail (Fig. 4a,d,h). There-fore, further analyses (e.g. gut content analysesand dietary lipid analyses) would be required inorder to verify whe ther the associations betweenthe vertical strategies of predators and prey zoo-plankton observed in this study truly reflect theirtrophic interactions.
The 3 size groups of P. elegans did not show pro-nounced seasonal migrations (Fig. 6g−i) irrespectiveof the seasonal oscillations of the environmentalparameters observed in this study (Table 4). How-ever, the largest size group (G2) occupied the deeperregion for most of the study, while the smaller G0 andG1 size groups were distributed throughout the watercolumn. Deep water residence of larger individualsof P. elegans has been documented from 50° N at‘Ocean Station P’ (Sullivan 1980, Terazaki & Miller1986), ~75° N in Baffin Bay (Samemoto 1987), and~78° N from our study location in Billefjorden (Grigoret al. 2014). The vertical strategy of the smallest sizegroup (G0) may not be accurate because our samplesdid not capture sufficient numbers of those sizesGrigor et al. (2014) reported from this fjord (sampledby nets with finer mesh size and documented ascohort−0 of their study: cf. length data in Table S4 inSupplement 4).
As larger chaetognaths prefer larger prey, such asthe older development stages of Calanus (Greene1986, Falkenhaug 1991, Saito & Kiørboe 2001), it is
60
Bandara et al.: Zooplankton seasonal vertical strategies
likely that the G2 size group of P. elegans fed onCalanus copepodites occupying the deeper regionsof the water column. Despite the ascent of Calanusspp. between November and February, a fraction ofthe C. finmarchicus and C. glacialis population wasobserved in the deeper region throughout this study(Fig. 5a,b), and may have served as a year-roundprey source for the largest P. elegans size group. Insupport of this view, gut content and lipid analyses ofP. elegans collected from Billefjorden and other ad -jacent fjords by Grigor et al. (2015) suggests that P.elegans primarily feed on Calanus spp. It remainsunclear why the relatively small size fraction of P.elegans population remained in the shallower regionthroughout this investigation (Fig. 7d). One possibil-ity is that they may have preyed on smaller develop-mental stages of Calanus spp. and smaller copepodspecies, such as Oithona similis, Microcalanus spp.,Pseudocalanus spp., and Metridia longa (Falkenhaug1991, Walkusz et al. 2003, Grigor et al. 2015), preycategories which were undersampled by the largemesh width of the WP-3 net used in our investigation.
CONCLUSIONS
This study is one of few that have investigated sea-sonal vertical distributions of multiple members of azooplankton community in the Arctic over a near-annual, high-resolution time series. Our findingssuggest that seasonal vertical migrations are a wide-spread trait in the community, and that seasonality infood availability relates to seasonal vertical strategiesof zooplankton in different trophic levels. This rela-tionship was positive and strongest for the associa-tions between herbivores and secondary consumers,and between secondary consumers and tertiary con-sumers. Further year-round field investigations thatcan combine high-resolution sampling methods withhigh spatial resolution (e.g. Norrbin et al. 2009),information on individual variability in size andenergy reserves (e.g. Vogedes et al. 2010), accuratespecies determination (e.g. Parent et al. 2011,Gabrielsen et al. 2012), and year-round, mooring-based monitoring of the environment would be nec-essary to test the generality of our findings.
Acknowledgements. This work was carried out as part of theConocoPhillip-funded project Arctic Sea in Winter Time(ArcWin) and the Cleopatra I project (178766/S30) fundedby the Norwegian Research Council. The authors are thank-ful to the many students and staff at UNIS who helped dur-ing the fieldwork. Particular thanks to Allison Bailey for herconsiderable contribution in the field. The authors also
thank Dr. F. Cottier and C. Griffiths (Scottish Association ofMarine Science) for providing data from the joint SAMS-UNIS moored observatory in Billefjorden. Financial supportduring the period of data analyses was provided by VISTA,a basic research program in collaboration between The Norwegian Academy of Science and Letters, and Statoil™.The authors are also thankful to the 3 anonymous reviewersfor critically reading earlier drafts of the manuscript andsuggesting substantial improvements.
LITERATURE CITED
Ackman RG, Eaton CA, Sipos JC, Hooper SN, Castell JD(1970) Lipids and fatty acids of two species of NorthAtlantic krill (Meganyctiphanes norvegica and Thysano -ëssa inermis) and their role in the aquatic food web.J Fish Res Board Can 27: 513−533
Alldredge AL (1976) Field behavior and adaptive strategies ofappendicularians (Chordata: Tunicata). Mar Biol 38: 29−39
Alvarez-Cadena JN (1993) Feeding of the chaetognathSagitta elegans Verrill. Estuar Coast Shelf Sci 36: 195−206
Arnkværn G, Daase M, Eiane K (2005) Dynamics of co -existing Calanus finmarchicus, Calanus glacialis, andCalanus hyperboreus populations in a high-Arctic fjord.Polar Biol 28: 528−538
Auel H, Werner I (2003) Feeding, respiration and life historyof the hyperiid amphipod Themisto libellula in the Arcticmarginal ice zone of the Greenland Sea. J Exp Mar BiolEcol 296: 183−197
Bailey AM (2010) Lipids and diapause in Calanus spp. in ahigh-Arctic fjord: state-dependent strategies? Trackinglipids through the polar night. MSc thesis, University ofTromsø
Banse K (1964) On the vertical distribution of Zooplanktonin the sea. Prog Oceanogr 2: 53−125
Basedow SL, Tande KS, Stige LC (2010) Habitat selection bya marine copepod during the productive season in theSubarctic. Mar Ecol Prog Ser 416: 165−178
Berge J, Cottier FR, Varpe Ø, Renaud PE and others (2014)Arctic complexity: a case study on diel vertical migrationof zooplankton. J Plankton Res 36: 1279−1297
Bernard KS, Froneman PW (2009) The sub-Antarctic euthe-cosome pteropod, Limacina retroversa: distribution pat-terns and trophic role. Deep-Sea Res I 56: 582−598
Blachowiak-Samolyk K, Kwasniewski S, Dmoch K, Hop H,Falk-Petersen S (2007) Trophic structure of zooplanktonin the Fram Strait in spring and autumn 2003. Deep-SeaRes II 54: 2716−2728
Blachowiak-Samolyk K, Wiktor JM, Hegseth EN, Wold A,Falk-Petersen S, Kubiszyn AM (2015) Winter tales: thedark side of planktonic life. Polar Biol 38: 23−36
Boxshall GA, Mees J, Costello MJ, Hernandez F and others(2015) World register of marine species (WoRMS).www.marinespecies.org (accessed 11 Mar 2015)
Brusca R (1997) Isopoda. Version 06 August 1997. Tree ofLife web project. http: //tolweb.org/Isopoda (accessed 11Mar 2015)
Carlisle DB (1961) Diapause, neurosecretion and hormonesin Copepoda. Nature 190: 827−828
Casanova JP, Barthelemy R, Duvert M, Faure E (2012)Chaetognaths feed primarily on dissolved and fine particulate organic matter, not on prey: implications formarine food webs. Hypo Life Sci 2: 20−29
Clarke A, Peck LS (1991) The physiology of polar marinezooplankton. Polar Res 10: 355−370
Conover RJ (1988) Comparative life histories in the genera
61
Mar Ecol Prog Ser 555: 49–64, 2016
Calanus and Neocalanus in high latitudes of the north-ern hemisphere. Hydrobiologia 167: 127−142
Conover RJ, Huntley M (1991) Copepods in ice-coveredseas — distribution, adaptations to seasonally limitedfood, metabolism, growth patterns and life cycle strate-gies in polar seas. J Mar Syst 2: 1−41
Conover RJ, Lalli CM (1972) Feeding and growth in Clionelimacina (Phipps), a pteropod mollusc. J Exp Mar BiolEcol 9: 279−302
Cottier FR, Tverberg V, Inall M, Svendsen H, Nilsen F, Grif-fiths C (2005) Water mass modification in an Arctic fjordthrough cross-shelf exchange: the seasonal hydrographyof Kongsfjorden, Svalbard. J Geophys Res 110: C12005
Daase M, Varpe Ø, Falk-Petersen S (2014) Non-consump-tive mortality in copepods: occurrence of Calanus spp.carcasses in the Arctic Ocean during winter. J PlanktonRes 36: 129−144
Dale T, Bagøien E, Melle W, Kaartvedt S (1999) Can preda-tor avoidance explain varying overwintering depth ofCalanus in different oceanic water masses? Mar EcolProg Ser 179: 113−121
Eschmeyer WN, Herald ES, Hammann H (1983) A fieldguide to Pacific coast fishes of North America. HoughtonMifflin Company, Boston, MA
Falk-Petersen S, Gatten RR, Sargent JR, Hopkins CCE (1981)Ecological investigations on the zooplankton communityin Balsfjorden, northern Norway: seasonal changes in thelipid class composition of Meganycti phanes norvegica(M. Sars), Thysanoessa raschii (M. Sars), and T. inermis(Krøyer). J Exp Mar Biol Ecol 54: 209−224
Falk-Petersen S, Sargent JR, Hopkins CCE, Vaja B (1982)Ecological investigations on the zooplankton communityof Balsfjorden, northern Norway: lipids in the euphau -siids Thysanoessa raschi and T. inermis during spring.Mar Biol 68: 97−102
Falk-Petersen S, Sargent JR, Tande KS (1987) Lipid compo-sition of zooplankton in relation to the sub-Arctic foodweb. Polar Biol 8: 115−120
Falk-Petersen S, Dahl TM, Scott CL, Sargent JR and others(2002) Lipid biomarkers and trophic linkages betweenctenophores and copepods in Svalbard waters. Mar EcolProg Ser 227: 187−194
Falk-Petersen S, Mayzaud P, Kattner G, Sargent JR (2009)Lipids and life strategy of Arctic Calanus. Mar Biol Res 5: 18−39
Falkenhaug T (1991) Prey composition and feeding rate ofSagitta elegans var. arctica (Chaetognatha) in the Bar-ents Sea in early summer. Polar Res 10: 487−506
Fiksen Ø (2000) The adaptive timing of diapause − a searchfor evolutionarily robust strategies in Calanus finmarchi-cus. ICES J Mar Sci 57: 1825−1833
Fraser J (1969) Experimental feeding of some medusae andChaetognatha. J Fish Res Board Can 26: 1743−1762
Fraser J, David PM (1959) The distribution of the Chaetog-natha of the Southern Ocean. Discov Rep 29: 200−229
Freire J, Gonzalez-Gurriaran E (1995) Feeding ecology ofthe velvet swimming crab Necora puber in mussel raftareas of the Ría de Arousa (Galicia, NW Spain). Mar EcolProg Ser 119: 139−154
Gabrielsen TM, Merkel B, Søreide JE, Johansson-Karlssonand others (2012) Potential misidentifications of two cli-mate indicator species of the marine arctic ecosystem: Calanus glacialis and C. finmarchicus. Polar Biol 35: 1621−1628
Gilmer RW, Harbison GR (1991) Diet of Limacina helicina(Gastropoda: Thecosomata) in Arctic waters in mid -summer. Mar Ecol Prog Ser 77: 125−134
Gislason A, Astthorsson OS (2000) Winter distribution, onto-genetic migration, and rates of egg production ofCalanus finmarchicus southwest of Iceland. ICES J MarSci 57: 1727−1739
Graeve M, Kattner G, Hagen W (1994) Diet-inducedchanges in the fatty acid composition of Arctic herbivo-rous copepods: experimental evidence of trophic mark-ers. J Exp Mar Biol Ecol 182: 97−110
Graeve M, Kattner G, Piepenburg D (1997) Lipids in Arcticbenthos: Does the fatty acid and alcohol composition re-flect feeding and trophic interactions? Polar Biol 18: 53−61
Graeve M, Lundberg M, Böer M, Kattner G, Hop H, Falk-Petersen S (2008) The fate of dietary lipids in the Arcticctenophore Mertensia ovum (Fabricius 1780). Mar Biol153: 643−651
Greene CH (1986) Patterns of prey selection: implications ofpredator foraging tactics. Am Nat 128: 824−839
Grigor JJ, Søreide JE, Varpe Ø (2014) Seasonal ecology andlife-history strategy of the high-latitude predatory zoo-plankter Parasagitta elegans. Mar Ecol Prog Ser 499: 77−88
Grigor JJ, Marais AE, Falk-Petersen S, Varpe Ø (2015) Polarnight ecology of a pelagic predator, the chaetognathParasagitta elegans. Polar Biol 38: 87−98
Hagen W (1999) Reproductive strategies and energeticadaptations of polar zooplankton. Invertebr Reprod Dev36: 25−34
Haq SM (1967) Nutritional physiology of Metridia lucensand M. longa from the Gulf of Maine. Limnol Oceanogr12: 40−51
Heath MR (1999) The ascent migration of Calanus fin-marchicus from overwintering depths in the Faroe−Shet-land Channel. Fish Oceanogr 8: 84−99
Herman AW (1983) Vertical distribution patterns of cope-pods, chlorophyll, and production in northeastern BaffinBay. Limnol Oceanogr 28: 709−719
Hermans CO, Satterlie RA (1992) Fast-strike feeding behav-ior in a pteropod mollusk, Clione limacina Phipps. BiolBull (Woods Hole) 182: 1−7
Hirche HJ (1991) Distribution of dominant calanoid copepodspecies in the Greenland Sea during late fall. Polar Biol11: 351−362
Hirche HJ (1996) Diapause in the marine copepod, Calanusfinmarchicus — a review. Ophelia 44: 129−143
Hirche HJ, Kosobokova KN (2011) Winter studies on zoo-plankton in Arctic seas: the Storfjord (Svalbard) and ad -jacent ice-covered Barents Sea. Mar Biol 158: 2359−2376
Hirche HJ, Kwasniewski S (1997) Distribution, reproductionand development of Calanus species in the northeastwater in relation to environmental conditions. J Mar Syst10: 299−317
Hop H, Falk-Petersen S, Svendsen H, Kwasniewski S,Pavlov V, Pavlova O, Søreide JE (2006) Physical and bio-logical characteristics of the pelagic system across FramStrait to Kongsfjorden. Prog Oceanogr 71: 182−231
Hopkins TL (1985) Food web of an Antarctic midwater eco-system. Mar Biol 89: 197−212
Ji R, Edwards M, Mackas DL, Runge JA, Thomas AC (2010)Marine plankton phenology and life history in a chang-ing climate: current research and future directions.J Plankton Res 32: 1355−1368
Kaartvedt S (1996) Habitat preference during overwinteringand timing of seasonal vertical migration of Calanus fin-marchicus. Ophelia 44: 145−156
Kaartvedt S (2000) Life history of Calanus finmarchicus inthe Norwegian Sea in relation to planktivorous fish. ICESJ Mar Sci 57: 1819−1824
62
Bandara et al.: Zooplankton seasonal vertical strategies
Kendall MG (1938) A new measure of rank correlation. Biometrika 30: 81−93
Kendall MG (1945) The treatment of ties in ranking prob-lems. Biometrika 33: 239−251
Lalli CM, Gilmer RW (1989) Pelagic snails: the biology ofholoplanktonic gastropod mollusks. Stanford UniversityPress, Stanford, CA
Larson RJ, Harbison GR (1989) Source and fate of lipids inpolar gelatinous zooplankton. Arctic 42: 339−346
Lass S, Tarling GA, Virtue P, Matthews JBL, Mayzaud P,Buchholz F (2001) On the food of northern krill Mega -nyctiphanes norvegica in relation to its vertical distrib -ution. Mar Ecol Prog Ser 214: 177−200
Lee RF, Hagen W, Kattner G (2006) Lipid storage in marinezooplankton. Mar Ecol Prog Ser 307: 273−306
Lehtiniemi M, Gorokhova E, Bolte S, Haslob H and others(2013) Distribution and reproduction of the Arcticctenophore Mertensia ovum in the Baltic Sea. Mar EcolProg Ser 491: 111−124
Levene H (1960) Robust tests for equality. In: Olkin I,Ghurye SG, Hoeffding W, Madow WG, Mann HB (eds)Contributions to probability and statistics — essays inhonor of Harold Hotelling. Stanford University Press,Stanford, CA, p 278−292
Lischka S, Hagen W (2005) Life histories of the copepodsPseudocalanus minutus, P. acuspes (Calanoida) andOithona similis (Cyclopoida) in the Arctic Kongsfjorden(Svalbard). Polar Biol 28: 910−921
Lundberg M, Hop H, Eiane K, Gulliksen B, Falk-Petersen S(2006) Population structure and accumulation of lipidsin the ctenophore Mertensia ovum. Mar Biol 149: 1345−1353
Macdonald P, Du J (2012) mixdist: finite mixture distributionmodels. R package version 0.5-4. http: //CRAN.R- project.org/ package=mixdist
Melle W, Runge JA, Head EJH, Plourde S and others (2014)The North Atlantic Ocean as habitat for Calanus fin-marchicus: environmental factors and life history traits.Prog Oceanogr 129: 244−284
Miller CB, Cowles TJ, Wiebe PH, Copley NJ, Grigg H (1991)Phenology in Calanus finmarchicus; hypotheses aboutcontrol mechanisms. Mar Ecol Prog Ser 72: 79−91
Motoda S (1985) Devices of simple plankton apparatus VII.Bull Mar Sci 37: 776−777
Nelson DR, McKibben JN, Strong WR Jr, Lowe CG, SisnerosJA, Schroeder DM, Lavenberg RJ (1997) An acoustictracking of a megamouth shark, Megachasma pelagios: acrepuscular vertical migrator. Environ Biol Fishes 49: 389−399
Niehoff B, Hirche HJ (2005) Reproduction of Calanusglacialis in the Lurefjord (western Norway): indicationfor temperature-induced female dormancy. Mar EcolProg Ser 285: 107−115
Nilsen F, Cottier FR, Skogseth R, Mattsson S (2008) Fjord-shelf exchanges controlled by ice and brine production: the interannual variation of Atlantic Water in Isfjorden,Svalbard. Cont Shelf Res 28: 1838−1853
Norrbin F, Eilertsen HC, Degerlund M (2009) Vertical distri-bution of primary producers and zooplankton grazersduring different phases of the Arctic spring bloom. Deep-Sea Res II 56: 1945−1958
Nygård H, Berge J, Gulliksen B, Camus L (2007) The occur-rence of Eualus gaimardii gibba Krøyer 1841 (Crustacea,Decapoda) in the sympagic habitat: an example of bentho-sympagic coupling. Polar Biol 30: 1351−1354
Olsen EM, Jørstad T, Kaartvedt S (2000) The feeding strate-gies of two large marine copepods. J Plankton Res 22: 1513−1528
Øresland V (1990) Feeding and predation impact of thechaetognath Eukrohnia hamata in Gerlache Strait, Ant -arctic Peninsula. Mar Ecol Prog Ser 63: 201−209
Østvedt OJ (1955) Zooplankton investigations from weathership M in the Norwegian Sea, 1948-49. Hvalrad Skr 40: 1−93
Pagès F, González HE, González SR (1996) Diet of the gelat-inous zooplankton in Hardangerfjord (Norway) andpotential predatory impact by Aglantha digitale (Trachy -medusae). Mar Ecol Prog Ser 139: 69−77
Parent GJ, Plourde S, Turgeon J (2011) Overlapping sizeranges of Calanus spp. off the Canadian Arctic andAtlantic coasts: impact on species’ abundances. J Plank-ton Res 33: 1654−1665
Pearre S Jr (1979) Problems of detection and interpretationof vertical migration. J Plankton Res 1: 29−44
Pedersen G, Tande KS, Ottesen GO (1995) Why does a com-ponent of Calanus finmarchicus stay in the surfacewaters during the overwintering period in high latitudes?ICES J Mar Sci 52: 523−531
Percy JA (1989) Abundance, biomass, and size frequencydistribution of an Arctic ctenophore, Mertensia ovum(Fabricius) from Frobisher Bay, Canada. Sarsia 74: 95−105
Pertsova N, Kosobokova K (2010) Interannual and seasonalvariation of the population structure, abundance, andbiomass of the Arctic copepod Calanus glacialis in theWhite Sea. Oceanology (Mosc) 50: 531−541
Pertsova NM, Kosobokova KN, Prudkovsky AA (2006) Pop-ulation size structure, spatial distribution, and life cycleof the hydromedusa Aglantha digitale (OF Müller, 1766)in the White Sea. Oceanology (Mosc) 46: 228−237
Prudkovsky AA (2013) Trophic role of ambush-foraginghydromedusae in the White Sea. Mar Ecol (Berl) 34: 153−164
Purcell JE (1991) A review of cnidarians and ctenophoresfeeding on competitors in the plankton. In: Williams RB,Cornelius PFS, Hughes RG, Robson EA (eds) Coelenter-ate biology: recent research on Cnidaria and Cteno -phora. Springer, Dordrecht, p 335−342
Purcell JE, Hopcroft RR, Kosobokova KN, Whitledge TE(2010) Distribution, abundance, and predation effects ofepipelagic ctenophores and jellyfish in the western Arctic Ocean. Deep-Sea Res II 57: 127−135
R Core Team (2013) R: a language and environment for sta-tistical computing. R Foundation for Statistical Comput-ing, Vienna
Renaud PE, Berge J, Varpe Ø, Lønne OJ, Nahrgang J, Otte-sen C, Hallanger I (2012) Is the poleward expansion byAtlantic cod and haddock threatening native polar cod,Boreogadus saida? Polar Biol 35: 401−412
Runge JA, Ingram RG (1991) Under-ice feeding and dielmigration by the planktonic copepods Calanus glacialisand Pseudocalanus minutus in relation to the ice algalproduction cycle in southeastern Hudson Bay, Canada.Mar Biol 108: 217−225
Russell FS (1927) The vertical distribution of plankton in thesea. Biol Rev Camb Philos Soc 2: 213−262
Sainte-Marie B, Lamarche G (1985) The diets of six speciesof the carrion-feeding lysianassid amphipod genusAnonyx and their relation with morphology and swim-ming behaviour. Sarsia 70: 119−126
Sainte-Marie B, Percy JA, Shea JR (1989) A comparison ofmeal size and feeding rate of the lysianassid amphipodsAnonyx nugax, Onisimus (=Pseudalibrotus) litoralis andOrchomenella pinguis. Mar Biol 102: 361−368
Saito H, Kiørboe T (2001) Feeding rates in the chaetognathSagitta elegans: effects of prey size, prey swimming
63
Mar Ecol Prog Ser 555: 49–64, 2016
behaviour and small-scale turbulence. J Plankton Res 23: 1385−1398
Samemoto DD (1987) Vertical distribution and ecologicalsignificance of chaetognaths in the Arctic environment ofBaffin Bay. Polar Biol 7: 317−328
Sargent JR, Falk-Petersen S (1981) Ecological investigationson the zooplankton community in Balsfjorden, northernNorway: lipids and fatty acids in Meganyctiphanesnorvegica, Thysanoessa raschi and T. inermis duringmid-winter. Mar Biol 62: 131−137
Shapiro SS, Wilk MB (1965) An analysis of variance test fornormality (complete samples). Biometrika 52: 591−611
Shumway SE, Perkins HC, Schick DF, Stickney AP (1985)Synopsis of biological data on the pink shrimp, Pandalusborealis Kroyer, 1838. FAO Fisheries Synopsis No. 144.NOAA Tech Rep NMFS 30, US Department of Com-merce, Washington, DC
Sibson R (1981) A brief description of natural neighbourinterpolation. In: Barnett V (ed) Interpreting multivariatedata. John Wiley & Sons, New York, NY, p 21−36
Siferd TD, Conover RJ (1992) Natural history of ctenophoresin the Resolute Passage area of the Canadian High Arcticwith special reference to Mertensia ovum. Mar Ecol ProgSer 86: 133−144
Silva AC, Hawkins SJ, Clarke KR, Boaventura DM, Thomp-son RC (2010) Preferential feeding by the crab Necorapuber on differing sizes of the intertidal limpet Patellavulgata. Mar Ecol Prog Ser 416: 179−188
Sims DW, Southall EJ, Tarling GA, Metcalfe JD (2005) Habi-tat specific normal and reverse diel vertical migration inthe plankton feeding basking shark. J Anim Ecol 74: 755−761
Skarra H, Kaartvedt S (2003) Vertical distribution and feed-ing of the carnivorous copepod Paraeuchaeta norvegica.Mar Ecol Prog Ser 249: 215−222
Smedstad OM (1972) On the biology of Aglantha digitalerosea (Forbes) (Coelenterata: Trachymedusea) in theInner Oslofjord. Nor J Zool 20: 111−135
Sømme JD (1934) Animal plankton of the Norwegian coastwaters and the open sea. I. Production of Calanus fin-marchicus (Gunner) and Calanus hyperboreus (Krøyer)in the Lofoten Area. Fiskeridir Skr (Havunders) 4: 1−163
Søreide JE, Hop H, Falk-Petersen S, Gulliksen B, Hansen E(2003) Macrozooplankton communities and environmen-tal variables in the Barents Sea marginal ice zone in latewinter and spring. Mar Ecol Prog Ser 263: 43−64
Søreide JE, Hop H, Carroll ML, Falk-Petersen S, HegsethEN (2006) Seasonal food web structures and sympagic−pelagic coupling in the European Arctic revealed by sta-ble isotopes and a two-source food web model. ProgOceanogr 71: 59−87
Søreide JE, Falk-Petersen S, Hegseth EN, Hop H, CarrollML, Hobson KA, Blachowiak-Samolyk K (2008) Seasonalfeeding strategies of Calanus in the high-Arctic Svalbardregion. Deep-Sea Res II 55: 2225−2244
Søreide JE, Leu E, Berge J, Graeve M, Falk-Petersen S(2010) Timing of blooms, algal food quality and Calanusglacialis reproduction and growth in a changing Arctic.Glob Change Biol 16: 3154−3163
Sullivan BK (1980) In situ feeding behavior of Sagitta ele-gans and Eukrohnia hamata (Chaetognatha) in relationto the vertical distribution and abundance of prey atOcean Station ‘P’. Limnol Oceanogr 25: 317−326
Svendsen H, Beszczynska Møller A, Hagen JO, Lefaucon-nier B and others (2002) The physical environment ofKongsfjorden−Krossfjorden, an Arctic fjord system inSvalbard. Polar Res 21: 133−166
Swanberg N (1974) The feeding behavior of Beroe ovata.Mar Biol 24: 69−76
Swanberg N, Båmstedt U (1991a) Ctenophora in the Arctic: the abundance, distribution and predatory impact of thecydippid ctenophore Mertensia ovum (Fabricius) in theBarents Sea. Polar Res 10: 507−524
Swanberg N, Båmstedt U (1991b) The role of prey stratifica-tion in the predation pressure by the cydippid cteno -phore Mertensia ovum in the Barents Sea. Hydrobiologia216-217: 343−349
Tamm SL, Tamm S (1991) Reversible epithelial adhesioncloses the mouth of Beroë, a carnivorous marine jelly.Biol Bull (Woods Hole) 181: 463−473
Terazaki M, Miller CB (1986) Life history and vertical distri-bution of pelagic chaetognaths at Ocean Station P in thesubarctic Pacific. Deep-Sea Res A, Oceanogr Res Pap 33: 323−337
Torres JJ, Aarset A, Donnelly J, Hopkins TL, Lancraft T, Ain-ley D (1994) Metabolism of Antarctic micronektonicCrustacea as a function of depth of occurrence and sea-son. Mar Ecol Prog Ser 113: 207−219
Varpe Ø (2012) Fitness and phenology: annual routines andzooplankton adaptations to seasonal cycles. J PlanktonRes 34: 267−276
Varpe Ø, Fiksen Ø (2010) Seasonal plankton-fish inter -actions: light regime, prey phenology, and herring forag-ing. Ecology 91: 311−318
Varpe Ø, Jørgensen C, Tarling GA, Fiksen Ø (2007) Early isbetter: seasonal egg fitness and timing of reproduction ina zooplankton life history model. Oikos 116: 1331−1342
Varpe Ø, Jørgensen C, Tarling GA, Fiksen Ø (2009) Theadaptive value of energy storage and capital breeding inseasonal environments. Oikos 118: 363−370
Vestheim H, Kaartvedt S, Edvardsen B (2005) State-depen-dent vertical distribution of the carnivore copepodPareuchaeta norvegica. J Plankton Res 27: 19−26
Visser AW, Jónasdóttir SH (1999) Lipids, buoyancy and theseasonal vertical migration of Calanus finmarchicus. FishOceanogr 8: 100−106
Vogedes D, Varpe Ø, Søreide JE, Graeve M, Berge J, Falk-Petersen S (2010) Lipid sac area as a proxy for individuallipid content of Arctic calanoid copepods. J Plankton Res32: 1471−1477
Walkusz W, Storemark K, Skau T, Gannefors C, Lundberg M(2003) Zooplankton community structure; a comparisonof fjords, open water and ice stations in the Svalbardarea. Pol Polar Res 24: 149−165
Werner EE, Gilliam JF (1984) The ontogenetic niche andspecies interactions in size-structured populations. AnnuRev Ecol Syst 15: 393−425
Williams R, Conway DVP (1981) Vertical distribution andseasonal abundance of Aglantha digitale (OF Müller)(Coelenterata: Trachymedusae) and other planktoniccoelenterates in the northeast Atlantic Ocean. J PlanktonRes 3: 633−643
Williams R, Lindley JA (1982) Variability in abundance, ver-tical distribution and ontogenetic migrations of Thysa-noessa longicaudata (Crustacea: Euphausiacea) in thenorth-eastern Atlantic Ocean. Mar Biol 69: 321−330
64
Editorial responsibility: Anna Pasternak, Moscow, Russian Federation
Submitted: November 16, 2015; Accepted: July 7, 2016Proofs received from author(s): August 9, 2016
➤
➤
➤
➤
➤
➤
➤
➤
➤
➤
➤
➤
➤
➤
➤
➤
➤
➤
➤
➤
➤
➤
➤
➤
➤
➤
➤
➤