Embed Size (px)
Citation preview
i
Marine Biodiversity An economic valuation Building the evidence base for the Marine Bill July 2006
www.defra.gov.uk

Marine Biodiversity An economic valuation Nicola Beaumont, Michael Townsend, Stephen Mangi and Melanie C. Austen Plymouth Marine Laboratory, Prospect Place, The Hoe, Plymouth, PL1 3DH Disclaimer: The content of this report does not necessarily reflect the views of Defra, nor is Defra liable for the accuracy of information provided or responsible for any use of the reports content.
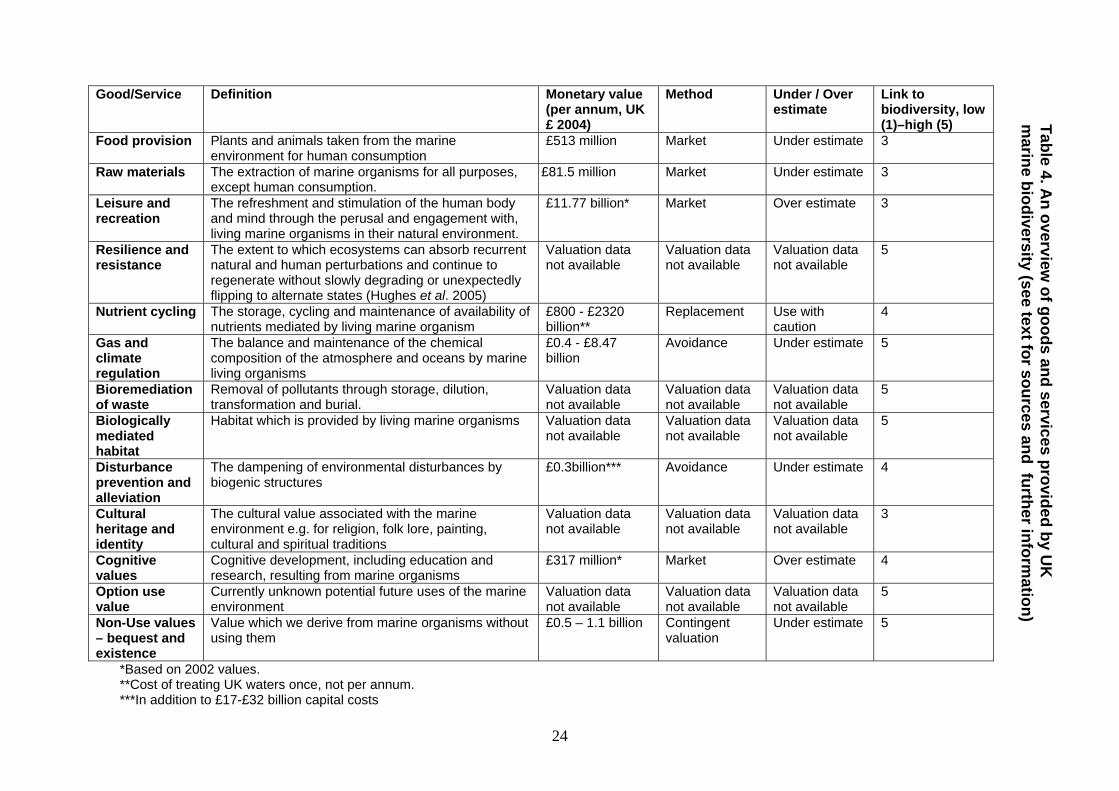
Executive Summary The UK Government has recently outlined its vision for ‘clean, healthy, safe, productive and biologically diverse oceans and seas’ and is currently considering a number of provisions to improve marine nature conservation as part of the proposed Marine Bill. In building the evidence base for the Marine Bill, Plymouth Marine Laboratory was commissioned by Defra to provide a valuation (based on best available information) of the goods and services resulting from marine biodiversity in UK waters, providing examples and monetary values where possible. The purpose of this work is to inform the need for further protection of marine biodiversity in UK waters. Marine biodiversity plays a fundamental role in supporting a wide range of goods and services essential for the maintenance of the social and economic wellbeing of our society. Goods and services are defined within this report as indirect or direct benefits to humans arising from the natural environment. Biodiversity is defined as richness and composition at species and functional type levels, that is groups of species that carry out the same ecological functions. The Total Economic Value (TEV) approach is used in this report. The application of this framework ensures all aspects of value associated with the goods and services of the environment are captured. This classification breaks the environment down into specific components but the inter-dependency of these components, and overall value of the environment should be remembered. Limitations to the application of monetary values to marine biodiversity are outlined and include existing shortfalls in data availability in the marine environment. Chapter three of this report lists the goods and services provided by marine biodiversity, detailing the habitats and species which provide them, the likely impact of a decrease in biodiversity, and where possible a monetary value. An overview of the goods and services provided by the UK marine environment, and the available monetary values associated with these goods and services is presented in Table 1. Where the value placed on the good or service is classified as an ‘underestimate’, this is in consequence to existing data limitations allowing only one component of the good or service to be considered. For example, in the case of the service, gas and climate regulation, only carbon is considered. The absence of an economic value does not infer that this good or service is without value, only that the information is not available. Valuing the environment in monetary terms is a well established but controversial approach and shortfalls are recognised. Despite the numerous and complex difficulties associated with monetary valuations the figures provided within this report are the best value estimates currently available. It should be stressed that the values presented are
ii
iii
indicative and should be treated as such. The strength of valuing marine biodiversity in monetary terms lies in its capacity to raise awareness of the importance of marine biodiversity. Two case studies are outlined which investigate specific habitats and detail the goods and services which they provide, and how the provision of these goods and services is influenced by biodiversity. The first case study focuses on trawling in the North Sea to investigate how biodiversity declines following an anthropogenic impact, and the implications of this on the provision of goods and services. The second case study examines the benefits arising from a high biodiverse environment, Skomer Island. The ability to provide an estimation of the total economic value of the UK’s marine biodiversity is limited by a lack of relevant natural science, social and economic data. Quantification of how values change with declining or improving biodiversity could also not be undertaken due to insufficient information on the link between biodiversity and ecosystem function. A ‘best estimate’ of the strength of the linkage between biodiversity and the good or service is provided to indicate how sensitive the good or service is to changes in biodiversity (refer to Table 1). The provision of all the goods and services presented within this report can be linked to marine biodiversity. From this analysis it was concluded that a decline in UK marine biodiversity will result in a varying, and at present unpredictable, change in the provision of goods and services. This change could result in severe impacts on society and the economy, including reduced resilience to change, declining marine health and water quality, reduced fisheries potential, loss of recreational opportunities, decreased employment, and reduced carbon uptake. Further research on the valuation of goods and services is recommended, particularly in areas which currently could not be valued, including resilience and resistance, bioremediation of waste, biologically mediated habitat and option use. Improved information linking biodiversity to the provision of goods and services, or ecosystem function, is also required to quantify how values change with declining or improving biodiversity. There is a severe deficiency of UK case studies, and further UK site-specific research is strongly recommended in the future. The proposed Marine Protected Areas provide an ideal opportunity for case studies to potentially demonstrate the value of increasing biodiversity, and as such these areas should be monitored before and after designation.

iv
*Based on 2002 values.
Good/Service Definition Monetary value(per annum, UK £ 2004)
Method Under / Over estimate
Link to biodiversity, low (1)–high (5)
Food provision Plants and animals taken from the marine environment for human consumption
£513 million Market Under estimate 3
Raw materials The extraction of marine organisms for all purposes, except human consumption
£81.5 million Market Under estimate 3
Leisure and recreation
The refreshment and stimulation of the human body and mind through the perusal and engagement with, living marine organisms in their natural environment
£11.77 billion* Market Over estimate 3
Resilience and resistance
The extent to which ecosystems can absorb recurrent natural and human perturbations and continue to regenerate without slowly degrading or unexpectedly flipping to alternate states (Hughes et al. 2005)
Valuation data not available
Valuation data not available
Valuation data not available
5
Nutrient cycling The storage, cycling and maintenance of availability of nutrients mediated by living marine organism
£800 - £2320 billion**
Replacement Use withcaution
4
Gas and climate regulation
The balance and maintenance of the chemical composition of the atmosphere and oceans by marine living organisms
£0.4 - £8.47 billion
Avoidance Under estimate 5
Bioremediation of waste
Removal of pollutants through storage, dilution, transformation and burial
Valuation data not available
Valuation data not available
Valuation data not available
5
Biologically mediated habitat
Habitat which is provided by living marine organisms Valuation data not available
Valuation data not available
Valuation data not available
5
Disturbance prevention and alleviation
The dampening of environmental disturbances by biogenic structures
£0.3billion*** Avoidance Under estimate 4
Cultural heritage and identity
The cultural value associated with the marine environment e.g. for religion, folk lore, painting, cultural and spiritual traditions
Valuation data not available
Valuation data not available
Valuation data not available
3
Cognitive values
Cognitive development, including education and research, resulting from marine organisms
£317 million* Market Over estimate 4
Option use value
Currently unknown potential future uses of the marine environment
Valuation data not available
Valuation data not available
Valuation data not available
5
Non-Use values – bequest and existence
Value which we derive from marine organisms without using them
£0.5 – 1.1 billion Contingent valuation
Under estimate 5
Table 1. An overview
of goods and services provided by UK
m
arine biodiversity (see text for sources and further information)
**Cost of treating UK waters once, not per annum. ***In addition to £17-£32 billion capital costs.
Contents Executive summary ii Chapter 1 - Introduction 1
1.1 Aims and objectives 1 1.2 Report structure 1
Chapter 2 - Adopted approach 3
2.1 Methods 3 2.2 Limitations and applications of values 5
Chapter 3 - Description of goods and services and
associated values 8
3.1 Food provision 8 3.1.1 Definition 3.1.2 UK example and valuation 3.2 Raw materials 9 3.2.1 Definition 3.2.2 UK example and valuation 3.3 Leisure and recreation 10 3.3.1 Definition 3.3.2 UK example and valuation 3.4 Resilience and resistance 11 3.4.1 Definition 3.4.2 UK example and valuation 3.5 Nutrient cycling 12 3.5.1 Definition 3.5.2 UK example and valuation 3.6 Gas and climate regulation 13 3.6.1 Definition 3.6.2 UK example and valuation 3.7 Bioremediation of waste 15 3.7.1 Definition 3.7.2 UK example and valuation 3.8 Biologically mediated habitat 16 3.8.1 Definition
v
3.8.2 UK example and valuation 3.9 Disturbance prevention and alleviation 18 3.9.1 Definition 3.9.2 UK example and valuation 3.10 Cultural heritage and identity 19 3.10.1 Definition 3.10.2 UK example and valuation 3.11 Cognitive values 20 3.11.1 Definition 3.11.2 UK example and valuation 3.12 Option use value 21 3.12.1 Definition 3.12.2 UK example and valuation 3.13 Non-Use values – bequest and existence 22 3.13.1 Definition 3.13.2 UK example and valuation Chapter 4 - Case study examples 25
4.1 Case study 1: The impact of trawling on benthic biodiversity 25
4.2 Case Study 2: Skomer Marine Nature Reserve. An example
of high biodiversity and high associated economic value 27 4.3 General conclusions about how changes in
biodiversity affect the value of goods and services 28 Chapter 5 - Concluding remarks 29
5.1 Recommendations 30 Acknowledgements 32 References 33
vi
Annexes 42 Annex 1: Valuation techniques 42 Annex 2: Food provision 44 Annex 3: Raw materials 47 Annex 4: Nutrient cycling 49 Annex 5: Gas and climate regulation 51 Annex 6: Bioremediation of waste 55 Annex 7: Biologically mediated habitat 56 Annex 8: Disturbance prevention 60 Annex 9: Case Study 1: The impact of trawl fishing on benthic biodiversity 62 List of Tables Table 1. An overview of goods and services provided by UK
marine biodiversity Table 2. Definition of Total Economic Value (adapted from Pearce
and Turner 1990) Table 3. Goods and services provided by marine biodiversity Table 4. An overview of goods and services provided by UK
marine biodiversity Table 5. Data matrix for trawl fishing in the North Sea scenarios Table 6. Main activity of the UK fishing fleet by segment (Defra sea
fisheries statistics 2004) Table 7. Summary of the number of fishermen for each region of
the UK (Defra sea fisheries statistics 2004) Table 8. Quantity (‘000 tonnes) and value (£ million) of fish
landings (including shellfish) by UK vessels into the UK and abroad in 2004 (Defra sea fisheries statistics 2004)
Table 9. Breakdown of the quantity and value for each of the 20 most common fish species in UK landings (Defra sea fisheries statistics 2004)
Table 10. Revenue generated from 1 tonne of trimmings Table 11. Change (and standard deviation) in biomass of benthic
fauna, benthic nutrient efflux and net primary production after 5 years of trawling as a percentage of the untrawled state, at unstratified and stratified sites
List of Figures Figure 1. The Total Economic Value (TEV) Framework, in the
context of the marine environment (adapted from Pearce and Turner 1990)
Figure 2. Comparison of the percentage volume and value of landed by the UK fleet in the UK ports and abroad (Defra sea fisheries statistics 2004)
Figure 3.
A map of the area for which primary productivity was calculated. The latitudinal range was from 49.75N to 61N and the longitudinal range was from 8w to 3E.
vii
Chapter 1 - Introduction The UK Government has recently outlined its vision for ‘clean, healthy, safe productive and biologically diverse oceans and seas’ and is currently considering a number of provisions to improve marine nature conservation as part of the proposed Marine Bill. In building the evidence base for the Marine Bill, Plymouth Marine Laboratory was commissioned by Defra to provide a valuation (based on best available information) of the goods and services resulting from marine biodiversity in UK waters, providing examples and monetary values where possible. The purpose of this work is to inform the need for further protection of marine biodiversity in UK waters. 1.1 Aims and objectives The project aims and objectives are:
• To provide an estimation of the total economic value of marine biodiversity in UK waters including the goods and services and non-use values it provides;
• To provide examples of marine biodiversity value and the change in value if marine biodiversity improves or declines; and
• To provide an economic valuation using marine biodiversity change scenarios.
Marine biodiversity plays a fundamental role in supporting a wide range of goods and services essential for the maintenance of the social and economic wellbeing of our society. The term biodiversity has many different definitions (Sheppard 2006), but for the purposes of this report it is used to refer to richness and composition at species and functional type levels. Goods and services are defined as indirect or direct benefits to human society which arise from the natural environment. Current environmental management tends to focus on market linked goods and services, such as tourism and fisheries. It is this narrow approach which has contributed to the over exploitation and degradation of marine biodiversity. Only by understanding all the goods and services provided by marine biodiversity is it possible to appreciate the true value of this resource. This understanding is the key to developing sustainable management plans to maximise the benefits received from marine biodiversity. 1.2 Report structure Chapter two of this report details the methods used and the limitations of this approach. Each good and service is provided by a variety of habitats and species, and likewise each habitat or species provides a variety of goods and services. A list of the goods and services, providing an indication of the habitats and species which provide them, the likely
1

impact of a decrease in biodiversity, and where possible a monetary value is provided in Chapter 3. Chapter 4 presents two case studies (biodiversity decline and high biodiversity) to investigate specific habitats, detailing the goods and services which they provide, and how the provision of these goods and services is influenced by biodiversity. Chapter 5 presents the overall conclusions and recommendations from this report.
2
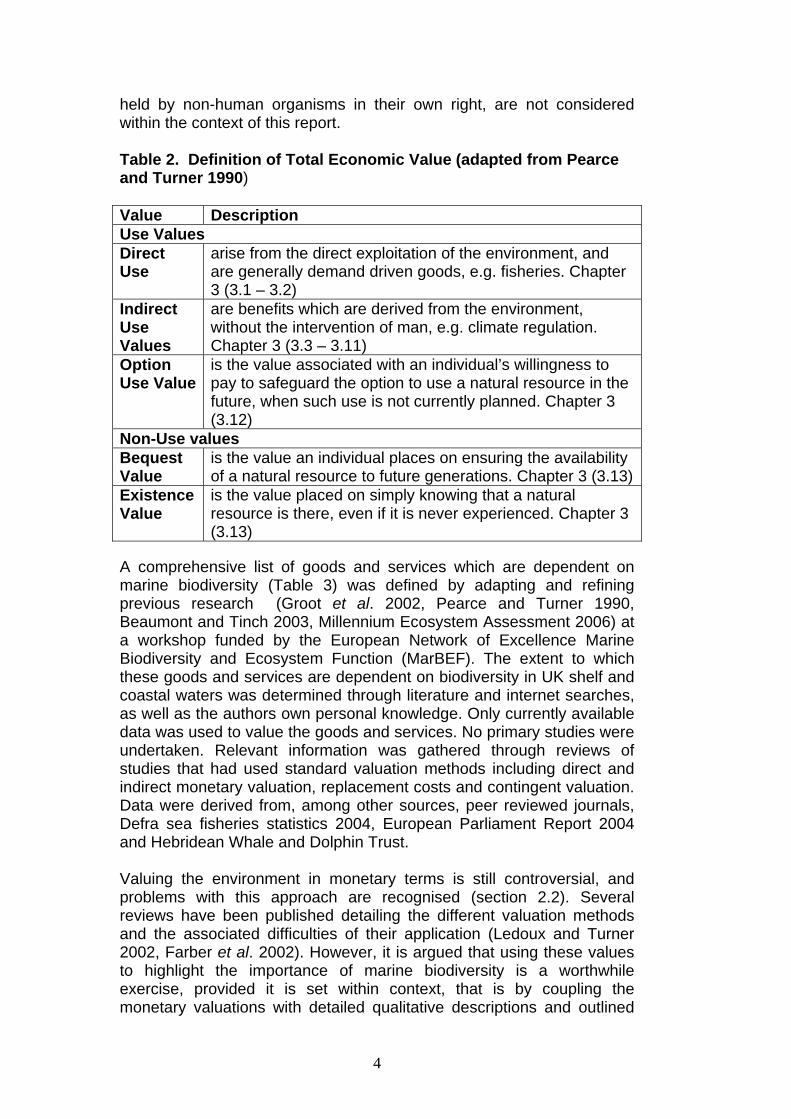
Chapter 2 - Adopted approach 2.1 Methods The Total Economic Value (TEV) approach is used in this report. Goods and services resulting from marine biodiversity in UK waters are outlined with monetary values provided where possible. All values are based on the best currently available information. The absence of an economic value does not infer that this good or service is without value, only that the information is not available. Given the focus of this research is on goods and services provided by marine biodiversity, any goods or services based on the physical attributes of the marine environment are not included. The geographical focus of this report is on UK open marine waters, although non-UK and coastal examples are used where no other information is available. The environment provides several different types of value to man, use and non-use, and these are defined by the TEV framework (Pearce and Turner 1990), and depicted in Figure 1. It has been argued that previous lists of goods and services have not included the less tangible benefits derived from the environment (Brito 2005). By applying the TEV framework all aspects of value associated with the goods and services of the environment are captured.
Total Economic Value
Use Value Non Use Value
Direct Use Value Indirect Use Value Option Use Value Bequest Value Existence Value
e.g. Nutrient balance
and cycling
e.g.Pharmaceutical
e.g. future generations
e.g. preserving biodiversity
e.g. Fish Productivity
Total Economic Value
Use Value Non Use Value
Direct Use Value Indirect Use Value Option Use Value Bequest Value Existence Value
e.g. Nutrient balance
and cycling
e.g.Pharmaceutical
e.g. future generations
e.g. preserving biodiversity
e.g. Fish Productivity
Figure 1. The Total Economic Value (TEV) framework, in the context of the marine environment (adapted from Bateman and Langford 1997) Use values arise from humans actually using the environment and are presented in Table 2. Three ‘use’ values are generally considered, direct, indirect and option use. Non-use values are representative of the value which humans derive from an environmental resource, despite the fact they may never use or even see it, and are generally divided into two categories, bequest and existence. Values held by non-human entities, that is intrinsic values (Bateman and Langford 1997), or values
3
held by non-human organisms in their own right, are not considered within the context of this report. Table 2. Definition of Total Economic Value (adapted from Pearce and Turner 1990) Value Description Use Values Direct Use
arise from the direct exploitation of the environment, and are generally demand driven goods, e.g. fisheries. Chapter 3 (3.1 – 3.2)
Indirect Use Values
are benefits which are derived from the environment, without the intervention of man, e.g. climate regulation. Chapter 3 (3.3 – 3.11)
Option Use Value
is the value associated with an individual’s willingness to pay to safeguard the option to use a natural resource in the future, when such use is not currently planned. Chapter 3 (3.12)
Non-Use values Bequest Value
is the value an individual places on ensuring the availability of a natural resource to future generations. Chapter 3 (3.13)
Existence Value
is the value placed on simply knowing that a natural resource is there, even if it is never experienced. Chapter 3 (3.13)
A comprehensive list of goods and services which are dependent on marine biodiversity (Table 3) was defined by adapting and refining previous research (Groot et al. 2002, Pearce and Turner 1990, Beaumont and Tinch 2003, Millennium Ecosystem Assessment 2006) at a workshop funded by the European Network of Excellence Marine Biodiversity and Ecosystem Function (MarBEF). The extent to which these goods and services are dependent on biodiversity in UK shelf and coastal waters was determined through literature and internet searches, as well as the authors own personal knowledge. Only currently available data was used to value the goods and services. No primary studies were undertaken. Relevant information was gathered through reviews of studies that had used standard valuation methods including direct and indirect monetary valuation, replacement costs and contingent valuation. Data were derived from, among other sources, peer reviewed journals, Defra sea fisheries statistics 2004, European Parliament Report 2004 and Hebridean Whale and Dolphin Trust. Valuing the environment in monetary terms is still controversial, and problems with this approach are recognised (section 2.2). Several reviews have been published detailing the different valuation methods and the associated difficulties of their application (Ledoux and Turner 2002, Farber et al. 2002). However, it is argued that using these values to highlight the importance of marine biodiversity is a worthwhile exercise, provided it is set within context, that is by coupling the monetary valuations with detailed qualitative descriptions and outlined
4
limitations of the data. Calculation of changes to the value following changes in biodiversity cannot be made due to limitations on the natural science required to support the calculation of these values. Progress is however being made in this area, notably by MarBEF (www.MarBEF.org), a network of excellence funded by the European Union as a platform to integrate and disseminate knowledge and expertise on marine biodiversity. Monetary values are presented on an annual basis for the year 2004 where possible. These values will continue to be provided during the coming years, so the actual value (Net Present Value) of these goods and service is likely to be much greater than presented within this report. The benefits we receive from the marine environment are entirely dependent on the state of the whole ecosystem, the sum of the parts of the system will be less than the value of the whole system, and the goods and services provided are intrinsically connected. Individual functions can also provide additional value when examined in the context of the other functions with which they coexist at wider scales (spatial or temporal) than the scale of investigation. In addition, the exploitation of goods and services may have negative, positive or neutral impacts on the other goods and services. Thus, although this classification breaks the environment down into specific components, the inter-dependency of these components, and overall value of the environment should not be underestimated. Changes in biodiversity are understood to mean changes in richness and composition at species and functional type levels, that is groups of species that carry out the same ecological functions. As the provision of all the goods and services presented in this report are linked to marine biodiversity, a change in biodiversity will lead to a change in the provision of these goods and services with varying and at present unpredictable impacts on society and the economy. 2.2 Limitations and applications of values Valuing all environmental goods and services clarifies the importance of marine biodiversity and enables the costs and benefits of exploitative activity to be evaluated, facilitating the management process for the marine environment. Valuing non-market goods and services is, however, still controversial and can be problematic (see Annex 1 for an overview of the techniques applied in this review). The monetary values should be considered to play a complementary role within this report, to highlight the importance of marine biodiversity, with the accompanying text being of equal importance. Despite the numerous and complex difficulties with the monetary data they are the best value estimates currently available. It is advised that they are used only as indicators of value, and should only be applied within the context of these limitations.
5
In using the findings of this report, the following limitations to the valuation data should be noted:
1. Estimates are likely to be conservative as only a component of the total good or service can be valued due to current limitations on data.
2. Values are standardised as far as possible, but a comprehensive
benefit transfer of the values has not been undertaken. For example, some of the valuations use USA data which has been extrapolated to the UK. Extrapolation will generated inaccuracies (Woodward and Wui 2001), but in the absence of UK or European data, USA studies are believed to provide the best estimate available at the current time.
3. The monetary values cannot be aggregated to provide an overall
figure for the value of UK marine biodiversity due to differing methods used to calculate values. As such values are not directly comparable. Even if the same method is applied, a small change in the method can lead to a significant change in the value. Aggregating the values is also misleading as there are significant gaps in the valuation literature, resulting in several of the goods and services not being quantified in monetary terms. Thus, any aggregated value will be a significant under estimate.
4. Some values provided are on a per area basis and then
multiplied up to a UK area (for example gas and climate regulation and nutrient cycling). Problems with this approach include:
• Environment types not being uniform, for example a wetland in
Cornwall may be very different to a wetland in Renfrewshire; • the values do not take into account variations in per unit value
as the environment is exploited, for example as an environment or resource is diminished it’s value may increase, and vice versa;
• multiplying the values up entails designating boundaries on the UK marine environment, and as many marine processes and organisms are mobile this is not realistic.
5. Values for nutrient cycling are very uncertain, as replacement
values are applied. Replacement of this function is not possible. In addition, if all nutrient cycling stopped the marine system would break down. It could be therefore be argued that this renders the value meaningless. However, this value has been included here out of interest as a hypothetical value.
Previous studies have provided a single figure for the value of the marine environment or biodiversity (Costanza et al. 1997, Williams et al.
6
2003, Patterson and Cole 1999). A single figure is not provided by this research for the reasons noted previously, but it is worth briefly considering the validity of this approach. In all these studies the open ocean was considered to offer six services (with a combined value of US$252 per hectare):
• gas regulation; • nutrient cycling; • biological control; • food production; • raw materials; and • cultural values.
All other goods and services were ignored. Despite a variety of methods being used to determine this estimate, the values were aggregated. The values for these services were also calculated by extrapolating from a wide variety of environments, increasing the error margins on this estimate. This value could easily be extrapolated to the U.K. but the resultant value would be a vast under-estimate of dubious quality. A significant limitation of this report is a lack of relevant natural science, social and economic data. Patterson and Cole (1999) attempted to place a value on New Zealand’s biodiversity, but omitted a value for the open ocean from their final valuation as marine biodiversity was considered too difficult to value. Pimental et al. (1997) undertook a study of the economic benefits of biodiversity in the United States, and included no marine examples except fisheries. The marine environment is also extremely diverse and complex, resulting in significant limitations in current scientific knowledge of the effects of marine biodiversity on ecosystem functioning. For most services, the importance of biodiversity can only be quantified in a limited number of habitats or for a limited number of species or functional types (Hooper et al.2005).
7
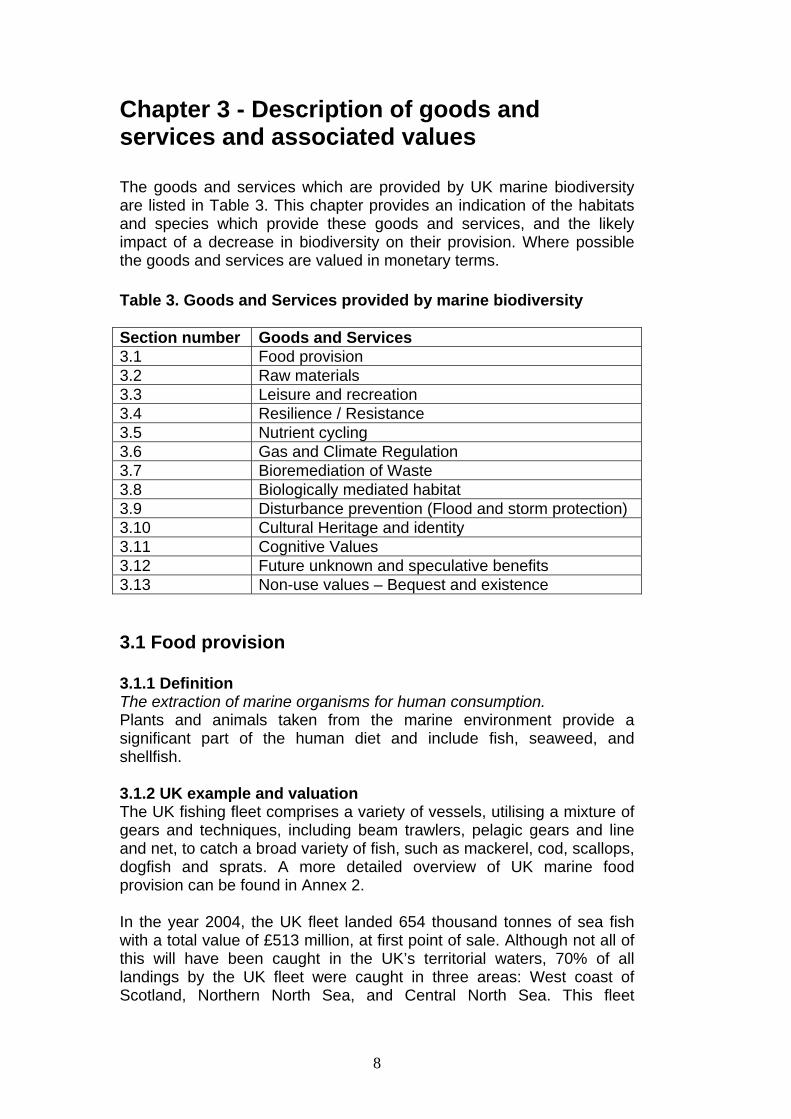
Chapter 3 - Description of goods and services and associated values The goods and services which are provided by UK marine biodiversity are listed in Table 3. This chapter provides an indication of the habitats and species which provide these goods and services, and the likely impact of a decrease in biodiversity on their provision. Where possible the goods and services are valued in monetary terms. Table 3. Goods and Services provided by marine biodiversity Section number Goods and Services 3.1 Food provision 3.2 Raw materials 3.3 Leisure and recreation 3.4 Resilience / Resistance 3.5 Nutrient cycling 3.6 Gas and Climate Regulation 3.7 Bioremediation of Waste 3.8 Biologically mediated habitat 3.9 Disturbance prevention (Flood and storm protection) 3.10 Cultural Heritage and identity 3.11 Cognitive Values 3.12 Future unknown and speculative benefits 3.13 Non-use values – Bequest and existence 3.1 Food provision 3.1.1 Definition The extraction of marine organisms for human consumption. Plants and animals taken from the marine environment provide a significant part of the human diet and include fish, seaweed, and shellfish. 3.1.2 UK example and valuation The UK fishing fleet comprises a variety of vessels, utilising a mixture of gears and techniques, including beam trawlers, pelagic gears and line and net, to catch a broad variety of fish, such as mackerel, cod, scallops, dogfish and sprats. A more detailed overview of UK marine food provision can be found in Annex 2. In the year 2004, the UK fleet landed 654 thousand tonnes of sea fish with a total value of £513 million, at first point of sale. Although not all of this will have been caught in the UK’s territorial waters, 70% of all landings by the UK fleet were caught in three areas: West coast of Scotland, Northern North Sea, and Central North Sea. This fleet
8
comprised of 11,559 fishermen, with 84% of these being full time fisherman. Market based values are not always representative of the true value of a resource and the figure of £513 million does not include the added value of fish processing. Further revenue and employment were created through the fish processing industry, retail sales, and exports, with fish processing employing approximately 18,180 people, and 1,300 fishmongers (Defra sea fisheries statistics 2004). Unreported catches (e.g. illegal fishing and recreational fishing), which may be considerable, are also not include in the above figure as a result is considered to be an underestimate. Socio-economic impacts of declining biodiversity Reduced marine biodiversity would directly impact fisheries and any associated employment, through a reduction in the quantity and number of species available for commercial exploitation. Declining biodiversity would also indirectly impact UK fisheries through reduced primary productivity (Runge 1988), a declining ability to recover following disturbance (resilience) (section 3.4) and a reduction in refuge and breeding areas (section 3.8)
3.2 Raw materials 3.2.1 Definition The extraction of marine organisms for all purposes, except human consumption. A wide variety of raw materials are provided by the marine environment for a variety of different uses, for example, seaweed for industry and fertiliser, fishmeal for aquaculture and farming, pharmaceuticals and ornamental goods such as shells. 3.2.2 UK example and valuation Fishmeal and fish oil are key constituents of pelleted diets for the intensive production of carnivorous fish species. In 2004, 192 000 tonnes of fishmeal were consumed in the UK of which 50 000 were produced locally with the remainder imported. The total value of the fish meal UK market in 2004 was £81 million (European Parliament Report 2004). Almost all commercial seaweed harvesting is concentrated on the Phaeophytes (brown seaweeds) including, Laminaria, Ascophyllum and Fucus spp.. These are used in various applications which include as components of cosmetics, as food, in agriculture where raw seaweeds and by-products are used as solid state fertiliser, and in industrial applications such as textiles, food and medicine. Estimated total gross income from seaweed in 1994 was between £270,000 and £450,000, (£349,819 to £583,032, 2004UK£) although the true figure probably lies
9
towards the lower end of this range. Market values could not be found for all of the marine raw materials exploited in the UK, and as a result the total value of this good is considered to be an underestimate. Further information on raw materials can be found in Annex 3. Socio-economic impacts of declining biodiversity Reduced marine biodiversity will impact the provision of raw materials, and associated employment, through a reduction in the number and quantity of species available for extraction. However, the extent of the impact of reduced marine biodiversity will depend upon the specific species which are in decline and the prevalence of substitutes. 3.3 Leisure and recreation 3.3.1 Definition The refreshment and stimulation of the human body and mind through the perusal of, and engagement with, living marine organisms in their natural environment. The marine environment provides the basis for a wide range of recreational activities including: (sea)bird watching, rock pooling, beachcombing, sport fishing, recreational diving, and whale-watching to name but a few. In addition, the provision of this good results in significant employment opportunities. Sports such as sailing are not included as this generally uses only the ‘physical’ marine environment, although it is recognised that in some cases biodiversity adds to the ‘sailing experience’ it is considered to play a minimal role. 3.3.2 UK example and valuation The majority of leisure activities in the UK marine environment are based around the coastal areas, and include bird watching, rock pooling and diving. The total net value of marine leisure and recreation in the UK in the year 2002 was estimated as £11.77 billion by Pugh and Skinner (2002) and included holiday tourism, cruising and leisure craft services. This value will not be entirely dependent upon marine biodiversity, and is considered an overestimate. Activities which are based in the open marine waters and are dependent upon marine biodiversity include, sea angling, diving, and whale watching. It is useful to consider two more specific examples, marine mammal watching and sea angling. Whales and dolphins are highlighted as Scotland’s number one wildlife attraction. A quarter of million tourists are involved with whale-tourism activities annually in West Scotland, with the total income generated by whale-tourism being estimated at £7.8 million in 1994 (Source: The Hebridean Whale and Dolphin Trust (HWDT) website). In addition, a baseline study of seal watching commissioned by the International Fund for Animal Welfare (IFAW), estimated that seal watching provided at least £36 million to the UK economy in 1996. Wildlife watching also has important implications for
10
the small rural communities in terms of employment and raising the awareness of local marine wildlife, inspiring the public and teaching a healthy respect for their natural environment. The total expenditure by sea fish anglers resident in England and Wales was estimated as £538 million per year from 12.7 million angler days of activity in 2004. 52% of this activity was by own boat anglers, 37% by shore anglers and the remaining by charter boats. In terms of first round impacts, the spending translates to 18,889 jobs and £71 million in income for suppliers of angling services and materials (Shorney 2004). Socio-economic impacts of declining biodiversity A considerable component of leisure and recreation in the UK depends upon marine biodiversity, which in turn supports employment and small businesses. The very rapid growth of sea angling based on sustainable practices is recognized as significant opportunity for UK economy. If UK marine biodiversity declines the value of this sector will decrease, with a potential loss of revenue through a shift of activity to alternative non-UK destinations, and a decline in the number foreign visitors. 3.4 Resilience and resistance 3.4.1 Definition The extent to which ecosystems can absorb recurrent natural and human perturbations and continue to regenerate without slowly degrading or unexpectedly flipping to alternate states (Hughes et al. 2005). Healthy ecosystems with high biodiversity can have greater resilience to natural or anthropogenic impacts than lower diversity systems (Hughes et al. 2005, Tilman et al. 2006). However, high biodiversity alone does not necessarily lead to improved resilience. It is necessary to have a range of species that respond differently to various environmental perturbations to enhance resilience and/or resistance, for example if all species within a functional group respond similarly to anthropogenic pressures, such as over-fishing and pollution, increased biodiversity will not alleviate these pressures. 3.4.2 UK example and valuation Small scale experimental studies of biodiversity and ecosystem function suggest that in marine ecosystems high species richness leads to greater resilience. In some cases this is exhibited as increased resistance, for example in seagrass (Hughes and Stachowicz 2004), or as enhanced recovery after a perturbation (Reusch et al. 2005). These small scale studies cannot necessarily be extrapolated to the entire marine environment but recent studies suggest the same phenomenon is observed at larger scales. High diversity kelp forest are considered to be more resilient that their lower diversity equivalents (Steneck et al. 2002, Steneck et al. 2004).The simplification of food
11
chains has also been found to have detrimental effects on the resilience of systems, for example the removal of predators, such as pelagic fish, can lead to an increased abundance of their prey, in this case plankton, resulting in plankton blooms (Hughes et al. 2005). Under similar environmental conditions increased species richness generally decreases susceptibility to invasion by exotic species. However several other factors may be more influential and mask the effects of species richness, such as disturbance regime and resource availability (Hooper et al. 2005). There are no UK specific examples of this service, but based on this evidence it is reasonable to assume that high biodiversity in UK environments will lead to higher resilience. Estimation of resilience and resistance values is complicated by a lack of scientific knowledge about the relationships between biodiversity and resilience. This context of fundamental uncertainty makes this service impossible to value at the current time and as a result it can tend to be overlooked. This is despite the fact that a systems resilience and resistance to disturbance is critical to the provision of all other goods and services, especially in the current climate of increased environmental change. Socio-economic impacts of a decrease in biodiversity: If biodiversity declines a loss of stability in the marine ecosystem may result. Systems may take longer to recover from disturbances, or not recover at all. This is turn will have a significant impact on the provision of all other goods and services. Maintaining a diversity of organisms with different functional roles and response types will help to ensure a variety of management options are available (Hooper et al. 2005). 3.5 Nutrient cycling 3.5.1 Definition The storage, cycling and maintenance of availability of nutrients by living marine organisms. The storage, cycling and maintenance of availability of essential nutrients, for example nitrogen, phosphorus, sulphur, silicon and metals, is crucial for the existence of life (Hutchins and Bruland 1995). Nutrient cycling encourages productivity by making the necessary nutrients available to all levels of the food chains and webs. Marine biodiversity plays a critical role in regulating nutrient cycling (see Annex 4 for further details). 3.5.2 UK example and valuation Many marine species which occur in the seabed (benthic organisms) in UK waters are known to be important bioturbators and thus play a significant role in nutrient cycling. Bioturbators is the term given to those organisms whose physical activity as they feed on, and move and/or burrow through the sediment has a physico-chemical effect on the sediment. Examples include burrowing urchins (Widdicombe and Austen
12
1998, Bird et al. 1999), polychaetes (Kristensen 1985, 1989, Hansen and Kristensen 1998) and mud shrimps (Howe et al. 2004). Trawl fishing has a significant impact on benthic communities, particularly the large bioturbators, which in turn has the potential to impact rates of nutrient cycling. The impact of trawl fishing is discussed in more detail in Chapter 4. The marine system is currently nutrient limited and excessive inputs of nitrogen can result in eutrophication and Harmful Algal Blooms (HAB). These events may be alleviated by the presence of biodiversity, which removes biologically available nutrients through sediment denitrification (Seitzinger and Nixon 1985). Costanza et al. (1997) proposed a replacement cost method for the valuation of the environment in its nutrient cycling capacity. The values which they propose, adjusted to 2004 prices, are £0.10 to £0.29 per m3, (original source Richards et al. 1991). The UK territorial waters (out to 12 nautical miles from low-water mark) cover an area of 161,200 km2
(http://www.jncc.gov.uk/page-1478); with the majority of this area on the continental shelf. With an estimated average depth of 50m (best estimate), the approximate volume of UK waters is 8 x 10¹² m3. This equates to a replacement cost for nutrient cycling of between £800 billion and £2320 billion (billion = 109), to treat the entire UK waters once. To replace this service, this treatment process would need to be continually repeated, so the true value would be greater. This estimate should be considered with significant caution as replacement of the entire UK marine nutrient cycling function is impossible, and if all nutrient cycling did stop the marine system would break down. Thus it could be argued that this value is meaningless, however, it is included here out of interest as a hypothetical value. Socio-economic impacts of a decrease in biodiversity: The capacity of the environment to cycle nutrients is important for correcting detrimental anthropogenic effects, such as excessive nutrient loading resulting in HAB’s and an increase in eutrophication. A decrease in biodiversity could lead to changes in the extent of nutrient cycling, although the direction and degree of these changes is currently unknown. As nutrient cycling is closely linked to productivity, changes in nutrient cycling, as a result of decreasing biodiversity could indirectly alter productivity rates. 3.6 Gas and climate regulation 3.6.1. Definition The balance and maintenance of the chemical composition of the atmosphere and oceans by marine living organisms. The chemical composition of the atmosphere and ocean is maintained through a series of biogeochemical processes. The maintenance of a
13
healthy habitable planet is dependent on processes such as the regulation of the volatile organic halides, ozone, oxygen and dimethyl sulphide, and the exchange and regulation of carbon, by marine living organisms. The marine environment plays a significant role in climate control through the regulation of carbon fluxes, in part due to its capacity to sequester carbon dioxide (CO2). It thus acts as a carbon sink but its capacity to do so will be affected by changes in the marine food webs. Changes in trophic dynamics will cause changes in the distribution of carbon throughout the marine environment. The gas and climate regulation is affected by the biodiversity of the pelagic and benthic marine systems (refer to Annex 5 for details). 3.6.2 UK example and valuation Carbon cycling is well researched, and is documented to have a significant impact on the environment. Although much of the research effort for carbon cycling is on open ocean systems, shelf systems can also play an appreciable role in the carbon budget (Frankignoulle et al. 1996). Marine productivity in UK ocean, shelf and coastal waters has been examined to determine the amount of carbon sequestered by phytoplankton. Phytoplankton sequester CO2 (to incorporate into organic tissue) and cause an inward flux into the oceans, thus the standing stock of phytoplankton at any point in time locks up a significant amount of carbon. Large scale marine primary production can best be determined by remote sensing methods to quantify the concentration of photosynthetic pigments (Joint and Groom 2000). Production can then be calculated using the photosynthesis model of Smyth et al. (2005). Application of this model was applied to the UK territorial waters area to calculate primary productivity. The average annual primary production (carbon sequestered by phytoplankton) was calculated to be 0.07 +/- 0.004 Gt carbon yr-1 (95% CI), which is slightly over 0.1% of global production (Smyth et al. 2005). Refer to Annex 5 for further information on this calculation
Savings from damage avoidance can be used to calculate the “social value” per metric tonne of sequestered Carbon. Clarkson and Deyes (2002) advise a range of £6 - £121 /tC (adjusted to UK£ 2004). Based on carbon storage, and coupling these estimates with the previously discussed primary productivity estimates, this service could be valued at between £420 million and £8.47 billion (billion 109) but is considered an underestimate given only primary production is considered. Many other processes which act to balance and maintain the chemical composition of the atmosphere and oceans also exist and should be included for a true value to be estimated.
14
Socio-economic impacts of a decrease in biodiversity Changes in biodiversity will influence the biogeochemical cycling of carbon and nutrients, and ultimately have a strong feedback on the atmosphere and the climate (Legendre and Rivkin 2005). Decreasing biodiversity has been linked to decreasing productivity (Tilman et al. 2006, see Annex 5), and thus it is reasonable to assume decreasing carbon sequestration. A decrease in biodiversity could have potential implications for climate change. In addition primary productivity has been linked to fisheries productivity (Runge et al. 1988), so a decrease in marine biodiversity may indirectly also reduce fisheries productivity.
3.7 Bioremediation of waste 3.7.1 Definition Removal of pollutants through storage, dilution, transformation and burial. A significant proportion of anthropogenic waste finally settles in the marine environment. In addition to this continuous ‘chronic’ release, accidental ‘acute’ discharge of substances, every year a number of incidents such as shipwrecks or land-based industry releases occur. Waste types can be organic, such as oil and sewage, or inorganic, (metals and synthetic chemicals). Marine living organisms store, dilute, bury and transform many wastes through assimilation and chemical de and re-composition either directly or indirectly. This de-toxification and purification process is of critical importance to the health of marine environment. The role of biodiversity in bioremediation is complex. Organisms in the marine environment contribute to a huge number of processes that can affect anthropogenic waste, ranging from burial, dilution and detoxification to re-suspension and transformation to more toxic compounds, as well as bio-magnification to make toxic compounds available within the human food chain. Added to this complexity is the huge number of potential and actual contaminants in the marine environment. 3.7.2 UK example and valuation Bioturbation, will serve to bury, dilute, and recycle wastes through assimilation and chemical re-composition. As a result UK marine benthic diversity are an important factor in the environmental remediation of domestic, aquacultural and agricultural organic pollution. Benthic community succession is a known phenomenon associated with many types of organic pollution (Pearson and Rosenberg, 1978), and a large range of species are associated with the recovery and succession of marine benthic systems (Rosenberg 2001). See Annex 6 for further details. Efforts to increase bivalve populations have been proposed as a method of improving water quality (Porter et al. 2004), as the loss of bivalve
15
species in the past (e.g. due to over-harvesting and reclamation of coastal areas for harbours and land-use) may have resulted in a decline in water quality (Dame et al. 2002). In addition, the bioremediation role of marine bacteria, algae and crab shells is highlighted by their application in heavy metal remediation (Iyer et al. 2005, Davis et al. 2003, Pascucci and Kowalak 1999, Vieira and Volesky 2000). Salt marshes play an important role in the bioremediation of waste, for example they have been documented to have bioremediation capacities in response to oil release, with 95% degraded over the course of a year (Mills et al. 2003). The only known valuation work undertaken on bioremediation of waste in marine environments is focussed on wetlands (Gren 1995, Bystrom 2000, Breaux et al. 1995). Breaux et al. (1995) estimate the value of the bioremediation function of wetlands in terms of potential savings over using more conventional waste water treatment. They determine the present value of wetlands, calculated over 30 years using a discount rate of 9%, to be £1096.81 - £1236.54 per acre in terms of savings. As these studies are not specific to salt marshes, they cannot be readily extrapolated to the UK. An alternative method to quantify this service is to consider the levels of raw sewage discharged to the marine environment. In 2003/2004 an average of 36094.28 kg BOD5/day was discharged into the sea. To treat this sewage to a tertiary level would cost £2,931,000 per day, that is approximately £1 billion per year (www.ofwat.gov.uk, 2006). This cost is currently avoided by utilising the marine environment’s capacity to accept waste. It could be argued however, that the capacity of the marine environment to accept this waste depends largely upon the physical dilution capacity, as opposed to biotic processes, and as a result this is not a true indication of the value of marine biodiversity. This value is therefore not included in the overview Table 4. Socio-economic impacts of a decrease in biodiversity A decline in biodiversity is predicted to reduce the environments capacity to process waste, with a decline in marine health and water quality. 3.8 Biologically mediated habitat 3.8.1 Definition Habitat which is provided by marine organisms. Marine systems contain organisms described as ecosystem engineers (sensu Jones et al. 1994, 1997), which have the ability to change the availability of resources for other organisms, and by doing so create and maintain habitats. Many marine species are responsible for the provision of living space which is both utilised and necessitated by many other species and is a pre-requisite for the provision of all goods and services. These biologically mediated habitats provide essential
16
breeding and nursery space for plants and animals (many of which have commercial value) and enable biodiversity to exist by providing a heterogeneous environment, this is essential for the continued recruitment of commercial and/or subsistence species. They also provide a refuge for plants and animals including surfaces for feeding and hiding places from predators. 3.8.2 UK example and valuation There is currently no information on the valuation of marine biologically mediated habitats, although it is clear from their variety, abundance and function as nursery habitat and refuge that this service of marine biodiversity will be of considerable value. The dead skeletons of coral, Maerl and shell fragments provide important habitat for a number of species. . Maerl is the collective term for the calcified product of coralline red algae (Kamenos et al. 2004a) and such grounds are patchily distributed around the UK but predominantly found on the west coasts. Maerl grounds are highly diverse habitats supporting a large number of species (Jackson et al. 2004). This includes the provision of refuge and food for juvenile life stages of commercially important shellfish such as the queen scallop, (Kamenos et al. 2004b), and juvenile gadoid fish Atlantic cod, Saithe and Pollack (Hall-Spencer et al. 2003, Kamenos et al. 2004c). Seagrass has only a patchy distribution in the UK, but has been found to provide both refuge and nursery habitat for a number of commercial fish species (Murphy et al. 2000) including Atlantic cod, halibut, flounder and plaice (Gotceitas et al. 1997, Thayer et al.1975) and also commercial shell fish (Davidson and Hughes 1998, Stevens and Armstrong 1984). In addition, seagrasses can be important food sources for wildfowl (Thayer et al.1975). Kelp and many other species of marine macrophytes are widely distributed in UK waters (Birkett et al. 1998) and support a diverse range of species, (Orth et al. 1984), for example invertebrate abundance is particularly high in the holdfast of kelp (Norderhaug et al. 2002), whilst kelp forest provide refuge for fish species such as juvenile Atlantic cod (Cote et al. 2002). Mussel patches also often reduce the harsh effects of temperature, wave action and light, providing more favourable conditions (Seed and Suchanek 1992), and as a result create habitat for a wide range of associated fauna (Suchanek 1980, Lintas and Seed 1994). Both living and dead shells can be used as substratum available for colonisation by other species and/or provide refuge from predation (Gutiérrez et al. 2003). Cold water corals, such as Lophelia pertusa, are found in waters of the UK coast from north of the Shetlands into the North-East Atlantic, with the Darwin Mounds and around the Rockall Bank the main known areas
17
(Wilson 1979). This species and several others can form colonies which aggregate over time into reef structures. Cold water reefs, like their tropical counterparts, have been found to provide habitat for various species of invertebrates (Bett 2001, Gage 2001). Fish in cold water coral reefs have been found to be present in significantly higher densities than the background environment (Bett and Jacobs 2000). Deep sea corals are slow growing and consequently take a long time to recover from damage caused by bottom impacting fishing gears which are particularly destructive. Fishing has been identified as a threat to these habitats. Further information on all these habitats can be found in Annex 7. Socio-economic impacts of a decrease in biodiversity A decrease in marine biodiversity could lead to a loss of these habitats through a decrease in the ‘ecosystem engineers’ which are necessary to provide them. This would result in loss of nursery and refuge areas for many other organisms, including commercially important species. 3.9 Disturbance alleviation and prevention 3.9.1 Definition The dampening of environmental disturbances by biogenic structures. Living marine flora and fauna play a valuable role in the defence of coastal regions. The presence of biogenic structures in the front line of sea defence can dampen and prevent a number of environmental disturbances such as tidal, storm and flood damages. This disturbance alleviation is dominated by a diverse range of species which bind and stabilise sediments and create natural sea defences. 3.9.2 UK example and valuation Biogenic structures which provide flood and storm prevention in the UK are only found around the coast. This is however a critical service, particularly as the risk of flooding has been accentuated in recent years by the onset of climate change (http://www.jncc.gov.uk/pdf/jncc334.pdf). Many types of flora can contribute to the reduction in wave energy in coastal zones. Seagrasses (Fonseca and Cahalan 1992) and halophytic (salt tolerant) reeds (Coops et al. 1996) play a minor role in the UK due to their small spatial scale. In the UK the major contribution to disturbance prevention is from saltmarshes (Paramor and Hughes 2004). Saltmarshes are areas of vegetation that colonize intertidal sediments and are inundated by the tide at least once every lunar month (Hughes and Paramor 2004). The total extent of UK saltmarsh is approximately 45,500 ha, concentrated in eastern England (http://www.ukbap.org.uk/UKPlans.aspx?ID=33#1). Saltmarshes attenuate and dissipate wave and tidal energy and thereby substantially reduce the cost of flood defence measures (Morris et al. 2004, Brampton 1992, Möller 1996). Coupled with this, salt marshes act like giant
18
sponges absorbing vast amounts of water when inundated and then slowly releasing it afterwards, preventing flooding. Further information on disturbance prevention can be found in Annex 8. King and Lester (1995) estimated that an 80m width of saltmarsh could result in cost savings, in sea defence terms, of £0.38 million to £0.71 million per hectare in terms of capital costs, and £7100 per hectare in terms of annual maintenance costs (adjusted to 2004 prices). Coupled with an area of 45,500 ha this equates to cost savings of between £17 billion and £32 billion for capital costs, and £0.3billion annual maintenance costs (billion 109). Socio-economic impacts of a decrease in biodiversity Clear linkages between saltmarshes and flood prevention exist. Saltmarshes comprise of a diverse range of species which are necessary to enable the flood defence function of this habitat. A decline in saltmarsh area, and thus biodiversity, would have deleterious consequences for coastal flood defence (Hughes and Paramor 2004). This problem will be exacerbated by increased frequency of storms and higher sea levels resulting from climate change and lead to increased damage caused by disturbance events and increased costs to prevent and alleviate (Blackwell et al. 2004). 3.10 Cultural Heritage and Identity 3.10.1 Definition The value associated with the marine environment e.g. for religion, folk lore, painting, cultural and spiritual traditions. Much of the research on marine cultural heritage is focussed upon archaeology, ancient monuments (Marine and Coastal Environment Group, 2004) and shipwrecks (Oxley 2001). As documented by the Millennium Ecosystem Assessment (2006), marine biodiversity is also a critical part of our cultural heritage and identity. The diversity of ecosystems affects the diversity of cultures, and many religions attach spiritual and religious values to marine life. The development and sustenance of many societies depends heavily upon marine ecosystems, in particular fishing communities. In addition, considerable value is placed upon the maintenance of culturally significant species. Finally, varied marine life provides inspiration for arts, local customs, traditions, crafts and skills, language and dialect. 3.10.2 UK example and valuation Our national cultural identity is shaped by the rich and diverse heritage which stems from the UK marine biodiversity. Little information is currently available on the cultural benefits of marine biodiversity, although this is believed to be indicative of a lack of documented research, as opposed to a lack of value.
19
Socio-economic impacts of declining biodiversity Declining biodiversity is likely to adversely affect the value our cultural heritage and identity. This cultural heritage and identity is non-renewable, as once evidence of the past has been destroyed it can never be replaced (www.planarch.org). 3.11 Cognitive values 3.11.1 Definition Cognitive development, including education and research, resulting from marine organisms. Marine living organisms provide stimulus for cognitive development, including education and research. Information ‘held’ in the natural environment can be adapted, harnessed or mimicked by humans, for technological and medicinal purposes. In addition, the marine environment can provide provides a long term environmental record which can be provide insight into environmental resilience and stress. This record can provide an insight into how the environment has changed in the past, enabling us to determine how it may change in the future. This may be of particular relevance when studying climate change. Bio-indicators are also of value for assessing and monitoring changes in the marine environment 3.11.2 UK example and valuation Current examples of the use of marine information include:
• the study of microbes in marine sediments to develop economical electricity in remote places (Chaudhuri and Lovley 2003);
• the inhibition of cancerous tumour cells by natural substances from marine organisms (Self 2005);
• the use of spines of the polychaete worm Aphrodite sp. to progress the field of photonic engineering, with potential implications for communication technologies and medical applications (Parker et al.2001); and
• the development of tougher, wear resistant ceramics for biomedical and structural engineering applications by studying the bivalve shell (Ross and Wyeth 1997).
As detailed in the bioremediation section, heavy metal remediation through common physio-chemical techniques is expensive and environmental unfriendly (Iyer et al. 2005), whereas marine bacteria, algae and crab shells (Davis et al. 2003, Pascucci and Kowalak 1999, Vieira and Volesky 2000) can all remove these substances naturally. There is significant value in education, training and university involvement in marine science. Pugh and Skinner (2002) compiled data on marine research funding, including research in higher education, the public sector and the industrial sector, and calculated value added
20
research and development in the marine sector to be £292 million. In addition education and training was valued at £24.8 million (Pugh and Skinner 2002). These estimates include all marine areas and are considered an over-estimate. Socio-economic impacts of declining biodiversity Cognitive values are intrinsically linked to marine biodiversity, if biodiversity declines so will the cognitive value. A decline would result in reduced technological and medicinal applications, with economic and social implications. 3.12 Option Use Value 3.12.1 Definition Currently unknown potential future uses of the marine environment. Option use Value is the value associated with an individual’s willingness to pay to safeguard the option to use a natural resource in the future, when such use is not currently planned. This review has explored many uses of the marine environment, but this service is the value we attach to uses which have not yet been discovered. We may never exploit the environment for these resources, but there is value associated with retaining the option of exploitation. Any expected future use is not option value but is properly part of direct/indirect use value and would belong under cognitive values. For every species we lose, we may lose a potential cure for disease, and as such even though we may not use every species in the future, there is value in maintaining them, so that we have the option to use them. This value is expected to be significant, considering the benefits arising from marine biodiversity to date (see all other goods and services). 3.12.2 UK example and valuation The genetic resources available from the UK marine environment are not currently being utilised commercially. It is expected that they may be of significant importance in future for food provision, for example in cross breeding or genetic engineering to improve existing commercial species for fish farming. Tropical rainforests have been valued at £0.01- £ 19.38 per ha based on their genetic diversity, and their resultant potential to yield successful pharmaceutical products. In the same way it is probable that the genetic diversity held in the marine communities may provide valuable information for future medicines (Simpson et al. 1996). Socio-economic impacts of declining biodiversity Option use value is intrinsically linked with biodiversity, if biodiversity declines our future options will also decrease, resulting in a reduced value to society and the economy.
21
3.13 Non-Use Values – bequest and existence 3.13.1 Definition Value which we derive from marine organisms without using them. Non-use values are generally divided into two categories: bequest and existence value. Bequest Value is the value the current generation places on ensuring the availability of biodiversity and ecosystem functioning to future generations. This is determined by our concern that future generations should have access to resources and opportunities, that is, we gain benefit from the knowledge that resources and opportunities are being passed to our descendants. Existence Value is the value placed on simply knowing marine biodiversity is there, even if it is never utilised or experienced, people simply derive value from the knowledge of its existence (Hageman 1985, Loomis and White 1996). People derive a substantial sense of well being purely from the knowledge that diverse marine life is exists. Existence values are not associated with any human use or option of human use, but simply reflect utility experienced from the knowledge that an environment exists in a certain state. 3.13.2 UK example and valuation The wider public are considered to attach importance to maintaining diverse marine life. This is revealed through their interest in marine based media presentations, such as the “Blue Planet”. In addition articles on cold water corals frequently appear in the media (http://news.bbc.co.uk/1/hi/sci/tech/3719590.stm, 2004). Despite the fact the majority of the general public will never see a cold water coral they are interested in them and put value on their existence. Existence and bequest values are difficult to determine accurately, and despite the considerable literature published in this area there is no comprehensive study of marine non-use values. When values are determined it is difficult to separate the existence value from the bequest value. Hageman (1985) and Loomis and White (1996) estimated that the average household’s willingness to pay to ensure the continued survival of various sea mammals varied between £19 and £46 annually, depending on the sea mammal. These values are willingness to pay per species of sea mammal. However, respondents of contingent valuation studies can tend towards multiple allocation of resources, that is they have ‘x’ amount of money which they will allocate repeatedly. It is therefore assumed that the willingness to pay to maintain one sea mammal species is equivalent to the willingness to pay to maintain all sea mammal species. The National Statistics office estimates that there are 24.7 million households in the UK in 2004. It is therefore estimated that the non-use value of marine mammals varies between £469 million and £1,136 million. These values are an under-estimate of the total non-use value of the UK marine environment, as only a small component of
22

23
non-use value is considered, but they do provide an insight to some potential values. Socio-economic impacts of declining biodiversity The UK general public attaches considerable value to the diversity of UK marine life, exhibited through their interest in a wide variety of species they may never directly experience. A decline in biodiversity would negatively affect the general public perception of the UK marine life, and as a result considerable value would be lost if biodiversity declined.
24
*Based on 2002 values. **Cost of treating UK waters once, not per annum. ***In addition to £17-£32 billion capital costs
Good/Service Definition Monetary value(per annum, UK £ 2004)
Method Under / Over estimate
Link to biodiversity, low (1)–high (5)
Food provision Plants and animals taken from the marine environment for human consumption
£513 million Market Under estimate 3
Raw materials The extraction of marine organisms for all purposes, except human consumption.
£81.5 million Market Under estimate 3
Leisure and recreation
The refreshment and stimulation of the human body and mind through the perusal and engagement with, living marine organisms in their natural environment.
£11.77 billion* Market Over estimate 3
Resilience and resistance
The extent to which ecosystems can absorb recurrent natural and human perturbations and continue to regenerate without slowly degrading or unexpectedly flipping to alternate states (Hughes et al. 2005)
Valuation data not available
Valuation data not available
Valuation data not available
5
Nutrient cycling The storage, cycling and maintenance of availability of nutrients mediated by living marine organism
£800 - £2320 billion**
Replacement Use withcaution
4
Gas and climate regulation
The balance and maintenance of the chemical composition of the atmosphere and oceans by marine living organisms
£0.4 - £8.47 billion
Avoidance Under estimate 5
Bioremediation of waste
Removal of pollutants through storage, dilution, transformation and burial.
Valuation data not available
Valuation data not available
Valuation data not available
5
Biologically mediated habitat
Habitat which is provided by living marine organisms Valuation data not available
Valuation data not available
Valuation data not available
5
Disturbance prevention and alleviation
The dampening of environmental disturbances by biogenic structures
£0.3billion*** Avoidance Under estimate 4
Cultural heritage and identity
The cultural value associated with the marine environment e.g. for religion, folk lore, painting, cultural and spiritual traditions
Valuation data not available
Valuation data not available
Valuation data not available
3
Cognitive values
Cognitive development, including education and research, resulting from marine organisms
£317 million* Market Over estimate 4
Option use value
Currently unknown potential future uses of the marine environment
Valuation data not available
Valuation data not available
Valuation data not available
5
Non-Use values – bequest and existence
Value which we derive from marine organisms without using them
£0.5 – 1.1 billion Contingent valuation
Under estimate 5
Table 4. An overview
of goods and services provided by UK
m
arine biodiversity (see text for sources and further information)
Chapter 4 - Case Studies Case studies presented in this report aim to document how specific habitats and species provide goods and services, and how biodiversity influences this provision. The first case study examines how biodiversity declines following an anthropogenic impact, and the implications of this on the provision of goods and services. The second case study investigates the benefits arising from a high biodiverse environment. Ideally these case studies would document an environment which had changed from low biodiversity to high biodiversity, but there are no suitable UK examples of these circumstances at the time of writing this report. Kettunen and ten Brink (2006) have documented several further case studies linking biodiversity loss to loss of goods and services. 4.1 Case study 1: The impact of trawl fishing on benthic biodiversity Mobile bottom-fishing gear is used to catch species that live within, on or in close contact with the seabed such as scallops, shrimp and flatfishes. This gear causes varying levels of disturbance that alters seabed complexity, removes, damages or kills biota, and reduces benthic production, leading to substantial changes in benthic community structure and habitat. The EU project COST-IMPACT investigated the impacts of trawl fishing on benthic biodiversity, and the in turn, the provision of goods and services. Publicly available data on the impact of fishing on marine benthos was analysed, using meta-analysis, to predict the outcome of using different fishing techniques in different habitats. This meta-analysis provided input to the model used by the project. A synthesis of the European Regional Seas Ecosystem Model (ERSEM) (Baretta et al., 1995, as modified by Blackford et al,. 2004), and the General Ocean Turbulence Model (GOTM) (Burchard et al., 1999) was used to investigate changes in benthic community structure caused by demersal trawl fishing and how these changes further affect benthic nutrient recycling and pelagic production. The ecosystem modelling suggested that the biogeochemical impact of demersal trawling is most significant in regions where the gear type, trawl frequency and sea-bed type cause high levels of filter feeder mortality. This results in a substantial increase in the oxygen content of the benthic system and significant changes in the biogeochemistry of the system. However the impacts of these changes on the overlying pelagic ecosystem are buffered by the physical environment and the ability of phytoplankton to vary their internal cell nutrient contents. Yet there may be more subtle implications on pelagic community structure including a shift towards the microbial loop and a potential increase in the probability of harmful algal bloom events.
25
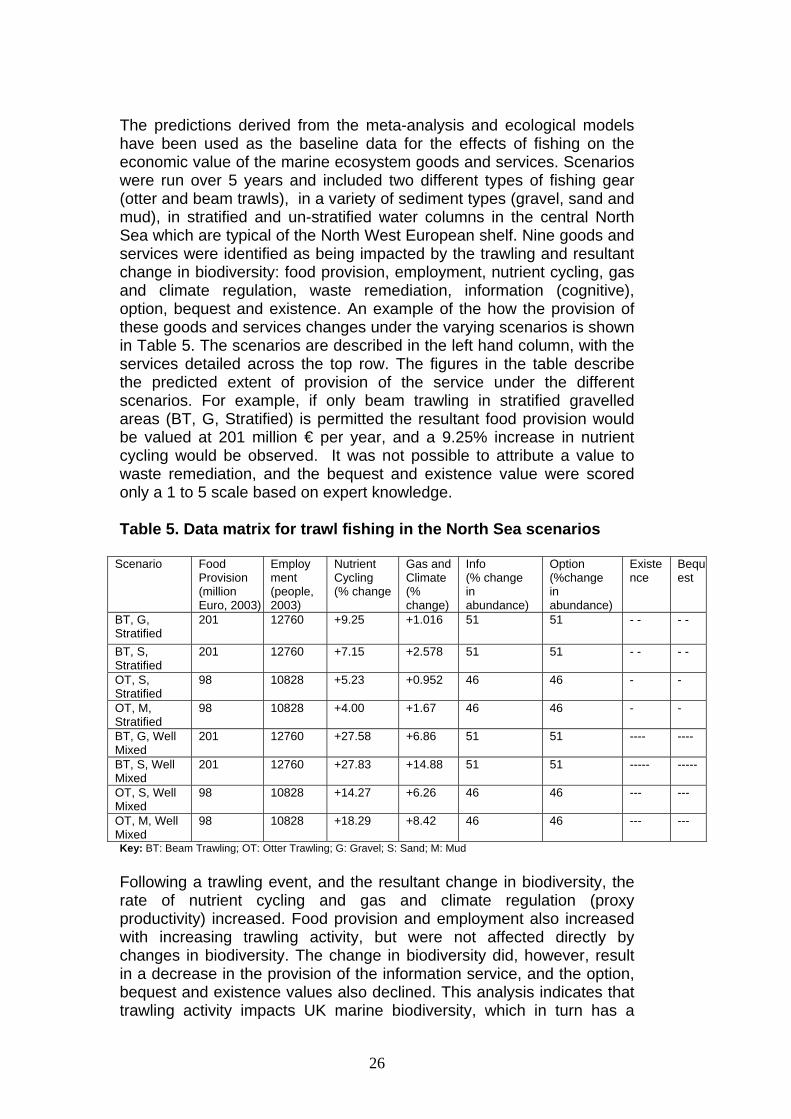
The predictions derived from the meta-analysis and ecological models have been used as the baseline data for the effects of fishing on the economic value of the marine ecosystem goods and services. Scenarios were run over 5 years and included two different types of fishing gear (otter and beam trawls), in a variety of sediment types (gravel, sand and mud), in stratified and un-stratified water columns in the central North Sea which are typical of the North West European shelf. Nine goods and services were identified as being impacted by the trawling and resultant change in biodiversity: food provision, employment, nutrient cycling, gas and climate regulation, waste remediation, information (cognitive), option, bequest and existence. An example of the how the provision of these goods and services changes under the varying scenarios is shown in Table 5. The scenarios are described in the left hand column, with the services detailed across the top row. The figures in the table describe the predicted extent of provision of the service under the different scenarios. For example, if only beam trawling in stratified gravelled areas (BT, G, Stratified) is permitted the resultant food provision would be valued at 201 million € per year, and a 9.25% increase in nutrient cycling would be observed. It was not possible to attribute a value to waste remediation, and the bequest and existence value were scored only a 1 to 5 scale based on expert knowledge. Table 5. Data matrix for trawl fishing in the North Sea scenarios
Scenario Food Provision (million Euro, 2003)
Employment (people, 2003)
Nutrient Cycling (% change
Gas and Climate (% change)
Info (% change in abundance)
Option (%change in abundance)
Existence
Bequest
BT, G, Stratified
201 12760 +9.25 +1.016 51 51 - - - -
BT, S, Stratified
201 12760 +7.15 +2.578 51 51 - - - -
OT, S, Stratified
98 10828 +5.23 +0.952 46 46 - -
OT, M, Stratified
98 10828 +4.00 +1.67 46 46 - -
BT, G, Well Mixed
201 12760 +27.58 +6.86 51 51 ---- ----
BT, S, Well Mixed
201 12760 +27.83 +14.88 51 51 ----- -----
OT, S, Well Mixed
98 10828 +14.27 +6.26 46 46 --- ---
OT, M, Well Mixed
98 10828 +18.29 +8.42 46 46 --- ---
Key: BT: Beam Trawling; OT: Otter Trawling; G: Gravel; S: Sand; M: Mud Following a trawling event, and the resultant change in biodiversity, the rate of nutrient cycling and gas and climate regulation (proxy productivity) increased. Food provision and employment also increased with increasing trawling activity, but were not affected directly by changes in biodiversity. The change in biodiversity did, however, result in a decrease in the provision of the information service, and the option, bequest and existence values also declined. This analysis indicates that trawling activity impacts UK marine biodiversity, which in turn has a
26
mixed impact on the provision of goods and services. A more detailed description of this study can be found in Annex 9. 4.2 Case Study 2: Skomer Marine Nature Reserve. An example of high biodiversity and high associated economic value Skomer is a small island situated off the Pembrokeshire coast, Wales. It is an area of high biodiversity with a number of important and high profile species, including grey seals, basking sharks, and porpoises(www.bbc.co.uk 2006). It is the largest single seabird colony in Southern Britain supporting a number of gull species (Perrins and Smith 2000), guillemots, razorbills, kittewakes, puffins and 40% of the Global population of Manx shearwaters (Poole 1995, www.unep-wcmc.org 2006). Although residing on the island, seabirds are an integral part of the marine ecosystem, influencing energy flow and food web dynamics. The waters around Skomer harbour a vast number of species of conservation importance, such as the pink sea fan. Skomer was declared a National Nature reserve (NNR) in 1959 and was designated a Marine Nature Reserve (MNR) in 1990. Skomer is now managed by the Wildlife Trust of South West Wales under lease from the Countryside Council for Wales. It is also classified as Special Protection Area (under the 1979 EC Bird's Directive). Despite these designations certain types of fishing are still allowed in the waters. There is little data on how the biodiversity has changed before and after the designation as a marine reserve, although it appears from survey data that the designation as an NMR has resulted in increased king scallop populations (CCW/WW/04/2) and increased abundance and diversity of sponge populations (CCW/WW/04/4). The majority of visitors to Skomer are to see marine wildlife. The number of visitors has increased gradually during the last 40 years with up to 14,000 visitors recorded in 2005. During the next few years the maximum boat revenue is estimated at £160,000 and the administration fee to the Wildlife Trust could be up to £120,000 per annum. Diving has been popular at Skomer for many years and there has been a noticeable shift towards using local diver charters (Kate Lock pers. comm.), resulting in considerable benefits for the local economy. As the area is heavily protected commercial fishing effort is relatively low and is primarily with pots which target both lobster and crab. Recreational angling is however very popular with an annual average of 360 visitors between 1992 and 2004 (excluding 1996 because of the Sea Empress oil spill). Boating attracted an annual average of 998 visitors, also between 1992 and 2004 (excluding 1996 because of the Sea Empress oil spill), and although this may not be directly associated with the
27
biodiversity it is probable that the extensive marine life plays a role in attracting these visitors. Since the introduction on the MNR, there has been an increase in the number of visitors, recreational anglers and boating activity. A decrease in the number of divers has however been noted and may be explained by external factors, such improved facilities in other locations. The link between increased visitors and increased biodiversity is only correlative, but it appears very likely that the success of Skomer as a tourist destination is due to the biodiversity which is present. The social and economic benefits associated with, and dependent upon, this high bio-diverse environment are substantial, particularly to the local economy. 4.3 General conclusions from the case studies The impact of trawling on benthic biodiversity (Case study 1) suggests that a decline in biodiversity will result in a decline in the provision of some, but not all, goods and services. Indeed, the provision of some of the goods and services will increase with the change in biodiversity. Case study 2 on Skomer Nature Reserve implies that increased biodiversity results in increased goods and services, with tangible economic and social benefits. It is difficult to extrapolate general conclusions about UK marine biodiversity from these two case studies. It is realistic to expect that a decline in biodiversity will result in a decline in the provision of goods and services, although the results of case study 1 suggest this will not always be the case. There is a real need for more UK case studies researching the quantitative linkages and dynamic relationships between biodiversity and the provision of goods and services.
28
Chapter 5 – Concluding remarks A wide range of goods and services are provided by UK marine biodiversity, resulting in significant social and economic benefits. Table 4 provides a summary of these goods and services. Despite the numerous and complex difficulties with the monetary data they are the best value estimates currently available. It is advised, however, that the monetary figures are used only as indicators of value, and should only be applied within the context of these limitations, and alongside the qualitative information provided within the report. Monetary values are estimated for eight of the thirteen goods and services. The absence of an economic value does not infer a lower value, only that the information is not available. Where the value is classified as an ‘underestimate’ only one component of the good or service has been valued, so a considerable portion of the function has not been considered in the valuation. There are significant limitations associated with this monetary data, and most of the figures presented are under-estimates. In particular the values for nutrient cycling are very uncertain, as replacement values cannot in truth be applied. The strength in the use of these indicative monetary values lies in their capacity to highlight the importance of marine biodiversity. The descriptive text for each of the goods and services should be considered as important as the monetary data, and clarifies the linkages between biodiversity and the provision of these functions. Due to a lack of data it is currently impossible to establish quantitative links between biodiversity and goods and services. However, a best estimate of the strength of the linkages between biodiversity and the good or service is provided to indicate how sensitive the good or service is to changes in biodiversity (refer to Table 4). Monetary values presented in this report cannot be aggregated to provide an overall value of the marine environment. This is because different methods have been used to calculate the values, and hence the values are not directly comparable. Even if the same method is applied, a small change in the method can lead to a significant change in the value. Aggregating the values is also misleading as there are significant gaps in the valuation literature, resulting in several of the goods and services not being quantified in monetary terms. Providing a single monetary value for UK marine biodiversity would incorrectly infer a comprehensive understanding. It has not been possible to quantify how values change with declining or improving biodiversity due to data limitations and the current uncertainty in links between biodiversity and ecosystem function. Progress is however being made in this area.
29
The classification applied divides marine biodiversity into specific components, but the inter-dependency of these components is apparent. It is therefore important to recognise that the benefits received from the marine environment are entirely dependent on the state of the whole ecosystem, and the exploitation of one function is likely to impact the provision of another. The goods and services approach used in this report is a valuable tool for the implementation of marine spatial planning and conservation planning as detailed in the Marine Bill. This methodology enables the ecosystem approach by ensuring the trade offs between different activities, and the goods and services they impact, are both transparent and comparable. The provision of all the goods and services presented are linked to marine biodiversity. A decline in UK marine biodiversity will result in a varying, and at present unpredictable, change in the provision of all these goods and services. This could result in severe impacts on society and the economy, including reduced resilience to change, declining marine health and water quality, fisheries, loss of recreation, decreased employment and reduced carbon uptake.
5.1 Recommendations
The three original aims and objectives have been achieved to varying degrees. The extent to which the aims and objectives have been met provides a valuable indication of future research requirements and recommendations.
• Aim: To provide an estimation of the total economic value of marine biodiversity in UK waters including the goods and services and non-use values it provides.
The total economic value of UK marine biodiversity has been estimated, and the goods and services it provides have been detailed. The monetary data have not been aggregated to provide a single figure as the resultant value would be a vast under-estimate of dubious quality, as discussed in Section 2.2. It is of particular interest that the goods and services which biodiversity are judged to have the highest impact on, are often the areas where valuation data does not exist. Further research focusing on the valuation of goods and services is recommended, particularly in areas which currently could not be valued, including resilience and resistance, bioremediation of waste, biologically mediated habitat and option use.
• Aim: To provide examples of marine biodiversity value and the change in value if marine biodiversity improves or declines.
30
A significant limitation of this report was a lack of relevant natural science, social and economic data. Quantification of how values change with declining or improving biodiversity could not be undertaken due to insufficient information on the link between biodiversity and ecosystem function. The marine environment is extremely diverse and complex, and there are significant limitations in our scientific knowledge of the effects of marine biodiversity on ecosystem functioning, and for most services the importance of biodiversity can only be quantified in a limited number of habitats or for a limited number of species or functional types (Hooper et al.2005). Information linking biodiversity to the provision of goods and services, or ecosystem function, is essential if we are to fully understand the implications of declining biodiversity on the society and economy.
• Aim: To provide an economic valuation using marine biodiversity change scenarios.
At the outset of this project it was agreed that this final aim would not be achievable as suitable data from UK waters is not currently available to undertake detailed and comprehensive scenario analysis. There is a severe deficiency of UK case studies, particularly in the social sciences. Although values were standardised wherever possible, extrapolation will incur inaccuracies. Further UK site-specific research is strongly recommended in the future. The proposed Marine Protected Areas provide an ideal opportunity for case studies to potentially demonstrate the value of increasing biodiversity, and as such these areas should be monitored before and after designation.
31

Acknowledgements Many thanks to Tim Smyth, Mike Kendall and Annie Linley for their advice and support. Also thanks go to Kate Lock and all the CCW staff associated with Skomer MPA, and to Juan Brown of the Wildlife Trust of South West Wales. This report also benefited from discussions with Chris Frid and Odette Paramor, and the Defra team, including Shaun Mowat, Jo Myers, Dominic Whitmee, Angela Moffat and the external reviewers.
32
References Baretta, J.W., Ebenhöh, W., Ruardij, P. (1995) The European Regional Seas Ecosystem Model, a complex marine ecosystem model. Netherlands Journal of Sea Research 33: 233-246 Bateman, I.J. and Langford, I.H. (1997) Non-users Willingness to Pay for a National Park: An application and critique of the contingent valuation method. Regional Studies 31.6: 571-582 Beaumont, N. and Tinch, R. (2003) Goods and Services of Marine Benthic Biodiversity. CSERGE working paper, ECM 03-14 Bett, B.J. and Jacobs, C.L. (2000) RRS Charles Darwin cruise 119C leg B, 13 August-24 September 1999. White Zone (WhiZ) Environment survey: Seabed survey of the deep waters to the north and west of Shetland. Southampton Oceanography Centre Cruise report. Report to the department of Trade and Industry Bett, B.J. (2001) UK Atlantic Margin Environmental Survey: introduction and overview of bathyal benthic ecology. Continental Shelf Research 21:917-956 Bird, F.L., Ford, P.W., and Hancock, G.J. (1999) Effects of burrowing macrobenthos on the flux of dissolved substances across the water-sediment interface. Marine and Freshwater Research 50: 523-532 Birkett, D.A., MAggs, C., Dring, M.J. (1998) Maerl (volume V) An overview of dynamics and sensitivity characteristics for conservation management of marine SACs. Scottish Association for Marine Science (UK Marine SACs Project). 116 pages Blackford, J.C., Allen, J.I., Gilbert, F. (2004) Ecosystem dynamics at six contrasting sites: a generic modelling study. J Mar Sys 52: 191-215 Blackwell, M.S.A., Hogan, D.V., and Maltby, E. (2004) The short-term impact of managed realignment on soil environmental variables and hydrology. Estuarine, Coastal and Shelf Science 59: 687-701 Brampton, A.H. (1992) Engineering significance of British saltmarshes. In: Allen, J.R.L. and Pye, K. (eds.) Saltmarshes: morphodynamics, conservation and engineering significance. Cambridge University Press, pp 115-122 Breaux, A., Farber, S. and Day, J. (1995) Using Natural Coastal Wetlands to Wastewater Treatment: An Economic Benefit Analysis. Journal of Environmental Management 44: 285-291
33
Brito, D. (2005) The importance of sound biological information and theory for ecological economics studies valuing Brazilian biodiversity: A response to Mendonça et al. (2003). Ecological Economics 55: 5-10 Burchard, H., Bolding, K., Villareal M. (1999) GOTM–a general ocean turbulence model. Theory, applications and test cases. Technical Report EUR 18745 EN, European Commission Bystrom, O. (2000) The replacement value of wetlands in Sweden Environmental and Resource Economics 16: 347 – 362 CCW/WW/04/2 Countryside Council for Wales. Scallop survey 2004 CCW/WW/04/4 Countryside Council for Wales. Annual Report 2004 Chaudhuri, S.K., Lovley, D.R. (2003) Electricity generation by direct oxidation of glucose in mediatorless microbial fuel cells. Nature Biotechnology 21 (10): 1229-1232 Clarkson, R. and Deyes, K. (2002) Estimating the Social Cost of Carbon Emissions. Government Economic Service Working Paper 140, DEFRA, London. Coops, H., Geilen, N., Verheij, H.J., Boeter, R., and van der Velde, G., (1996) Interactions between wave, bank erosion and emergent vegetation: an experimental study in wave tanks. Aquatic Botany 53: 187-198 Costanza, R., d’Arge, R., de Groot, RS., Farber, S., Grasso, M., Hannon, B., Limburg, K., Naeem, S., O’Neill, R., Paruelo, J., Raskin, R., Sutton, P., van den Belt, M. (1997) The value of the world’s ecosystem services and natural capital. Nature 387: 253-260 Cote, D., Ollerhead, L.M.N., Gregory, R.S., Scruton, D.A. and McKinley, R.S (2002) Activity patterns of juvenile Atlantic cod (Gadus morhua) in Buckley Cove, Newfoundland. Hydrobiologia 483 (1-3): 121- 127 Dame, R., Bushek, D., Allen, D., Lewitus, A, Edwards, D., Koepfler, E., Gregory L. (2002) Ecosystem response to bivalve density reduction: management implications. Aquatic Ecology 36 (1): 51 - 65 Davidson, D.M. and Hughes, D.J. (1998) Zostera Biotopes (volume I). An overview of dymanics and sensitivity charaecteristics for conservation management of marine SACs. Scottish Assoiciation for Marine Science (UK Marine SACs Project). 95 pages Davis, A.T., Volesky, B., Alfonso, M. (2003) A review of biochemistry of heavy metal biosorption by brown algae. Water Research 37: 4311-4330
34
EC Council regulation (2004) no. 612/2004 of 22 March 2004 amending council regulation (EC) no. 850/98 as regards the protection of deep water coral reefs from the effects of trawling in an area north west of Scotland European Parliament Report (2004) The fishmeal and fish oil industry – its role in the Common Fisheries Policy. Fish 113, Feb 2004 Farber, S.C., Costanza, R., Wilson, M.A. (2002) Economic and ecological concepts for valuing ecosystem services. Ecological Economics 41: 375-392 Fonseca, M.S. and Cahalan, J.A. (1992) A preliminary evaluation of wave attenuation by four species of seagrass. Estuarine, Coastal and Shelf Science 35: 565-576 Frankignoulle, M., Bourge, I., Canon, C., and Dauby, P. (1996) Distribution of surface seawater partial CO2 pressure in the English Channel and in the Southern Bight of the North Sea. Continental Shelf Research 16(3): 381-395 Gage, J.D. (2001) Deep-sea benthic community and environmental impact assessment at the Atlantic Frontier. Continental Shelf Research 21 (8): 957-986(30) Gotceitas, V., Fraser, S. Brown, J.A. (1997) Use of eelgrass beds (Zostera marina) by juvenile Atlantic cod(Gadus morhua). Canadian Journal of Fisheries and Aquatic Sciences 54: 1306-1319 Gren, I.M. (1995) The Value of Investing in Wetlands for Nitrogen Abatement. European Review of Agricultural Economics 22: 157-172 Groot, R.S., Wilson, M.A. and Boumans, R.M.J. (2002) A typology for the classification, description and valuation of ecosystem functions, goods and systems. Ecological Economics 41 (3): 393-408 Gutiérrez, J.L., Jones, C.G., Strayer, D.L., Iribarne, O.O. (2003) Molluscs as ecosystem engineers: the role of shell production in aquatic habitats. Oikos 101:79-90 Hageman, R. (1985) Valuing Marine Mammal Populations: Benefit Valuations in a Multi-species Ecosystem. National Marine Fisheries Service, Southwest Fisheries Centre, La Jolla, California, 1985, pp. 88 Hall-Spencer, J.M., Grall, J., Moore, P.G. (2003) Bivalve fishing and maerl-bed conservation in France and the UK--retrospect and prospect Atkinson. Aquatic Conservation: Marine and Freshwater Ecosystems 13:S33-S41
35
Hansen, K. and Kristensen, E. (1998) The impact of the polychaete Nereis diversicolor and enrichment with macroalgal (Chaetomorpha linum) detritus on benthic metabolism and nutrient dynamics in organic-poor and organic- rich sediment. Journal of Experimental Marine Biology and Ecology 231(2): 201-223 Hooper, D.U., Chapin, F.S., Ewel, J.J., Hector, A., Inchausti, P., Lavorel, S., Lawton, J.H., Lodge, D.M., Loreau, M., Naeem, S., Schmid, B., Setala, H., Symstad, A.J., Vandermeer, J., Wardle, D.A. (2005) Effects of biodiversity on ecosystem functioning: A consensus of current knowledge. Ecological Monographs 75 (1): 3-35 Howe, R. L., Rees, A. P. and Widdicombe, S. (2004) The Impact of two species of bioturbating shrimp (Callianassa subterranea and Upogebia deltaura) on sediment denitrification. Journal of the Marine Biological Association of the United Kingdom 84 (3): 629-632 Hughes, R.G. and Paramor, O.A.L. (2004) On the loss of saltmarshes in south-east England and methods for their restoration. Journal of Applied Science 41: 440-448 Hughes, T.P. and Stachowicz, J.J. (2004) Genetic diversity enhances the resistance of a seagrass ecosystem to disturbance. Proc. Natl. Acad. Sci. USA 101: 8998-9002 Hughes, T.P., Bellwood, D.R., Folke, C., Steneck, R.S., Wilson, J. (2005) New paradigms for supporting the resilience of marine ecosystems. Trends in Ecology and Evolution 20 (7): 380-386 Hutchins, D.A, and Bruland, K.W. (1995) Fe, Zn, Mn, and N transfer between size classes in a coastal phytoplankton community: Trace metal and major nutrient recycling compared. Journal of Marine Research 53: 297-313 Iyer, A., Mody, K., and Jha, B. (2005) Biosorption of heavy metals by marine bacterium. Marine Pollution Bulletin 50: 240-243 Jackson, C.M., Kamenos, N.A., Moore, P.G., Young, M. (2004) Meiofaunal bivalves in maerl and other substrata; their diversity and community structure. Ophelia 58(1): 49-60 Joint, I., and Groom, S.B. (2000) Estimation of phytoplankton production from space: current status and future potential of satellite remote sensing. Journal of Experimental biology and Ecology 250: 233-255. Jones, C.G., Lawton, J.H., Shachak, M.(1994) Organisms as ecosystem engineers. Oikos 69 (3): 373-386
36
Jones, C.G., Lawton, J.H., Shachak, M.(1997) Positive and negative effects of organisms as physical ecosystem engineers. Ecology 78 (7): 1946-1957 Kamenos, N.A., Moore, P.G., Hall-Spencer, J.M. (2004a) Attachment of the juvenile queen scallop(Aequipecten opercularis(L.)) to maerl in mesocosm conditions; juvenile habitat selection. Journal of Experimental Marine Biology and Ecology 306:139-155 Kamenos, N.A., Moore, P.G., Hall-Spencer, J.M. (2004b) Nursery-area function of maerl grounds for juvenile queen scallops Aequipecten opercularis and other invertebrates. Mar Ecol Prog Ser 274:183-189 Kamenos, N.A., Moore, P., Hall-Spencer, J.M. (2004c) Small-scale distribution of juvenile gadoids in shallow inshore waters; what role does maerl play? ICES J Mar Sci 61:422-429 Kettunen, M. and ten Brink, P. (2006) Value of biodiversity – Documenting EU examples where biodiversity loss has led to the loss of ecosystem services. Final report for the European Commission. Institute for European Environmental Policy (IEEP), Brussels, Belgium. 131pp King, S.E., and Lester, J.N. (1995) The value of saltmarsh as a sea defence. Marine Pollution Bulletin 30: 180-189 Kristensen, E. (1985) Oxygen and Inorganic Nitrogen Exchange in a Nereis virens (Polychaeta) Bioturbated Sediment-Water System. Journal of Coastal Research 1(2): 109-116 Kristensen, E. (1989) Oxygen and Carbon-Dioxide Exchange in the Polychaete Nereis Virens: Influence of Ventilation Activity and Starvation. Marine Biology 101(3): 381-388
Ledoux, L. and Turner, R.K. (2002) Valuing ocean and coastal resources: a review of practical examples and issues for further action. Ocean and Coastal Management 45: 583-616
Legendre, L., and Rivkin, R.B. (2005) Integrating functional diversity, food web processes, and biogeochemical carbon fluxes into a conceptual approach for modelling the upper ocean in a high-CO2 world. Journal of Geophysical Research 110: C09S17 Lintas, C. and Seed, R. (1994) Spatial variation in the fauna associated with Mytilus edulis on a wave-exposed rocky shore. Journal of Molluscan Studies 60: 165-174 Loomis, J.B. and White, D.S. (1996) Economic benefits of rare and endangered species: summary and meta-analysis. Ecological Economics 18(3):197-206
37
Marine and Coastal Environment Group (2004) Marine archaeology and cultural heritage. Legislation Briefing Paper No. 9. Marine and Coastal Environment Group, Cardiff University Jan 2004 Millenium Ecosystem Assessment (2006) Ecosystems and Human Well-being: A Framework for Assessment. Chapter 2: Ecosystems and Their Services. http://www.millenniumassessment.org/ Mills, M.A., Bonner, J.S., McDonald T.J., Page, C.A. and Autenrieth R.L. (2003) Intrinsic bioremediation of a petroleum-impacted wetland. Marine Pollution Bulletin 46: 997-899 Möller, I., Spencer, T., and French, J.R. (1996) Wind wave attenuation over saltmarsh surfaces: preliminary results from Norfolk, England. Journal of Coastal Research 12: 1009-1016 Morris, R.K.A., Reach, I.S., Duffy, M.J., Collins, T.S., and Leafe, R.N. (2004) On the loss of saltmarshes in south-east England and the relationship with Nereis diversicolor. Journal of Applied Science 41: 787-791 Murphy, M.L., Johnson, S.W., Csepp, D.J. (2000) A comparison of fish assembalgges in Eelgrass and adjacent subtidal habitats near Craig, Alaska. Alaskan Fishery Research Bulletin 7: 11-21 Norderhaug, K.M., Christie, H., Rinde, E. (2002) Colonisation of Kelp imitations by epiphyte and holdfast fauna; a study of mobility patterns. Marine Biology 141: 965-973 Orth, R.J., Heck, K.L., van Montfrans, J. (1984) Faunal communities in seagrass beds: a review of the influence of plant structure and prey characteristics on predator-prey relationships. Estuaries 7 (4a): 339-350 Oxley, I. (2001) Towards the integrated management of Scotland's cultural heritage: Examining historic shipwrecks as marine environmental resources. World Archaeology 32 (3): 413-426 Paramor, O.A.L., and Hughes, R.G. (2004) The effects of bioturbation and herbivory by the polychaete Nereis diversicolor on the loss of saltmarsh in south-east England. Journal of Applied Science 41: 449-463 Parker, A. R., McPhedran, R.C., McKenzie, D. R., Botten, L. C. and Nicorovici, N. A. (2001) Photonic engineering: Aphrodite's iridescence. Nature 409: 36-37 Pascucci, P.R. and Kowalak, A.D. (1999) Metal Distribution in Complexes with Chlorella vulgaris in Seawater and Wastewater. Water Environmental Research 71: 1165-1170.
38
Patterson, M. and Cole, A. (1999) Assessing the value of New Zealand’s biodiversity. School of Resource and Environmental Planning, Massey University, February 1999. Pearce, D.W. and Turner, R.K. (1990) Economics of natural resources and the environment. Harvester Wheatsheaf Pearson, T.H., and Rosenberg, R. (1978) Macrobenthic succession in relation to organic enrichment and pollution of the marine environment. Oceanography and Marine Biology Annual Review 16: 229-311 Pimentel, D, Wilson, C, McCullum, C, Huang, R, Dwen, P, Flack, J, Tran, Q, Saltman, T, Cliff, B (1997) Economic and environmental benefits of biodiversity. Bioscience 47 (11): 747-757 Perrins, C.M., and Smith, S.B. (2000) The breeding Larus gulls on Skomer Island National Nature Reserve, Pembrokeshire. Journal of Animal Ecology 70: 527-535 Poole, J. (1995) Changes in the diet of Great Black-backed Gulls Larus marinus on Skomer Island 1958-1992. Seabird 17: 50-55. Porter, E.T., Cornwell, J.C., Sanford, L.P. (2004) Effect of oysters Crassostrea virginica and bottom shear velocity on benthic-pelagic coupling and estuarine water quality. Marine Ecology-Progress Series 271: 61-75 Pugh, D. and Skinner, L. (2002) A new analysis of marine-related activities in the UK economy with supporting science and technology. IACMST Information Document No. 10 August 2002 Reusch, T.B.H., Ehlers, A., Hämmerli, A.and Worm, B. (2005) Ecosystem recovery after climatic extremes enhanced by genotypic diversity. Proc Natl Acad Sci USA 102: 2826-2831 Richard, D. et al (1991) Waste water reclamation costs and water reuse revenue. Prepared for the American Water Resources Association 1991 Summer Symposium: Water Supply and water Reuse: 1991 and beyond. San Diego, CA. Rosenberg, R. (2001) Marine benthic faunal successional stages and related sedimentary activity. Scientific Marina 65( 2): 107-119. Ross, I.M. and Wyeth, P. (1997) Sharp concepts, or just another boring bivalve? http://www.rdg.ac.uk/biomim/97ross.htm Centre for Biomimetics, The University of Reading Runge, J.A. (1988) Should we expect a relationship between primary production and fisheries? The role of copepod dynamics as a filter of trophic variability. Hydrobiologia 167/168: 61-71
39
Seed, R. and Suchanek, T.H. (1992) Population and community ecology of Mytilus. In The Mussel Mytilus: ecology, physiology, genetics and culture (ed. E.M. Gosling), pp 87-168, Amsterdam, Elsevier Press. Seitzinger, S.P., and Nixon, S.W. (1985) Eutrophication and the rate of denitrification and N2O production in coastal marine sediments. Limnology and Oceanography 30(6): 1332-1339 Self, D. (2005) Killing Cancer? Mote Magazine, http://www.mote.org/ Sheppard, C. (2006) The muddle of 'biodiversity'. Marine Pollution Bulletin 52 (2): 123-124 Shorney, B. (2004) Research into the economic contribution of sea angling. 71 pages. Commissioned by the Economics and Statistics Group of DEFRA and carried out by Drew Associates Ltd., March 2004 Simpson, R.D., Sedjo, R.A., Reid, J.W. (1996) Valuing biodiversity for use in pharmaceutical research. Journal of Political Economy 104 (1): 163-185 Smith, V.H., Tilman, G.D., Nekola, J.C. (1999) Eutrophication: impacts of excess nutrient inputs on freshwater, marine, and terrestrial ecosystems. Environmental Pollution 100 (1-3): 179-196 Smyth, T.J., Tilstone, G.H., and Groom, S.B. (2005). Integration of radiative transfer into satellite models of ocean primary production. Journal of Geophysical Research 110: C10014. Steneck, R.S., Graham, M.H., Bourque, B.J., Corbett, D., Erlandson, J.M., Estes, J.A., Tegner, M.J. (2002) Kelp forest ecosystems: biodiversity, stability, resilience and future. Environmental Conservation 29 (4): 436-459 Steneck, R.S., Vavrinec, J., Leland, A.V. (2004) Accelerating trophic-level dysfunction in kelp forest ecosystems of the western North Atlantic. Ecosystems 7 (4): 323-332 Stevens, B.G. and Armstrong, D.A. (1984) Distribution, Abundance, and Growth of Juvenile Dungeness Crabs, Cancer magister, in Grays Harbor Estuary, Washington. Fishery Bulletin 82 (3): 469-483 Suchanek, T.H. (1980) Diversity in natural and artifical mussel bed communities of Mytilus Californianus. American Zoologist 20: 807 Thayer, G.W., Wolfe, D.A. Williams, R.B. (1975) The impact of Man on Seagrass. American Scientist 63: 288-296
40
Tilman, D., Reich, P.B., Knops, J.M.H. (2006) Biodiversity and ecosystem stability in a decade-long grassland experiment. Nature 441 (7093): 629-632 Vierira, R.H.S.F., and Volesky, B. (2000) Biosorption: a solution to pollution? International Microbiology 3: 17-24 Widdicombe, S. and Austen, M.C. (1998) Experimental evidence for the role of Brissopsis lyrifera (Forbes, 1841) as a critical species in the maintenance of benthic diversity and the modification of sediment chemistry. Journal of Experimental Marine Biology and Ecology 228(2): 241-255 Williams, E., Firn, J.R., Kind, V., Roberts, M., McGlashan, D. (2003) The value of Scotland’s Ecosystem Services and Natural Capital. European Environment 13: 67-78 Wilson, J.B. (1979) The distribution of the coral Lophelia pertusa (L.) [L. prolifera (Pallas)] in the North East Atlantic. Journal of the Marine Biological Association of the UK 59: 149-164 Woodward, R.T. and Wui, Y-S (2001) The economic value of wetland services: a meta-analysis. Ecological Economics 37: 257-270 www.bbc.co.uk/wales/southwest/nature/thingstodo/walks/pages/skomer3.shtml (2006) www.unep-wcmc.org/index.html?http://sea.unep-wcmc.org/latenews/emergency/milford_haven/milford.intro.html~main (2006)
41
Annex 1: Valuation techniques Several reviews of valuation techniques exist (see for example Ledoux and Turner 2002), and as such only a brief overview of the techniques applied is provided.
• Market-based methods are used to determine the value of food provision, raw materials, leisure and recreation, and cognitive benefits arising from UK marine biodiversity. Market based values are, however, not always representative of the true value of a resource. For example, in the case of food provision, the estimated value of £513 million does not include the added value of fish processing. Further revenue and employment were created through the fish processing industry, retail sales, and exports. Unreported catches (e.g. illegal fishing and recreational fishing), which may be considerable, are also not included in the estimated value.
• Cost-based techniques are applied to estimate the value of nutrient
cycling, gas and climate regulation, and disturbance prevention and alleviation. These techniques determine the costs to man in providing a proxy for the environmental function, such as, replacement costs, damage costs, and avoidance expenditure. This is not an ideal measure of value as, for example, the cost of replacing a function is not the same concept as the value that the function provides. In addition, in the case of nutrient cycling the replacement of this function is not possible, this it could be argued that this renders the value meaningless.
• Stated preference techniques are used to estimate the non-use value
of UK marine biodiversity. This is the only method available for determining non-use values and generally involves the use of questionnaires to determine individuals preferences for environmental goods and services, for example by asking their willingness to pay, or willingness to accept, a specific change in the environment. Limitations of stated preference techniques include protest bids, information bias, the fact respondents may not consider their income as a realistic constraint, free riding and non-response bias.
In the case of the cost-based and stated preference techniques values are provided on a per area, or per person, basis and then multiplied up to a UK scale. Problems with this approach include:
• Environment types not being uniform, for example a wetland in Cornwall may be very different to a wetland in Renfrewshire;
• the values do not take into account variations in per unit value as the environment is exploited, for example as an environment or resource is diminished it’s value may increase, and vice versa;
42
• multiplying the values up entails designating boundaries on the UK marine environment, and as many marine processes and organisms are mobile this is not realistic.
Despite the limitations of these techniques, at present we have no other way of determining values for things which don’t have an explicit market (monetary) value, for example biodiversity. The monetary figures presented in this report are all the best estimates currently available, and it is argued that it is better to have an estimated monetary value than to present no value. References Ledoux, L. and Turner, R.K. (2002) Valuing ocean and coastal resources: a review of practical examples and issues for further action. Ocean and Coastal Management 45: 583-616
43
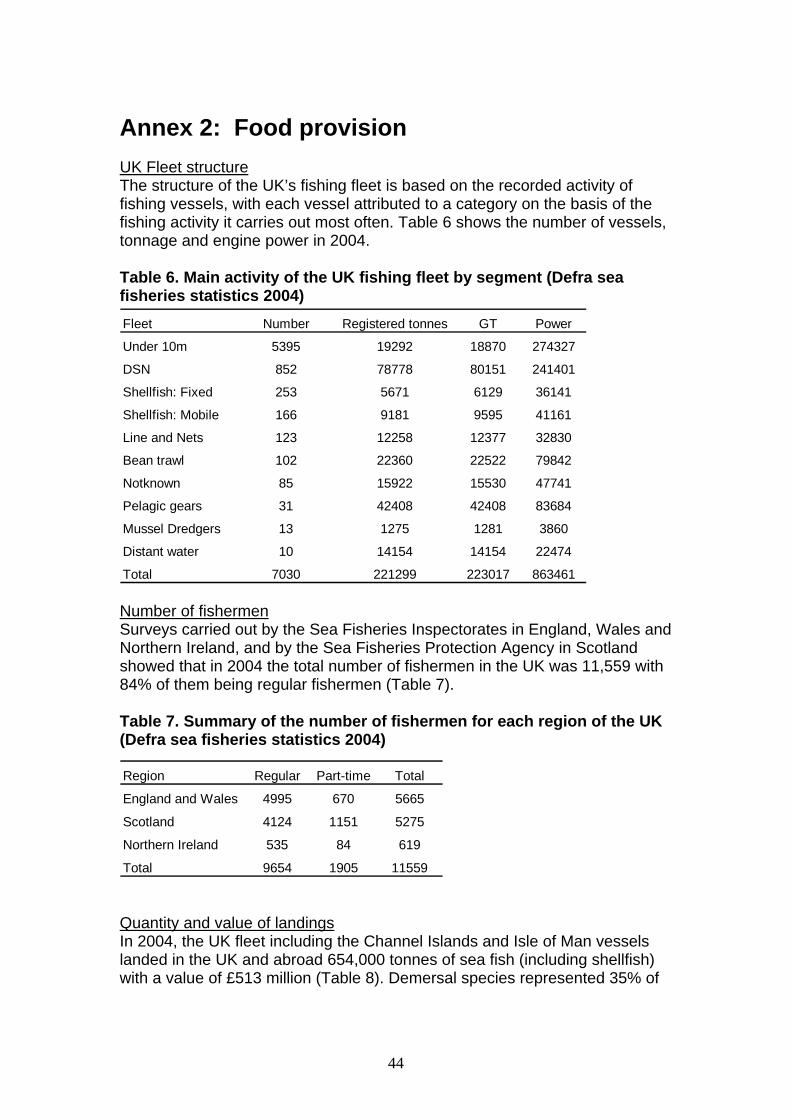
Annex 2: Food provision UK Fleet structure The structure of the UK’s fishing fleet is based on the recorded activity of fishing vessels, with each vessel attributed to a category on the basis of the fishing activity it carries out most often. Table 6 shows the number of vessels, tonnage and engine power in 2004. Table 6. Main activity of the UK fishing fleet by segment (Defra sea fisheries statistics 2004) Fleet Number Registered tonnes GT Power
Under 10m 5395 19292 18870 274327
DSN 852 78778 80151 241401
Shellfish: Fixed 253 5671 6129 36141
Shellfish: Mobile 166 9181 9595 41161
Line and Nets 123 12258 12377 32830
Bean trawl 102 22360 22522 79842
Notknown 85 15922 15530 47741
Pelagic gears 31 42408 42408 83684
Mussel Dredgers 13 1275 1281 3860
Distant water 10 14154 14154 22474
Total 7030 221299 223017 863461 Number of fishermen Surveys carried out by the Sea Fisheries Inspectorates in England, Wales and Northern Ireland, and by the Sea Fisheries Protection Agency in Scotland showed that in 2004 the total number of fishermen in the UK was 11,559 with 84% of them being regular fishermen (Table 7). Table 7. Summary of the number of fishermen for each region of the UK (Defra sea fisheries statistics 2004)
Region Regular Part-time Total
England and Wales 4995 670 5665
Scotland 4124 1151 5275
Northern Ireland 535 84 619
Total 9654 1905 11559 Quantity and value of landings In 2004, the UK fleet including the Channel Islands and Isle of Man vessels landed in the UK and abroad 654,000 tonnes of sea fish (including shellfish) with a value of £513 million (Table 8). Demersal species represented 35% of
44
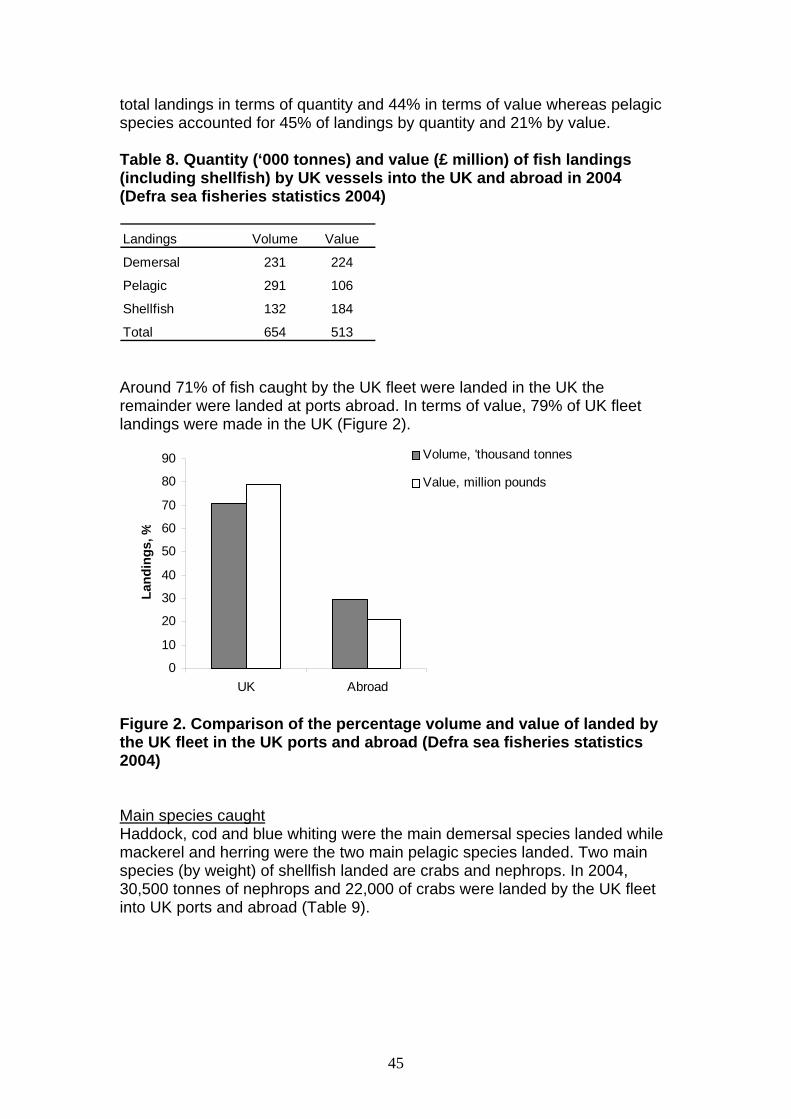
total landings in terms of quantity and 44% in terms of value whereas pelagic species accounted for 45% of landings by quantity and 21% by value. Table 8. Quantity (‘000 tonnes) and value (£ million) of fish landings (including shellfish) by UK vessels into the UK and abroad in 2004 (Defra sea fisheries statistics 2004)
round 71% of fish caught by the UK fleet were landed in the UK the fleet
(Defra sea fisheries statistics
ain species caught
Landings Volume Value
Demersal 231 224
Pelagic 291 106
Shellfish 132 184
Total 654 513
Aremainder were landed at ports abroad. In terms of value, 79% of UK landings were made in the UK (Figure 2).
the UK fleet in the UK ports and abroad
0
10
20
30
40
50
60
70
80
90
UK Abroad
Land
ings
, %
Volume, 'thousand tonnes
Value, million pounds
Figure 2. Comparison of the percentage volume and value of landed by
2004) M
addock, cod and blue whiting were the main demersal species landed while were the two main pelagic species landed. Two main
Hmackerel and herring species (by weight) of shellfish landed are crabs and nephrops. In 2004, 30,500 tonnes of nephrops and 22,000 of crabs were landed by the UK fleetinto UK ports and abroad (Table 9).
45
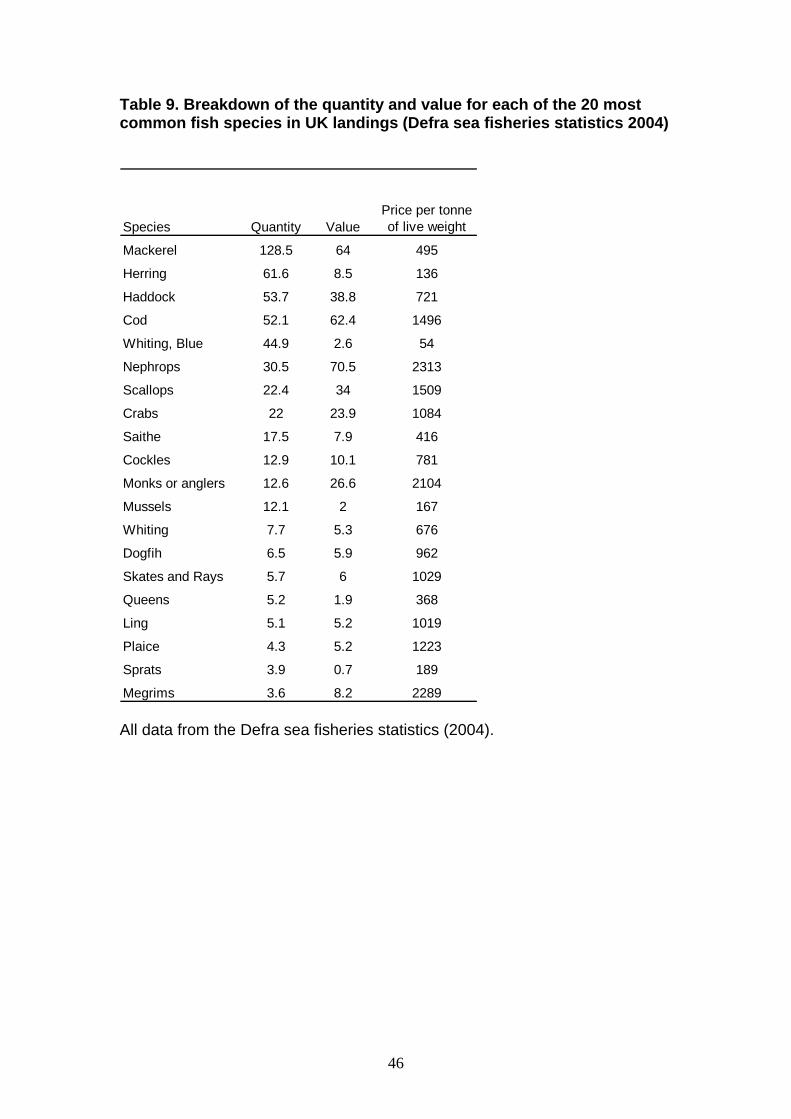
Table 9. Breakdown of the quantity and value for each of the 20 most ommon fish species in UK landings (Defra sea fisheries statistics 2004) c
All data from the Defra sea fisheries statistics (2004).
Species Quantity ValuePrice per tonne of live weight
Mackerel 128.5 64 495
Herring 61.6 8.5 136
Haddock 53.7 38.8 721
Cod 52.1 62.4 1496
Whiting, Blue 44.9 2.6 54
Nephrops 30.5 70.5 2313
Scallops 22.4 34 1509
Crabs 22 23.9 1084
Saithe 17.5 7.9 416
Cockles 12.9 10.1 781
Monks or anglers 12.6 26.6 2104
Mussels 12.1 2 167
Whiting 7.7 5.3 676
Dogfih 6.5 5.9 962
Skates and Rays 5.7 6 1029
Queens 5.2 1.9 368
Ling 5.1 5.2 1019
Plaice 4.3 5.2 1223
Sprats 3.9 0.7 189
Megrims 3.6 8.2 2289
46
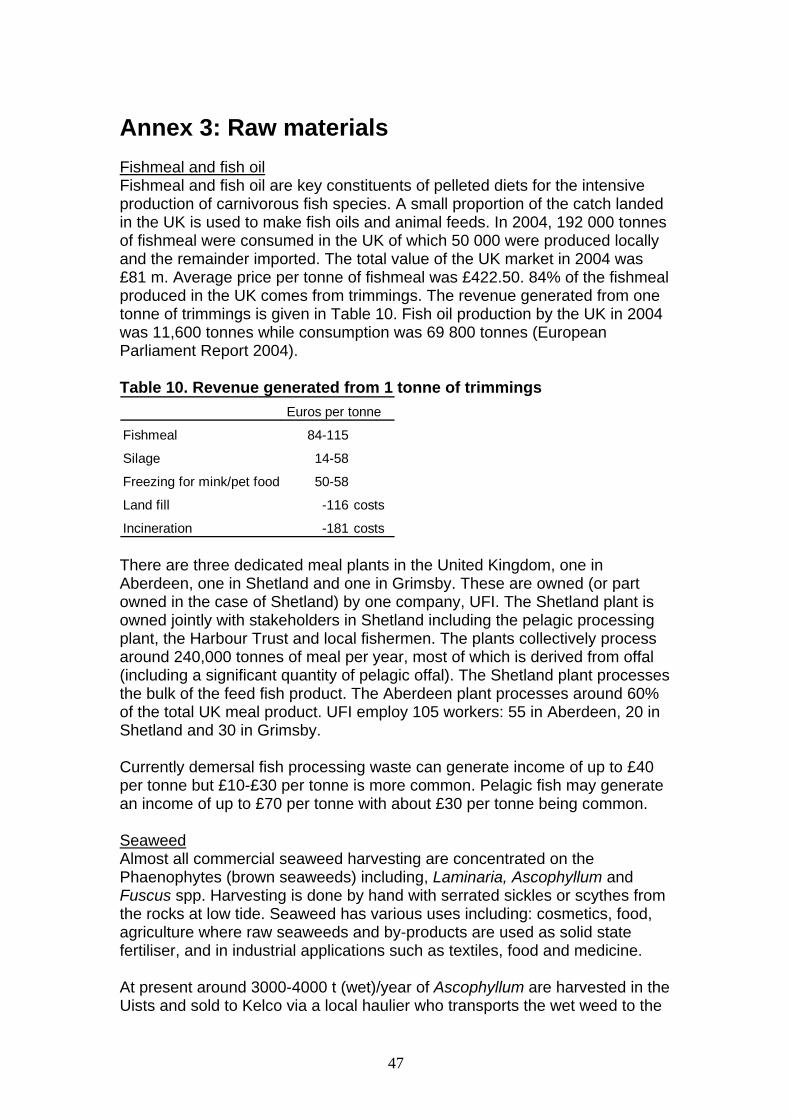
Annex 3: Raw materials Fishmeal and fish oil Fishmeal and fish oil are key constituents of pelleted diets for the intensive production of carnivorous fish species. A small proportion of the catch landed in the UK is used to make fish oils and animal feeds. In 2004, 192 000 tonnes of fishmeal were consumed in the UK of which 50 000 were produced locally and the remainder imported. The total value of the UK market in 2004 was £81 m. Average price per tonne of fishmeal was £422.50. 84% of the fishmeal produced in the UK comes from trimmings. The revenue generated from one tonne of trimmings is given in Table 10. Fish oil production by the UK in 2004 was 11,600 tonnes while consumption was 69 800 tonnes (European Parliament Report 2004). Table 10. Revenue generated from 1 tonne of trimmings
here are three dedicated meal plants in the United Kingdom, one in part
s
urrently demersal fish processing waste can generate income of up to £40
eaweed
Euros per tonne
Fishmeal 84-115
Silage 14-58
Freezing for mink/pet food 50-58
Land fill -116 costs
Incineration -181 costs TAberdeen, one in Shetland and one in Grimsby. These are owned (or owned in the case of Shetland) by one company, UFI. The Shetland plant isowned jointly with stakeholders in Shetland including the pelagic processing plant, the Harbour Trust and local fishermen. The plants collectively process around 240,000 tonnes of meal per year, most of which is derived from offal (including a significant quantity of pelagic offal). The Shetland plant processethe bulk of the feed fish product. The Aberdeen plant processes around 60% of the total UK meal product. UFI employ 105 workers: 55 in Aberdeen, 20 in Shetland and 30 in Grimsby. Cper tonne but £10-£30 per tonne is more common. Pelagic fish may generatean income of up to £70 per tonne with about £30 per tonne being common. S
commercial seaweed harvesting are concentrated on the and
om
At present around 3000-4000 t (wet)/year of Ascophyllum are harvested in the Uists and sold to Kelco via a local haulier who transports the wet weed to the
Almost all Phaenophytes (brown seaweeds) including, Laminaria, AscophyllumFuscus spp. Harvesting is done by hand with serrated sickles or scythes frthe rocks at low tide. Seaweed has various uses including: cosmetics, food, agriculture where raw seaweeds and by-products are used as solid state fertiliser, and in industrial applications such as textiles, food and medicine.
47
Girvan plant. The numbers of people currently employed in supplying seaweed from the Western Isles to outside buyers are 20-26 regular and 35 occasional. The value of wet Ascophyllum and air-dried tangle from theWestern Isles delivered to Kelco's alginate production plants on mainland Scotland is believed to be of the order of £200,000-£250,000 per annumincome for harvesters/collectors representing some £80,000-£90,000 (32-45%) of this figure. Revenues for the Keose operations are less certain; a speculative estimate would put these somewhere between £70,000 and £200,000. In very broad terms then, total gross income from seaweed in 19would appear to lie somewhere between £270,000-£450,000, with a probability that the true figure lies towards the lower end of this range. In the UK the market leader in the production of seaweed based fertilise
, with
94
rs is axicrop International Ltd who market a natural extract and also use this as a
as an ingredient in animal feedstuffs and as a fodder upplement, although this market is now in decline. While Ascophyllum has
ids, are used in the anufacture of cosmetic products including soaps, shampoos, powders,
ome ll,
d n seaweed
rliament Report (2004) The fishmeal and fish oil industry – its le in the Common Fisheries Policy. Fish 113, Feb 2004
Mbase for a range of seaweed based fertilisers suited to different crops, plants and soil conditions. Maxicrop export to a variety of countries. Like many of their competitors they use dried seaweed meal produced from Ascophyllum as their raw material. Seaweed is used both straditionally been used in this area, there is no evidence to suggest it is moreeffective than other algae, and it is not likely to be profitable to pursue diversification into the market for animal feedstuffs. Ground or powdered seaweed, as well as phycocollomcreams and sprays. Very often the algal content of such products will be small, even where the use of seaweed is highlighted in the marketing of aproduct. A variety of seaweeds are used in cosmetics. Among the brown algae Laminaria spp are among the most common, although the bladder wracks such as Fucus vesiculosus and Ascophyllum nodosum are also utilised. Chondrus crispus, Mastocarpus stellatus and Porphyra spp are sof the red algae which may be employed as cosmetic ingredients. Overathough, the quantities of seaweed used in this sector are minimal. Wholesalers/suppliers in this sector are thought to pay ca £1/kg for seaweemeal made from fucoids. Laminarians can be more valuable, as cawhich is further processed beyond a basic meal. Generally UK suppliers only stock small quantities of seaweed. It is possible to sell direct to some manufacturers of cosmetic products. References European Paro
48
Annex 4: Nutrient cycling Nutrient cycling encourages productivity, including fisheries productivity, by making the necessary nutrients available to all levels of the food chains and webs. A large amount of nutrient cycling occurs within the pelagic systems and is highly efficient as these systems are nutrient limited. For example, in stratified waters particulate organic carbon generated during primary production will often be remineralised above the pycnocline. In shelf and coastal waters, benthic systems are a major source of nutrients for the overlying water (Hopkinson et al. 2001) and are estimated to supply up to 100% (Sündback 2003) of the total nutrients used in water column productivity. This ‘benthic-pelagic coupling’ plays a major role in determining the production and biological structure of pelagic systems (Valiela 1995). Regenerated nutrients stimulate pelagic bacterial and phytoplankton production, which stimulates zooplankton production and this perpetuates up the food chain (Wainright 1987) and ultimately influence fisheries and other goods and services. Marine biodiversity plays an important role in regulating nutrient cycling, and variations in biodiversity can change the rate of nutrient cycling, although the direction and degree of these changes will depend upon the species affected. Although nutrient cycling is microbially driven many larger marine organisms stimulate the rate at which it occurs and hence are a vital element of the nutrient cycling process. Marine benthic species play an important role regulating the flow of nutrients through marine ecosystems (Sündback 2003, Rhoads 1973). The rate and extent of the degradation, preservation and burial of organic matter in the sediment depends on bioturbation, which is the physical activity of organisms as they feed on, and move and/or burrow through the sediment that has physico-chemical effects on the sediment. Denitrification has also been shown to increase due to the bioturbatory activity of many organisms (De Roach et al. 2002, Webb and Eyre 2004, Sayama and Kurihara 1983). By constructing burrows and tubes, bioturbating fauna significantly increase the surface area of the sediment-water interface and also continuously translocate material between reaction zones (oxic and anoxic) (Kristensen 1984). In addition the ventilation activity of bioturbating fauna affects solute transport and water movement in which inorganic nutrients are dissolved, Kristensen (1984). The overall result of this activity is that the rate of nutrient exchange is increased. References: De Roach, R. J., Rate, A.W., Knott, B. and Davies, P.M. (2002) Denitrification activity in sediment surrounding polychaete (Ceratonereis aequisetis) burrows. Marine and Freshwater Research 53(1): 35-41 Hopkinson, C. S., Giblin, A. E. and Tucker, J. (2001) Benthic metabolism and nutrient regeneration on the continental shelf of Eastern Massachusetts, USA. Marine Ecology Progress Series 224: 1-19
49
Kristensen, E. (1984) Effect of Natural Concentrations on Nutrient Exchange between a Polychaete Burrow in Estuarine Sediment and the Overlying Water. Journal of Experimental Marine Biology and Ecology 75(2): 171-190 Rhoads, D.C. (1973) The influence of deposit-feeding benthos on water turbidity and nutrient recycling. American Journal of Science 273: 1-22 Sayama, M. and Kurihara, Y. (1983) Relationship between Burrowing Activity of the Polychaetous Annelid, Neanthes-japonica (Izuka) and Nitrification Denitrification Processes in the Sediments. Journal of Experimental Marine Biology and Ecology 72(3): 233-241 Sündback, K. Miles, A., Hulth, S., Pihl, L., Engstrom, P., Selander, E., Svenson, A. (2003) Importance of benthic nutrient regeneration during initiation of macroalgal blooms in shallow bays. Marine Ecology Progress Series 246: 115-126 Valiela, I. (1995) Marine Ecological Processes, 2nd Edition. Springer Wainright, S. (1987) Stimulation of heterotrophic microplankton production by resuspended marine sediments. Science 238: 1710-1712 Webb, A. P. and Eyre, B. D (2004) The effect of natural populations of the burrowing and grazing soldier crab (Mictyris longicarpus) on sediment irrigation, benthic metabolism and nitrogen fluxes. Journal of Experimental Marine Biology and Ecology 309(1): 1-19
50
Annex 5: Gas and climate regulation The marine exchange of carbon dioxide (CO2) is primarily determined by the difference in partial pressure across the air-sea interface (Kaltin and Anderson 2005). However, biotic influences can reduce the pressure of CO2 in the water, increasing its rate of uptake (Álvarez et al. 1999). The reduction in partial pressure occurs during primary production where carbon fixation results in the conversion of CO2 into organic compounds. This production and the diffusion of atmospheric CO2 into the surface waters are known collectively as the ‘Biological Carbon Pump’ (Volk and Hoffert 1985). By uptaking CO2, marine systems have the ability to sequester carbon and act as a sink a proportion of which will be stored in sediments. The significance of marine systems in climate control through the regulation of carbon fluxes is of great importance. Globally the oceans play a large role in the cycling of carbon, storing an estimated forty-thousand gigatons (Grace 2004). Marine flora and fauna are of fundamental importance in carbon cycling (Hoppema 1991, Kaltin and Anderson 2005). The pelagic food web plays a vital role, not only in regulating the exchange of CO2 between the atmosphere and the ocean, but also in the downward transport of organic carbon and the transfer of organic carbon between species (Legendre and Rivkin 2002, Legendre and Rivkin 2005). The extent of phytoplankton production determines the upper limit of carbon which can be transferred or exported (Levinsen and Nielsen 2002). The size structure, nutritional status and taxonomic composition of the primary producers also determines how carbon is transferred into the rest of the food web and what proportion is lost from the system (Legendre and Rivkin 2002, 2005). The export of carbon from pelagic ecosystems is largely determined by the size structure of primary producer organisms and how this component of the food chain then interacts with grazing organisms (Legendre and Rassoulzadegan 1996). Herbivory in the surface water layers controls the quantity of suspended biomass and often results in decreased carbon supply to the bottom waters and sediment. Carnivores have been shown to reverse this, giving rise to increased carbon export (Wassman 1993). Some carbon from the pelagic surface layers will be exported to the sediment surface through sinking (Suess 1980). A proportion of this deposited organic matter that survives bacterial degradation is accumulated and eventually stored in marine sediments. The quantity of carbon storage (the percentage of organic matter) in the sediment is highly related to the rate of sedimentation (Ingall and van Capellen 1990) with high sedimentation leading to higher storage (Betts and Holland 1991). Benthic biodiversity can affect the amount of carbon which remains stored in the sediment. The activity of benthic species such as the polychate worm Nereis virens can increase the rate at which particulate organic carbon is decomposed in the sediment (Kristensen and Blackburn 1987). This in turn, increases the flux of carbon dioxide back into the water column.
51
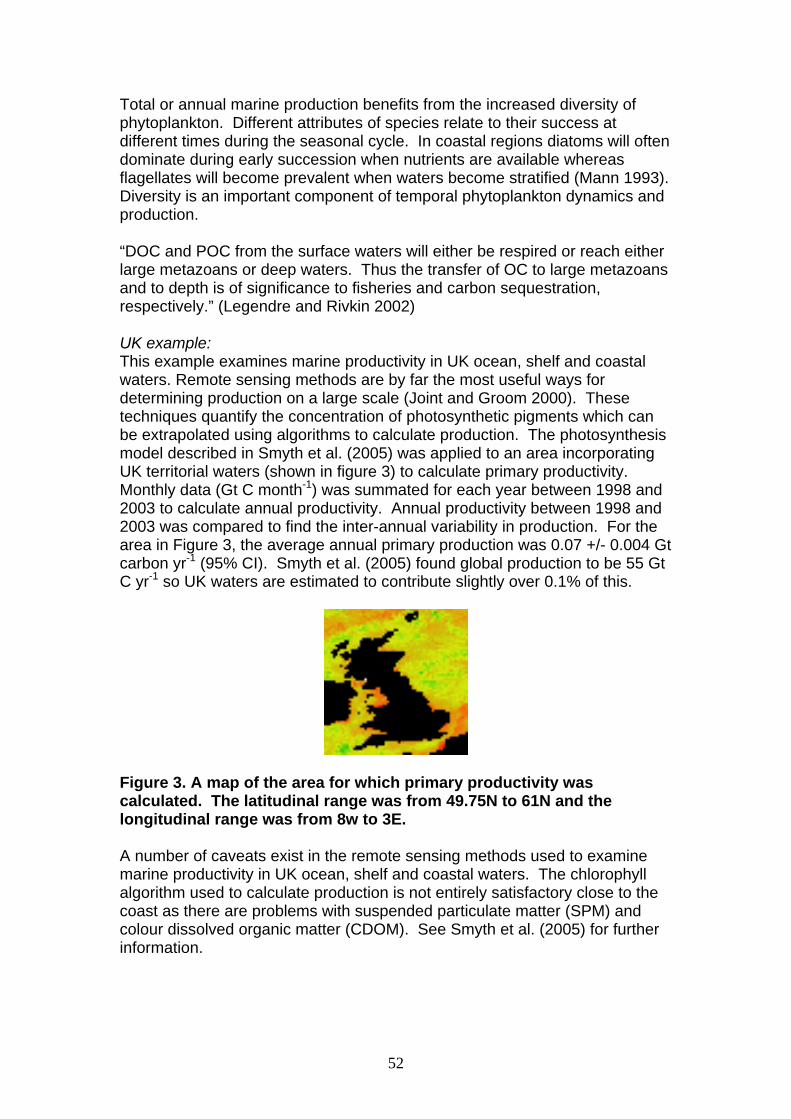
Total or annual marine production benefits from the increased diversity of phytoplankton. Different attributes of species relate to their success at different times during the seasonal cycle. In coastal regions diatoms will often dominate during early succession when nutrients are available whereas flagellates will become prevalent when waters become stratified (Mann 1993). Diversity is an important component of temporal phytoplankton dynamics and production. “DOC and POC from the surface waters will either be respired or reach either large metazoans or deep waters. Thus the transfer of OC to large metazoans and to depth is of significance to fisheries and carbon sequestration, respectively.” (Legendre and Rivkin 2002) UK example: This example examines marine productivity in UK ocean, shelf and coastal waters. Remote sensing methods are by far the most useful ways for determining production on a large scale (Joint and Groom 2000). These techniques quantify the concentration of photosynthetic pigments which can be extrapolated using algorithms to calculate production. The photosynthesis model described in Smyth et al. (2005) was applied to an area incorporating UK territorial waters (shown in figure 3) to calculate primary productivity. Monthly data (Gt C month-1) was summated for each year between 1998 and 2003 to calculate annual productivity. Annual productivity between 1998 and 2003 was compared to find the inter-annual variability in production. For the area in Figure 3, the average annual primary production was 0.07 +/- 0.004 Gt carbon yr-1 (95% CI). Smyth et al. (2005) found global production to be 55 Gt C yr-1 so UK waters are estimated to contribute slightly over 0.1% of this.
Figure 3. A map of the area for which primary productivity was calculated. The latitudinal range was from 49.75N to 61N and the longitudinal range was from 8w to 3E. A number of caveats exist in the remote sensing methods used to examine marine productivity in UK ocean, shelf and coastal waters. The chlorophyll algorithm used to calculate production is not entirely satisfactory close to the coast as there are problems with suspended particulate matter (SPM) and colour dissolved organic matter (CDOM). See Smyth et al. (2005) for further information.
52
References Álvarez, M., Fernández, E., and Pérez, F.F. (1999) Air-sea CO2 fluxes in a coastal embayment affected by upwelling: physical versus biological control. Oceanologica acta 22(5): 499-515. Betts, J.N., and Holland, H.D. (1991) The oxygen content of ocean bottom waters, the burial efficiency of organic carbon and the regulation of atmospheric oxygen. Global and Planetary Change 97: 5-18. Grace, J. (2004) Understanding and managing the global carbon cycle. Journal of Ecology 92: 189-202. Hoppema, J.M.J. (1991) The seasonal behaviour of Carbon dioxide and oxygen in the coastal north sea along the Netherlands. Netherlands Journal of Sea Research 28(3): 167-179. Ingall, E.D., and van Cappellen, P. (1990) Relations between sedimentation rate and the burial of organic phosphorus and organic carbon in marine sediments. Geochimica et Cosmochimica Acta 54(2): 373-386. Joint, I., and Groom, S.B. (2000) Estimation of phytoplankton production from space: current status and future potential of satellite remote sensing. Journal of Experimental biology and Ecology 250: 233-255. Kaltin, S., and Anderson, L.G. (2005) Uptake of atmospheric carbon dioxide in Arctic shelf seas: evaluation of the relative importance of processes that influence pCO2 in water transported over the Bering-Chukchi Sea Shelf. Marine Chemistry 94: 67-79. Kristensen, E., and Blackburn, T.H. (1987) Fate of organic carbon and nitrogen in experimental marine sediment systems: influence of bioturbation and anoxia. Journal of Marine Research 45(1): 231-257 Legendre, L., and Rivkin, R.B. (2002) Fluxes of carbon in the upper ocean: regulation by food-web control nodes. Marine Ecology Progress Series 242: 95-109 Legendre, L., and Rivkin, R.B. (2005) Integrating functional diversity, food web processes, and biogeochemical carbon fluxes into a conceptual approach for modelling the upper ocean in a high-CO2 world. Journal of Geophysical Research 110: C09S17 Legendre, L., and Rassoulzadegan, F. (1996) Food-web mediated export of biogenic carbon in oceans: hydrodynamic control. Marine Ecological Progress Series 145: 179-193 Levinsen, H., and Nielsen, T.G. (2002) The trophic role of marine ciliates and heterotrophic dinoflagellates in artic and temperate coastal ecosystems: A cross-latitude comparison. Limnology and Oceanography 47(2): 427-439
53
Mann, K.H. (1993) Physical oceanography, food chains and fish stocks: a review. ICES Journal of Marine Science 50: 105-109 Smyth, T.J., Tilstone, G.H., and Groom, S.B. (2005) Integration of radiative transfer into satellite models of ocean primary production. Journal of Geophysical Research 110: C10014 Suess, E. (1980) Particulate organic carbon flux in the oceans - surface productivity and oxygen utilization. Nature 288: 260-263. Volk, T., and Hoffert, M.I. (1985) Ocean carbon pumps: Analysis of relative strengths and efficiencies in ocean driven CO2 changes, in The Carbon Cycle and Atmospheric CO2 Natural variations Archean to present, Geophys. Mongr. Ser., 32, Sundquist, and Broecker (Eds.), Washington, D.C. Wassmann, P. (1993) Regulation of vertical Export of Particulate Organic Matter from the Euphotic Zone by Planktonic Heterotrophs in Eutrophicated Aquatic Environments. Marine Pollution Bulletin 26(11): 636-643.
54
Annex 6: Bioremediation of waste Marine benthic diversity is an important component associated with the remediation of domestic, aquacultural and agricultural organic pollution. Benthic community succession is a known phenomenon associated with many types of organic pollution (Pearson and Rosenberg, 1978). After a pollution event the fauna will be dominated by a high number of few ‘enrichment opportunists’ such as Capitella capitata and Scolelepis fuliginosa. These species, under normal conditions are only a small fraction of the background community. As organic matter is processed by these pioneering benthic fauna system recovery occurs as the high organic load is incorporated into biomass and processed (see nutrient cycling). Organic pollution sites are often characterised by stimulated benthic metabolism and elevated cycling of some nutrients (Berelson et al. 2002, Kelly et al. 1985, see also nutrient cycling review). The opportunistic community is replaced by transitory communities which are also succeeded by ‘normal’ communities (Pearson and Rosenberg 1976). Thus a vast range of species are associated with the recovery and succession of marine benthic systems (Rosenberg 2001). Temperate benthic estuarine systems have been shown to recover quickly from sewage pollution when exposure has discontinued (Oviatt et al. 1984) and benthic species are associated with this recovery process. References Berelson, W.M., Johnson, K., Coale, K. and Li, H.C. (2002) Organic matter diagenesis in the sediment of the San Pedro Shelf along a transect affected by sewage effluent. Continental Shelf Research 22: 1101-1115 Kelly, J.R., Berounsky, V.M., Nixon, S.W and Oviatt, C.A. (1985) Benthic-Pelagic coupling and nutrient cycling across an experimental eutrophication gradient. Marine Ecological Progress Series 26: 207-219 Oviatt, C.A., Pilson, M.E., Nixon, S.W., Frithsen, J.B., Rudnick, D.T., Kelly, J.R., Grassle, J.F. and Grassle J.P. (1984) Recovery of a polluted estuarine system: a mesocosm experiment. Marine Ecology Progress Series 16: 203-217 Pearson, T.H., and Rosenberg, R. (1976) A comparative study of the effects on the marine environment of wastes from cellulose industries in Scotland and Sweden. Ambio 5(2): 77-79 Pearson, T.H., and Rosenberg, R. (1978) Macrobenthic succession in relation to organic enrichment and pollution of the marine environment. Oceanography and Marine Biology Annual Review 16: 229-311 Rosenberg, R. (2001) Marine benthic faunal successional stages and related sedimentary activity. Scientific Marina 65(2): 107-119
55
Annex 7: Biologically mediated habitat Maerl Habitat Maerl is the collective term for the calcified product of coralline red algae (Kamenos et al. 2004a). Maerl grounds are patchily distributed around the UK but are predominantly on the west coasts. In England and Wales maerl is rare (Birkett et al. 1998) with the bed in the Fal Estuary (150 ha) considered to be of national importance, and a small area is present on the Pembrokeshire coastline. In Scotland it is more common and is found across the west coast and also by Orkney and Shetland. Maerl grounds are highly diverse habitats, supporting a larger number of species (Jackson et al. 2004) some of which are rare, unusual or poorly known (Birkett et al. 1998). Maerl grounds provide refuge for juvenile life stages of commercially important shellfish species such as the queen scallop, Aequipecten opercularis (Kamenos et al. 2004b). Maerl has also been found to be important for the juvenile gadoid fish: Atlantic Cod (Gadus morhua), Saithe (Pollachius virens) and Pollack (Pollachius pollachius). These species have all been found to use maerl grounds during their juvenile life stages due to the availability of food and refuge from predators (Hall-Spencer et al. 2003, Kamenos et al. 2004c). Seagrass and Kelp Habitats Seagrass is the common name for a large group of higher flowering plant species. Five species of seagrass are found around the British Isles: two species of Tassel weed and three species of eel grass (Zostera spp.) (Davidson and Hughes 1998). Eelgrasses have been found to provide both refuge and nursery habitat for a number of commercial fish species (Murphy et al. 2000) including Atlantic cod, halibut, flounder and plaice (Gotceitas et al. 1997, Thayer et al.1975) and also commercial shell fish (Davidson and Hughes 1998, Stevens and Armstrong 1984). In addition, eelgrasses can be important food sources for wildfowl, such as ducks, brant and geese (Thayer et al.1975). Seagrasses in general are important areas for juvenile fish, including flatfish and shellfish. The existing data and previous records indicate that the UK Zostera beds have made a poor or slow recovery from the impact of wasting disease in the 1920s-30s (Davidson and Hughes, 1998). Sea grass is now considered to be nationally scarce with a patchy distribution, only 20 of Britain’s 155 estuaries have eelgrass meadows more than 1ha in extent, and the known areas of sea grass total only 21.9km2, although there are locations of seagrass which have not been recorded in area format so this estimate is a severe minimum (Davidson and Hughes 1998) Kelp and many other species of marine macrophytes support a diverse range of species, both as a foods source and a living resource (Orth et al. 1984). Invertebrate abundance is particularly high in the holdfast of kelp (Norderhaug et al. 2002), whilst kelp forest provide refuge for fish species such as juvenile Atlantic cod, Gadus morhua, (Cote et al. 2002). Kelp is widely distributed in
56
UK waters, and can be found in most places with suitable water quality and substratum (Birkett et al. 1998).
Mollusc Communities The commercially important mussel species can have distinct effects on biodiversity. Mussel patches are structurally and functionally complex and consequently create habitat for a wide range of associated fauna (Suchanek 1980, Lintas and Seed 1994). Mussel patches also often reduce the harsh effects of temperature, wave action and light, providing more favourable conditions (Seed and Suchanek 1992). Applicable to many molluscan species, both living and dead shells can be used as substratum available for colonisation by other species and/or provide refuge from predation (Gutiérrez et al. 2003). Processes which change the availability of shell resources and other biogenic structures can have consequential effects for many other organisms and secondary production. This may in turn affect commercially important species. Reef Cold water corals, such as Lophelia pertusa, are found in waters of the British coast from north of the Shetlands into the North-East Atlantic. This species and several others can form colonies which aggregate over time into reef structures. Cold water reefs, like their tropical counterparts, have been found to provide habitat for various species of invertebrates (Bett 2001, Gage 2001). Fish in cold water coral reefs have been found to be present in significantly higher densities than the background environment (Bett and Jacobs 2000). Deep sea corals are slow growing and consequently take a long time to recover from damage caused by bottom impacting fishing gears which are particularly destructive. Also improvements in equipment mean that areas which were previously protected through gear limitation are now accessible (Frame and Gillelan 2005).
References
Bett, B.J. (2001) UK Atlantic Margin Environmental Survey: introduction and overview of bathyal benthic ecology. Continental Shelf Research 21:917-956 Bett, B.J. and Jacobs, C.L. (2000) RRS Charles Darwin cruise 119C leg B, 13 August-24September 1999. White Zone (WhiZ) Environment survey: Seabed survey of the deep waters to the north and west of Shetland. Southampton Oceanography Centre Cruise report. Report to the department of Trade and Industry Birkett, D.A., MAggs, C., Dring, M.J. (1998) Maerl (volume V) An overview of dynamics and sensitivity characteristics for conservation management of marine SACs. Scottish Association for Marine Science (UK Marine SACs Project). 116 pages
57
Cote, D. , Ollerhead, L.M.N. Gregory, R.S. Scruton, D.A. and McKinley, R.S. (2002) Activity patterns of juvenile Atlantic cod (Gadus morhua) in Buckley Cove, Newfoundland. Hydrobiologia 483(1-3): 121-127 Davidson, D.M., and Hughes, D.J. (1998) Zostera Biotopes (volume I). An overview of dynamics and sensitivity characteristics for conservation management of marine SACs. Scottish Association for Marine Science (UK Marine SACs Project). 95 pages Gage, J.D. (2001) Deep-sea benthic community and environmental impact assessment at the Atlantic Frontier. Continental Shelf Research 21 (8): 957-986(30) Gutiérrez, J.L., Jones, C.G., Strayer, D.L., Iribarne, O.O. (2003) Molluscs as ecosystem engineers: the role of shell production in aquatic habitats. Oikos 101:79-90. Gotceitas, V., Fraser, S., Brown, J.A. (1997) Use of eelgrass beds (Zostera marina) by juvenile Atlantic cod (Gadus morhua). Canadian Journal of Fisheries and Aquatic Sciences 54: 1306-1319 Hall-Spencer, J.M., Grall, J., Moore, P.G., Atkinson, R.J.A. (2003) Bivalve fishing and maerl-bed conservation in France and the UK--retrospect and prospect. Aquatic Conservation: Marine and Freshwater Ecosystems 13: S33-S41 Kamenos, N.A., Moore, P.G., Hall-Spencer, J.M. (2004a) Attachment of the juvenile queen scallop(Aequipecten opercularis(L.)) to maerl in mesocosm conditions; juvenile habitat selection Journal of Experimental Marine Biology and Ecology 306:139-155 Kamenos, N.A., Moore, P.G., Hall-Spencer, J.M. (2004b) Nursery-area function of maerl grounds for juvenile queen scallops Aequipecten opercularis and other invertebrates …Mar Ecol Prog Ser 274:183-189 Kamenos, N.A., Moore, P., Hall-Spencer, J.M. (2004c) Small-scale distribution of juvenile gadoids in shallow inshore waters; what role does maerl play? ICES J Mar Sci 61:422-429 Jackson, C.M., Kamenos, N.A., Moore, P.G., Young, M. (2004) Meiofaunal bivalves in maerl and other substrata; their diversity and community structure Ophelia 58(1) 49-60 Lintas, C. and Seed, R. (1994) Spatial variation in the fauna associated with Mytilus edulis on a wave-exposed rocky shore, Journal of Molluscan Studies 60: 165-174. Murphy, M.L., Johnson, S.W., Csepp, D.J. (2000) A comparison of fish assemblages in Eelgrass and adjacent subtidal habitats near Craig, Alaska. Alaskan Fishery research Bulletin 7: 11-21
58
Norderhaug, K.M., Christie, H., Rinde, E. (2002) Colonisation of Kelp imitations by epiphyte and holdfast fauna; a study of mobility patterns. Marine Biology 141: 965-973 Orth, R.J., Heck, K.L., van Montfrans J. (1984) Faunal communities in seagrass beds: a review of the influence of plant structure and prey characteristics on predator-prey relationships. Estuaries 7 (4a): 339-350 Seed, R. and Suchanek, T.H. (1992) Population and community ecology of Mytilus. In The Mussel Mytilus: ecology, physiology, genetics and culture (ed. E.M. Gosling), pp 87-168, Amsterdam: Elsevier Press. Stevens, B.G. and Armstrong, D.A. (1984) Distribution, Abundance, and Growth of Juvenile Dungeness Crabs, Cancer magister, in Grays Harbor Estuary, Washington. Fishery Bulletin 82 (3): 469-483 Suchanek, T.H. (1980) Diversity in natural and artificial mussel bed communities of Mytilus Californianus. American Zoologist 20: 807 Thayer, G.W., Wolfe, D.A. Williams, R.B. (1975) The impact of Man on Seagrass. American Scientist 63: 288-296
59
Annex 8: Disturbance prevention Many types of flora can contribute to the reduction in wave energy in coastal zones. Seagrasses (Fonseca and Cahalan 1992) and halophytic reeds (Coops et al. 1996) play only a minor role in the UK due to their small spatial scale. In the UK the major contribution to disturbance prevention is from saltmarshes (Paramor and Hughes 2004). Saltmarshes are a very cost effective way of attenuating average energy and there by substantially reducing the cost of flood deference measures (Morris et al. 2004). Saltmarshes are areas of vegetation that colonize intertidal sediments and are inundated by the tide at least once every lunar month (Hughes and Paramor 2004). The fauna and flora are often highly diverse communities (Cooper 2005) that contain nationally rare species (Doody 2001). The most recent saltmarsh surveys of the UK estimate the total extent of saltmarsh (including transitional communities) to be approximately 45,500 ha. This resource is concentrated in the major estuaries of low-lying land in eastern England (http://www.ukbap.org.uk/UKPlans.aspx?ID=33#1) Much research into saltmarshes has been conducted in the south-east of England where these are a prevalent coastal landscape feature. In this region much of the land is low lying and is currently protected from flooding by seawalls (Dixon and Weight 1996) but the seawalls themselves are protected by saltmarshes. Saltmarshes attenuate and dissipate wave and tidal energy which has been shown in a number of UK studies (Brampton 1992, Möller 1996, 1999). Recent studies found saltmarshes to reduce waver energy by 82.5% (Möller 1999) and another by 79%, 96% and 99% at three separate sites in The Wash, Norfolk (Cooper 2005). The reduction in wave energy associated with saltmarshes diminishes the potential for erosion. Coupled with this, salt marshes act like giant sponges absorbing vast amounts of water when inundated and then slowly releasing it afterwards, preventing flooding. Brouwer et al. (1997) document a meta-analysis of contingent valuation studies on wetlands from around the world. This meta-analysis finds the largest mean willingness to pay by wetland function to be for flood control. This estimates the value of wetlands, in their function as storm and flood protection, to be £105.09 per household per year. UK specific studies include that undertaken by King and Lester (1995) who calculated that the loss of saltmarshes from Essex would cost 600 million for the increased maintenance of the seawalls. References Brampton, A.H. (1992) Engineering significance of British saltmarshes. In: Allen, J.R.L. and Pye, K. (eds.) Saltmarshes: morphodynamics, conservation and engineering significance. Cambridge University Press, pp 115-122.
60
Brouwer, R., Langford, I.H., Bateman, I.J., Turner, R.K. (1997) A meta-analysis of wetland contingent valuation studies. Regional Environmental Change 1999 (1): 47-57 Cooper, N.J. (2005) Wave Dissipation Across Intertidal Surfaces in the Wash Tidal Inlet, Eastern England. Journal of Coastal Research 21(1): 28-40 Coops, H., Geilen, N., Verheij, H.J., Boeter, R., and van der Velde, G. (1996) Interactions between wave, bank erosion and emergent vegetation: an experimental study in wave tanks. Aquatic Botany 53: 187-198 Dixon, A.M. and Weight, R.S. (1996) Managing coastal realignment: case study at Orplands Sea Wall, Blackwater Estuary, Essex. In: Halcrow, W. and Partners Ltd (eds.) Saltmarsh Management for flood defence, pp1-22 Doody, J.P. (2001) Coastal Conservation and Management: An Ecological perspective. Kluwer Academic Publishers, Dordrecht, the Netherlands. Fonseca, M.S. and Cahalan, J.A. (1992) A preliminary evaluation of wave attenuation by four species of seagrass. Estuarine, Coastal and Shelf Science 35: 565-576 Hughes, R.G., and Paramor, O.A.L. (2004) On the loss of saltmarshes in south-east England and methods for their restoration. Journal of Applied Science 41: 440-448 King, S.E. and Lester, J.N. (1995) The value of saltmarsh as a sea defence. Marine Pollution Bulletin 30: 180-189 Möller, I., Spencer, T., and French, J.R. (1996) Wind wave attenuation over saltmarsh surfaces: preliminary results from Norfolk, England. Journal of Coastal Research 12: 1009-1016 Möller, I., Spencer, T., French, J.R., Leggett, D.J. and Dixon, M. (1999) Wave Transformation Over Salt Marshes: A Field and Numerical Modelling Study from North Norfolk, England. Estuarine, Coastal and Shelf Science 49: 411-426 Morris, R.K.A., Reach, I.S., Duffy, M.J., Collins, T.S. and Leafe, R.N. (2004) On the loss of saltmarshes in south-east England and the relationship with Nereis diversicolor. Journal of Applied Science 41: 787-791 Paramor, O.A.L., and Hughes, R.G. (2004) The effects of bioturbation and herbivory by the polychaete Nereis diversicolor on the loss of saltmarsh in south-east England. Journal of Applied Science 41: 449-463
61
Annex 9: Case Study 1: The impact of trawl fishing on benthic biodiversity Mobile bottom-fishing gear (used to catch species that live within, on or in close contact with the seabed such as scallops, shrimp and flatfishes) causes varying levels of disturbance that alters seabed complexity, removes, damages or kills biota, and reduces benthic production, and thereby can lead to substantial changes in benthic community structure and habitat. As nets and dredges pass over the seabed, they unavoidably damage in situ and remove a large biomass of the resident biota. Sea-bed disturbance by fishing gear will, in the short term, directly affect seabed chemistry and nutrient cycling. The EU project COST-IMPACT was concerned with the longer lasting effects on benthic biodiversity and whether and how these effects permeate through to the whole marine ecosystem affecting marine goods and services (COST-IMPACT final report). Within COST-IMPACT publicly available data on the impact of fishing on marine benthos was collated into a unified meta-database. Meta-analysis was then applied to these data to predict the outcome of using different fishing techniques in different habitats, in terms of the relative initial impact upon the fauna and the time taken for recovery to be achieved after the alleviation of fishing disturbance. COST-IMPACT then used a synthesis of the European Regional Seas Ecosystem Model (ERSEM) (Baretta et al., 1995) as modified by Blackford et al. (2004) and the General Ocean Turbulence Model (GOTM) (Burchard et al., 1999) to investigate changes in benthic community structure caused by demersal trawl fishing and how these changes further affect benthic nutrient recycling and pelagic production. A number of perturbation experiments simulated trawling events with different types of fishing gears in different sea-bed habitats and the effects of different intensities of fishing. These simulations used estimations of the mortality of benthic fauna derived from the meta-analysis and model outputs provided predictions about changes in the whole marine ecosystem. The predictions derived from the meta-analysis and ecological models have been used as the baseline data for the effects of fishing on the economic value of the marine ecosystem goods and services. The simulated scenarios extracted for this case study are the effects of 5 years of fishing on a sandy seabed with two different types of fishing gear (otter and beam trawls) and two different intensities of fishing (low – twice per year, and high – 5 times per year). The simulations were of generic stratified and unstratified water columns in the central North Sea which are typical of the North West European shelf. The ecosystem modelling suggested that the biogeochemical impact of demersal trawling is most significant in regions where the gear type, trawl frequency and sea-bed type cause high levels of filter feeder mortality. This results in a substantial increase in the oxygen content of the benthic system
62
and significant changes in the biogeochemistry of the system. However the impacts of these changes on the overlying pelagic ecosystem are buffered by the physical environment and the ability of phytoplankton to vary their internal cell nutrient contents. Yet there may be more subtle implications on pelagic community structure including a shift towards the microbial loop and a potential increase in the probability of harmful algal bloom events. For indicators of biodiversity change we have used total macrofauna change (=suspension feeders + deposit feeders). The meta-analysis indicates that the model results for macrofauna abundances are broadly accurate. Similar data is not available for meiofauna which has been excluded from the indicator of biodiversity due to uncertainty about the response in the model. However it should be noted that there is probably a relationship between meiofauna, macrofauna and fishing. For gas and climate change we have used use net primary production For nutrient flux we have used use the first principal component (PC1) from a principle components analysis (PCA) of three nutrient variables (explains 89% of variability; the second principal component (PC2) explains 10% and better reflects the intensity of fishing effects but fishing gear habitat combinations have a greater effect than intensity in the PCA therefore PC1 is probably a better measure.) References Baretta, J.W., Ebenhöh, W., Ruardij, P. (1995) The European Regional Seas Ecosystem Model, a complex marine ecosystem model. Neth J Sea Res 33: 233-246 Blackford, J.C., Allen, J.I., Gilbert, F. (2004) Ecosystem dynamics at six contrasting sites: a generic modelling study. J Mar Sys 52: 191-215 Burchard, H., Bolding, K., Villareal, M. (1999) GOTM–a general ocean turbulence model. Theory, applications and test cases. Technical Report EUR 18745 EN, European Commission.
63
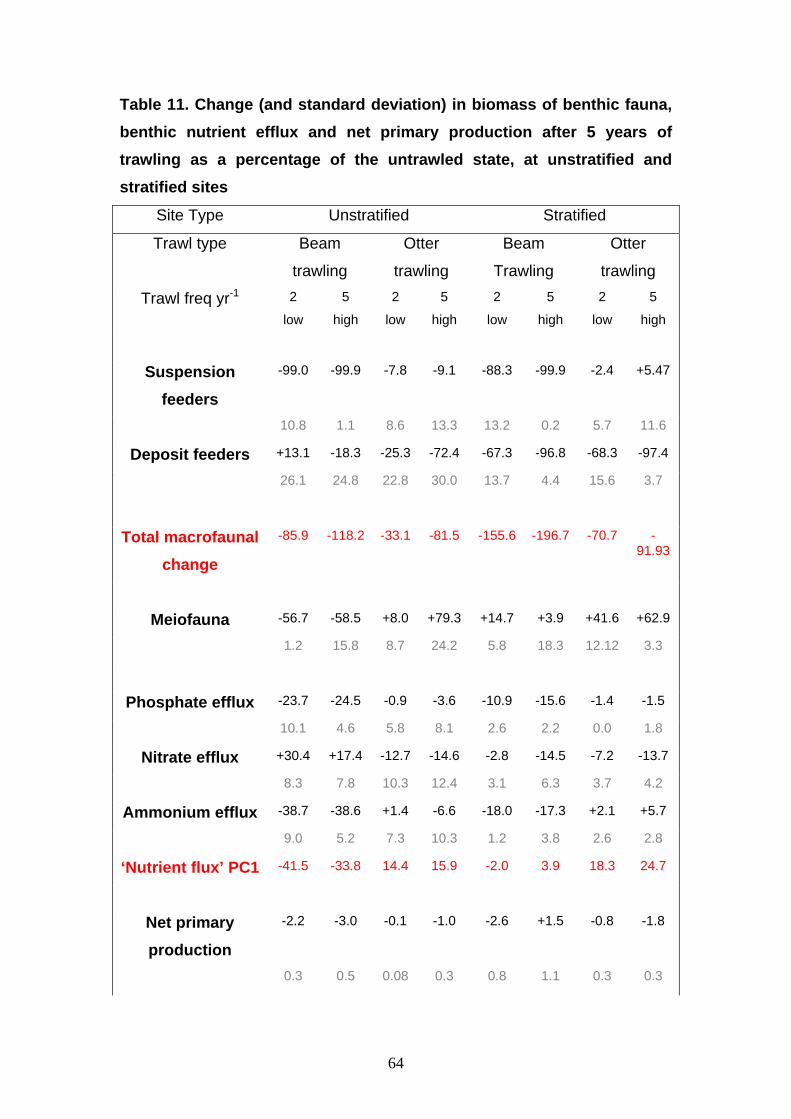
Table 11. Change (and standard deviation) in biomass of benthic fauna, benthic nutrient efflux and net primary production after 5 years of trawling as a percentage of the untrawled state, at unstratified and stratified sites
Site Type Unstratified Stratified
Trawl type Beam
trawling
Otter
trawling
Beam
Trawling
Otter
trawling
Trawl freq yr-1 2
low
5
high
2
low
5
high
2
low
5
high
2
low
5
high
Suspension feeders
-99.0 -99.9 -7.8 -9.1 -88.3 -99.9 -2.4 +5.47
10.8 1.1 8.6 13.3 13.2 0.2 5.7 11.6
Deposit feeders +13.1 -18.3 -25.3 -72.4 -67.3 -96.8 -68.3 -97.4
26.1 24.8 22.8 30.0 13.7 4.4 15.6 3.7
Total macrofaunal change
-85.9 -118.2 -33.1 -81.5 -155.6 -196.7 -70.7 -91.93
Meiofauna -56.7 -58.5 +8.0 +79.3 +14.7 +3.9 +41.6 +62.9
1.2 15.8 8.7 24.2 5.8 18.3 12.12 3.3
Phosphate efflux -23.7 -24.5 -0.9 -3.6 -10.9 -15.6 -1.4 -1.5
10.1 4.6 5.8 8.1 2.6 2.2 0.0 1.8
Nitrate efflux +30.4 +17.4 -12.7 -14.6 -2.8 -14.5 -7.2 -13.7
8.3 7.8 10.3 12.4 3.1 6.3 3.7 4.2
Ammonium efflux -38.7 -38.6 +1.4 -6.6 -18.0 -17.3 +2.1 +5.7
9.0 5.2 7.3 10.3 1.2 3.8 2.6 2.8
‘Nutrient flux’ PC1 -41.5 -33.8 14.4 15.9 -2.0 3.9 18.3 24.7
Net primary production
-2.2 -3.0 -0.1 -1.0 -2.6 +1.5 -0.8 -1.8
0.3 0.5 0.08 0.3 0.8 1.1 0.3 0.3
64